the Creative Commons Attribution 4.0 License.
the Creative Commons Attribution 4.0 License.
 | 18 Dec 2020
Brief communication: Heterogenous thinning and subglacial lake activity on Thwaites Glacier, West Antarctica
Andrew O. Hoffman
Knut Christianson
Daniel Shapero
Benjamin E. Smith
Ian Joughin
A system of subglacial lakes drained on Thwaites Glacier from 2012–2014. To improve coverage for subsequent drainage events, we extended the elevation and ice-velocity time series on Thwaites Glacier through austral winter 2019. These new observations document a second drainage cycle in 2017/18 and identified two new lake systems located in the western tributaries of Thwaites and Haynes glaciers. In situ and satellite velocity observations show temporary < 3 % speed fluctuations associated with lake drainages. In agreement with previous studies, these observations suggest that active subglacial hydrology has little influence on thinning and retreat of Thwaites Glacier on decadal to centennial timescales.
- Article
(2637 KB) - Full-text XML
-
Supplement
(8255 KB) - BibTeX
- EndNote


Although subglacial lakes beneath the Antarctic Ice Sheet were first discovered more than 50 years ago (Robin et al., 1969; Oswald and Robin, 1973), they remain one of the most enigmatic components of the subglacial hydrology system. Initially identified in ice-penetrating radar data as flat, bright specular reflectors (Oswald and Robin, 1973; Carter et al., 2007), subglacial lakes were thought to be relatively steady-state features of the basal hydrology system with little impact on the dynamics of the overlying ice on multi-year timescales. The advent of high-precision repeat satellite observations in the 1990s, however, revealed an entirely new class of active subglacial lakes that fill and drain on annual to decadal timescales and possibly affect the flow of the overlying ice (e.g., Gray et al., 2005; Wingham et al., 2006; Fricker et al., 2007; Smith et al., 2009). Under the central trunk of Thwaites Glacier, in particular, satellite radar altimetry revealed a large (∼ 4 km3 volume discharge), connected subglacial lake drainage event from 2012–2014 (Smith et al., 2017). Initial subglacial lake recharge estimates suggested lake drainages of this magnitude should occur every 20–80 years. To better constrain refill and discharge time, we extended the Thwaites Glacier velocity and altimetry record to include the most recent drainage events. We also expanded the spatial coverage to include Haynes Glacier and the western tributary of Thwaites Glacier (Fig. 1). Here we describe the recent subglacial lake behavior in these regions and discuss the impact of these subglacial lake systems on slip velocity at the ice–bed interface.
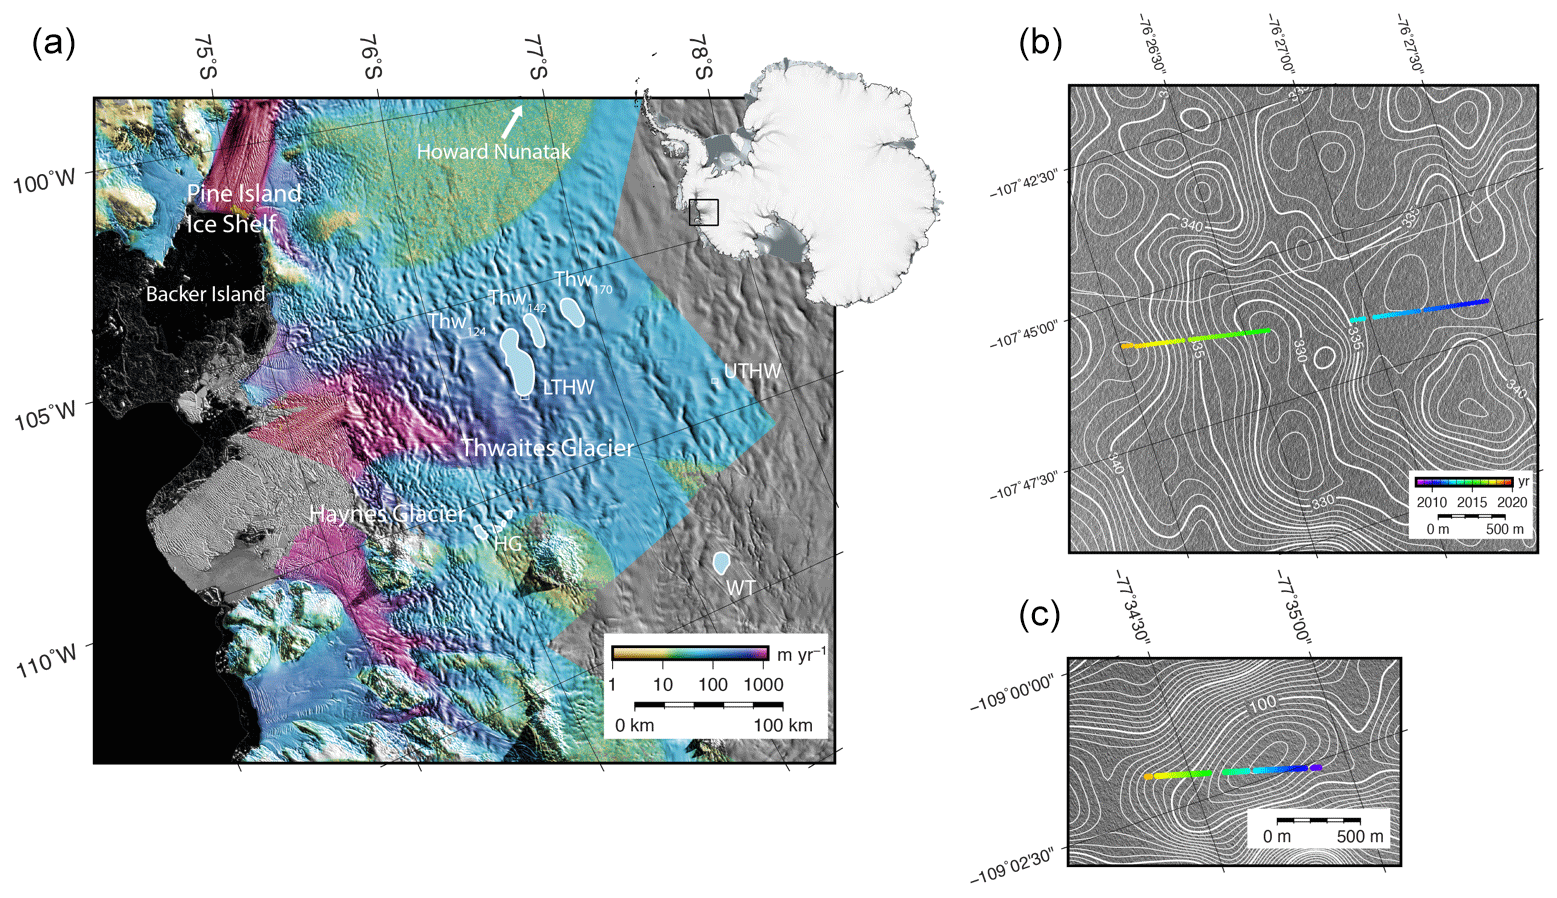
Figure 1Location map of Thwaites Glacier and subglacial Thwaites lakes. (a) Average ice speed between 2015–2019 omitting period when lakes were active (color) plotted over Moderate Resolution Imaging Spectroradiometer (MODIS) image mosaic (Haran et al., 2014). Thwaites Glacier, Thwaites Lake 124 (Thw124), Thwaites Lake 142 (Thw142), Thwaites Lake 170 (Thw170), Haynes Glacier (HG) lake, western Thwaites (WT) lake and GNSS sites (LTHW and UTHW) are labeled. Thwaites lakes are named by their approximate distance from the grounding line. (b) LTHW and (c) UTHW GNSS position plotted over time (color) with contoured mean velocity between 2015–2019.
We used in situ Global Navigation Satellite System (GNSS), satellite synthetic aperture radar (SAR) and satellite radar altimetry data to derive velocity and elevation-change time series.
2.1 Ice velocity and vertical displacement
We used the speed anomalies recorded by two long-term on-ice GNSS receivers, LTHW and UTHW, deployed on Thwaites Glacier from 2009 to present to augment Eulerian velocity products derived from Sentinel-1A and Sentinel-1B synthetic aperture radar (SAR) imagery of the Thwaites Glacier catchment collected between 2015–2019 (Fig. 1). Processing of GNSS data follows the workflow of Christianson et al. (2016). We first created a position time series with sub-5 cm uncertainties in all dimensions by calculating geodetic positions every 30 s relative to two fixed rock sites located 200 km (Backer Island) and 300 km (Howard Nunatak) away from the LTHW site, using differential carrier phase positioning as implemented in the Track Software (Chen, 1998). We then constructed velocity time series from these geodetic solutions using 3 d Savitzky–Golay filtered moving averages (Press et al., 2007). Finally, we subtracted the SAR-derived Eulerian speed at each GNSS position to solve for the Lagrangian velocity anomaly relative to the mean 2015–2019 velocity, omitting periods of lake activity (reference velocity field in Fig. 1).
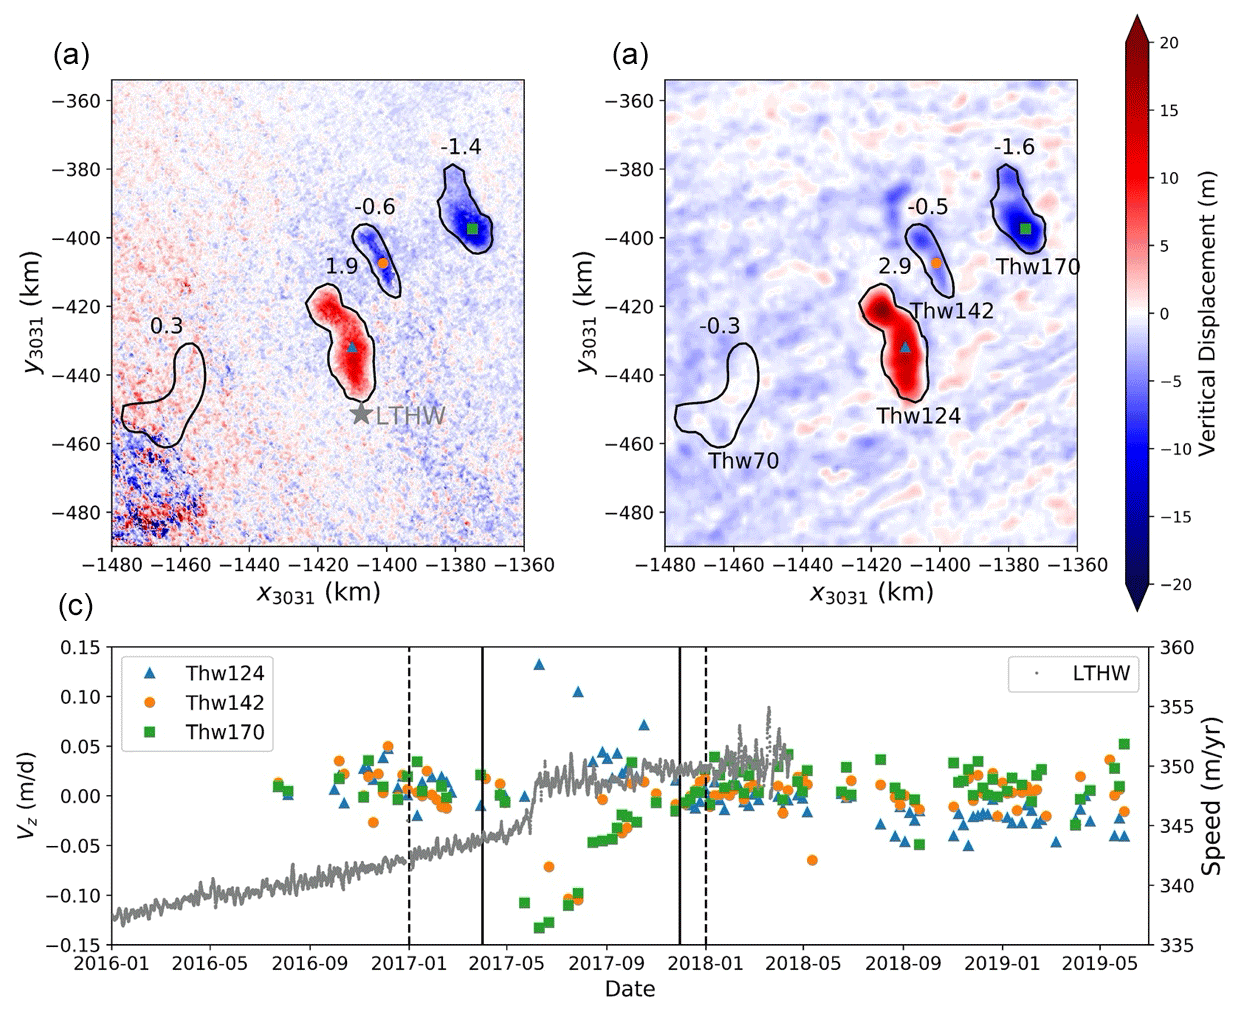
Figure 2Surface elevation-change time series over the Thwaites Glacier lakes showing the 2017 drainage cascade from (a) vertical displacement computed from integrated vertical displacement rates (Vz) from Sentinel-1 SAR data and (b) swath-processed radar altimetry in a polar stereographic projection (EPSG:3031). Water volume (km3) associated with observed vertical displacement is labeled for each lake. (c) Time series of uplift rates (Vz) from SAR LOS results (colored dots, left abscissa); locations marked in (a) and (b) and horizontal speed from GNSS observations (right abscissa). Solid lines represent period over which SAR vertical displacements (Vz) were integrated to produce the vertical displacements shown in (a). Dotted lines represent the quarters of gridded CryoSat-2 data differenced to create (b).
Following the methods of Joughin (2018, updated 2019) and Joughin et al. (2010), we constructed a speckle-tracked velocity time series of Thwaites Glacier from 2015 through the austral winter of 2019 using SAR data collected by the European Union's Copernicus Sentinel-1A and Sentinel-1B satellites and processed by the European Space Agency (ESA). We also computed the component of motion in the satellite line-of-sight (LOS) direction (Gray et al., 2005; Friedl et al., 2020). The bulk of this signal is due to relatively steady horizontal displacements, but it is also influenced by potentially more temporally variable vertical displacements. Thus, we computed the mean LOS component for the full time series and subtracted it from each individual estimate. Since the horizontal and surface-parallel flow components are relatively steady, the residual line-of-sight estimate should largely be due to vertical motion, which we corrected for incidence angle effects to produce an approximate vertical displacement rate (Vz). Because we only subtracted the mean, a small component of the horizontal velocity may map into the vertical velocity due to the glacier's acceleration; however, this contribution is generally in the noise during periods with no lake activity and small relative to the vertical signal during times of active lake change (Fig. 2). To more tightly constrain the timing of the drainage events, we spatially interpolated the time series of Sentinel-1-derived Vz to fill gaps in coverage and integrated the result during a period of filling/draining (see solid vertical bars in Fig. 2c) to produce estimates of net uplift and subsidence shown in Fig. 2a.
2.2 Elevation and lake volume change
We also extended the previous time series of ESA CryoSat-2 radar altimetry data (Smith et al., 2017) through austral winter 2019, as shown in Figs. 2b and 3. Elevation models were derived by fitting surfaces of elevation change to CryoSat-2 swath-processed elevation retrievals and points-of-closest-approach relative to a reference elevation model from the first quarter of 2011 (Smith et al., 2017). The fitting procedure minimized an objective functional that considered data misfit, spatial gradients in the constructed reference elevation model, elevation-change rate fields, temporal gradients in elevation-change rate and the magnitude of model bias parameters. In this scheme, three expected elevation statistics are used to choose weight parameters that regularize the least-squares fit. The elevation statistics, , and , represent expected values for spatial and temporal derivatives of the reference elevation model, z0 and the time-dependent height-change field, z. The values chosen for this study are , and and tighten the spatial variations in the least-squares elevation time series, and , compared to the original Smith et al. (2017) implementation by factors of 5 and 10, respectively. These radar altimetry measurements complement SAR observations of integrated vertical displacement, which we use together to understand the character of new lake drainage activity.
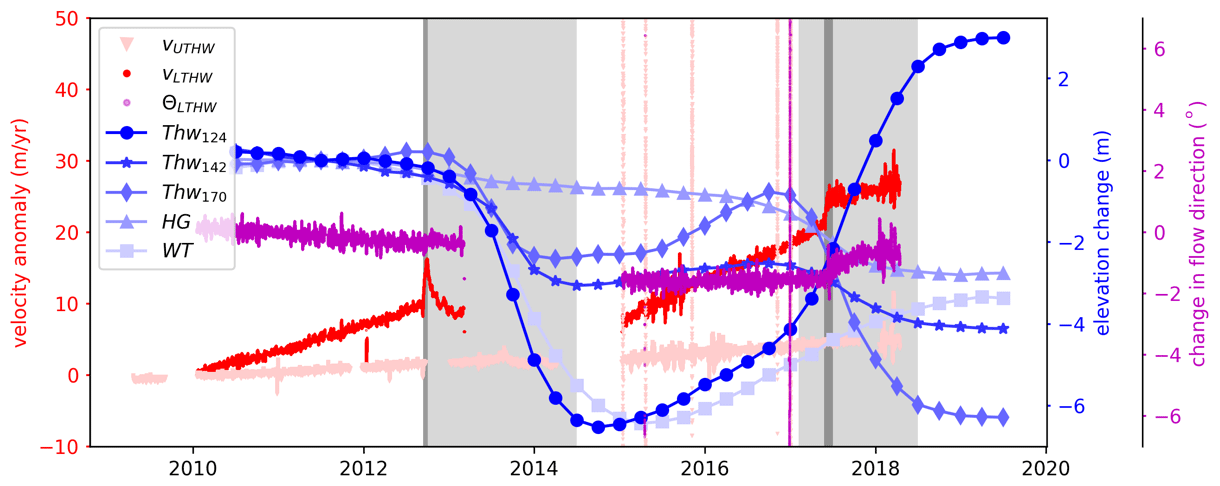
Figure 3Time series of GNSS velocity anomalies at UTHW and LTHW corrected for advection using the Eulerian velocity products and CryoSat-2 lake elevation change averaged over each lake area. See Fig. 1 for site locations and abbreviations. Also plotted are LTHW GNSS clockwise direction change relative to 2010 flow direction (purple). The dark grey shaded periods indicate intervals when the LTHW GNSS accelerated significantly (99 % confidence), while the light grey periods indicate when the Thw lakes are active. When the largest lake fills in 2017, the LTHW GNSS closest to the lake accelerates and flows towards the lake.
A complete chronology of progressive thinning and lake activity across Thwaites Glacier from the extended CryoSat-2 time series is shown in the video in the Supplement (Movie SV1). These new observations reveal that the upper Thwaites Lakes, Thw170 and Thw142, drained in 2017, filling Thw124 (Figs. 1 and 2). The SAR-derived elevation-change data show that the largest lake, Thw124, filled by 1.9 km3 during the 2017 drainage, roughly balancing the volume that drained from Thw142 (0.6 km3) and Thw170 (1.4 km3). The quarterly CryoSat-2 results show less clear evidence of water budget balance (Figs. 2 and S2), which may be due to the degree of smoothing used in producing the time series. From CryoSat-2 elevation-change data, between 2015 and before the 2017 drainage event, the areas inside the Thw124, Thw142 and Thw170 lake outlines increase in elevation, which is strong evidence of filling (Figs. 3 and S2).
The extended elevation time series (Figs. 3 and S2) also reveals the fill-drain cycle of two new lake systems: one in the western shear margin of Haynes Glacier and another in the western tributary of Thwaites Glacier (Fig. 1). From these combined observations, the western Thwaites tributary lake (WT) drained by 1.1 km3 in 2013 and the Haynes Glacier lake system (HG) drained by 0.2 km3 in 2017 (Figs. S1 and S2 in the Supplement). Complete fill-drain cycles of the Haynes Glacier lakes and the western Thwaites Glacier lake are not observed in the existing altimetry record, and the Haynes Glacier lakes do not discernibly refill after draining in 2017 (Fig. S2). The western Thwaites tributary lake, however, fills significantly at a rate of 0.1 km3 yr−1 after draining in 2014.
Cascading lake drainages have been observed under many Antarctic ice–stream systems (e.g., Wingham et al., 2006; Fricker et al., 2007). The positions of all identified lakes beneath Thwaites Glacier, including the new lakes in the Haynes Glacier shear margin and western tributary of Thwaites Glacier, appear to be controlled primarily by the bed and associated surface geometry (Smith et al., 2017). There are large topographic ridges at the bed with corresponding expressions at the surface that are oriented orthogonal to flow and likely act as hydraulic baffles trapping water and sediments (Holschuh et al., 2020), causing hundred-kilopascal-scale deviations in basal traction (Joughin et al., 2014; Fig. S5a in the Supplement). The weak basal shear stress in these till-draped basins combines with large-scale catchment topography to promote variations in ice thickness and surface slope that form large hydropotential lows (Fig. S4 in the Supplement; Smith et al., 2017; Holschuh et al., 2020). In these hydropotential lows, the lakes remain disconnected from their neighbors as they fill until cascading drainages driven by the upstream lakes interrupt the background fill rate in the cycle. Densely sampled SAR vertical displacement rates from 2017 (Vz in Fig. 2c) demonstrate this process, capturing the Thw170 drainage that initiated a combined drainage with Thw142 into Thw124 (Fig. 2).
The controls on lake filling are less clear. From the altimetry observations of the Thw170 fill cycle, the average fill rate is ∼ 0.16 km3 yr−1 (Fig. S4). This agrees with the fill rate (∼ 0.14 km3 yr−1) we calculate by routing modeled basal meltwater production (Joughin et al., 2009) down the glaciostatic hydropotential gradient (Shreve, 1972) into Thw170 but requires inflow of all melt water produced upstream into the Thw170 lake basin (Fig. S4). The glaciostatic hydropotential also routes water around Thw170 into downstream lakes Thw142 and Thw124, but the fill rates associated with these flow paths (∼ 0.44 and ∼ 0.27 km3 yr−1, respectively) are much larger than the fill rates derived from surface height change (Fig. S4). These discrepant observations may reflect limitations of the static hydropotential assumption and the modeled catchment meltwater budget, but they also suggest current bed-elevation models do not resolve small-scale (< 1 km) bed topography important for routing subglacial water into the upper most lake, Thw170.
4.1 Lake impact on ice flow and coupled drainage morphology
The inland SAR and GNSS observations show a general pattern of acceleration at the LTHW and UTHW sites, consistent with an increase in driving stress due to inland propagation of thinning caused by ungrounding and loss of ice-shelf buttressing (Rignot et al., 2014; Joughin et al., 2014). Figure 3 shows the velocity anomaly at LTHW after subtracting the 2010 glacier velocity (340 m yr−1). At LTHW, this secular trend is punctuated by two signals associated with the Thwaites Lakes drainage events, first in September 2012 and again in May 2017 (Fig. 3). During the 2012 drainage documented by Smith et al. (2017), surface velocities initially spike by 2 % over a several-day period but then decline by 3 % over the following 6 months. Loss of receiver power interrupted this record in March 2013. When the receiver began telemetering data again in 2015, the relative change in position suggests the speed anomaly in 2014 remained below what would be expected from the 2010–2012 trend. From January 2016 to May 2017, the LTHW receiver continued to accelerate at a rate of 4 m yr−2. As Thw142 and Thw170 drained in the austral winter 2017, filling Thw124, there was a nearly stepwise 1 % increase in glacier speed at LTHW (Fig. 3). Speed remained elevated at the LTHW site after Thw124 stopped filling, coinciding with a 2∘ shift in ice-flow direction to the grid-north (clockwise), toward Thw124 (Fig. 3); however, this speed change is imperceptible in distributed velocity maps before and after Thw124 filled in 2017 (Fig. S3 in the Supplement). The UTHW site also exhibits subtle velocity fluctuations with a magnitude less than 1 % of the mean velocity (105 m yr−1) after correcting for the spatial ice-velocity gradient. These fluctuations are small relative to the background acceleration we observe at the UTHW site, 0.75 m yr−2.
The transient velocity anomalies that depart from the trend observed at LTHW are likely related to subglacial lake dynamics. During lake filling in 2017, the areal extent of the Thw124 lake increases. This increase should reduce traction at the lake boundary, both at the margins (near the LTHW site) of the lake and inside the lake as unresolved topographic pinning points are submerged. In 2017, changes in basal traction occur almost immediately, causing a step increase in velocity (Fig. 3). As the lakes drain, traction is restored as ice regrounds, reducing basal slip, which we observe in the months following the 2012 lake drainage near Thw124.
The positive GNSS acceleration observed in September 2012 (Fig. 3) suggests that Thw124 began to drain in 2012 before the quarterly resolved subsidence associated with the lake drainage becomes distinguishable in the CryoSat-2 surface elevation time series (Fig. 3). The cause of the acceleration we observe at Thw124 before the bulk drainage cannot be unambiguously attributed to a discrete set of processes with these data, but the finite duration of the velocity increase (∼ 10 d) suggests that a distributed drainage system may have been established at the downstream edge of the lake preceding bulk drainage. Glaciostatic hydraulic water routing indicates that Thw124 would likely drain at the grid-south edge of the lake near the LTHW GNSS receiver (Fig. S3). Enhanced lubrication outside the low-drag Thw124 basin as the lake begins to drain likely increases local slip and drives the subtle change in ice-flow direction that we observe in the austral winter of 2012 before the peak drainage in 2013, when flow direction shifts back to the mean flow direction between 2010–2012. Non-steady effective pressure likely also affects the basal shear stress as the drainage system initially forms, then empties and closes. Similar to lake drainages under the Siple Coast ice streams (Siegfried et al., 2014, 2016), changes in basal slip speed due to lake activity are small (∼ 1 %–2 %) relative to the average sliding speed.
Regardless of the exact drainage mechanism, the locations of the lakes are governed by ice-flow response to the underlying bed topography, which promotes hydropotential basins that form as ice flows over ridges. Once a connected drainage begins, differences in water pressure in the conduits between lakes promote efficient drainage down the hydraulic gradient. During drainage, each lake is likely in local equilibrium with the ends of the conduits that directly connect to it; however, the large hydropotential differences between lakes (∼ 1 MPa) cannot equilibrate along the entire length of the drainage path, which implies that the pressure difference over the length of the conduit is likely more important in determining whether water flows into or out of the lakes than the small variations in the hydraulic potential in the lakes as they fill and drain. Conversely, drainage of upstream lakes may disrupt the steady-state drainage morphology by temporarily increasing the hydraulic conductivity of the conduits, bringing additional water into the lower lakes and allowing drainage from adjacent lakes that share the same downstream conduit. The processes governing changes in subglacial hydraulic connectivity are poorly understood but likely depend on the local dynamic hydropotential and the evolution of conduit morphology, which we do not try to infer from our observations of the fill-drain cycle. We only note that these processes likely contribute to the variability in lake fill-drain levels observed elsewhere over multiple fill-drain cycles (Fig. S2.; Siegfried et al., 2014, 2016), which cannot be explained by the evolving glaciostatic hydropotential alone.
4.2 Implications for basin-wide change
The velocity changes in Fig. 3 that we attribute to lake drainage events represent the dominant, albeit small (≲ 3 %), inland sub-annual velocity variability. The lakes sequester water and thus likely play some not well-understood role in maintaining distributed low effective pressures that control long-term flow rates, but the fill-drain cycles have little transient effect on the flow behavior of the overlying ice. On decadal timescales important for understanding ice-sheet behavior and contribution to sea level, the lakes do not appear to control inland ice-flow variation. Static inversions for bed resistance before and after the 2017 lake drainage event (see Sect. 4 in the Supplement for details) are not sensitive to the subtle surface velocity changes we measure with GNSS (Fig. S5), and the lakes identified by Smith et al. (2017) have no discernible effect on ice velocity at the UTHW site. These new observations suggest that the observed speedup at the grounding zone of the main trunk of Thwaites Glacier following the 2013 drainage (Smith et al., 2017) was associated with warming ocean conditions following anomalous Amundsen Sea wide ocean cooling from 2012/13 (Christianson et al., 2016). These warm ocean conditions likely enhanced sub-ice-shelf melt and led to increased ungrounding and acceleration. Our observations and model experiment (Sect. 4 in the Supplement; Shapero et al., 2020) invalidate proposed geoengineering solutions that seek to drain large volumes of water from beneath Amundsen Sea Embayment glaciers to increase basal resistance (Moore et al., 2018). These results further demonstrate that capturing the details of lake fill-drain cycles, and at least some elements of the associated basal hydrology system, may not be that important for modeling Thwaites Glacier's contribution to sea level on decadal to centennial timescales.
We document the temporal change in velocity and elevation far from the grounding zone in response to the steepening of Thwaites Glacier and three distinct systems of active lakes: one on the main Thwaites Glacier trunk, another in the western shear margin of Haynes Glacier and a third in the westernmost tributary of Thwaites Glacier. At the LTHW GNSS site, over 100 km from the grounding line, ice velocity has accelerated at a nearly constant rate over the last decade. This background acceleration was interrupted in 2012 by the connected drainage of lakes Thw124, Thw142 and Thw170 and, in 2017, by the partial filling of Thw124 via drainage of Thw142 and Thw170. Our observations suggest that the transport of ∼ 2 km3 of water beneath Thwaites Glacier, which represents approximately half the annual basal meltwater production for the entire Thwaites catchment (Joughin et al., 2009), has only a small and transient effect on glacier speed relative to ongoing thinning driven by ocean melt.
GNSS data are publicly available from UNAVCO, NASA CDDIS and SOPAC repositories (https://doi.org/10.7283/T5NK3C7D, Wilson et al., 2009a, https://doi.org/10.7283/T50P0XBC, Wilson et al., 2009b). The altimetry and velocity data used in the study will be available on the UW ResearchWorks digital repository (https://digital.lib.washington.edu/researchworks/, last access: 12 June 2020). In the meantime, the data can be made available upon request from the corresponding author (hoffmaao@uw.edu).
Supporting videos of surface elevation change (SM1) and water routing (SM2) are available at https://doi.org/10.5446/44023 and https://doi.org/10.5446/44035.
The supplement related to this article is available online at: https://doi.org/10.5194/tc-14-4603-2020-supplement.
AOH processed the GNSS data, ran the model experiments, wrote the paper and designed the study with KC. IJ processed the velocity data. BES processed the CryoSat-2 elevation data, and DS developed the model used in the study. All authors contributed to editing the manuscript.
The authors declare that they have no conflict of interest.
The authors are thankful to the two anonymous reviewers for helpful comments that greatly improved the quality of this paper. We also thank the POLENET team for maintaining the GPS sites and the New York Air National Guard, Kenn Borek Air and the US 45 Antarctic Support Contract for logistical support.
This research has been supported by the Thwaites Ground Geophysics (grant no. OPP1738934), the NASA Cryospheric Sciences Thwaites Altimetry award (grant nos. NNX16AM01G and NNX17AG54G), the NASA sea-level change team grant (grant no. 80NSSC17K0698) and the NSF-NERC International Thwaites Glacier Collaboration (grant no. OPP-1738934).
This paper was edited by Etienne Berthier and reviewed by two anonymous referees.
Carter, S., Blankenship, D., Peters, M., Young, D., Holt, J., and Morse, D.: Radar-based subglacial lake classification in Antarctica, Geochem. Geophy. Geosy., 8, 3, https://doi.org/10.1029/2006GC001408, 2007.
Chen, G.: GPS kinematics positioning for airborne laser altimetry at Long Valley, PhD thesis, Mass. Inst. of Technol., Cambridge, 1998.
Christianson, K., Bushuk, M., Dutrieux, P., Dutrieux, P., Parizek, B. R., Joughin, I. R., Alley, R. B., Shean, D. E., Polv, Abrahamsen, E., Anadakrishnan, S., Heywood, K. J., Tae-Wan, K., Hoon, Lee, S., Nicholls, K., Stanton, T., Truffer, M., Webber, B. G. M., Jenkins, A., Jacobs, S., Bindschadler, R., and Holland, D. M.: Sensitivity of Pine Island Glacier to observed ocean forcing, Geophys. Res. Lett., 43, 10817–10825, https://doi.org/10.1002/2016GL070500, 2016.
Fricker, H. A., Scambos, T., Bindshadler, R., and Padman, L.: An Active Subglacial Water System in West Antarctica Mapped from Space, Science, 315, 1544–1548, https://doi.org/10.1126/science.1136897, 2007.
Friedl, P., Weiser, F., Fluhrer, A., and Braun, M. H.: Remote sensing of glacier and ice sheet grounding lines: A review, Earth-Sci. Rev., 201, 102948, https://doi.org/10.1016/j.earscirev.2019.102948, 2020.
Gray, L., Joughin, I., Tulaczyk, S., Spikes, V. B., Bindschadler, R., and Jezek, K.: Evidence for subglacial water transport in the West Antarctic Ice Sheet through threedimensional satellite radar interferometry, Geophys. Res. Lett., 32, L03501, https://doi.org/10.1029/2004gl021387, 2005.
Haran, T., Bohlander, J., Scambos, T., Painter, T., and Fahnestock, M.: MODIS Mosaic of Antarctica 2008–2009 (MOA2009) Image Map, Version 1, Boulder, Colorado, USA, NASA National Snow and Ice Data Center Distributed Active Archive Center, https://doi.org/10.7265/N5KP8037, 2014.
Holschuh, N., Christianson, K., Paden, J., Alley, R. B., and Anandakrishnan, S.: Linking postglacial landscapes to glacier dynamics using swath radar at Thwaites Glacier, Antarctica, Geology, 48, 268–272, https://doi.org/10.1130/G46772.1, 2020.
Joughin, I.: MEaSUREs Greenland Monthly Ice Sheet Velocity Mosaics from SAR and Landsat, Version 1, NASA National Snow and Ice Data Center Distributed Active Archive Center, Boulder, Colorado, USA, https://doi.org/10.5067/OPFQ9QDEUFFY, 2018, updated 2019.
Joughin, I., Tulaczyk, S., Bamber, J., Blankenship, D., Holt, J., Scambos, T., and Vaughan, D.: Basal conditions for Pine Island and Thwaites Glaciers, West Antarctica, determined using satellite and airborne data, J. Glaciol., 55, 245–257, https://doi.org/10.3189/002214309788608705, 2009.
Joughin I., Smith, B., and Abdalati, W.: Glaciological advances made with interferometric synthetic aperture radar, J. Glaciol., 56, 1026–1042, 2010.
Joughin, I., Smith, B. E., and Medley, B.: Marine Ice Sheet Collapse Potentially Under Way for the Thwaites Glacier Basin, West Antarctica, Science, 344, 6185, 735–738, https://doi.org/10.1126/science.1249055, 2014.
Moore, J., Gladstone, R., Zwinger, T., and Wolovick, M.: Geoengineering polar glaciers to slow sea-level rise, Nature, 555, 303–305, https://doi.org/10.1038/d41586-018-03036-4, 2018.
Oswald, G. K. A. and Robin, G. De Q.: Lakes Beneath the Antarctic Ice Sheet, Nature, 245, 251–254, 1973.
Press, W. H., Teukolsky, S. A., Vetterling, W. T., and Flannery, B. P.: Numerical Recipes, 3rd edn., Cambridge Univ. Press, Cambridge, UK, 2007.
Rignot, E., Mouginot, J., Morlighem, M., Seroussi, H., and Scheuchl, B.: Widespread, rapid grounding line retreat of Pine Island, Thwaites, Smith, and Kohler glaciers, West Antarctica, from 1992 to 2011, Geophys. Res. Lett., 41, 3502–3509, https://doi.org/10.1002/2014GL060140, 2014.
Robin, G. De Q., Evans, S., and Bailey, J. T.: Interpretation of radio echo sounding in polar ice sheets, Philos. Trans. R. Soc. London, Ser. A, 265, 437–505, 1969.
Shapero, D., Badgeley J., and Hoffman, A.: icepack: glacier flow modeling with the finite element method in Python, Zenado, https://doi.org/10.5281/zenodo.4318150, 2020.
Shreve, R. L.: Movement of water in glaciers, J. Glaciol., 11, 205–214, 1972.
Siegfried, M. R., Fricker, H. A., Roberts, M., Scambos, T. A., and Tulaczlyk, S.: A decade of West Antarctic subglacial lake interactions from combined ICESat and CryoSat-2 altimetry, Geophy. Res. Lett., 41, 3, 891–898, https://doi.org/10.1002/2013GL058616, 2014.
Siegfried, M. R., Fricker, H. A., Carter, S. P., and Tulaczlyk, S.: Episodic ice velocity fluctuations triggered by a subglacial flood in West Antarctica, Geophy. Res. Lett., 43, 2640–2648, https://doi.org/10.1002/2016GL067758, 2016.
Smith, B. E., Fricker, H. A., Joughin, I. R., and Tulaczyk, S.: An inventory of active subglacial lakes in Antarctica detected by ICESat (2003–2008), J. Glaciol., 55, 573–595, 2009.
Smith, B. E., Gourmelen, N., Huth, A., and Joughin, I.: Connected subglacial lake drainage beneath Thwaites Glacier, West Antarctica, The Cryosphere, 11, 451–467, https://doi.org/10.5194/tc-11-451-2017, 2017.
Wilson, T., Bevis, M., Smalley Jr., R., Dalziel, I., Kendrick, E., Konfal, S., Saddler, D., and Willlis, M.: Antarctica-POLENET GPS Network – LTHW-Lower Thwaites Glacier P.S., The GAGE Facility operated by UNAVCO, Inc., GPS/GNSS Observations Dataset, https://doi.org/10.7283/T5NK3C7D, 2009a.
Wilson, T., Bevis, M., Smalley Jr., R., Dalziel, I., Kendrick, E., Konfal, S., Saddler, D., abd Willlis, M.: Antarctica-POLENET GPS Network – UTHW-Up Thwaites Glacier P.S., The GAGE Facility operated by UNAVCO, Inc., GPS/GNSS Observations Dataset, https://doi.org/10.7283/T50P0XBC, 2009b.
Wingham, D. J., Siegert, M. J., Shepherd, A., and Muir, A.: Rapid discharge connects Antarctic subglacial lakes, Nature, 440, 1033–1036, 2006.