the Creative Commons Attribution 4.0 License.
the Creative Commons Attribution 4.0 License.
 | 15 Dec 2020
Quantification of the radiative impact of light-absorbing particles during two contrasted snow seasons at Col du Lautaret (2058 m a.s.l., French Alps)
François Tuzet
Ghislain Picard
Maxim Lamare
Didier Voisin
Pierre Nabat
Mathieu Lafaysse
Fanny Larue
Jesus Revuelto
Laurent Arnaud
The presence of light-absorbing particles (LAPs) in snow leads to a decrease in short-wave albedo affecting the surface energy budget. However, the understanding of the impacts of LAPs is hampered by the lack of dedicated datasets, as well as the scarcity of models able to represent the interactions between LAPs and snow metamorphism. The present study aims to address both these limitations by introducing a survey of LAP concentrations over two snow seasons in the French Alps and an estimation of their impacts based on the Crocus snowpack model that represents the complex interplays between LAP dynamics and snow metamorphism.
First, a unique dataset collected at Col du Lautaret (2058 m a.s.l., above sea level, French Alps) for the two snow seasons 2016–2017 and 2017–2018 is presented. This dataset consists of spectral albedo measurements, vertical profiles of snow specific surface area (SSA), density and concentrations of different LAP species. Spectral albedos are processed to estimate SSA and LAP absorption-equivalent concentrations near the surface of the snowpack. These estimates are then compared to chemical measurements of LAP concentrations and SSA measurements. Our dataset highlights, among others, large discrepancies between two measurement techniques of black carbon (BC) concentrations in snow (namely thermal-optical and laser-induced incandescence).
Second, we present ensemble snowpack simulations of the multi-physics version of the detailed snowpack model Crocus, forced with in situ meteorological data, as well as dust and BC deposition fluxes from an atmospheric model. The temporal variations of near-surface LAP concentrations and SSA are most of the time correctly simulated. The simulated seasonal radiative forcing of LAPs is 33 % higher for the 2017–2018 snow season than for the 2016–2017 one, highlighting a strong variability between these two seasons. However, the shortening of the snow season caused by LAPs is similar with 10 ± 5 and 11 ± 1 d for the first and the second snow seasons, respectively. This counter-intuitive result is attributed to two small snowfalls at the end of the first season and highlights the importance in accounting for meteorological conditions to correctly predict the impact of LAPs. The strong variability of season shortening caused by LAPs in the multi-physics ensemble for the first season (10 ± 5 d) also points out the sensitivity of model-based estimations of LAP impact on modelling uncertainties of other processes. Finally, the indirect impact of LAPs (i.e. the enhancement of energy absorption due to the acceleration of the metamorphism by LAPs) is negligible for the 2 years considered here, which is contrary to what was found in previous studies for other sites.
- Article
(6075 KB) - Full-text XML
- BibTeX
- EndNote


Light-absorbing particles (LAPs) such as black carbon (BC) or mineral dust (hereinafter referred to as dust) are important drivers of snow albedo (Warren and Wiscombe, 1980). Indeed, LAPs enhance solar energy absorption in the visible wavelengths (direct impact), triggering changes in snow properties that further decrease albedo (indirect impacts; e.g. Hansen and Nazarenko, 2004; Painter et al., 2007; Skiles and Painter, 2019). As a consequence, LAPs have a strong effect on snowpack evolution and melt at global and local scales. Since LAPs are present in snow-covered regions worldwide, they have been reported to be a powerful climate forcing parameter (Flanner et al., 2007). In some regions, intensive field campaigns have already been conducted, providing a thorough knowledge of local or regional impacts of LAPs, e.g. by Doherty et al. (2010) in the Arctic and by Skiles et al. (2012) and Painter et al. (2012) in the Rocky Mountains, USA. For instance, dust deposition in the Rocky Mountains was shown to shorten the presence of snow cover by up to 51 d (Skiles et al., 2012). However, the impact of LAPs varies widely at the regional scale, and the recent review from Skiles et al. (2018) recommends expanding local-scale LAP observations.
In the European Alps, the only multi-year records of LAP concentrations are provided by ice cores for high-altitude glaciers located mostly above 4000 m. In the 1980s, the analysis of ice cores from several alpine glaciers showed the importance of Saharan dust and BC in this region (De Angelis and Gaudichet, 1991; Thevenon et al., 2009). Gabbi et al. (2015) recently estimated that the mean LAP radiative forcing (RF; i.e. the enhancement of short-wave radiation absorption caused by LAPs) at Claridenfirn (Swiss Alps) increased by 3.2 W m−2 due to BC and 0.6 W m−2 due to dust between 1914 and 2014. De Angelis and Gaudichet (1991) have shown an increasing trend in Saharan dust deposition on glaciers in the French Alps between 1955 and 1985. The increase in extreme Saharan dust deposition events has also recently been confirmed and partly attributed to the Arctic amplification of global warming (Varga, 2020). Other ice core analyses in the Alps point out the increase in BC concentrations from 1850 to 1870 to the middle of the 20th century owing to industrialisation (Thevenon et al., 2009; Jenk et al., 2006; Painter et al., 2013).
For seasonal snow, measurements of LAP concentrations in the European Alps are scarcer than long-term measurements from ice cores. Such measurements are, however, essential in gathering information about the seasonal evolution of LAPs at lower altitudes. Di Mauro et al. (2015) report detailed measurements of dust concentrations using both a particle counter and gravimetry techniques but only for samples taken on a single day. A similar dataset is presented in Di Mauro et al. (2019) with 1 d of dust measurements after a strong deposition event. The longest monitoring programme of LAP concentrations in the European Alps is presented by Dumont et al. (2017), which covers 2 months at the end of a snow season at a mid-altitude site (1300 m). To our knowledge, no other intensive LAP monitoring survey has been conducted so far on seasonal snow in the Alps, which strongly limits the understanding of their impacts.
There are mainly two experimental approaches to determine the radiative impact of LAPs in seasonal snow. First, several types of chemical measurement techniques were developed to estimate the concentration of different LAP species in snow. Once the concentration is determined, it can be related to LAP absorption under the assumption of the LAP mass absorption efficiency (MAE), i.e. the absorption efficiency of the LAP by unit of mass (g m−1). Nevertheless, the MAE values for LAPs in snow are poorly constrained due to several problems such as the coating of LAP particles (e.g. Dong et al., 2018) and their mixing state in relation to the ice matrix (e.g. Flanner et al., 2012). Second, an alternative approach consists of using spectral measurements of snow reflectance to infer the radiative impact of LAPs in snow. The method was developed to circumvent the difficulties associated with chemical measurements, as well as the aforementioned MAE uncertainties.
Major efforts have been devoted to chemically determining BC concentrations in the atmosphere over the past decades (e.g. Bond and Bergstrom, 2006) all leading to problematic results. Indeed, different experimental methods have been developed which take advantage of different physical properties of BC aerosols, yet no consensus has ever been reached on a preferential technique to measure BC (e.g. Petzold et al., 2013). For this reason, Petzold et al. (2013) defined a specific terminology for reporting BC measurements, in which refractory black carbon (rBC) refers to BC measured by laser-induced incandescence (e.g. Schwarz et al., 2008), elemental carbon (EC) to methods based on thermal-optical methods (e.g. Zanatta et al., 2016) and equivalent black carbon (eBC) to methods based on light absorption (e.g. Bond et al., 1999). Strong discrepancies between these different methods are observed. Watson (2005) presents a review of numerous inter-comparisons of BC measurement techniques highlighting up to 7-fold differences which lead to a 1 order of magnitude uncertainty in experimental MAE estimations. Moreover, measurement techniques of BC concentrations used for the atmosphere may not be directly transferable to snow. For instance, the size distribution of BC is suspected to be shifted towards bigger particles in snow compared to that in the atmosphere (e.g. Lim et al., 2014; Schwarz et al., 2013), affecting, amongst others, the influence of the size detection range of the measurement. Additional measurement uncertainties due to the liquid state of the samples are also expected (e.g. nebulisation biases; Schwarz et al., 2012). Strong uncertainties are therefore associated with BC measurements in snow. The concentration of dust in snow can also be measured with various techniques, for instance, using particle counters (e.g. Coulter counter in Delmonte et al., 2004), through gravimetry (e.g. Di Mauro et al., 2015) or based on dust mineralogical properties (e.g. De Angelis and Gaudichet, 1991). As the attention paid to dust has been hitherto lower than BC, our knowledge of uncertainties of dust concentration measurements in snow is incomplete.
The second approach consists of analysing measurements of snow optical properties to infer the absorption caused by LAPs, exploiting the differences between LAP and ice absorption spectra. To isolate the absorption of LAPs, these methods often rely on spectral band ratios (e.g. Kokhanovsky et al., 2018) and/or on a radiative transfer model (e.g. Dumont et al., 2017; Lamare et al., 2016; Tuzet et al., 2019). The inferred absorption can then be used in two ways. First, assumptions on the incoming radiation make it possible to deduce the RF of LAPs from spectral reflectance measurements (e.g. Painter et al., 2007; Skiles et al., 2012). Second, an assumption on the MAE value of LAPs allows us to estimate an absorption equivalent concentration (AEC) from spectral albedo measurements, i.e. the LAP concentrations that would cause the same absorption as that observed in albedo measurements. For instance, Dumont et al. (2017) derive temporal series of near-surface AECs from automated spectral albedo measurements. Similar methods have also been applied to data acquired by unmanned aerial vehicles (e.g. Di Mauro et al., 2015) and satellites (e.g. Kokhanovsky et al., 2019). Recently, a method was proposed to estimate AECs of homogeneous snow layers at depth from vertical profiles of spectral irradiance (Tuzet et al., 2019).
A variety of snow radiative transfer models accounting for the impact of LAPs were developed in the last decades (e.g. Warren and Wiscombe, 1980; Stamnes et al., 1988; Flanner and Zender, 2005; Flanner et al., 2007; Aoki et al., 2011; Libois et al., 2013). The direct RF of LAPs can be computed by simulating snow albedo with and without LAPs using measured or simulated LAP concentrations (e.g. Hadley and Kirchstetter, 2012), and it thus only requires snow radiative transfer modelling. In contrast, estimating the indirect RF of LAPs – which accounts for the albedo feedbacks, i.e. the interaction between LAP impacts and snow metamorphism – necessitates a coupling between a radiative transfer model and a snowpack model simulating snow metamorphism (e.g. SMAP, Snow Metamorphism and Albedo Process; Niwano et al., 2012). Tuzet et al. (2017) introduced an explicit representation of LAP deposition and evolution in the Crocus detailed snowpack model (Brun et al., 1989; Vionnet et al., 2012), in which the recent implementation of the Two-stream Analytical Radiative TransfEr in Snow (TARTES) model (Libois et al., 2013) allows us to simulate spectral albedo. These developments make it possible to simulate the indirect impact of LAPs. Skiles and Painter (2019) similarly coupled the snowpack evolution model SNOWPACK (Lehning et al., 2002) and the radiative transfer model SNICAR (SNow, Ice and Aerosol Radiation model; Flanner and Zender, 2005). Tuzet et al. (2017) and Skiles and Painter (2019) estimated that the indirect RF is an efficient mechanism of the RF of LAPs, accounting for 15 % to 20 % of the total RF of LAPs. However, detailed snowpack models are affected by many uncertainties coming either from the uncertainties in the atmospheric forcing or from intrinsic uncertainties in the representation of snow physics (modelling uncertainties; e.g. Krinner et al., 2018; Raleigh et al., 2015; Essery et al., 2013). Accounting for these uncertainties is of particular interest since the errors accumulate over time, leading to strong uncertainties at the end of the snow season. Modelling uncertainties have recently been shown to affect the conclusions drawn on the impacts of LAPs using a model-based approach. Indeed, Skiles and Painter (2019) demonstrated that the estimated shortening of the snow season caused by LAPs varies from 30 to 49 d depending on the complexity of the snowpack model used. In this light, a multi-physics ensemble modelling framework called ESCROC (Ensemble System CROCus; Lafaysse et al., 2017) has been developed for Crocus to represent its own modelling uncertainties. The combined use of this ensemble modelling framework and developments of Tuzet et al. (2017) make it possible to represent all the impacts (direct and indirect) of LAPs, as well as the modelling uncertainties associated with the other processes in the snowpack model.
The present study aims to answer two scientific questions.
-
What are the concentrations of BC and dust near the surface of an Alpine snowpack and how do they evolve over two snow seasons?
-
What is the impact of these LAPs on the snowpack evolution and more specifically on snow cover duration?
To answer the first question, 2 years of near-weekly measurements were performed at the Col du Lautaret study site during which the impact of LAPs was determined by both aforementioned approaches. This unique dataset, presented in Sect. 2.2, consists of 30 measurement days during the 2016–2017 and 2017–2018 seasons. The spectral albedo measurements are first processed to estimate snowpack near-surface specific surface area (SSA) and AEC. These data are then compared to physico-chemical measurements performed in snow pits.
To address the second question, the impact of LAPs on snowpack evolution is then calculated using ensemble simulations with the multi-physics version of the Crocus model (ESCROC; Lafaysse et al., 2017) including TARTES (Sect. 2.3). Two ensemble simulations accounting or not accounting for the impact of LAPs are run and compared to each other, providing an estimate of the impact of LAPs on snowpack evolution and the associated uncertainty. The results of our analysis are presented (Sect. 3) and discussed (Sect. 4) before conclusions are drawn (Sect. 5).
Strictly speaking, “radiative forcing (RF) of LAPs in snow” should be called “surface radiative effect”. However, given the common use of the term RF in the literature (e.g. Skiles et al., 2018) and the numerous acronyms already defined in this paper, we decided to keep the term RF for the sake of simplicity.
2.1 Radiative transfer modelling
In the present study, the radiative transfer modelling is based on the asymptotic analytical radiative transfer theory (AART; Kokhanovsky and Zege, 2004) as formulated in TARTES. The following assumptions are used throughout the paper.
-
The refractive index of ice is taken from Warren and Brandt (2008).
-
We assume that LAP absorption is only due to BC and dust.
-
The MAE (mass absorption efficiency) of the LAPs is considered to be known. For BC, MAE is derived from the constant BC refractive index advised by Bond and Bergstrom (2006), i.e. ; the relation is scaled to obtain an MAE value at 550 nm of 11.25 m2 g−1 (Hadley and Kirchstetter, 2012). The scaling makes it possible to implicitly account for the potential absorption enhancement due to internal particle mixing or particle coating. For dust, as the Saharan desert is the major source of particles observed in the European Alps (e.g. Thevenon et al., 2009; Di Mauro et al., 2019), MAE is set to the value suggested by Caponi et al. (2017) for dust from Libya with a diameter less than 2.5 µm (PM2.5). This MAE value was chosen amongst several values reported for Saharan dust because of its good agreement with our spectral albedo measurements. The impacts of this choice are discussed in Tuzet et al. (2019).
-
The shape parameters B and g, used to describe the impact of the ice matrix shape in AART, are constant over time and the same for all types of snow. These parameters have a small dependency on the wavelength, which is a function of the real part of ice refractive index ri (taken here from Warren and Brandt, 2008), and are expressed as follows:
This implementation is adapted from Appendix F of Libois (2014) and comes from the theory of Kokhanovsky and Zege (2004). The enhancement parameter B0 is set to 1.6, and the asymmetry factor g0 is set to 0.845, which is consistent with previous studies (Libois et al., 2014; Dumont et al., 2017).
2.2 Field measurements
Measurements were collected during the two snow seasons 2016–2017 and 2017–2018 at the Col du Lautaret site (45∘02′28.7′′ N, 6∘24′38.0′′ E) around 2100 m a.s.l. in the French Alps (Fig. 1). This site was chosen due to its high elevation and easy accessibility even during the snow season. The dataset includes automated measurements and manual measurements; the latter were acquired over 30 d during the two seasons. The following variables were collected:
-
snow physical properties from a snow pit including snow depth, snow water equivalent and vertical profiles of SSA, density, temperature, and snow type;
-
vertical profiles of EC, rBC and dust chemical concentrations;
-
automated and manual spectral albedo measurements;
-
meteorological measurements and snow depth from an automated weather station.
Manual measurements were performed approximately once a week. The actual measurement days were picked to favour stable illumination conditions (fully overcast or clear sky), thus minimising the uncertainties associated with radiative measurements in changing conditions. All the field sampling and measurements were performed by a single operator for the two seasons, ensuring a stable protocol as detailed in the following section.
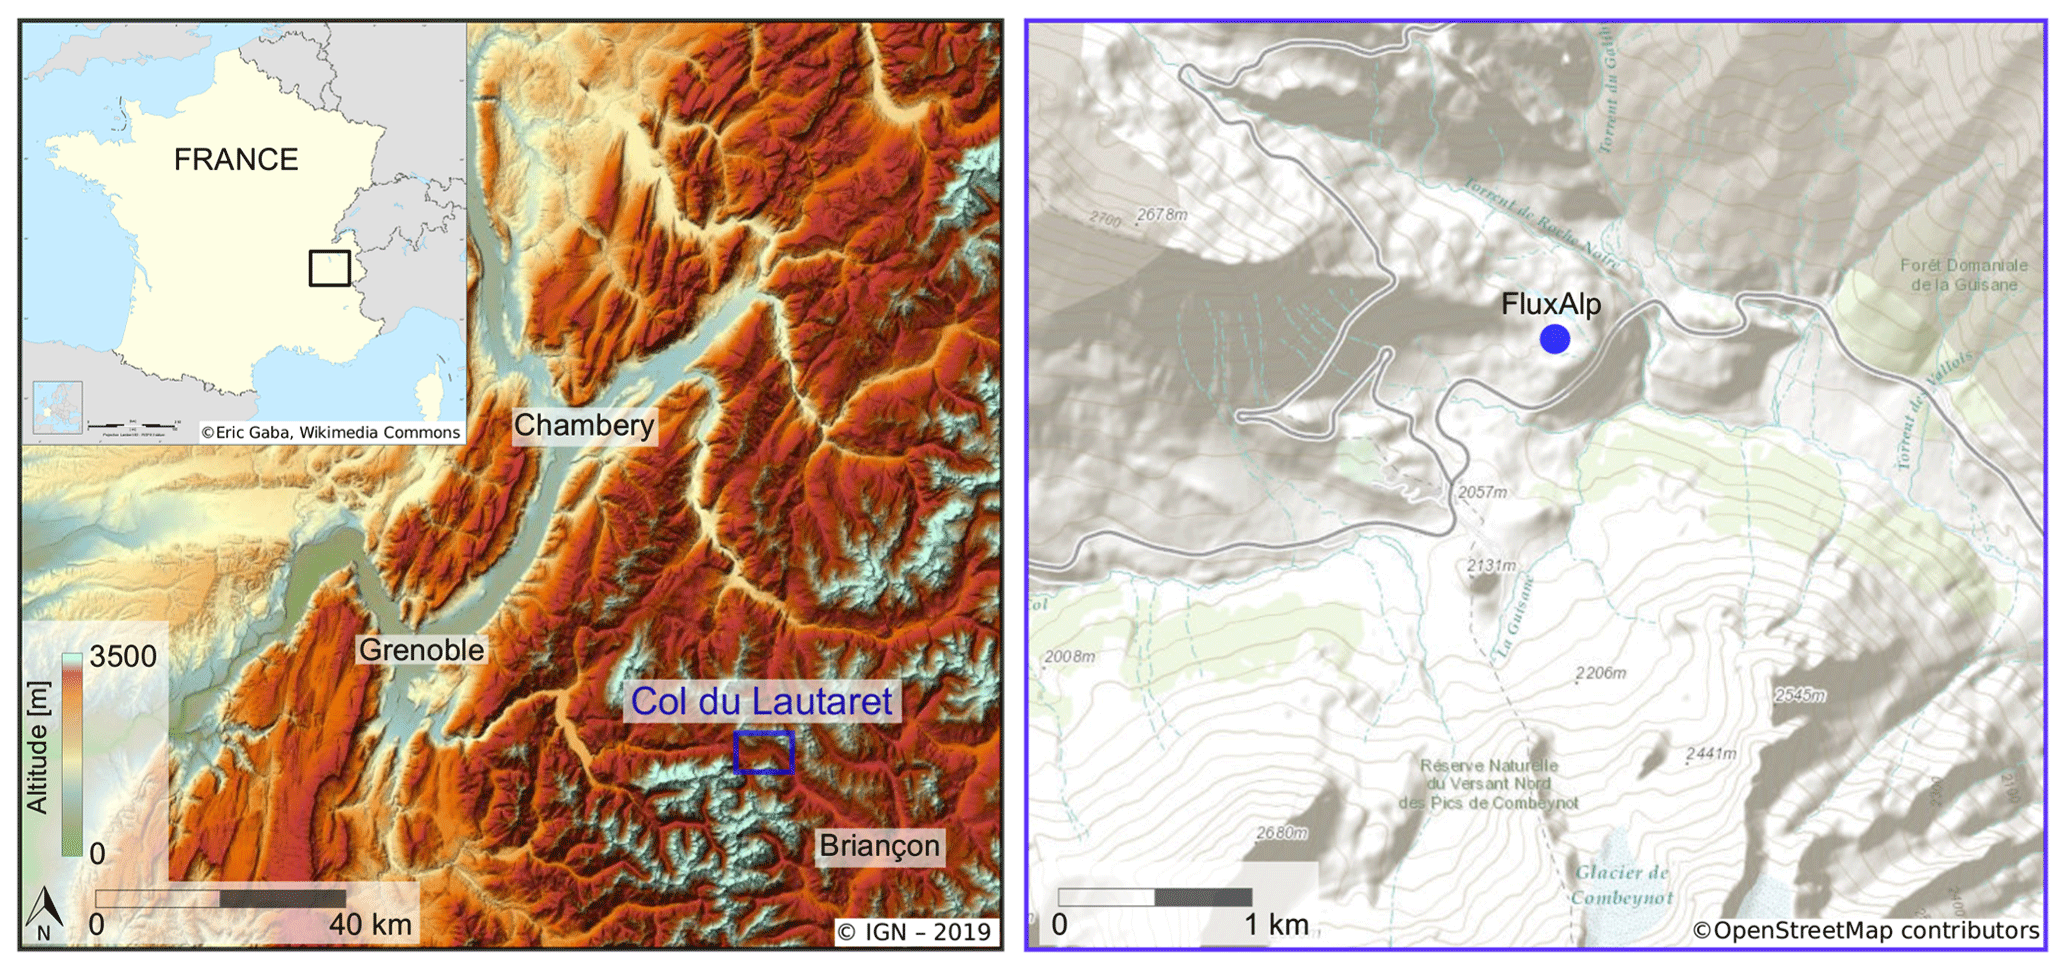
Figure 1Localisation of the study area. The left panel shows the Col du Lautaret site on a hillshade superimposed on the 25 m digital elevation model (DEM) produced by the French National Institute of Geographic and Forest Information (IGN). The right panel shows the automated weather station superimposed on the OpenStreetMap product, © OpenStreetMap contributors 2019. Distributed under a Creative Commons BY-SA License.
2.2.1 Snow pit measurements
Snow pit measurements were performed on each field day for the uppermost 20 cm of the snowpack at least. For each new measurement, the snow pits were dug at least 1 m away from the former snow pit's location and at a distance of 5 to 20 m from the automated weather station. Tuzet et al. (2019) provide a detailed description of these measurements, and the most important features of the dataset are recalled below.
Vertical profiles of snow density and snow specific surface area (SSA) were collected. Density was measured with a 6 cm vertical resolution using a cylindrical cutter with a volume of 0.5 L. During the snow season 2016–2017, SSA vertical profiles were collected with the DUFISSS instrument (DUal Frequency Integrating Sphere for Snow SSA measurement; Gallet et al., 2009) at a 3 cm vertical resolution, excluding ice layers. During the snow season 2017–2018, SSA profiles were acquired with the Alpine Snowpack Specific Surface Area Profiler (ASSSAP; Libois et al., 2014). The uncertainty associated with these SSA measurements was estimated to be 10 % (Arnaud et al., 2011; Gallet et al., 2009). For both seasons, one to five samples of the surface were measured. For days when several surface samples were collected, the variability was lower than 15 % for 95 % of the samples, accounting for both the field variability and the measurement uncertainties.
Vertical profiles of dust and refractory black carbon (rBC) concentrations were obtained with a 3 cm vertical resolution. For this, snow was sampled in triplicate in sterile 50 mL polypropylene centrifugation tubes. The samples remained frozen until analysis in the laboratory where they were melted and immediately analysed after nebulisation using a single particle soot photometer (SP2, Droplet Measurement Technologies) and according to the procedure described in Wendl et al. (2014) and further evaluated by Lim et al. (2014), which uses a jet nebuliser (apex Q, Elemental Scientific Inc., USA). Dust size distributions and concentrations were measured with a Coulter counter following Delmonte et al. (2004). The measured sizes span a range of 0.6 to 21 µm, and we assume here that insoluble particles above 0.6 µm are mainly dust particles.
The dataset also includes organic carbon (OC) and elemental carbon (EC) measurements in addition to the dataset described in Tuzet et al. (2019). Snow was sampled with a vertical resolution of 10 to 20 cm, following Voisin et al. (2012), with stainless steel instruments and was stored frozen (−30 ∘C) in pre-cleaned borosilicate glass bottles until further processing. Snow was then melted, and a coagulant (NH4H2PO4, 1.5 g 100 mL−1; Torres et al., 2014) was added before filtering on precombusted QMA filters. The addition of the coagulant lets BC particles agglomerate and helps increase the filtration efficiency for BC to ≈ 90 %. This is a key step as QMA quartz filters in water typically have cutoff diameters of around 500 nm (Lim et al., 2014; Torres et al., 2014). EC ∕ OC was then quantified on the entire filter (21 mm) by a thermal-optical transmission method (Sunset Lab instrument) following the EUSAAR-2 protocol (Cavalli et al., 2010).
In this study, we focus on near-surface SSA and LAP concentrations. To obtain these near-surface properties, all the samples of SSA, dust, rBC and EC collected in the top layer are averaged. Note that the EC dataset has a lower vertical resolution (10 or 20 cm), inducing higher uncertainties in the near-surface concentrations.
2.2.2 Snow spectral albedo measurements
Spectral albedo measurements were acquired using two techniques. First, spectral albedo was acquired automatically every 12 min from 18 February 2017 to 21 May 2018 with the Autosolexs instrument (Picard et al., 2016) installed on the weather station. Autosolexs is a spectral albedometer consisting of two measurement heads at the end of a 3 m metallic arm extending out from the weather station structure. The first head is equipped with two cosine light collectors looking downward and upward. This head measures upwelling and downwelling spectral radiation to compute spectral albedo. The second head is equipped with a single upward-looking collector which measures the spectral ratio between diffuse and total incoming illumination – a mandatory quantity for albedo processing. The diffuse radiation is acquired by hiding the direct solar illumination with a thin strip piloted by a sun tracker. The three collectors are connected by fibre optics to an optical switch, itself connected to a spectrometer. This device acquires one spectral albedo spectrum and one diffuse-to-total illumination spectral ratio every 12 min with an effective resolution of 3 nm from 350 to 1050 nm. A full description of this instrument detailing the hardware specifications and data processing can be found in Picard et al. (2016).
Second, on each observation day, at least three different spectral albedo measurements were acquired manually using a single-channel manual version of the Autosolexs instrument (Picard et al., 2016). This albedometer (Solalb; Larue et al., 2020) is a handheld instrument made of a single cosine light collector fixed at the extremity of a 3 m metal bar with the same characteristics as Autosolexs. The collector is directly connected to the spectrometer by fibre optics. To obtain an albedo measurement, an upward-looking measurement is first acquired followed by a downward-looking measurement. This operation usually takes up to 30 s to execute, which is the time during which the variations of total incoming irradiance are continuously measured by a photodiode. When the incoming irradiance varied by more than 1 % between the upward and downward acquisitions, the acquisition was discarded. A digital inclinometer located on the measurement head gives instantaneous control of the levelling of the sensor with a 0.1∘ accuracy. The manual measurements were performed at the same position as the snow pit's physical measurements before any surface disturbance. After the albedo acquisition, the diffuse-to-total ratio is measured by hiding the sun with a thin strip, as with Autosolexs except that the operation is manual. Slope inclination and azimuth of the snow surface under the sensor – that have to be accounted for in the data processing (Dumont et al., 2017) – are measured after the acquisition with a digital inclinometer (SOLAR-2-15-2-RS232, Level Developments) which has an accuracy of 0.04∘. To do so, the azimuth of the greatest slope was first visually determined. Then a series of measurements every 5∘ around this direction was performed to find the maximum inclination. This protocol ensures an accuracy better than 5∘ for the aspect measurement and than 0.2∘ for slope measurement. This accuracy is sufficient for an accurate albedo correction (Picard et al., 2020).
2.2.3 LAP and SSA estimation from spectral albedo
Snow spectral albedo varies with snow SSA and LAP concentrations (e.g. Warren and Wiscombe, 1980), as well as with the solar zenith angle and the relative proportion of direct and diffuse radiation. In order to present a comprehensive interpretation of spectral albedo measurements, the measured spectra are processed to retrieve near-surface SSA and LAP absorption equivalent concentrations (AECs). The AEC is defined as the concentration of LAPs that would cause the same decrease in the visible albedo under the assumption of MAE detailed in Sect. 2.1.
To this end, a three-step retrieval method adapted from Dumont et al. (2017) is applied. This method consists of optimising the simulated spectral albedo – accounting for direct and diffuse incoming radiation, as well as the slope of the surface under the sensor – to estimate SSA and AEC as follows.
-
A scaling value (A), accounting for the small errors of cross-calibration between the upward- and downward-looking sensors, is estimated over a full season using acquisitions during fully cloudy days when the irradiance is 100 % diffuse.
-
Optimal values of AEC and SSA are estimated from the shape of the spectrum between 400 and 1050 nm accounting for slope, aspect and solar zenith angle. This step is fully described in Sect. 3 of the article from Dumont et al. (2017) that introduced this complex retrieval method, which is hence not fully detailed here. The main underlying idea is that, according to AART, the spectral variations of snow bi-hemispherical albedo (α; i.e. the albedo of a semi-infinite scattering medium illuminated by a diffuse source) can be expressed as a function of snow SSA and LAP concentrations as follows (e.g. Libois et al., 2013):
where
where 1−ω is the co-single scattering albedo that can be expressed as follows:
which gives
Here, λ is the wavelength, nice and ρice are the imaginary part of the ice refractive index and the density, respectively, and ci and MAEi are the AEC and the mass absorption efficiency (MAE) of the LAP type i, respectively. This formulation is the core of the retrieval method of Dumont et al. (2017), and in their study, they only account for BC and express BC MAE as a function of its complex refractive index, which gives their Eq. (5).
In their study, they explicitly mention the discrepancies caused by the assumption of considering only BC on the shape of the albedo spectrum when dust is present near the surface. To overcome this issue, the formulation of the absorption coefficient σ is modified to explicitly account for dust absorption as follows:
This modification makes it possible to distinguish BC and the dust spectral signature from the shape of the albedo spectra. All other parts of the retrieval process are kept to conform to Dumont et al. (2017).
-
Each day, the slope and aspect of the snow surface under the sensor are estimated from the diurnal cycle of spectral albedo.
This method is applied to the albedo acquisitions during which the solar zenith angle was lower than 65∘ to avoid uncertainties arising from low illumination angles. The estimations of near-surface AEC and SSA for which the root mean squared error (RMSE) between the optimal spectrum and the albedo measurement is higher than 0.022 are discarded. More details about the method can be found in Dumont et al. (2017), and additional details about the Autosolexs retrievals are presented in Appendix C. It is noteworthy that the slope and aspect estimations presented in Fig. C2 have a better accuracy for low surface LAP concentrations, which explains why they are more stable during the accumulation period.
A similar method is also applied to manual spectral albedo to retrieve near-surface SSA and AEC. In this case, we use the slope measured manually as an input of the retrieval algorithm since the slope estimation can only be computed when a diurnal cycle of albedo is measured. Lastly, the same method is applied to the spectral albedo computed by Crocus/TARTES (Tuzet et al., 2017) except that the terrain is considered to be flat. The retrieval is executed for each member of the LAP and pristine simulations at noon for every day when there is snow on the ground. This provides an ensemble of near-surface snow SSA and near-surface AEC.
2.3 Ensemble snowpack simulations
Two ensemble simulations of the Crocus snowpack model (Lafaysse et al., 2017) were performed at an hourly time step to simulate the evolution of the snowpack at our study site with and without LAPs. The meteorological forcing and deposition fluxes, as well as the model configuration, are detailed in the following sub-sections.
2.3.1 Meteorological forcing
During the two snow seasons, the weather station installed at the study site recorded most of the variables needed to run Crocus, namely air temperature, short-wave and long-wave incident radiation, wind speed, atmospheric pressure, and relative humidity. For each variable, the forcing for a time step t is computed as the mean of available measurements between t−1 h and t. Concerning precipitation, the timing of the precipitation events is taken from SAFRAN (Système d'analyse fournissant des renseignements atmosphériques à la neige) reanalysis (Durand et al., 1993) for 2016–2017 and from an unshielded rain gauge installed at the study site for 2017–2018. For both sets of years, the intensity of the precipitation is manually adjusted to reproduce snow depth variations and the phase of the precipitation is determined with a threshold at +1 ∘C (e.g. Aðalgeirsdóttir et al., 2006). Indeed, SAFRAN provides information covering a 1000 km2 area which can not reflect exactly the local precipitation amount. Furthermore, the intensity of the precipitation measured with the rain gauge – installed just before the beginning of the 2017–2018 snow season – was underestimated even after state-of-the-art corrections (Klok et al., 2001, Kochendorfer et al., 2017, Morin et al., 2012; data not shown here).
2.3.2 Forcing of LAP deposition fluxes
Aerosol deposition fields come from the regional climate model ALADIN-Climate version 6 (aire limitée adaptation dynamique développement international), described by Daniel et al. (2019). This model includes an interactive tropospheric aerosol scheme, named TACTIC (Tropospheric Aerosols for ClimaTe In CNRM) and presented in Nabat et al. (2015) and Drugé et al. (2019). TACTIC is able to represent the main anthropogenic (sulfate, BC, organic matter, nitrate and ammonium) and natural (dust and sea-salt) aerosol species in the troposphere. These seven aerosol types are represented through 16 sectional bins which also include two gaseous precursors (sulfur dioxide and ammonia) that are prognostic variables in the model, i.e. subject to transport (semi-lagrangian advection and convective transport), dry deposition, and in-cloud and below-cloud scavenging. A simulation was carried out over a regional domain covering Europe, the Mediterranean Sea and northern Africa at a 12 km horizontal resolution with 91 vertical levels. From this simulation, the hourly outputs of BC and dust deposition were extracted at the closest grid point to Col du Lautaret. The deposition fields include both dry and wet deposition mechanisms, and they are then given as input for the Crocus model to compute the evolution of LAPs and the radiative impact on the snowpack (Tuzet et al., 2017). All the components of aerosol deposition fluxes used here are presented in Appendix B.
2.3.3 Simulation framework
Ensemble simulations are performed with the multi-physics version of the Crocus model (ESCROC; Lafaysse et al., 2017). ESCROC is an ensemble framework running several Crocus simulations with different configurations of snow physical processes to represent modelling uncertainties; each simulation of an ESCROC experiment is called a member. Each member is run using the forcing data presented in the previous sections assuming flat terrain. The height of wind and temperature forcing in the simulations is adjusted to the weather station configuration, i.e. 5.18 and 3.53 m from the ground, respectively. The sensors' distance from the snow surface is then computed by Crocus using the simulated snow depth along the season in a similar way to the Crocus experiment in Krinner et al. (2018). Moreover, LAP scavenging by meltwater was disabled here because Crocus percolation schemes are highly uncertain. This means that LAPs can not be transported downward in the snowpack by meltwater.
The ensemble used here is composed of 35 members and is similar to the Ensemble E2 described in Lafaysse et al. (2017), whose dispersion had been optimised for a mid-altitude alpine site located less than 100 km from our study site. The only difference with E2 is that the TARTES radiative transfer scheme is used for all the members of our study, a requirement of the LAP implementation (Tuzet et al., 2017). The configuration of TARTES is the same for all members of the ensemble and is described in Sect. 2.1. As a consequence, the modelling uncertainties of the radiative transfer scheme are not accounted for.
To investigate the impact of LAP on snowpack evolution, two ensemble simulations are performed. The first one is forced by ALADIN-Climate LAP deposition fluxes and is referred to as the LAP simulation. The second one has the same 35 members but does not account for the impact of LAPs and is referred to as the pristine simulation. The comparison of the LAP simulation with the pristine simulation provides a numerical estimation of LAP impact on snow evolution, as well as the associated modelling uncertainties.
2.3.4 Handling of the ensemble simulation
Most of the simulation results are represented by the median and the spread (minimum and maximum values) of the ensemble. Due to the ensemble size of 35 members, this spread can be interpreted as the 95 % confidence interval of a given diagnostic. Unless otherwise specified, the spread and the median of the ensemble are calculated considering only the members with snow on the ground. For each member with snow on the ground, several quantities are computed to represent the impact of LAPs and are listed hereafter. Note that all statistics presented in the paper exclude periods when the measured automatic snow depth was lower than 20 cm to ensure that albedo measurements are not affected by the signal of the ground.
Radiative forcing (RF)
At each time step, the instantaneous radiative forcing (RF) of LAP is computed as the difference between the energy absorbed by the whole snowpack in the LAP and the pristine simulations (ELAP and Epristine, respectively):
The daily RF is computed as a 24 h average of the instantaneous RFs.
Indirect impact
The indirect impact of LAPs is also estimated at each time step as detailed in Tuzet et al. (2017). A simulation accounting only for the indirect impacts of LAP is performed with TARTES offline. For each time step, a TARTES calculation is made using the snowpack physical properties – i.e. the SSA, thickness and density of each layer – of the LAP simulation but no LAPs. In this way, the direct impact of LAPs is ignored, and only the radiative impact due to change in snow metamorphism is accounted for. This simulation is hereafter referred to as the indirect simulation. For each member and at each time step, the indirect impact Rind is computed as follows:
where RFindirect is the indirect radiative forcing. The daily Rind is computed as the ratio between the daily RF of the indirect simulation and the daily RF of the LAP simulation.
Shortening of the snow season
For each season, the date of the definitive disappearance of the snowpack (tmelt-out) is also computed as the last date when there is at least 2 kg m−2 of snow water equivalent on the ground. The difference between the melt-out dates in the LAP and pristine simulations is written Δtmelt-out, and it corresponds to the shortening of the snow-cover duration induced by LAPs.
2.4 LAP concentration terminology
This study aims at comparing chemically measured LAP concentrations with absorption equivalent concentrations (AECs) estimated from spectral albedo measurements. Here, we chose to present all concentrations as equivalent BC (eqBC) concentrations (e.g. Dumont et al., 2017; Tuzet et al., 2019). This eqBC concentration represents the amount of BC that would induce the same absorption as both dust and BC actually present in the snowpack.
For both measured LAP concentrations and optically estimated AECs, the eqBC concentration is calculated as follows:
where cBC, cdust and ceqBC are the BC, dust and eqBC concentrations, respectively; ψ is a function computing the BC concentration that would have the same integrated radiative impact from 350 to 900 nm as the input dust concentration. Appendix A1 illustrates the hypotheses of BC and dust MAE taken here, as well as the ψ function. More details about the computation of ceqBC are given in Tuzet et al. (2019).
In the following, eqBC concentrations from chemical measurements are referred to as eqEC (equivalent elemental carbon) and eqrBC (equivalent refractory black carbon) concentrations and are computed applying Eq. (10) with cBC equal to the measured EC or rBC, respectively.
The percentage of total LAP absorption which is caused by dust (η) is computed as follows:
where η=100 % indicates that the radiative impact is solely caused by dust and η=0 % by BC.
3.1 Two contrasted snow seasons
Figure 2 shows the observed evolution of the snow depth and of the meteorological conditions over the snow seasons 2016–2017 and 2017–2018. Figure 2a shows the evolution of the snow depth measured by the weather station and the operator on each field day. Rain-on-snow (ROS) events are represented as blue vertical lines and are determined based on the precipitation forcing (see Sect. 2.3.1). The brown shading corresponds to a major dust deposition that occurred at the beginning of April 2018. Manual and automated measurements are in good agreement with snow depth differences below 30 cm despite the horizontal distance between the automatic sensor and the manual measurements (up to 20 m). This highlights the moderate spatial snow depth variability within the study area despite the occurrence of frequent wind events with wind speeds higher than 6 m s−1 for both sets of years (Fig. 2b).
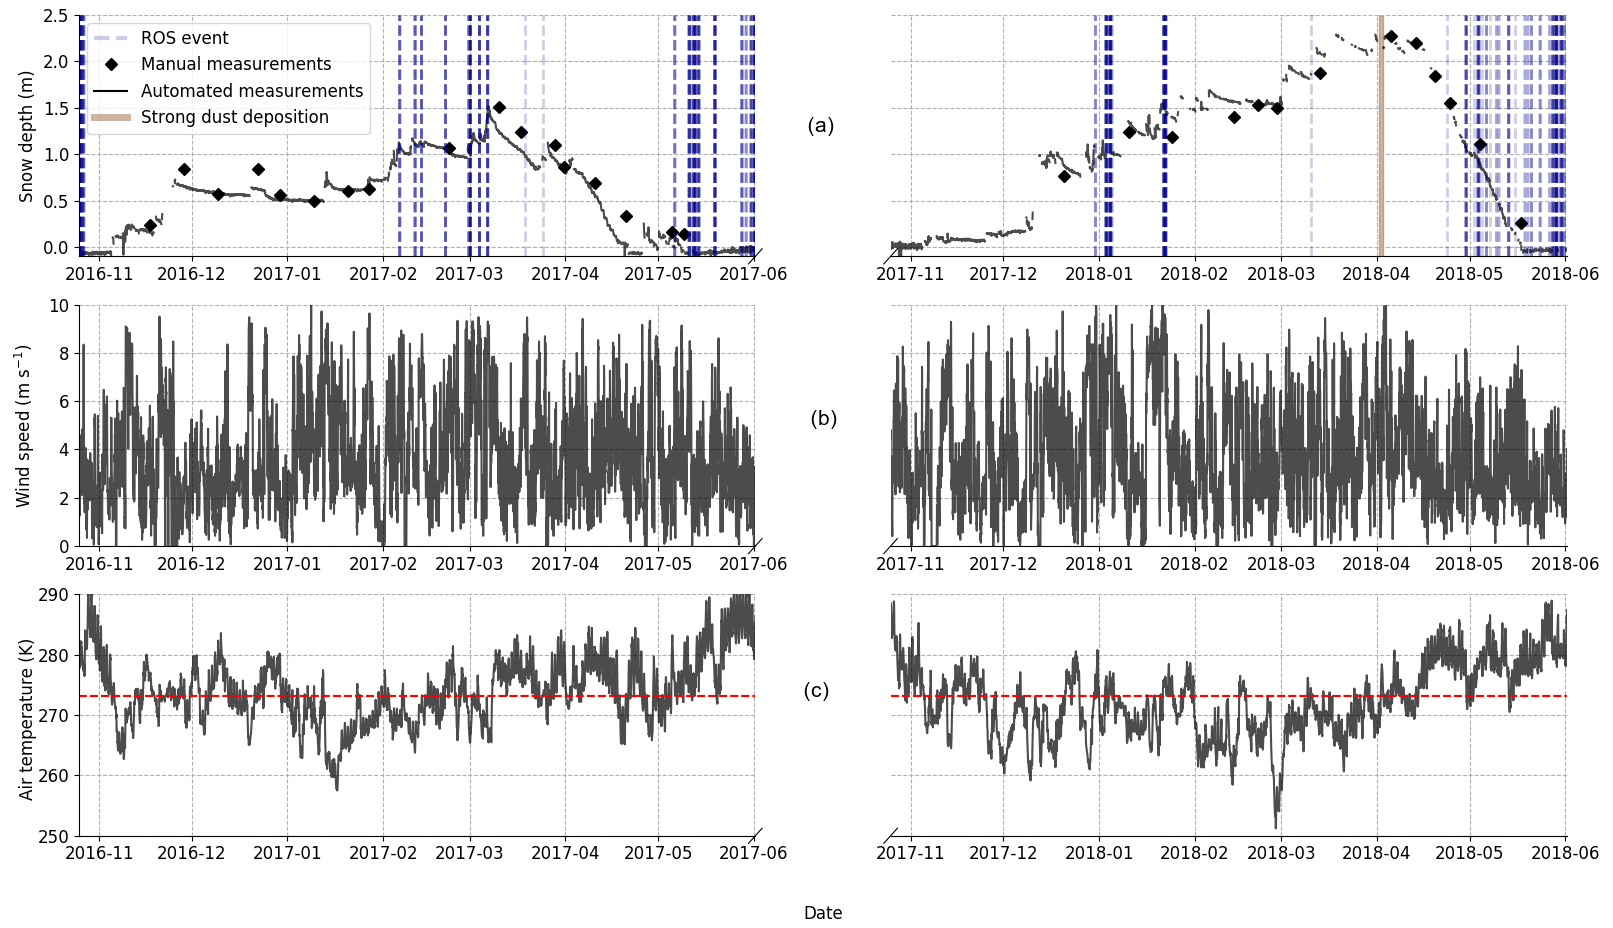
Figure 2Snow depth (a), wind speed (b) and air temperature (c) measured at the weather station for the two snow seasons (black curve). All data are averaged at an hourly time step. In panel (a), ROS and strong dust deposition events are represented by dashed blue and brown shading, respectively. Manual snow depth measurements acquired on each field day are also represented by black diamonds. The tick on the abscissa axis corresponds to the first day of each month.
The evolution of the snowpack is different between the two sets of years. 2016–2017 features low accumulation with few snowfall events in December and January and most of the snowfalls mixed with rain in February and March. The ablation phase started early, around mid-March, and the snowpack first disappeared around 20 April 2017. Two small snowfalls in May rebuilt an ephemeral snowpack lasting around 2 weeks. In 2017–2018, the accumulation was higher with many snowfall occurrences from December to mid-April. The ablation phase started approximately 1 month later, around mid-April, and the snowpack completely disappeared 1 month later, around 20 May 2018. Part of these differences can be explained by the temperatures (Fig. 2c) which were higher for the first year especially in March and at the beginning of April. This meteorological overview underlines the contrast between both seasons in terms of snow accumulation, temperatures and strong dust deposition events.
3.2 Measured near-surface properties
Figure 3a and b show the evolution of near-surface properties measured with the different methods presented in Sect. 2.2. The near-surface AEC and SSA retrieved from Autosolexs correspond to the daily median value, and the error bars correspond to the first and third quartiles of all valid daily measurements. The evolution of these near-surface properties is related to snowfall events and melt phases as illustrated with the evolution of the snow depth in Fig. 3c. The present section compares the different estimates of near-surface properties presented in Fig. 3a and b, and all the correlations can be found in Appendix D.
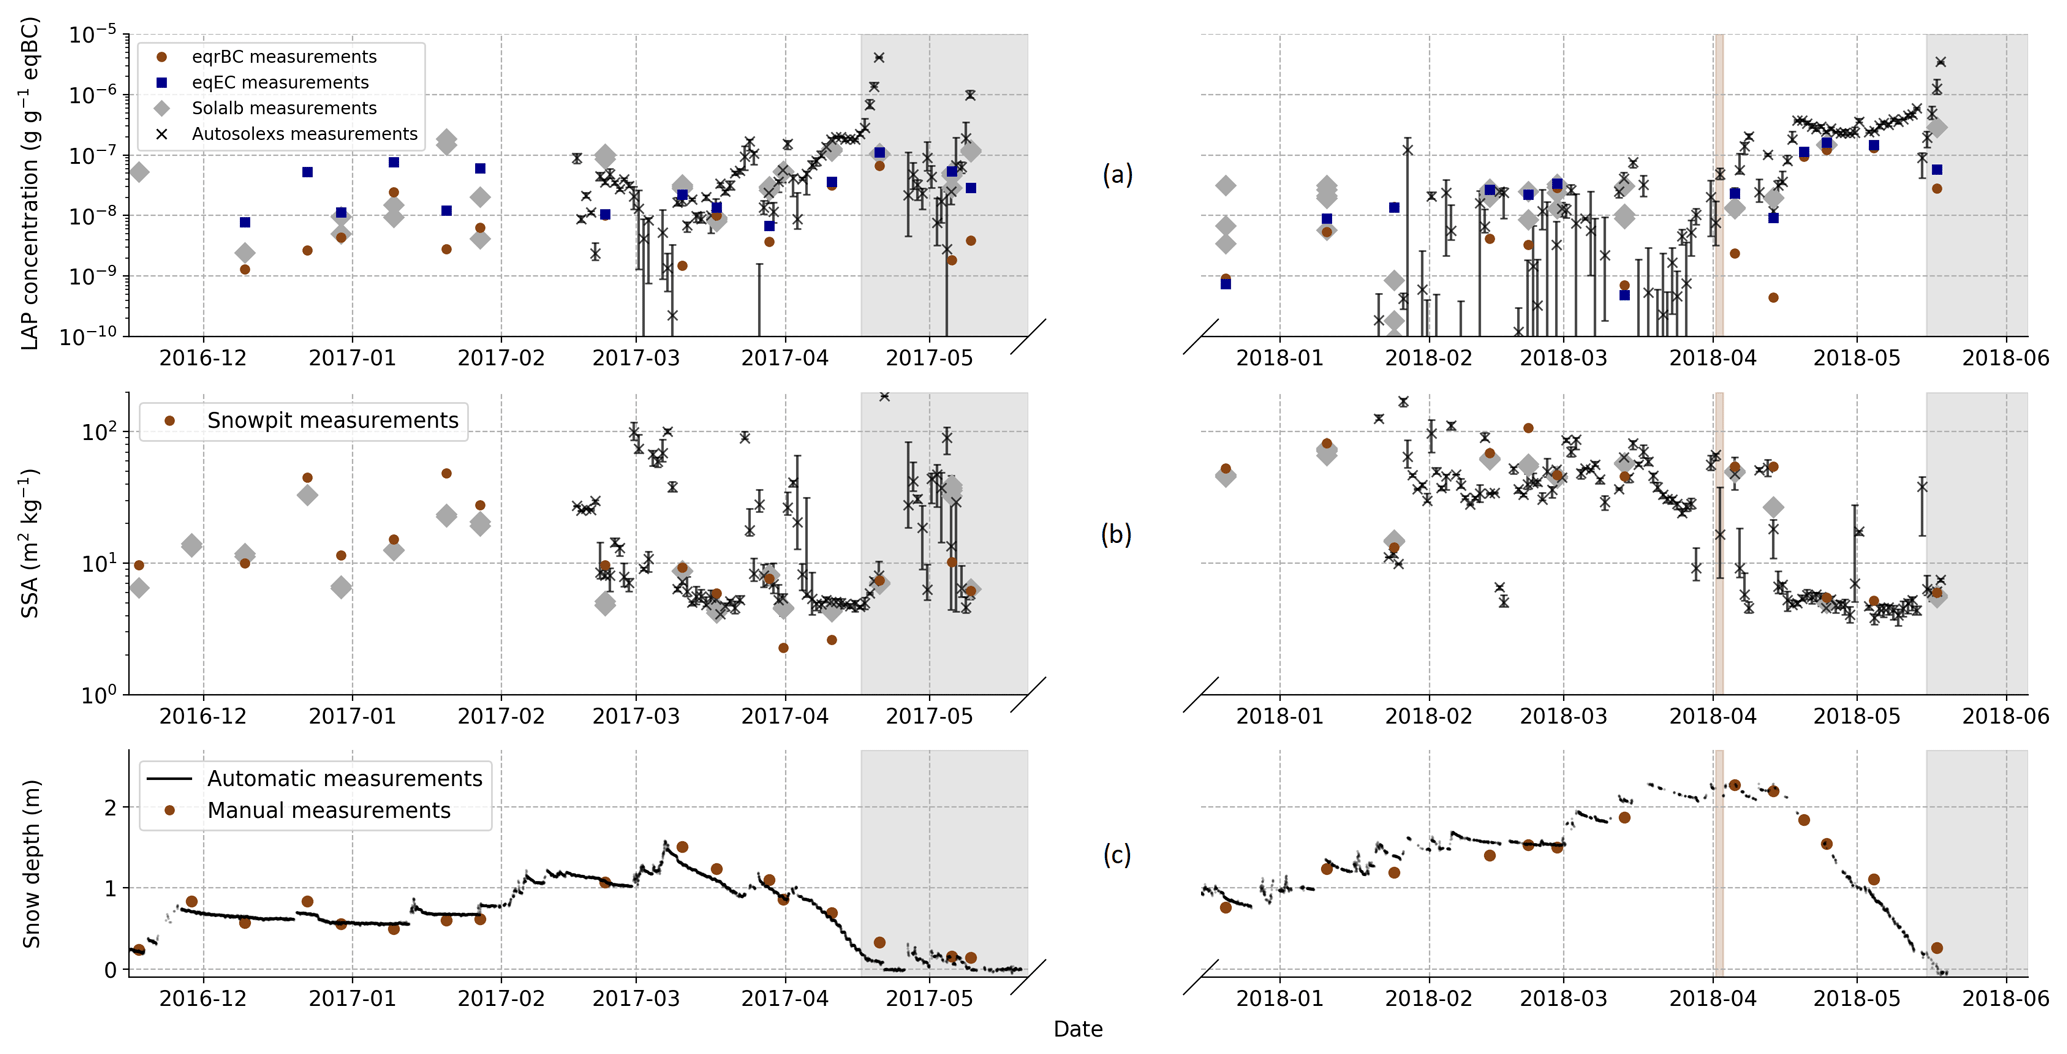
Figure 3Evolution of measured near-surface LAP concentrations (a), near-surface SSA (b) and snow depth (c). Information retrieved from automatic spectral albedo (Autosolexs) is represented by black crosses with error bars corresponding to the 25 % and 75 % quantile of all the measurements of the day. Information retrieved from manual spectral albedo (Solalb) is represented by grey diamonds. Snow pit SSA and eqrBC concentrations are represented by brown dots, and eqEC concentrations are represented by blue squares. The major dust deposition event of the second year is represented by the vertical brown shading.
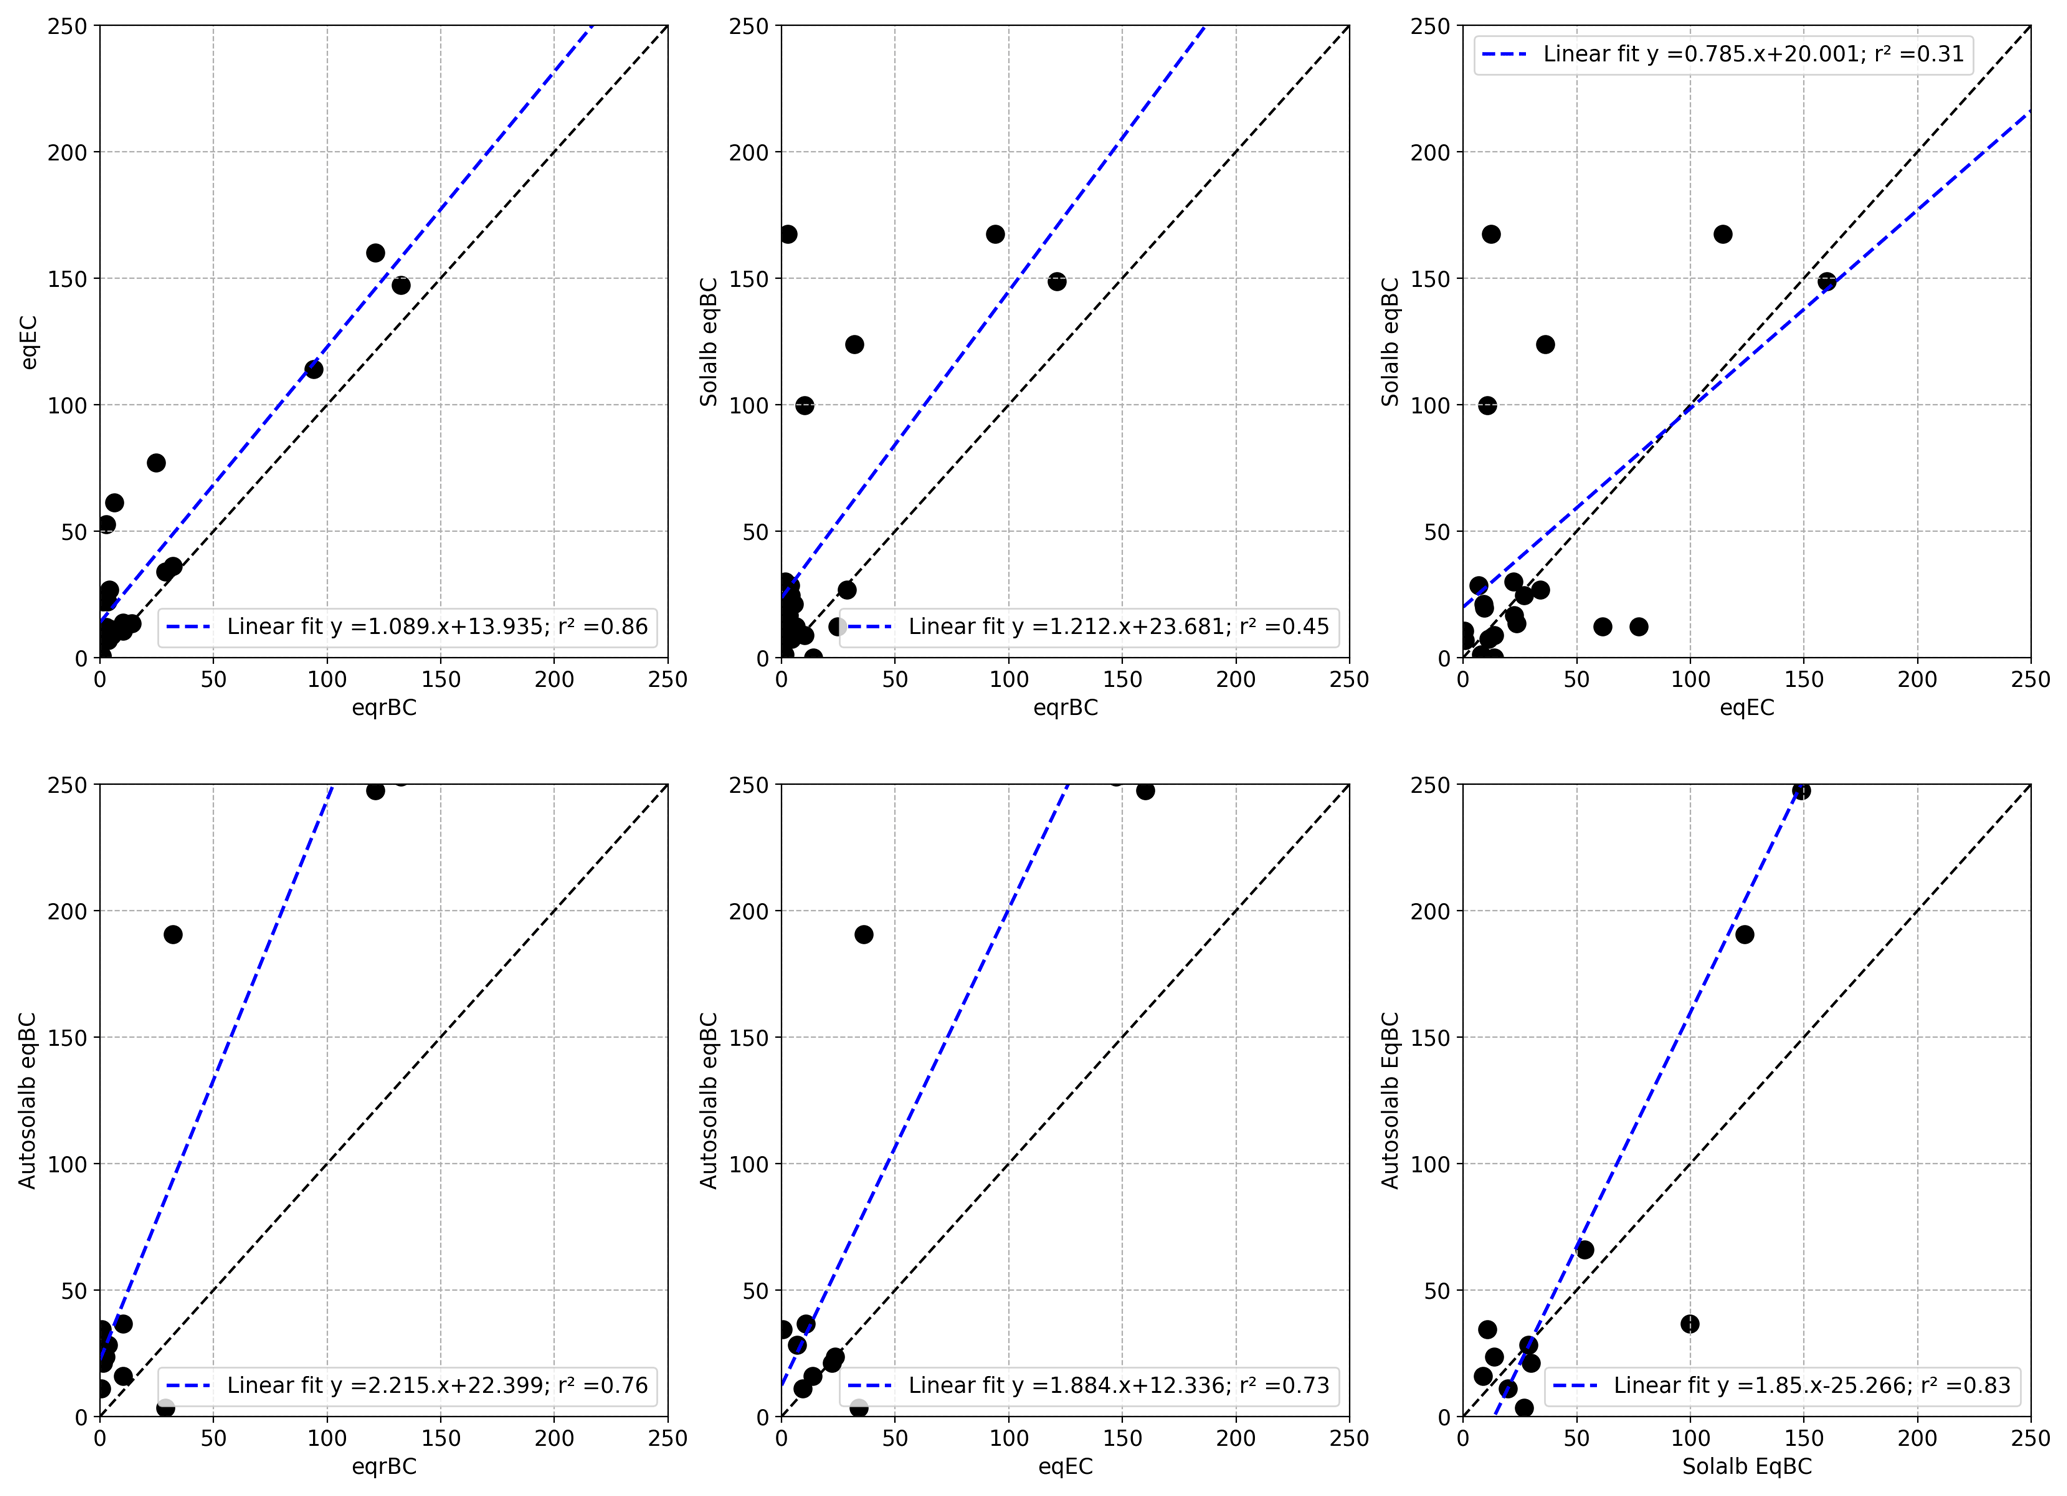
Table 1Comparison between the different measurements of eqBC concentrations. Each cell of the table contains the number of samples (N) used for the statistics, the RMSE, the bias and the Pearson linear correlation coefficient (r2) between the quantities named in the first column and row. The bias is computed as a difference between the quantity named in the column header and the quantity named in the row header. The values in italic correspond to the statistics from after the removal of the three outliers of the Solalb analysis.

Figure 3a presents the evolution of near-surface LAP concentrations. In general, a decrease in near-surface concentrations is observed after snowfalls, whereas an increase is observed during the melt periods. This surface enrichment is particularly marked at the end of the two snow seasons as the snowpack undergoes strong melt and as LAPs of the melting layers accumulate at the surface (e.g. Sterle et al., 2013). In the second year, a major dust deposition occurred at the beginning of April (brown shading) and was immediately buried by new snowfalls until it reappeared at the surface mid-April, contributing to the observed high LAP concentrations. Table 1 presents the RMSE, bias and Pearson linear correlation coefficients (r2) between different estimates of near-surface AECs, highlighting several conclusions.
-
Both eqrBC (rBC + dust) and eqEC (EC+dust) concentrations from chemical measurements show a good linear correlation (r2 ≃ 0.86), but eqEC is almost systematically higher than eqrBC. This bias is explained by the strong discrepancies between both BC measurement techniques illustrated in Fig. 4. This figure presents a comparison of EC and rBC concentrations for all available samples, including samples that are not close to the surface. Each point on this scatter-plot corresponds to a snow sample, and it appears that the EC concentrations are almost systematically higher than the rBC concentrations. Indeed, the ratio EC ∕ rBC has a mean value around 10 and ranges from 0.5 to 30. This means that BC concentrations obtained by the thermal-optical method are on average 1 order of magnitude higher than those obtained by laser-induced incandescence. Moreover, the ratio EC ∕ rBC does not feature a clear relationship with the dust concentration measured in the sample (represented by the colour of the points).
-
The AECs retrieved from Autosolexs show an equally good linear correlation with the LAP concentrations from both types of chemical measurements (r2≈0.75). Autosolexs AECs are systematically higher than chemical measurements, meaning that the measured concentrations are too low to explain the impact on albedo with our assumed MAE values. The difference is more pronounced for rBC measurements than for EC measurements, which is in line with the results of Fig. 4. The causes of these discrepancies are further discussed in Sect. 4.1. The linear correlation between Solalb AECs and chemical measurements is low (r2≈0.3 and 0.44 for eqEC and eqrBC, respectively). This is mainly due to 3 measurement days during the first season when Solalb AEC values are higher than 100 ng g−1 eqBC, while chemical measurements are lower than 50 ng g−1 eqBC. The cause of these three outliers is unknown. The values in italics in Table 1 correspond to the statistics computed without these outliers. Once these points are removed, the linear correlation is good (r2 ≈ 0.88 and 0.72 with eqrBC and eqEC, respectively). EqrBC concentrations are too low to explain both Solalb's and Autosolex's AECs. However, there is no significant bias between Solalb AECs and eqEC measurements. Two of the outlier days are before the beginning of Autosolexs measurements, which may explain why the correlation between Autosolexs and chemical measurements is not deteriorated.
It is noteworthy that all the Pearson correlation coefficients for AEC presented in Table 1 strongly decrease when the regressions are done logarithmically (not shown). The good linear correlation between the different AEC estimates mainly results from two clusters of points: a lower one, with points around 1 ng g−1 that are not distinguished from points around 10 ng g−1, and a higher one, with points featuring concentrations higher than 50 ng g−1. This result is not surprising as AEC estimations from spectral albedo are expected to have a poor accuracy for low concentrations (<10 ng g−1 approximately; e.g. Warren, 2013), explaining the low values of logarithmic correlations.
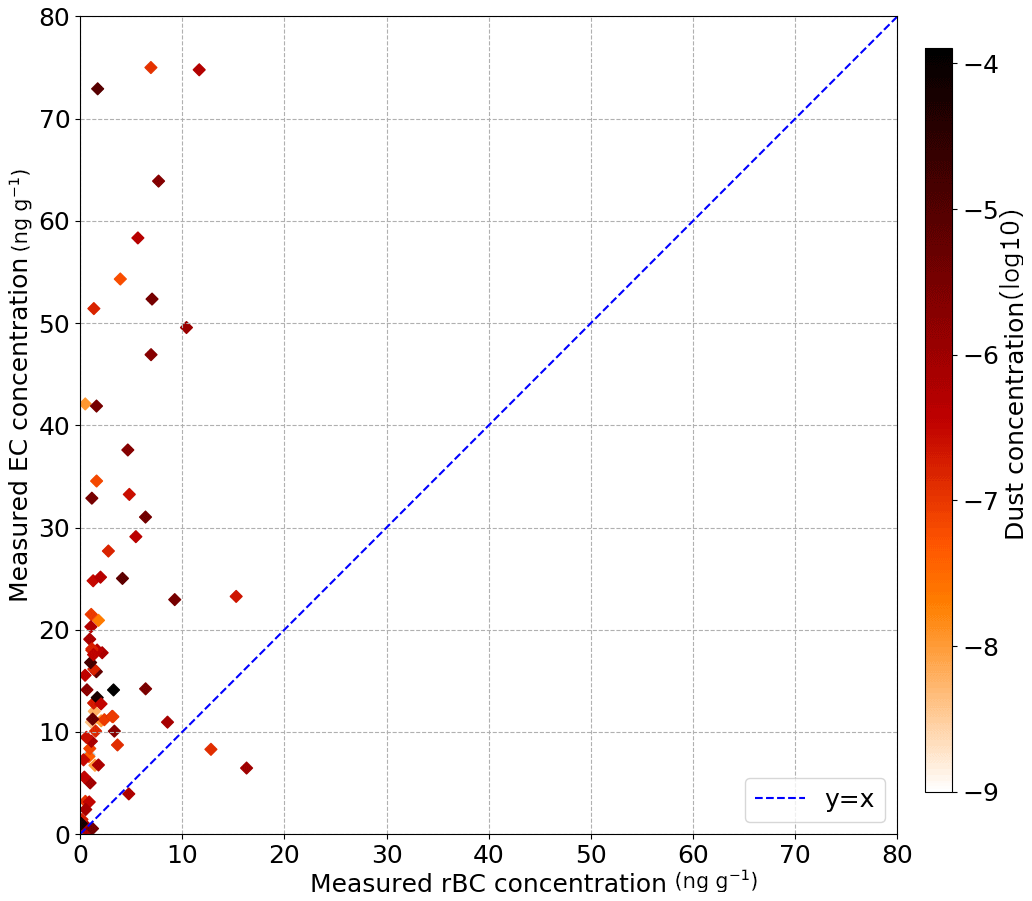
Figure 4Comparison between EC measurements and rBC measurements for all available measurements over the two snow seasons. As the vertical resolution of rBC measurements is higher than for EC measurements, the rBC concentration is computed as the average of all rBC measurements weighted by snow density in the corresponding EC layer.
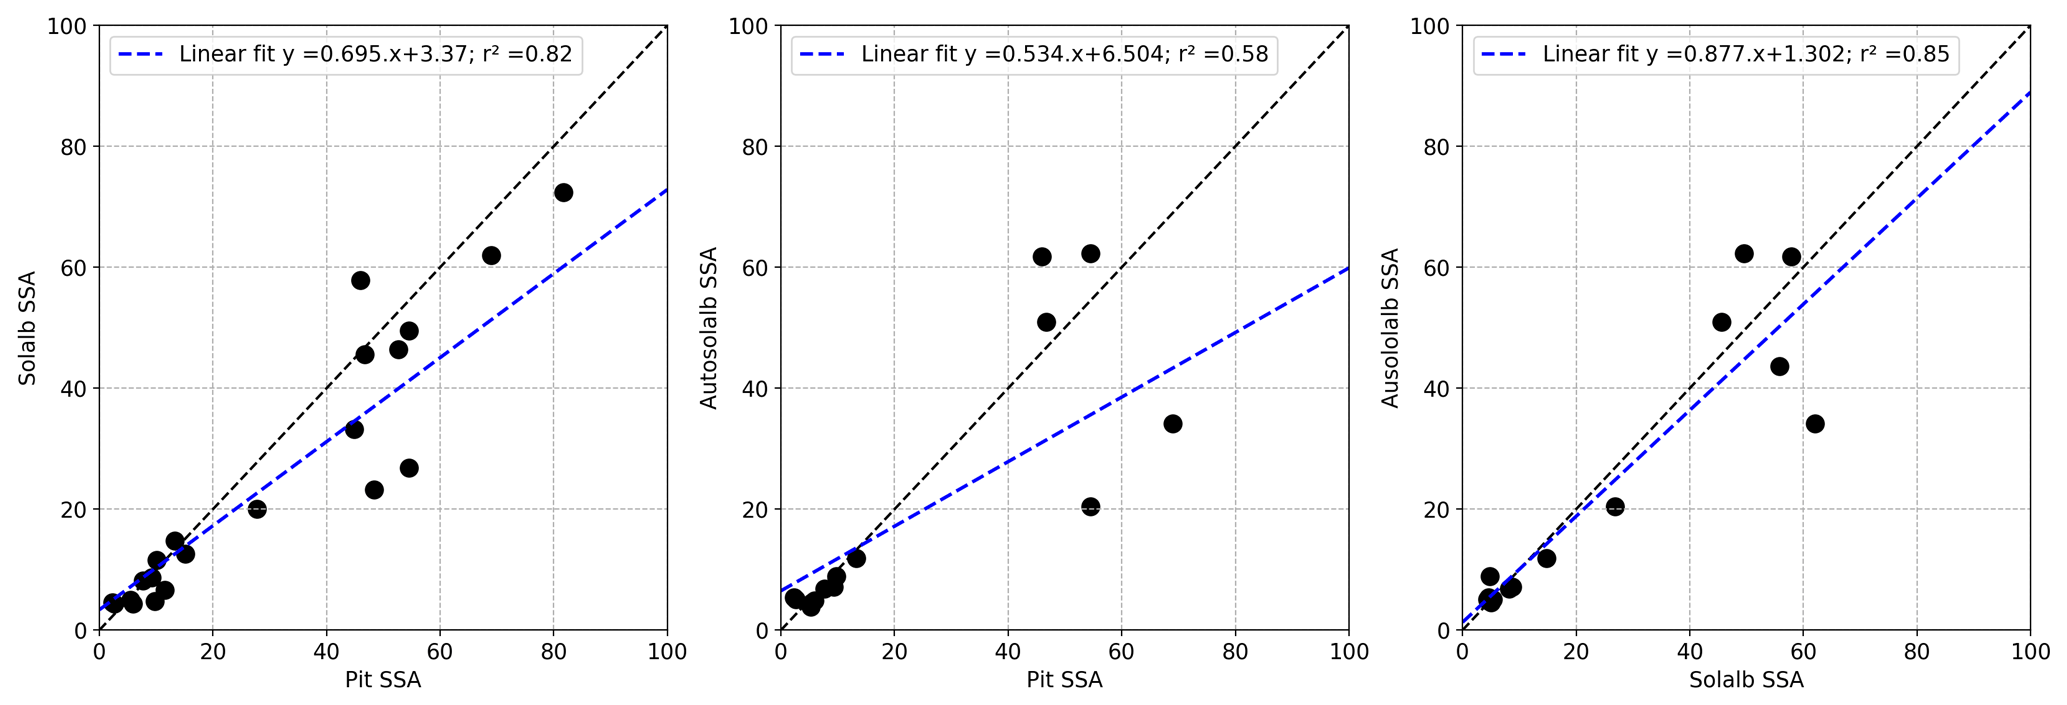
Figure 3b shows the evolution of measured and retrieved near-surface SSA. Higher SSA values are generally observed during the second snow season compared to the first one. High SSA values are usually observed for fresh and cold snow (Legagneux et al., 2002) that was rarely present at the surface during the 2016–2017 season owing to the warm and wet meteorological conditions of that season. The measured SSA correlates better with SSA retrieved from manual albedo (r2=0.82) than with the one retrieved from automated albedo measurements (r2=0.58). This may be explained by manual albedo measurements and SSA measurements being performed at the same place and for most of the time at a 1 h time interval, whereas automated albedos are collected up to every 20 m from the SSA measurements and are represented by the daily median.
3.3 Ensemble simulations
Figure 5a and b show, respectively, the near-surface AEC and SSA simulated at noon compared to field measurements. For the sake of clarity, simulations were only compared to a single source of measurement: the automated spectral albedos from Autosolexs. We chose Autosolexs because (1) it measures the quantity of interest for this study (the radiative impact of LAPs) and (2) it has a higher temporal resolution than the manual measurements. All the statistics presented in this section do not account for values in the grey-shaded area, for which the measured automatic snow depth is lower than 20 cm to ensure that Autosolexs' measurements are not influenced by the ground.
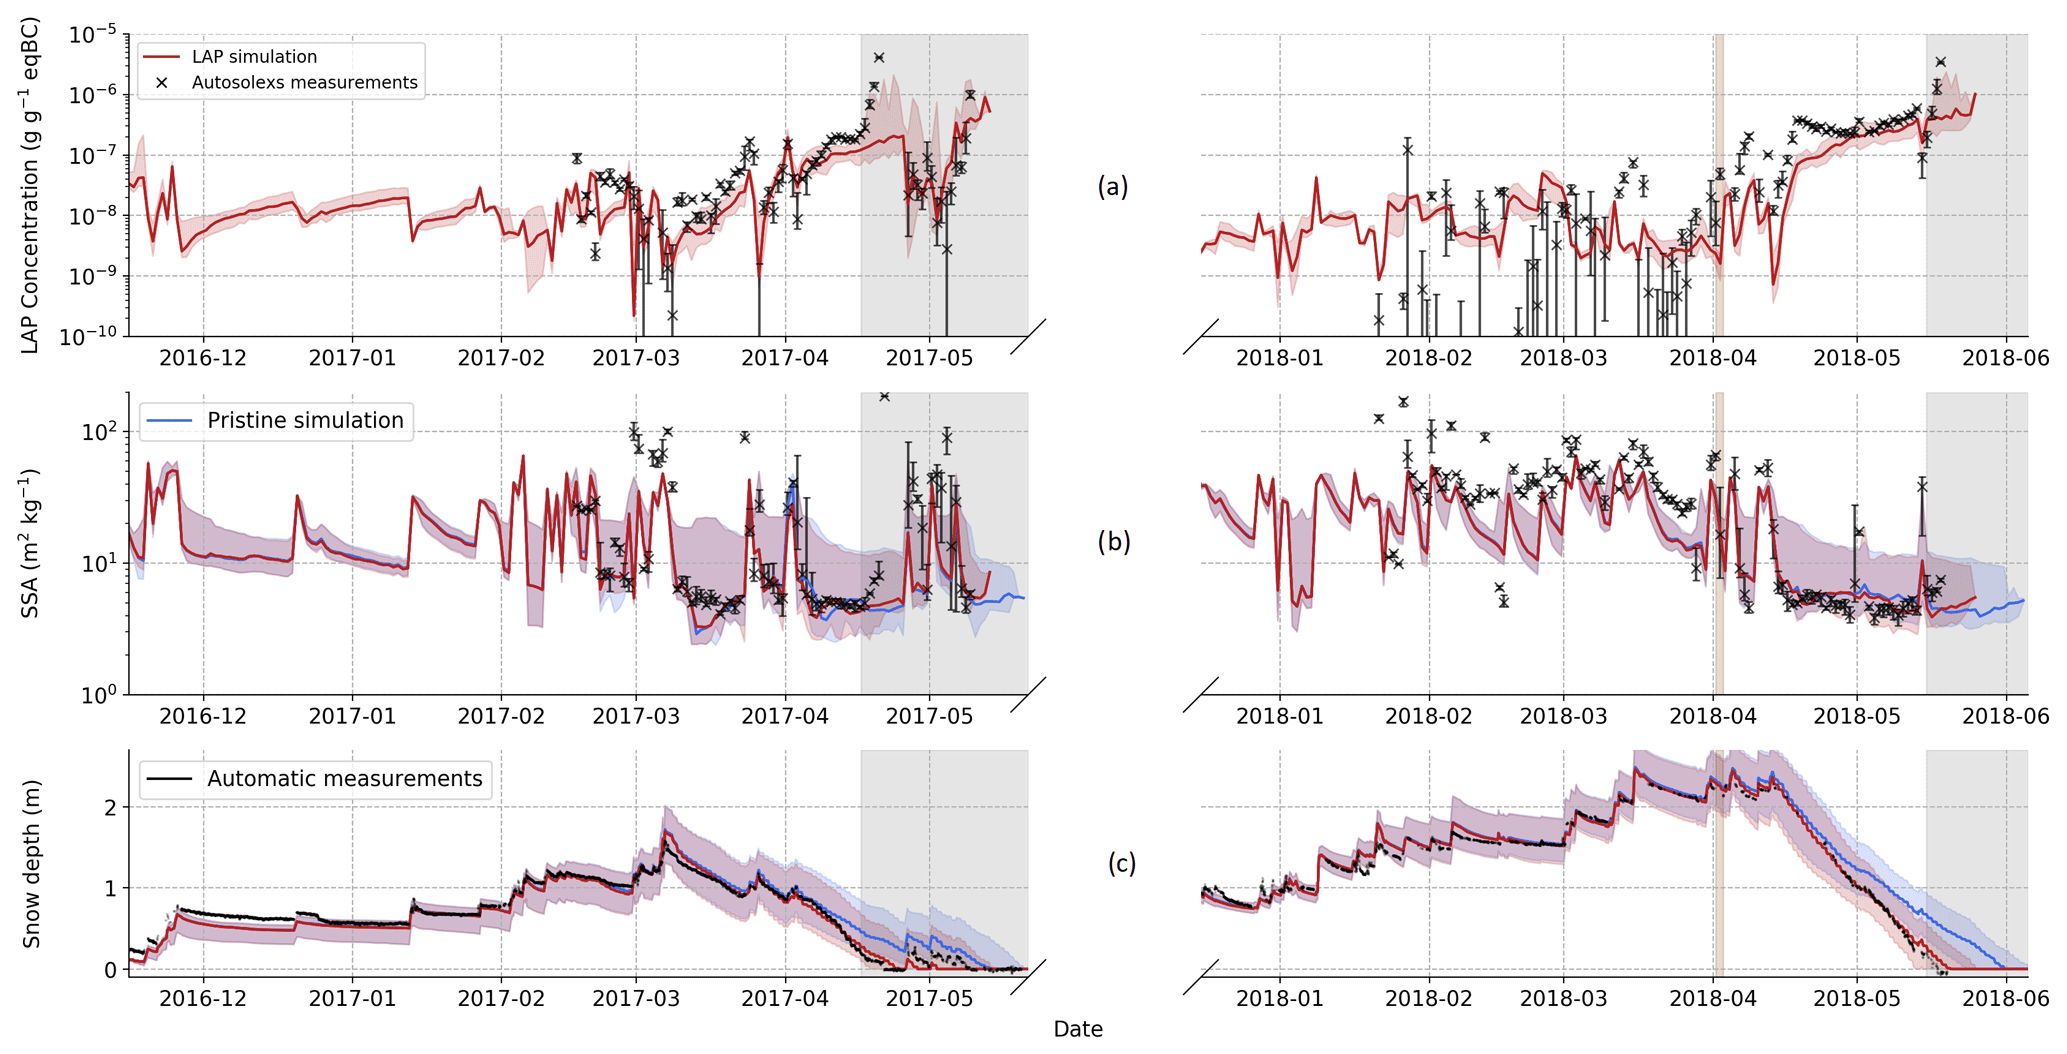
Figure 5Evolution of measured and simulated near-surface AEC (a), near-surface SSA (b) and snow depth (c). Ensemble simulation results are represented with a shading, and the median value of the different simulations is represented with a full line. The information retrieved from automatic spectral albedo (Autosolexs) is represented by black crosses with error bars corresponding to the 25 % and 75 % quantile of all the measurements of the day. The major dust deposition of the second year is represented by brown shading, and grey shading corresponds to areas with less than 20 cm of measured snow depth.
Figure 5a shows the evolution of near-surface AECs estimated from Autosolexs and simulated by the LAP ensemble. The simulated AEC median is correlated with the AEC retrieved from Autosolexs (r2≃ 0.78), meaning that temporal variations of near-surface AEC are generally well reproduced despite periods with lower agreement (e.g. March 2018). The simulated LAP absorption is lower than that estimated from Autosolexs with an AEC bias of around 31 ng g−1. This means that the median LAP absorption in our simulation is slightly underestimated by our modelling framework. The agreement between the ensemble simulations is lower in April 2018 just after the strong Saharan dust deposition, which is discussed in Sect. 4.2.3. The relative dispersion of near-surface LAP concentrations in the ensemble is moderate, which is not surprising because the LAP deposition fluxes and their evolution laws within the snowpack are not perturbed.
Figure 5b shows the evolution of measured and simulated near-surface SSA. The temporal patterns of SSA evolution are generally well captured by the model. For SSA lower than 15 m2 kg−1, there is no significant bias between Crocus SSA and the measurements except for a short period in mid-March 2017. However, for higher SSA values, there is a systematic bias between Crocus and measurements, with Crocus systematically predicting lower SSA values. This bias may be explained by Crocus' parameterisation of fresh snow SSA which is set to never exceed 65 m2 kg−1, whereas values up to 105 m2 kg−1 were measured in the field. It is noteworthy that there are no significant SSA differences between the simulations with and without LAPs. Finally, the dispersion of near-surface SSA within the ensemble is significant for low SSA values, which sometimes vary from 5 to 20 m2 kg−1 depending on the member. This dispersion is explained by the three different metamorphism laws used in ESCROC, together with the indirect effects of the other perturbed processes.
Figure 5c shows the evolution of simulated and measured snow depth over the two snow seasons. There is no significant impact of LAPs on snow depth evolution before the beginning of the ablation phase – i.e. 6 March for the first year and 13 April for the second one. Over this period, both the pristine and the LAP simulations reproduce well the measured snow depth with an RMSE of ≈6.5 cm. This is expected as the precipitation forcing was adjusted to fit the snow depth data as used here for the evaluation. Nevertheless, the snow depth observed in the measurements during the ablation phase is better reproduced by the LAP simulation than by the pristine simulation (RMSE ≈ 5.8 and 17.2 cm for the median of LAP and pristine simulation, respectively, in this period) because the melt rate is underestimated by the pristine simulation. The dispersion of the ensemble is high in both simulations, with snow depth varying by up to 0.8 m depending on the member.
3.4 LAP radiative impacts and consequence on melt
Figure 6a shows the daily RF (in W m−2) of LAPs estimated from ensemble simulations, which increases with time during each snow season as more short-wave energy becomes available from winter to spring. It becomes particularly important during the final ablation phase (Fig. 6c) with the enrichment of LAPs at the surface of the snowpack. This trend is modulated by snowfalls that lead to lower surface eqBC concentrations and cloud cover that lowers the amount of incoming radiation. The seasonal RF of LAPs, computed as the sum of all daily RFs, is 1.33 times higher for the second season than for the first one. This is due both to the later triggering of the melt-out phase (and hence occurring with higher solar radiation) and to the higher eqBC concentrations (Fig. 5a). The maximum daily RF values of LAPs are estimated to be around 38.2 and 55.8 W m−2 for the first and the second year, respectively. Hourly values of the RF (not shown) peak at 125 and 215 W m−2 for the first and the second year, respectively. During the period with significant RF (April 2017, April 2018 and May 2018), the AECs estimated from Autosolexs measurements are within or slightly above the concentrations simulated by our ensemble (Fig. 5). This means that the simulated RFs, presented here, are expected to be representative of Autosolexs measurements or slightly underestimated.

Figure 6(a) Evolution of daily radiative forcing (RF) due to LAPs. This RF is computed as the difference of energy absorbed by the snowpack between the LAP and pristine simulations. (b) Evolution of the daily fraction of the indirect impact (rind). The opaque shading corresponds to the ensemble members between the first and third quantile, while the light shading is the full ensemble spread. (c) Simulated snow depth for the pristine and the LAP simulations. The major dust deposition event of the second year is represented by brown shading.
Figure 6b shows the evolution of the fraction of the RF of LAPs coming from the indirect impact. The lightest envelope corresponds to all the members, while the darkest one corresponds to the first and third quartiles, disregarding the impact of outliers. The indirect impact of LAPs strongly varies with time and can be either positive or negative. For both snow seasons, the indirect impact cumulated over the whole season is close to zero (−1 % and +1 % of the total RF for 2016–2017 and 2017–2018 seasons, respectively). This result is further discussed in Sect. 4.2.2.
Figure 7 shows the evolution Δtmelt-out – i.e. the number of days by which the snow season is shortened – as a function of the melt-out date of the pristine simulation expressed in day of year (DOY). Each point corresponds to a member of the ensemble simulations. The median Δtmelt-out is represented by the horizontal lines for each season. Δtmelt-out is, respectively, 10 and 11 d for the first and the second snow season. For the first snow season, Δtmelt-out varies widely with the model configuration, with most values ranging from 7 to 20 d. For the second snow season, Δtmelt-out exhibits a small dependency on the model configuration with most values between 8 and 12 d. So the upper estimate of Δtmelt-out is higher for the first year (20 d) than for the second one (12 d), whereas LAP RF is higher for the second year. This counter intuitive result is further discussed in Sect. 4.2.1.
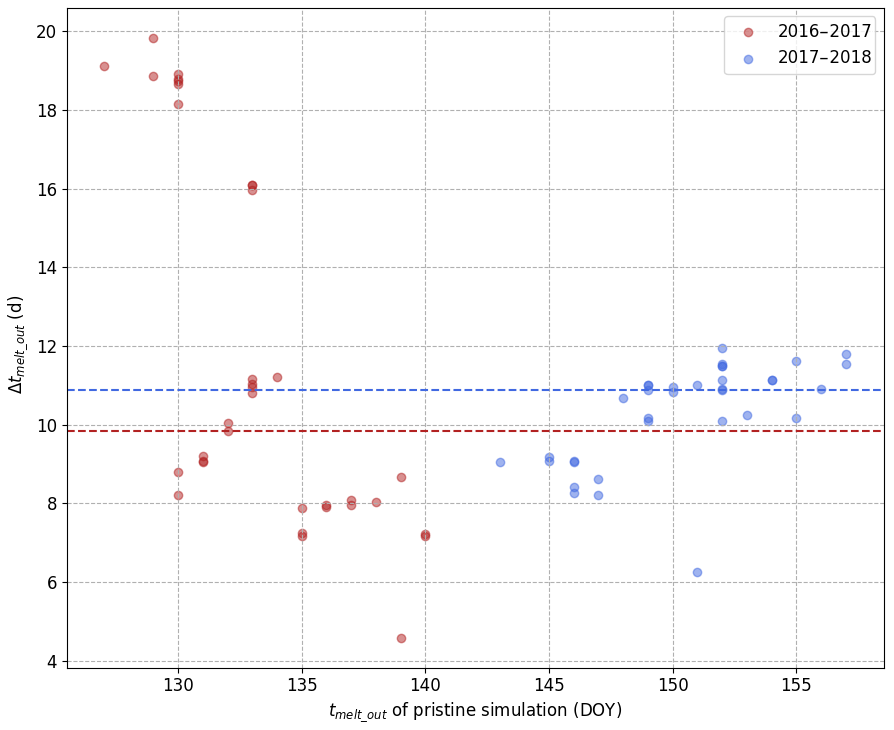
Figure 7The Δtmelt-out values as a function of the date of melt of the pristine simulation for each of the 35 members and each year.
3.5 Apportionment between BC and dust impacts
Understanding the distribution of the direct RF between dust and BC is of importance to model LAP impacts (Skiles et al., 2018) especially at the end of the snow season when this RF is maximal. For both seasons, the RF of LAPs remains low (<5 W m−2 daily RF) until the final ablation phase – occurring after the peak of snow accumulation for both seasons (Fig. 6a). Figure 8a shows the evolution of η, i.e. the proportion of the RF of LAPs attributed to dust during the final ablation phase.
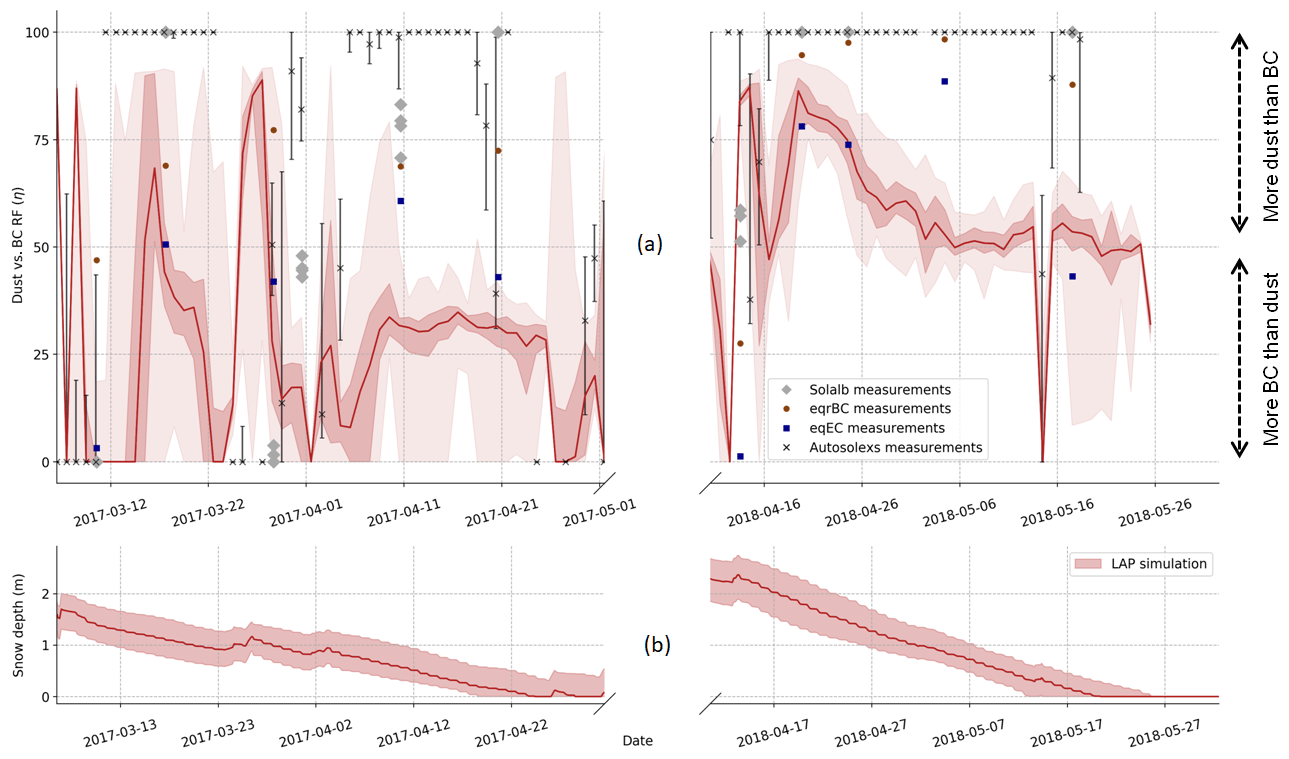
Figure 8(a) Percentage of the LAP total RF which is caused by dust (η) during the final ablation period. The η values estimated from the LAP simulation are represented in red, with light shading corresponding to the full ensemble and darker shading corresponding to the first and third quartiles of the ensemble. Information retrieved from automatic spectral albedo is represented by black crosses with error bars corresponding to the 25 % and 75 % quartiles of all the measurements of the day. Information retrieved from manual spectral albedo is represented by grey diamonds. Chemical measurements of eqEC (EC+dust) and eqrBC (rBC+dust) are represented by dark blue and brown, respectively. The results are put in comparison to the snow depth (b).
In the simulations, less impact is attributed to dust for the first year (median around 35 %) than for the second one (median around 55 %). This is mainly due to the major dust deposition at the beginning of April 2018 that outcrops on 19 April resulting in a high η value of around 85 %. A clear conclusion is hard to draw for the measurements because of the strong discrepancies between the different estimates of η. First, Autosolexs retrieval attributes the whole impact either to BC or to dust with few intermediate η values. The only information detected is whether dust or BC dominates LAP absorption with no precise quantification of η. Second, the values of η estimated from chemical measurements are higher for eqrBC than for eqEC due to the strong discrepancy between both BC measurements (Fig. 4). The η values corresponding to eqEC are generally closer to simulated values rather than when they are obtained from rBC values. Considering all measurements together, it seems that dust contributes more to the impact of LAPs during the second season than during the first one, which is in agreement with Crocus simulations. However, simulated η values are almost systematically lower than any measurement over both seasons, meaning that too much impact is attributed to BC in the simulation.
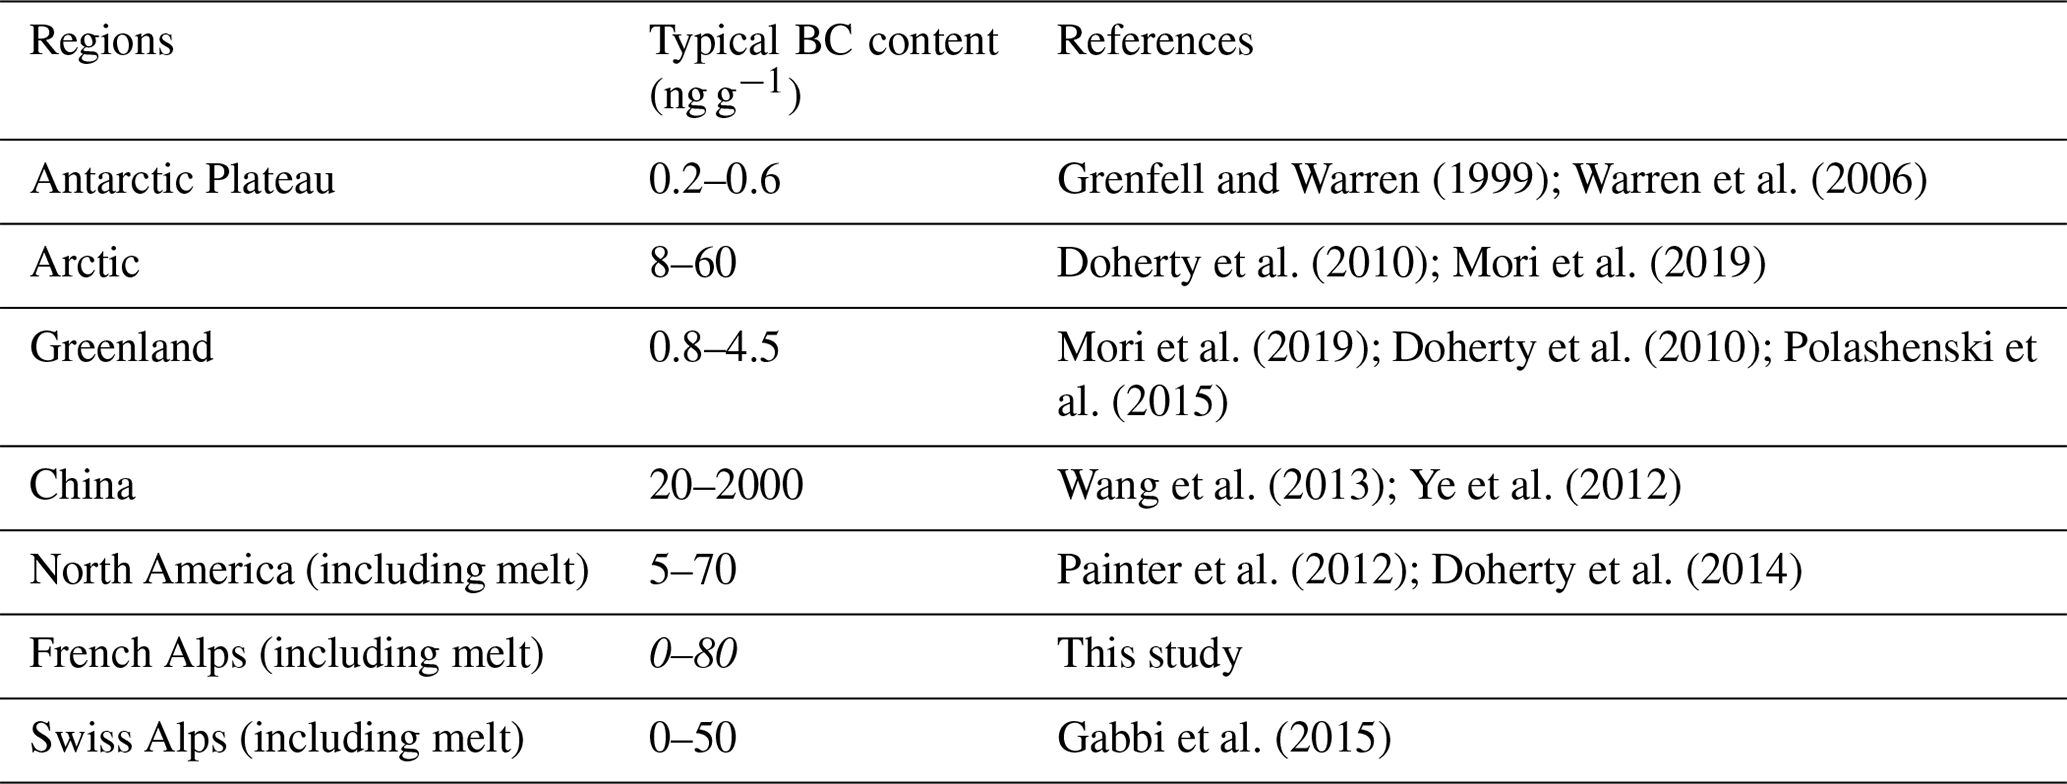
The previous section presents a comparison between different measurements of near-surface SSA and near-surface LAP concentrations. Table 2 presents a brief comparison of the surface BC concentrations measured in our dataset with results of previous studies in other regions of the world. As highlighted in previous studies (e.g. Mori et al., 2019), our BC data highlight large discrepancies between EC and rBC measurement methods, pointing out an issue in our understanding of the related processes. This issue is of particular importance in linking chemical concentrations of LAPs to their absorption, as discussed in Sect. 4.1. As MAE uncertainties are already extensively discussed in Tuzet et al. (2019), the focus is placed here on the chemical measurements. The measurements are then compared to ensemble snowpack simulations performed with Crocus. The modelled near-surface AECs are in good agreement with automated albedo observations, meaning that LAP absorption is correctly simulated. Despite the strong difference of RF between the two seasons, the median Δtmelt-out values are similar for both seasons (10 and 11 d, respectively; Sect. 4.2.1). Finally, the seasonal average of LAPs' indirect impact is negligible for both snow seasons, contrary to what was observed in previous studies (Tuzet et al., 2017; Skiles and Painter, 2019; Sect. 4.2.2).
Grenfell and Warren (1999); Warren et al. (2006)Doherty et al. (2010); Mori et al. (2019)Mori et al. (2019); Doherty et al. (2010); Polashenski et al. (2015)Wang et al. (2013); Ye et al. (2012)Painter et al. (2012); Doherty et al. (2014)Gabbi et al. (2015)Table 2Typical surface concentration of black carbon measured in different regions of the world. The result of this study are presented in italic.
4.1 On chemical measurements in snow
Figure 3 points out a marked bias between eqrBC concentrations and AEC retrieved from spectral albedo measurements; the chemical concentrations are lower. This suggests that the eqrBC concentrations measured chemically in the snowpack are too low to explain the observed LAP absorption under state-of-the-art assumptions about BC MAE. These findings confirm those of Doherty et al. (2016) and Tuzet et al. (2019).
From atmospheric science, we know that MAE values determined from experiments strongly depend on both concentration and absorbance measurement techniques (e.g. Salako et al., 2012; Chan et al., 2011, 2010; Zanatta et al., 2016; Ram and Sarin, 2009; Venkatachari et al., 2006). For instance, Chan et al. (2010) suggest that the MAE of BC ranges from 2 to 6 m2 g−1 when determined from EC concentrations against 8 to 55 m2 g−1 when determined from rBC concentrations (Chan et al., 2011). Watson (2005) indicates similar differences of about 1 order of magnitude.
In our case, the observed bias between AEC from spectral albedo and chemistry is significantly reduced when using eqEC measurements instead of eqrBC (Fig. 3a). This is not surprising given the significant bias between eqrBC and eqEC concentrations (Table 1). When focusing on the two types of BC measurements, it appears that for all valid snow samples of our dataset, EC measurements are 10 times higher than rBC measurements on average, but EC ∕ rBC ratios range from 0.5 to 30 depending on the sample (Fig. 4). Similar findings have recently been highlighted for Arctic snow in Mori et al. (2019), although to a lesser extent. The rBC measurements with an unmodified SP2 instrument (such as used here) are potentially biased low because of the limited size range observed (<600 nm). Conversely, filtration-based thermal-optical EC measurements are known to favour particle sizes greater than 600 nm (Lim et al., 2014). In our case, the latter problem is largely minimised by the introduction of a coagulation step prior to filtration (Torres et al., 2014) which increases filtration efficiency to above 90 %. This extra coagulation step is usually not implemented, which may explain why the EC ∕ rBC ratios are higher in our case compared to previous studies. This calls for a more systematic comparison of rBC vs. EC measurements.
This suggests that the value of BC MAE can not be chosen independently of the measurement technique used for BC. The value used in the present study (11.25 m2 g−1 at 550 nm) is well adapted for EC but too low for rBC. Similar issues are likely to affect dust measurements, which could explain the divergence between optically estimated AEC and both chemical concentrations at the end of the 2017–2018 snow season (when all the estimates of η vary from 90 % to 100 %). This issue comes on top of the strong variability reported for LAP absorption efficiency and makes it very challenging to link LAP chemical concentrations to their radiative impact.
4.2 On the impact of LAP on snow cover evolution
4.2.1 Variability of Δtmelt-out
Figure 6 shows the evolution of the RF of LAPs over the two snow seasons. The maximum values of daily and instantaneous RF, around 50 and 200 W m−2, respectively, are in the range of the maximum values for Europe that have recently been put together in the complete review of Skiles et al. (2018). The seasonal radiative forcing of LAPs during the second snow season is higher than during the first one by a factor of 1.33. Nevertheless, the median advance of melt-out date due to LAPs is close for both seasons (Fig. 7). Surprisingly, the maximum Δtmelt-out estimated for the first season (20 d) is much higher than for the second one (12 d). These contradictory facts can be reconciled by considering the differences in meteorological conditions between the two snow seasons. Indeed, during the first snow season, two small snowfalls occurred at the beginning of May (Fig. 2a) which deposited ≈ 40 kg m−2 of snow water equivalent according to all the members of the pristine simulation. In contrast, for the LAP simulation, the evolution of these snowfall events strongly varies from one member to another depending on whether the simulated snowpack has already totally melted out at the beginning of May or not. If the two snowfalls are deposited on bare ground, all or part of the snowfall does not hold on the ground depending on the member. All Δtmelt-out higher than 15 d correspond to members in which both snowfalls immediately melt, leaving the ground bare. Conversely, for members in which the snowfalls are deposited on top of an existing snowpack in LAP simulations – for which the pristine simulation melts after the DOY 135 (15 May) – the median impact is around 8 d, which is in better agreement with the difference of RF between both sets of years. The intermediate cases correspond to a partial melt of the snowfalls deposited on the ground. These different scenarios explain the high variability of Δtmelt-out observed for the first snow season. The lower variability of Δtmelt-out between the configurations for the second snow season is explained by the continuity of the snow cover until the end of the season for all members. These findings highlight the necessity of accounting for the complex interplay between LAP dynamics in the snowpack, meteorological conditions and the snowpack–ground interactions to accurately estimate LAP impact on melt.
4.2.2 Indirect impact
Previous studies have shown that the indirect impact of LAPs – caused by the enhancement of SSA decrease due to the direct RF of LAPs – represents around 20 % of LAP total RF (e.g. Tuzet et al., 2017; Skiles and Painter, 2019). Over the two years considered here, there is no clear influence of the indirect impact of LAPs. Integrated over the season, the median portion of the RF of LAPs coming from the indirect impact are around −1 % and +1 % for the first and second year, respectively. Furthermore, the strong dispersion of the ensemble indicates that the diagnostic is highly sensitive to the parameterisation of other physical processes in the snowpack model. It is hence of particular importance to account for modelling uncertainties to investigate this process. The negative impact that may be surprising at first can be explained by the outcropping of a sub-surface layer with a higher SSA than the surface layer when Crocus' uppermost layer completely disappears due to melt. In the LAP simulation, LAPs can enhance the melt of the uppermost layer, and, in some cases when the underlying layer has a higher SSA, the outcropping of this high SSA layer occurs earlier than in the pure snow simulations. In this case, the energy absorption can be higher for the pristine simulation (higher surface SSA) than for the indirect simulation (lower surface SSA).
The decrease in SSA induced by LAPs is particularly important when snow has a high SSA and, at the same time, contains a large concentration of LAPs (Tuzet et al., 2017). These conditions were rarely observed over the two seasons considered here (Fig. 5). ROS events and the warm temperatures of the first year maintained low surface SSA values during a major part of the season. During the second season, the only period with high LAP concentrations (>50 ng g−1 eqBC) and high SSA values (≈40 m2 kg−1) is around 15 March 2018. During the two following weeks, the indirect impact of LAPs was around 15 %–20 %. These findings suggest a strong dependence of the indirect impact of LAPs on both meteorological conditions and LAP deposition. Under the conditions observed during the two seasons studied here, the indirect impact of LAPs is particularly inefficient.
4.2.3 BC vs. dust
Figure 5a highlights a strong underestimation of near-surface concentrations of LAPs around 20 April 2018. This period corresponds to the outcropping of a layer containing dust from the major deposition that occurred 2 weeks before. During the following weeks, the measured concentration remained stable, while the simulated concentration continued to rise significantly before finally reaching the measured values. During the same time (20 to 30 April), the value of η – i.e. the proportion of LAP absorption caused by dust – decreases noticeably (Fig. 8a). This feature suggests that the strong dust deposition at the beginning of April is underestimated by ALADIN-Climate and that the match between measured and simulated concentrations at the end of the season is due to compensation by BC. This confirms the findings of Tuzet et al. (2017) who show that major Saharan dust deposition events are underestimated by ALADIN-Climate. More generally, at the end of both seasons, all η values measured are higher than the simulated ones. This means that the good agreement between measured and simulated AEC is due to compensation between the overestimation of BC deposition and the underestimation of dust deposition, reinforcing the hypothesis of Tuzet et al. (2017). As a consequence, care should be taken when extending the conclusions of this study to other regions.
This study provides an analysis of a unique dataset collected at the Col du Lautaret (2058 m a.s.l., French Alps) site during two snow seasons featuring contrasting meteorological conditions. This dataset comprises automated measurements of spectral albedo and meteorological variables, as well as 30 d of manual measurements of spectral albedo, and vertical profiles of physical and chemical snow properties. Spectral albedo measurements are first processed to estimate near-surface SSA and AEC of the snowpack. Then the estimates are compared to the snow pit measurements. Near-surface SSAs retrieved from spectral albedo measurements and measured in the snow pit are overall in good agreement. However, our dataset highlights strong discrepancies between different chemical measurement techniques for BC, with a mean EC ∕ rBC ratio being around 10 on average and ranging from 0.5 to 30. These results underline the need to better understand what is precisely measured by each chemical measurement technique in snow and how to relate each type of measurement to its radiative impact. Indeed discrepancies between chemical measurements and radiative retrievals from spectral albedo are reduced by using EC measurements rather than rBC measurements under our assumption of BC MAE (11.25 m2 g−1 at 550 nm). This issue is particularly critical for studies focusing on the impact of BC on Arctic and Antarctic snow because in these regions, the BC concentrations are often too low to be detected from reflectance measurements. Further studies should aim at comparing the different methods of LAP concentration measurements in snow with concomitant measurements of the induced absorption, as has been done for BC in atmospheric sciences. Moreover, Bergmann et al. (2019) have recently shown the presence of microplastics in snow in remote snow-covered areas. We thus recommend further work to determine if this new type of particle in snow (1) has a significant radiative impact and (2) affects uncertainties of other LAP concentration measurements.
This dataset is also compared to ensemble snowpack simulations performed with the Crocus detailed snowpack model. Two ensemble simulations are performed, one assuming that no LAPs are deposited on the snowpack and another one using BC and dust deposition fluxes from the ALADIN-Climate atmospheric model. This simulation framework makes it possible to isolate the impact of LAPs on snowpack evolution while accounting for modelling uncertainties. Near-surface properties of Crocus simulations are in good agreement with measured values except for a marked SSA bias for high SSA values. This bias is probably due to the parameterisation of the SSA of fresh snow in Crocus. Near-surface LAP concentrations computed by ensemble simulations using ALADIN-Climate as a deposition forcing are in good agreement with automated spectral albedo measurements. The temporal evolution and the extreme values at the end of the season are correctly simulated. The radiative impact is hence expected to be captured by our simulations even if strong dust deposition events seems to be underestimated, as hypothesised in Tuzet et al. (2017).
By comparing the pristine simulation to the LAP simulation, the RF of LAPs is estimated with maximal values of 58 and 215 W m−2 for daily averaged and instantaneous RF, respectively, over the two seasons. The RF of LAPs is higher for the second snow season which was affected by a major dust deposition event, but the median impact on snow cover duration is similar for both seasons: 10 and 11 d, respectively. This is due to complex interactions between meteorological conditions and snow–LAP synergy especially for the first year when the LAP on the duration of snow cover varies from 5 to 20 d depending on the model configuration. Even though the LAP concentrations are similar in each member of our ensemble, there are strong differences in terms of snow cover duration due to modelling uncertainties. This highlights the need to better constrain snowpack modelling by assimilating observations, for example. As our ensemble framework accurately represents the evolution of visible (AEC concentrations) and near-infrared (SSA) reflectances, it would provide a reasonable first guess for further assimilation of optical satellite reflectance – at least at the studied location for these two particular seasons. An analysis over a longer period and at a larger scale would be needed to extend our findings.
Lastly, our results show that the indirect impact of LAPs – i.e. the enhancement of snow metamorphism induced by LAPs – is negligible. These findings for the two particular snow seasons studied here at the Col du Lautaret study site differ from the results of previous studies by estimating this impact to be around 15 %–20 % of LAP total RF. Here strong LAP concentrations near the surface of the snowpack only occur when SSA is already low, explaining the inefficiency of the indirect impact. This suggests that the seasonal indirect impact depends on meteorological conditions and on the timing of LAP deposition on the snowpack. Hence, it is necessary to explicitly account for the coupling between LAP deposition and snowpack evolution in reproducing the spatio-temporal variability of LAP indirect impact. This could not be captured with simple snow modelling approaches.
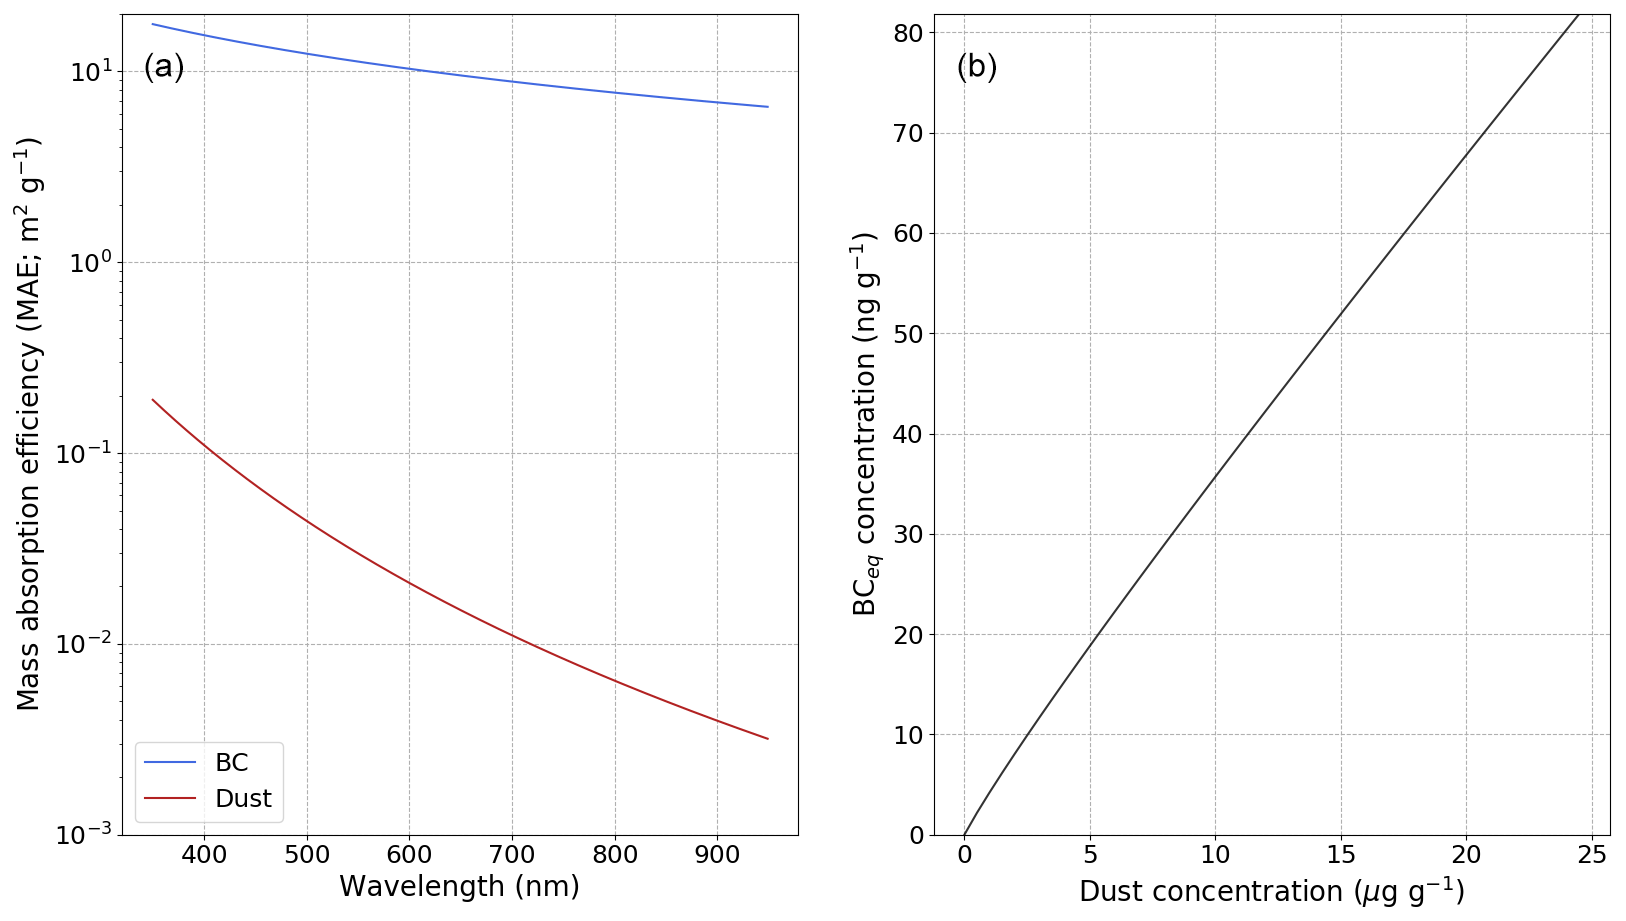
Figure A1(a) Mass absorption efficiency (MAE) values of BC and dust used in the present study as a function of wavelength. (b) EqBC concentration corresponding to a given dust concentration using these MAE values and the methods described in Sect. 2.4. The figure is adapted from Tuzet et al. (2019).
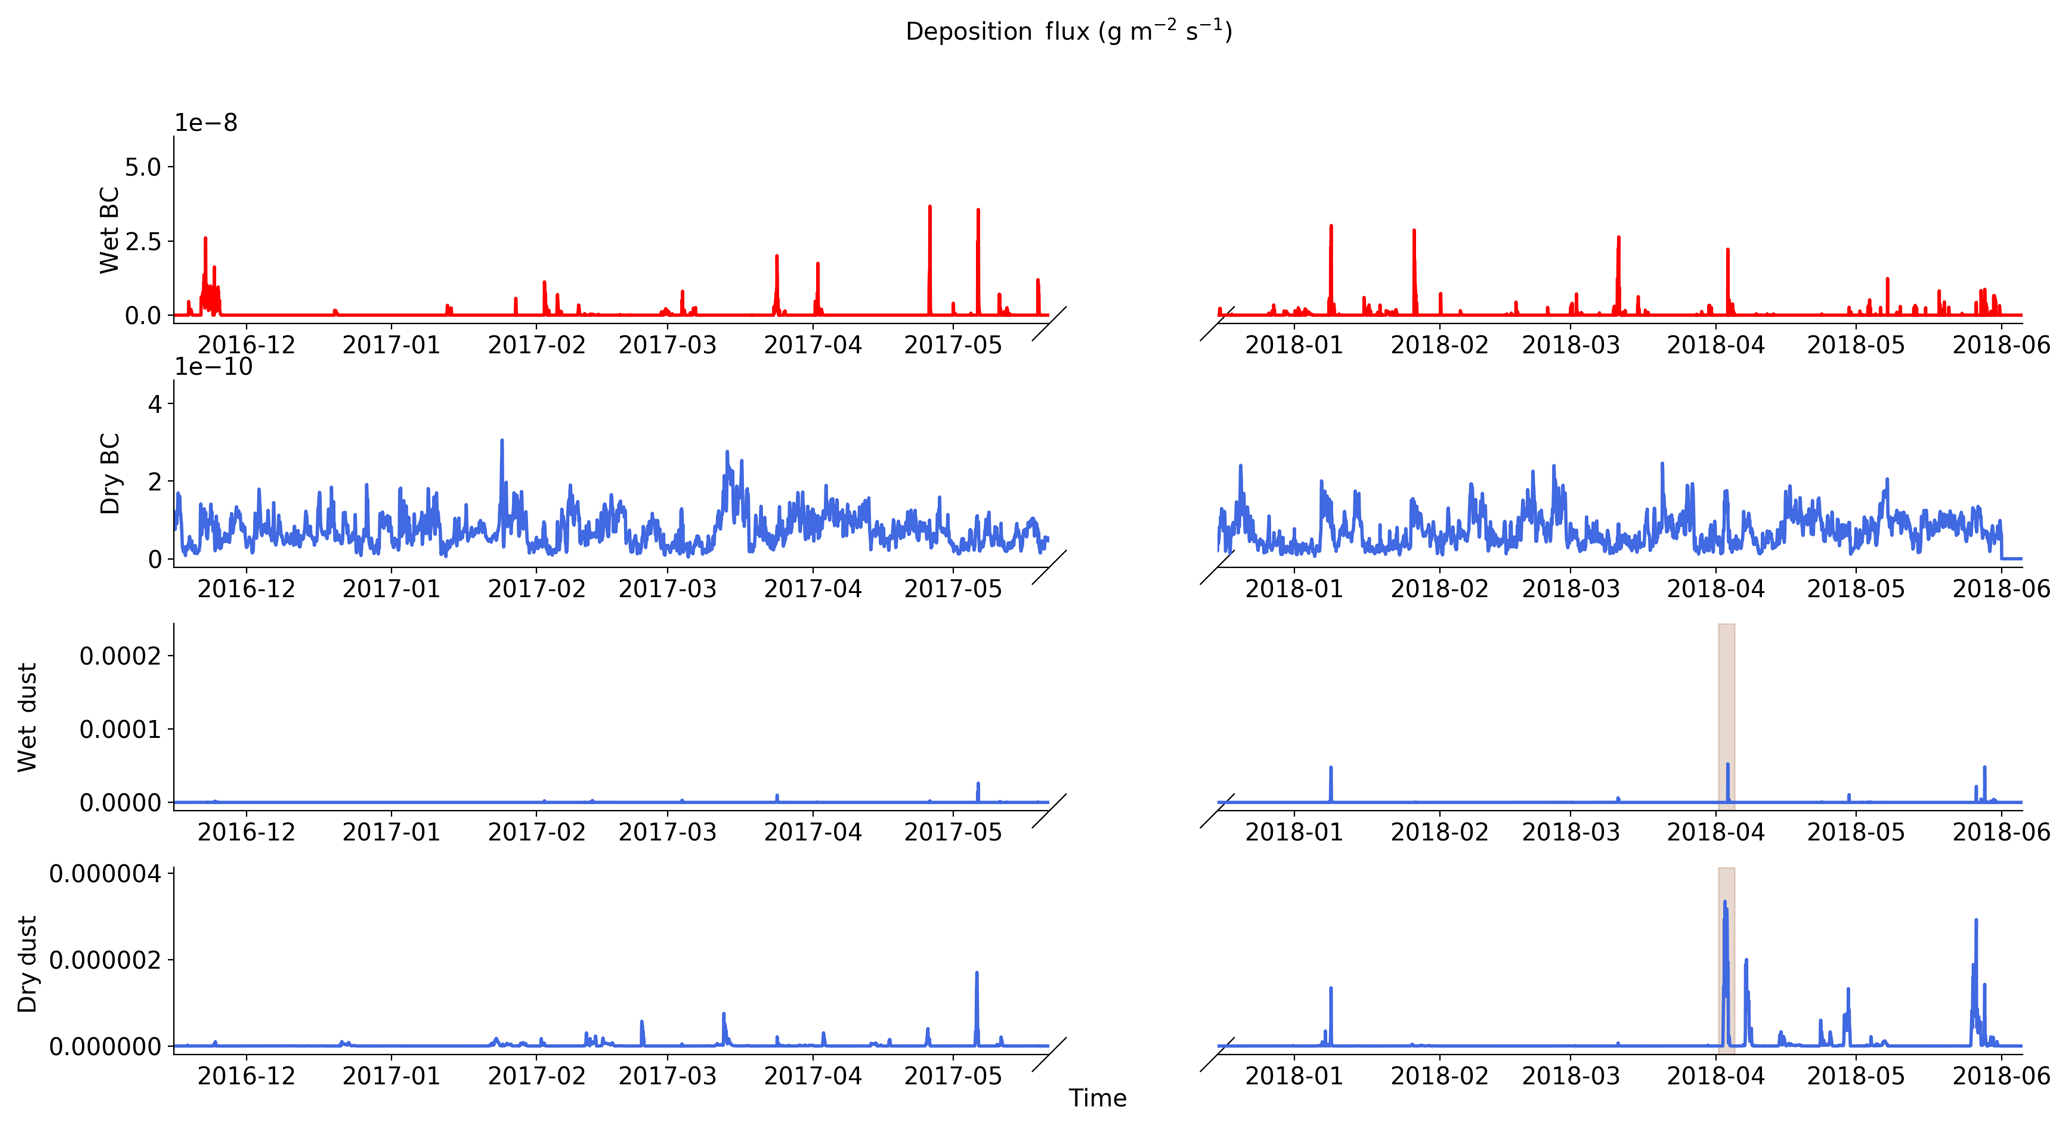
Figure B1Different component of the ALADIN-Climate deposition fluxes used as inputs for the Crocus snowpack model. The strong dust deposition event that occurred in April 2018 is represented by a brown shading. The different panels correspond to wet and dry deposition fluxes for BC (two upper panels) and dust (two lower panels) (all expressed in g m−2 s−1).
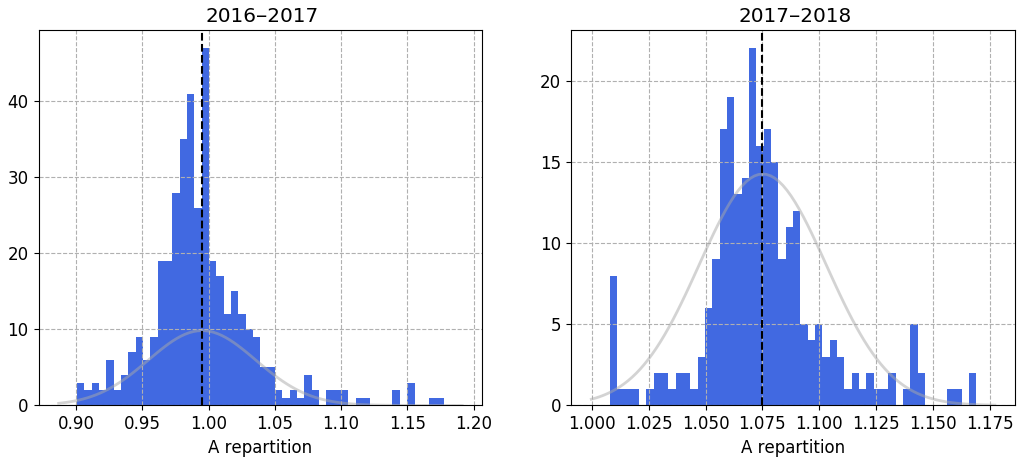
Figure C1Repartition of the scaling factor of Autosolexs measurements for cloudy days. The difference between both sets of years comes from a change in the instrument setup of Autosolexs for the second year; the lower glass protective shield of the light collector was removed.
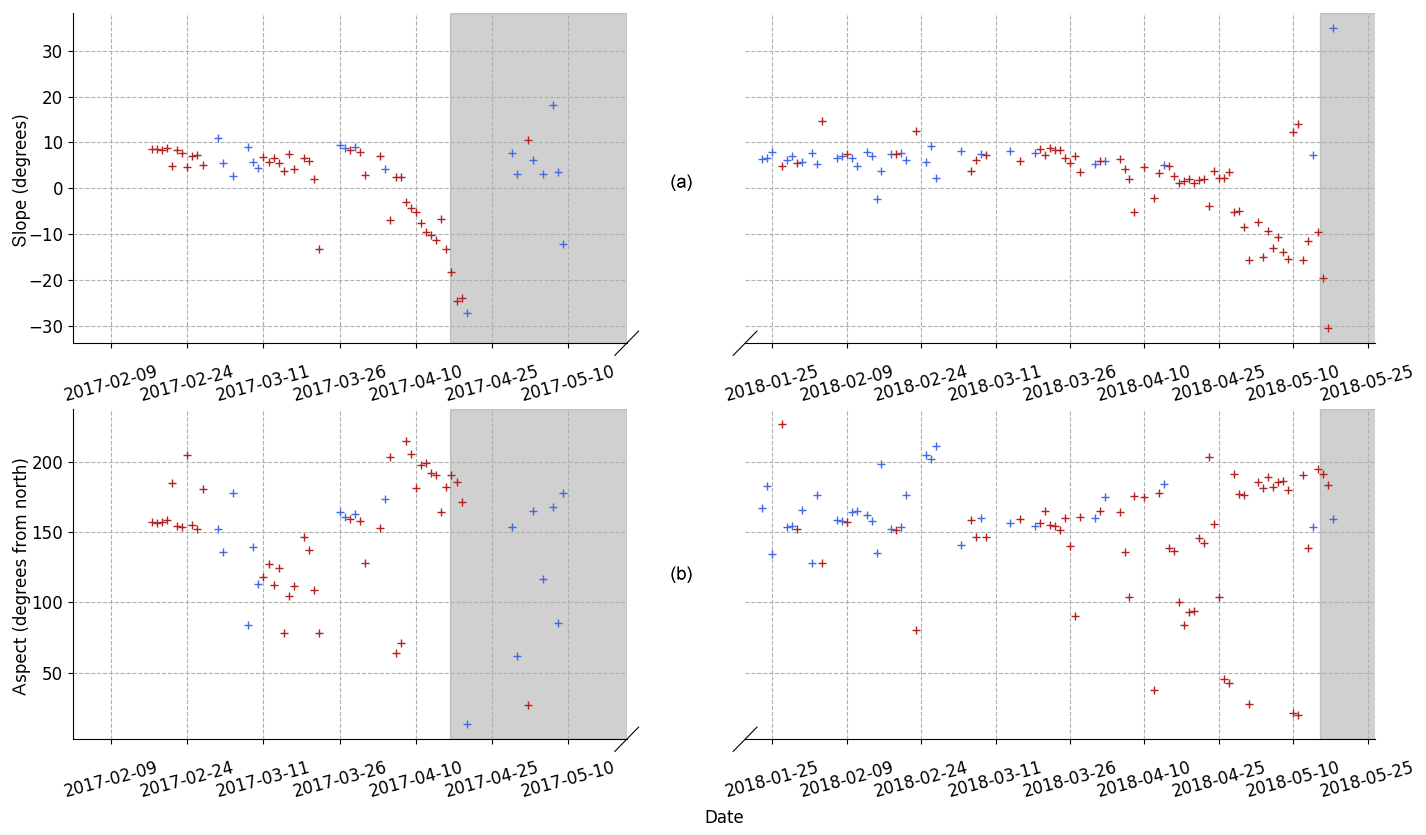
Figure C2Estimations of the slope (a) and aspect (b) of the snow surface from the Autosolexs sensor. The estimation is more robust for low solar elevations and low near-surface AEC. Grey shading corresponds to areas with less than 20 cm of measured snow depth.
| Acronym | Full name |
| AEC | Absorption equivalent concentration |
| BC | Black carbon |
| eqBC | Equivalent black carbon |
| rBC | Refractory black carbon |
| eqEC | Equivalent elemental carbon |
| eqrBC | Equivalent refractory black carbon |
| DOY | Day of year |
| EC | Elemental carbon |
| ESCROC | Ensemble system Crocus |
| LAP | Light-absorbing particle |
| MAE | Mass absorption efficiency |
| RF | Radiative forcing |
| ROS | Rain on snow |
| RMSE | Root mean squared error |
| SSA | Specific surface area |
| TARTES | Two-stream Analytical Radiative TransfEr in Snow |
The code used to produce the figures and process the data is available from the corresponding authors upon request.
The dataset presented in this study is available as a published dataset at https://doi.org/10.18709/perscido.2020.09.ds330 (Tuzet et al., 2020).
FT led the study and was in charge of the field measurement campaign over the two seasons. FT along with MD and GP performed the major part of the data analysis. LA and GP developed the Autosolexs and Solalb instruments and the associated processing library. MLam made a significant contribution in improving the writing of the paper. DV supervised the chemical measurement analysis. MLaf made it possible to realise ensemble snowpack simulations with ESCROC. PN provided the ALADIN-Climate simulations. MLam, FL and JR made a major contribution in the field data acquisition. All authors contributed to the paper.
The authors declare that they have no conflict of interest.
CNRM/CEN and IGE are part of Labex OSUG@2020 (Investissement d'Avenir – ANR10 LABX56). This study was supported by the ANR programmes 1-JS56-005-01 MONISNOW and ANR-16-CE01-0006 EBONI, the INSU/LEFE projects BON and ASSURANCE, the Ecole Doctorale SDU2E of Toulouse, and the CNES APR grant MYOSOTIS. This research was at least partially supported by Lautaret Garden-UMS 3370 (Univ. Grenoble Alpes, CNRS, SAJF, 38000 Grenoble, France), a member of AnaEE-France (ANR-11-INBS-0001, AnaEE-Services, Investissements d'Avenir frame) and the eLTER-Europe network (Univ. Grenoble Alpes, CNRS, LTSER Zone Atelier Alpes, 38000 Grenoble, France). The authors are grateful to LISA (Laboratoire Interuniversitaire des Systèmes Atmosphériques) and PSI (Paul Scherrer Institute) for chemical analysis of snow samples presented in this study.
This research has been supported by the Agence Nationale de la Recherche (grant nos. 16-CE01-0006, 1-JS56-005-01, and ANR10 LABX56), the Centre National d'Études Spatiales (MIOSOTIS) and the Institut National des Sciences de l'Univers, Centre National de la Recherche Scientifique (ASSURANCE).
This paper was edited by Jürg Schweizer and reviewed by two anonymous referees.
Aðalgeirsdóttir, G., Jóhannesson, T., Björnsson, H., Pálsson, F., and Sigurðsson, O.: Response of Hofsjökull and southern Vatnajökull, Iceland, to climate change, J. Geophys. Res.-Earth, 111, F03001, https://doi.org/10.1029/2005JF000388, 2006. a
Aoki, T., Kuchiki, K., Niwano, M., Kodama, Y., Hosaka, M., and Tanaka, T.: Physically based snow albedo model for calculating broadband albedos and the solar heating profile in snowpack for general circulation models, J. Geophys. Res., 116, D11114, https://doi.org/10.1029/2010JD015507, 2011. a
Arnaud, L., Picard, G., Champollion, N., Domine, F., Gallet, J.-C., Lefebvre, E., Fily, M., and Barnola, J.-M.: Measurement of vertical profiles of snow specific surface area with a 1 cm resolution using infrared reflectance: instrument description and validation, J. Glaciol., 57, 17–29, https://doi.org/10.3189/002214311795306664, 2011. a
Bergmann, M., Mützel, S., Primpke, S., Tekman, M. B., Trachsel, J., and Gerdts, G.: White and wonderful? Microplastics prevail in snow from the Alps to the Arctic, Science Advances, 5, eaax1157, https://doi.org/10.1126/sciadv.aax1157, 2019. a
Bond, T. C. and Bergstrom, R. W.: Light absorption by carbonaceous particles: An investigative review, Aerosol Sci. Tech., 40, 27–67, 2006. a, b
Bond, T. C., Anderson, T. L., and Campbell, D.: Calibration and intercomparison of filter-based measurements of visible light absorption by aerosols, Aerosol Sci. Tech., 30, 582–600, 1999. a
Brun, E., Martin, E., Simon, V., Gendre, C., and Coléou, C.: An energy and mass model of snow cover suitable for operational avalanche forecasting, J. Glaciol., 35, 333–342, 1989. a
Caponi, L., Formenti, P., Massabó, D., Di Biagio, C., Cazaunau, M., Pangui, E., Chevaillier, S., Landrot, G., Andreae, M. O., Kandler, K., Piketh, S., Saeed, T., Seibert, D., Williams, E., Balkanski, Y., Prati, P., and Doussin, J.-F.: Spectral- and size-resolved mass absorption efficiency of mineral dust aerosols in the shortwave spectrum: a simulation chamber study, Atmos. Chem. Phys., 17, 7175–7191, https://doi.org/10.5194/acp-17-7175-2017, 2017. a
Cavalli, F., Viana, M., Yttri, K. E., Genberg, J., and Putaud, J.-P.: Toward a standardised thermal-optical protocol for measuring atmospheric organic and elemental carbon: the EUSAAR protocol, Atmos. Meas. Tech., 3, 79–89, https://doi.org/10.5194/amt-3-79-2010, 2010. a
Chan, T. W., Huang, L., Leaitch, W. R., Sharma, S., Brook, J. R., Slowik, J. G., Abbatt, J. P. D., Brickell, P. C., Liggio, J., Li, S.-M., and Moosmüller, H.: Observations of OM ∕ OC and specific attenuation coefficients (SAC) in ambient fine PM at a rural site in central Ontario, Canada, Atmos. Chem. Phys., 10, 2393–2411, https://doi.org/10.5194/acp-10-2393-2010, 2010. a, b
Chan, T. W., Brook, J. R., Smallwood, G. J., and Lu, G.: Time-resolved measurements of black carbon light absorption enhancement in urban and near-urban locations of southern Ontario, Canada, Atmos. Chem. Phys., 11, 10407–10432, https://doi.org/10.5194/acp-11-10407-2011, 2011. a, b
Daniel, M., Lemonsu, A., Déqué, M., Somot, S., Alias, A., and Masson, V.: Benefits of explicit urban parameterization in regional climate modeling to study climate and city interactions, Clim. Dynam., 52, 2745–2764, 2019. a
De Angelis, M. and Gaudichet, A.: Saharan dust deposition over Mont Blanc (French Alps) during the last 30 years, Tellus B, 43, 61–75, 1991. a, b, c
Delmonte, B., Petit, J., Andersen, K. K., Basile-Doelsch, I., Maggi, V., and Lipenkov, V. Y.: Dust size evidence for opposite regional atmospheric circulation changes over east Antarctica during the last climatic transition, Clim. Dynam., 23, 427–438, 2004. a, b
Di Mauro, B., Fava, F., Ferrero, L., Garzonio, R., Baccolo, G., Delmonte, B., and Colombo, R.: Mineral dust impact on snow radiative properties in the European Alps combining ground, UAV, and satellite observations, J. Geophys. Res.-Atmos., 120, 6080–6097, 2015. a, b, c
Di Mauro, B., Garzonio, R., Rossini, M., Filippa, G., Pogliotti, P., Galvagno, M., Morra di Cella, U., Migliavacca, M., Baccolo, G., Clemenza, M., Delmonte, B., Maggi, V., Dumont, M., Tuzet, F., Lafaysse, M., Morin, S., Cremonese, E., and Colombo, R.: Saharan dust events in the European Alps: role in snowmelt and geochemical characterization, The Cryosphere, 13, 1147–1165, https://doi.org/10.5194/tc-13-1147-2019, 2019. a, b
Doherty, S. J., Warren, S. G., Grenfell, T. C., Clarke, A. D., and Brandt, R. E.: Light-absorbing impurities in Arctic snow, Atmos. Chem. Phys., 10, 11647–11680, https://doi.org/10.5194/acp-10-11647-2010, 2010. a, b, c
Doherty, S. J., Grenfell, T. C., Forsström, S., Hegg, D. L., Brandt, R. E., and Warren, S. G.: Observed vertical redistribution of black carbon and other insoluble light-absorbing particles in melting snow, J. Geophys. Res.-Atmos., 118, 5553–5569, 2013.
Doherty, S. J., Dang, C., Hegg, D. A., Zhang, R., and Warren, S. G.: Black carbon and other light-absorbing particles in snow of central North America, J. Geophys. Res.-Atmos., 119, 12–807, 2014. a
Doherty, S. J., Hegg, D. A., Johnson, J. E., Quinn, P. K., Schwarz, J. P., Dang, C., and Warren, S. G.: Causes of variability in light absorption by particles in snow at sites in Idaho and Utah, J. Geophys. Res.-Atmos., 121, 4751–4768, 2016. a
Dong, Z., Kang, S., Qin, D., Shao, Y., Ulbrich, S., and Qin, X.: Variability in individual particle structure and mixing states between the glacier–snowpack and atmosphere in the northeastern Tibetan Plateau, The Cryosphere, 12, 3877–3890, https://doi.org/10.5194/tc-12-3877-2018, 2018. a
Drugé, T., Nabat, P., Mallet, M., and Somot, S.: Model simulation of ammonium and nitrate aerosols distribution in the Euro-Mediterranean region and their radiative and climatic effects over 1979–2016, Atmos. Chem. Phys., 19, 3707–3731, https://doi.org/10.5194/acp-19-3707-2019, 2019. a
Dumont, M., Arnaud, L., Picard, G., Libois, Q., Lejeune, Y., Nabat, P., Voisin, D., and Morin, S.: In situ continuous visible and near-infrared spectroscopy of an alpine snowpack, The Cryosphere, 11, 1091–1110, https://doi.org/10.5194/tc-11-1091-2017, 2017. a, b, c, d, e, f, g, h, i, j, k
Durand, Y., Brun, E., Mérindol, L., Guyomarc'h, G., Lesaffre, B., and Martin, E.: A meteorological estimation of relevant parameters for snow models, Ann. Glaciol., 18, 65–71, 1993. a
Essery, R., Morin, S., Lejeune, Y., and Menard, C. B.: A comparison of 1701 snow models using observations from an alpine site, Adv. Water Resour., 55, 131–148, https://doi.org/10.1016/j.advwatres.2012.07.013, 2013. a
Flanner, M. G. and Zender, C. S.: Snowpack radiative heating: Influence on Tibetan Plateau climate, Geophys. Res. Lett., 32, l06501, https://doi.org/10.1029/2004GL022076, 2005. a, b
Flanner, M. G., Zender, C. S., Randerson, J. T., and Rasch, P. J.: Present-day climate forcing and response from black carbon in snow, J. Geophys. Res., 112, D11202, https://doi.org/10.1029/2006JD008003, 2007. a, b
Flanner, M. G., Liu, X., Zhou, C., Penner, J. E., and Jiao, C.: Enhanced solar energy absorption by internally-mixed black carbon in snow grains, Atmos. Chem. Phys., 12, 4699–4721, https://doi.org/10.5194/acp-12-4699-2012, 2012. a
Gabbi, J., Huss, M., Bauder, A., Cao, F., and Schwikowski, M.: The impact of Saharan dust and black carbon on albedo and long-term mass balance of an Alpine glacier, The Cryosphere, 9, 1385–1400, https://doi.org/10.5194/tc-9-1385-2015, 2015. a, b
Gallet, J.-C., Domine, F., Zender, C. S., and Picard, G.: Measurement of the specific surface area of snow using infrared reflectance in an integrating sphere at 1310 and 1550 nm, The Cryosphere, 3, 167–182, https://doi.org/10.5194/tc-3-167-2009, 2009. a, b
Grenfell, T. C. and Warren, S. G.: Representation of a nonspherical ice particle by a collection of independent spheres for scattering and absorption of radiation, J. Geophys. Res.,104, 31697–31709, https://doi.org/10.1029/2000JC000414, 1999. a
Hadley, O. L. and Kirchstetter, T. W.: Black-carbon reduction of snow albedo, Nat. Clim. Change, 2, 437–440, https://doi.org/10.1038/NCLIMATE1433, 2012. a, b
Hansen, J. and Nazarenko, L.: Soot climate forcing via snow and ice albedos, P. Natl. Acad. Sci. USA, 101, 423–428, 2004. a
Jenk, T. M., Szidat, S., Schwikowski, M., Gäggeler, H. W., Brütsch, S., Wacker, L., Synal, H.-A., and Saurer, M.: Radiocarbon analysis in an Alpine ice core: record of anthropogenic and biogenic contributions to carbonaceous aerosols in the past (1650–1940), Atmos. Chem. Phys., 6, 5381–5390, https://doi.org/10.5194/acp-6-5381-2006, 2006. a
Klok, E., Jasper, K., Roelofsma, K., Gurtz, J., and Badoux, A.: Distributed hydrological modelling of a heavily glaciated Alpine river basin, Hydrolog. Sci. J., 46, 553–570, 2001. a
Kochendorfer, J., Nitu, R., Wolff, M., Mekis, E., Rasmussen, R., Baker, B., Earle, M. E., Reverdin, A., Wong, K., Smith, C. D., Yang, D., Roulet, Y.-A., Buisan, S., Laine, T., Lee, G., Aceituno, J. L. C., Alastrué, J., Isaksen, K., Meyers, T., Brækkan, R., Landolt, S., Jachcik, A., and Poikonen, A.: Analysis of single-Alter-shielded and unshielded measurements of mixed and solid precipitation from WMO-SPICE, Hydrol. Earth Syst. Sci., 21, 3525–3542, https://doi.org/10.5194/hess-21-3525-2017, 2017. a
Kokhanovsky, A. and Zege, E.: Scattering optics of snow, Appl. Opt., 43, 1589–1602, 2004. a, b
Kokhanovsky, A., Lamare, M., Di Mauro, B., Picard, G., Arnaud, L., Dumont, M., Tuzet, F., Brockmann, C., and Box, J. E.: On the reflectance spectroscopy of snow, The Cryosphere, 12, 2371–2382, https://doi.org/10.5194/tc-12-2371-2018, 2018. a
Kokhanovsky, A., Lamare, M., Danne, O., Dumont, M., Brockmann, C., Picard, G., Arnaud, L., Favier, V., Jourdain, B., Lemeur, E., Di Mauro, B., Aoki, T., Niwano, M., Rozanov, V., Korkin, S., Kipfstuhl, S., Freitag, J., Hoerhold, M., Zuhr, A., Vladimirova, D., Faber, A.-K., Steen-Larsen, H. C., Wahl, S., Andersen, J. K., Vandecrux, B., van As, D., Mankoff, K. D., Kern, M., Zege, E., and Box, J. E.: Retrieval of snow properties from the Sentinel-3 Ocean and Land Colour Instrument, Remote Sensing, 11, 2280, https://doi.org/10.3390/rs11192280, 2019. a
Krinner, G., Derksen, C., Essery, R., Flanner, M., Hagemann, S., Clark, M., Hall, A., Rott, H., Brutel-Vuilmet, C., Kim, H., Ménard, C. B., Mudryk, L., Thackeray, C., Wang, L., Arduini, G., Balsamo, G., Bartlett, P., Boike, J., Boone, A., Chéruy, F., Colin, J., Cuntz, M., Dai, Y., Decharme, B., Derry, J., Ducharne, A., Dutra, E., Fang, X., Fierz, C., Ghattas, J., Gusev, Y., Haverd, V., Kontu, A., Lafaysse, M., Law, R., Lawrence, D., Li, W., Marke, T., Marks, D., Ménégoz, M., Nasonova, O., Nitta, T., Niwano, M., Pomeroy, J., Raleigh, M. S., Schaedler, G., Semenov, V., Smirnova, T. G., Stacke, T., Strasser, U., Svenson, S., Turkov, D., Wang, T., Wever, N., Yuan, H., Zhou, W., and Zhu, D.: ESM-SnowMIP: assessing snow models and quantifying snow-related climate feedbacks, Geosci. Model Dev., 11, 5027–5049, https://doi.org/10.5194/gmd-11-5027-2018, 2018. a, b
Lafaysse, M., Cluzet, B., Dumont, M., Lejeune, Y., Vionnet, V., and Morin, S.: A multiphysical ensemble system of numerical snow modelling, The Cryosphere, 11, 1173–1198, https://doi.org/10.5194/tc-11-1173-2017, 2017. a, b, c, d, e
Lamare, M. L., Lee-Taylor, J., and King, M. D.: The impact of atmospheric mineral aerosol deposition on the albedo of snow & sea ice: are snow and sea ice optical properties more important than mineral aerosol optical properties?, Atmos. Chem. Phys., 16, 843–860, https://doi.org/10.5194/acp-16-843-2016, 2016. a
Larue, F., Picard, G., Arnaud, L., Ollivier, I., Delcourt, C., Lamare, M., Tuzet, F., Revuelto, J., and Dumont, M.: Snow albedo sensitivity to macroscopic surface roughness using a new ray-tracing model, The Cryosphere, 14, 1651–1672, https://doi.org/10.5194/tc-14-1651-2020, 2020. a
Legagneux, L., Cabanes, A., and Domine, F.: Measurement of the specific surface area of 176 snow samples using methane adsorption at 77 K, J. Geophys Res., 107, 4335, https://doi.org/10.1029/2001JD001016, 2002. a
Lehning, M., Bartelt, P., Brown, B., Fierz, C., and Satyawali, P.: A physical SNOWPACK model for the Swiss avalanche warning. Part II: snow microstructure, Cold Reg. Sci. Technol., 35, 147–167, https://doi.org/10.1016/S0165-232X(02)00073-3, 2002. a
Libois, Q.: Evolution des propriétés physiques de neige de surface sur le plateau Antarctique. Observations et modélisation du transfert radiatif et du métamorphisme, PhD thesis, Laboratoire de glaciologie et géophysique de l'environnement, Grenoble, 2014. a
Libois, Q., Picard, G., France, J. L., Arnaud, L., Dumont, M., Carmagnola, C. M., and King, M. D.: Influence of grain shape on light penetration in snow, The Cryosphere, 7, 1803–1818, https://doi.org/10.5194/tc-7-1803-2013, 2013. a, b, c
Libois, Q., Picard, G., Arnaud, L., Morin, S., and Brun, E.: Modeling the impact of snow drift on the decameter-scale variability of snow properties on the Antarctic Plateau, J. Geophys. Res., 119, 11662–11681, https://doi.org/10.1002/2014JD022361, 2014. a, b
Lim, S., Faïn, X., Zanatta, M., Cozic, J., Jaffrezo, J.-L., Ginot, P., and Laj, P.: Refractory black carbon mass concentrations in snow and ice: method evaluation and inter-comparison with elemental carbon measurement, Atmos. Meas. Tech., 7, 3307–3324, https://doi.org/10.5194/amt-7-3307-2014, 2014. a, b, c, d
Mori, T., Goto-Azuma, K., Kondo, Y., Ogawa-Tsukagawa, Y., Miura, K., Hirabayashi, M., Oshima, N., Koike, M., Kupiainen, K., Moteki, N., Ohata, S., Sinha, P. R., Sugiura, K., Aoki, T., Schneebeli, M., Steffen, K., Sato, A., Tsushima, A., Makarov, V., Omiya, S., Sugimoto, A., Takano, S., and Nagatsuka, N.: Black Carbon and Inorganic Aerosols in Snowpack over the Arctic, J. Geophys. Res.-Atmos., 124, 13325–13356, https://doi.org/10.1029/2019JD030623, 2019. a, b, c, d
Morin, S., Lejeune, Y., Lesaffre, B., Panel, J.-M., Poncet, D., David, P., and Sudul, M.: An 18-yr long (1993–2011) snow and meteorological dataset from a mid-altitude mountain site (Col de Porte, France, 1325 m alt.) for driving and evaluating snowpack models, Earth Syst. Sci. Data, 4, 13–21, https://doi.org/10.5194/essd-4-13-2012, 2012. a
Nabat, P., Somot, S., Mallet, M., Michou, M., Sevault, F., Driouech, F., Meloni, D., di Sarra, A., Di Biagio, C., Formenti, P., Sicard, M., Léon, J.-F., and Bouin, M.-N.: Dust aerosol radiative effects during summer 2012 simulated with a coupled regional aerosol–atmosphere–ocean model over the Mediterranean, Atmos. Chem. Phys., 15, 3303–3326, https://doi.org/10.5194/acp-15-3303-2015, 2015. a
Niwano, M., Aoki, T., Kuchiki, K., Hosaka, M., and Kodama, Y.: Snow Metamorphism and Albedo Process (SMAP) model for climate studies: Model validation using meteorological and snow impurity data measured at Sapporo, J. Geophys. Res., 117, F03008, https://doi.org/10.1029/2011JF002239, 2012. a
Painter, T. H., Barrett, A. P., Landry, C. C., Neff, J. C., Cassidy, M. P., Lawrence, C. R., McBride, K. E., and Farmer, G. L.: Impact of disturbed desert soils on duration of mountain snow cover, Geophys. Res. Lett., 34, L12502, https://doi.org/10.1029/2007GL030284, 2007. a, b
Painter, T. H., Bryant, A. C., and McKenzie Skiles, S.: Radiative forcing by light absorbing impurities in snow from MODIS surface reflectance data, Geophys. Res. Lett., 39, L17502, https://doi.org/10.1029/2012GL052457, 2012. a, b
Painter, T. H., Flanner, M. G., Kaser, G., Marzeion, B., VanCuren, R. A., and Abdalati, W.: End of the Little Ice Age in the Alps forced by industrial black carbon, P. Natl. Acad. Sci. USA, 110, 15216–15221, 2013. a
Petzold, A., Ogren, J. A., Fiebig, M., Laj, P., Li, S.-M., Baltensperger, U., Holzer-Popp, T., Kinne, S., Pappalardo, G., Sugimoto, N., Wehrli, C., Wiedensohler, A., and Zhang, X.-Y.: Recommendations for reporting ”black carbon” measurements, Atmos. Chem. Phys., 13, 8365–8379, https://doi.org/10.5194/acp-13-8365-2013, 2013. a, b
Picard, G., Libois, Q., Arnaud, L., Verin, G., and Dumont, M.: Development and calibration of an automatic spectral albedometer to estimate near-surface snow SSA time series, The Cryosphere, 10, 1297–1316, https://doi.org/10.5194/tc-10-1297-2016, 2016. a, b, c
Picard, G., Dumont, M., Lamare, M., Tuzet, F., Larue, F., Pirazzini, R., and Arnaud, L.: Spectral albedo measurements over snow-covered slopes: theory and slope effect corrections, The Cryosphere, 14, 1497–1517, https://doi.org/10.5194/tc-14-1497-2020, 2020. a
Polashenski, C. M., Dibb, J. E., Flanner, M. G., Chen, J. Y., Courville, Z. R., Lai, A. M. Schauer, J. J., Shafer, M. M., and Bergin, M.: Neither dust nor black carbon causing apparent albedo decline in Greenland's dry snow zone: Implications for MODIS C5 surface reflectance, Geophys. Res. Lett., 42, 9319–9327, 2015. a
Raleigh, M. S., Lundquist, J. D., and Clark, M. P.: Exploring the impact of forcing error characteristics on physically based snow simulations within a global sensitivity analysis framework, Hydrol. Earth Syst. Sci., 19, 3153–3179, https://doi.org/10.5194/hess-19-3153-2015, 2015. a
Ram, K. and Sarin, M.: Absorption coefficient and site-specific mass absorption efficiency of elemental carbon in aerosols over urban, rural, and high-altitude sites in India, Environ. Sci. Technol., 43, 8233–8239, 2009. a
Salako, G. O., Hopke, P. K., Cohen, D. D., Begum, B. A., Biswas, S. K., Pandit, G. G., Chung, Y.-S., Abd Rahman, S., Hamzah, M. S., Davy, P., Markwitz, A., Shagjjamba, D., Lodoysamba, S., Wimolwattanapun, W., and Bunprapob, S.: Exploring the variation between EC and BC in a variety of locations, Aerosol Air Qual. Res., 12, 1–7, 2012. a
Schwarz, J., Gao, R., Spackman, J., Watts, L., Thomson, D., Fahey, D., Ryerson, T., Peischl, J., Holloway, J., Trainer, M., Frost, G. J., Baynard, T., Lack, D. A., de Gouw, J. A., Warneke, C., and Del Negro, L. A.: Measurement of the mixing state, mass, and optical size of individual black carbon particles in urban and biomass burning emissions, Geophys. Res. Lett., 35, L13810, https://doi.org/10.1029/2008GL033968, 2008. a
Schwarz, J., Gao, R., Perring, A., Spackman, J., and Fahey, D.: Black carbon aerosol size in snow, Sci. Rep.-UK, 3, 1356, https://doi.org/10.1038/srep01356, 2013. a
Schwarz, J. P., Doherty, S. J., Li, F., Ruggiero, S. T., Tanner, C. E., Perring, A. E., Gao, R. S., and Fahey, D. W.: Assessing Single Particle Soot Photometer and Integrating Sphere/Integrating Sandwich Spectrophotometer measurement techniques for quantifying black carbon concentration in snow, Atmos. Meas. Tech., 5, 2581–2592, https://doi.org/10.5194/amt-5-2581-2012, 2012. a
Skiles, S. M. and Painter, T. H.: Toward understanding direct absorption and grain size feedbacks by dust radiative forcing in snow with coupled snow physical and radiative transfer modeling, Water Resour. Res., 55, 7362–7378, https://doi.org/10.1029/2018WR024573, 2019. a, b, c, d, e, f
Skiles, S. M., Painter, T. H., Deems, J. S., Bryant, A. C., and Landry, C. C.: Dust radiative forcing in snow of the Upper Colorado River Basin: 2. Interannual variability in radiative forcing and snowmelt rates, Water Resour. Res., 48, W07522, https://doi.org/10.1029/2012WR011986, 2012. a, b, c
Skiles, S. M., Flanner, M., Cook, J. M., Dumont, M., and Painter, T. H.: Radiative forcing by light-absorbing particles in snow, Nature Climate Change, 8, 964–971, https://doi.org/10.1038/s41558-018-0296-5, 2018. a, b, c, d
Stamnes, K., Tsay, S.-C., Wiscombe, W., and Jayaweera, K.: Numerically stable algorithm for discrete-ordinate-method radiative transfer in multiple scattering and emitting layered media, Appl. Opt., 27, 2502–2509, 1988. a
Sterle, K. M., McConnell, J. R., Dozier, J., Edwards, R., and Flanner, M. G.: Retention and radiative forcing of black carbon in eastern Sierra Nevada snow, The Cryosphere, 7, 365–374, https://doi.org/10.5194/tc-7-365-2013, 2013. a
Thevenon, F., Anselmetti, F. S., Bernasconi, S. M., and Schwikowski, M.: Mineral dust and elemental black carbon records from an Alpine ice core (Colle Gnifetti glacier) over the last millennium, J. Geophys. Res.-Atmos., 114, D17102, https://doi.org/10.1029/2008JD011490, 2009. a, b, c
Torres, A., Bond, T. C., Lehmann, C. M., Subramanian, R., and Hadley, O. L.: Measuring organic carbon and black carbon in rainwater: evaluation of methods, Aerosol Sci. Tech., 48, 239–250, 2014. a, b, c
Tuzet, F., Dumont, M., Lafaysse, M., Picard, G., Arnaud, L., Voisin, D., Lejeune, Y., Charrois, L., Nabat, P., and Morin, S.: A multilayer physically based snowpack model simulating direct and indirect radiative impacts of light-absorbing impurities in snow, The Cryosphere, 11, 2633–2653, https://doi.org/10.5194/tc-11-2633-2017, 2017. a, b, c, d, e, f, g, h, i, j, k, l, m
Tuzet, F., Dumont, M., Arnaud, L., Voisin, D., Lamare, M., Larue, F., Revuelto, J., and Picard, G.: Influence of light-absorbing particles on snow spectral irradiance profiles, The Cryosphere, 13, 2169–2187, https://doi.org/10.5194/tc-13-2169-2019, 2019. a, b, c, d, e, f, g, h, i, j
Tuzet, F., Dumont, M., Picard, G., Lamare, M., Voisin, D., Nabat, P., Lafaysse, M., Larue, F., Revuelto, J., and Arnaud, L.: Field campaign at Col du Lautaret 2016–2018 (2058 m a.s.l., French Alps): Snow surface properties and albedo measurements at Col du Lautaret, Data set, Perscido-Grenoble-Alpes, https://doi.org/10.18709/perscido.2020.09.ds330, 2020. a
Varga, G.: Changing nature of Saharan dust deposition in the Carpathian Basin (Central Europe): 40 years of identified North African dust events (1979–2018), Environ. Int., 139, 105712, https://doi.org/10.1016/j.envint.2020.105712, 2020. a
Venkatachari, P., Zhou, L., Hopke, P. K., Schwab, J. J., Demerjian, K. L., Weimer, S., Hogrefe, O., Felton, D., and Rattigan, O.: An intercomparison of measurement methods for carbonaceous aerosol in the ambient air in New York City, Aerosol Sci. Tech., 40, 788–795, 2006. a
Vionnet, V., Brun, E., Morin, S., Boone, A., Faroux, S., Le Moigne, P., Martin, E., and Willemet, J.-M.: The detailed snowpack scheme Crocus and its implementation in SURFEX v7.2, Geosci. Model Dev., 5, 773–791, https://doi.org/10.5194/gmd-5-773-2012, 2012. a
Voisin, D., Jaffrezo, J.-L., Houdier, S., Barret, M., Cozic, J., King, M., France, J., Reay, H., Grannas, A., Kos, G., and Ariya, P.: Carbonaceous species and HUmic LIke Substances (HULIS) in Arctic snowpack during OASIS field campaign in Barrow, J. Geophys. Res., 117, D00R19, https://doi.org/10.1029/2011JD016612, 2012. a
Wang, X., Doherty, S. J., and Huang, J.: Black carbon and other light-absorbing impurities in snow across Northern China, J. Geophys. Res.-Atmos., 118, 1471–1492, https://doi.org/10.1029/2012JD018291, 2013. a
Warren, S. and Brandt, R.: Optical constants of ice from the ultraviolet to the microwave: A revised compilation, J. Geophys. Res., 113, D14220, https://doi.org/10.1029/2007JD009744, 2008. a, b
Warren, S. G.: Can black carbon in snow be detected by remote sensing?, J. Geophys. Res.-Atmos, 118, 779–786, https://doi.org/10.1029/2012JD018476, 2013. a
Warren, S. G. and Wiscombe, W.: A Model for the Spectral Albedo of Snow. II: Snow Containing Atmospheric Aerosols, J. Atmos. Sci., 37, 2734–2745, 1980. a, b, c
Warren, S. G., Brandt, R. E., and Grenfell, T. C.: Visible and near-ultraviolet absorption spectrum of ice from transmission of solar radiation into snow, Applied Optics, 45, 5320–5334, 2006. a
Watson, J. G.: Summary of Organic and Elemental Carbon/Black Carbon Analysis Methods and Interconparisons, Aerosol Air Qual. Res., 5, 65–102, 2005. a, b
Wendl, I. A., Menking, J. A., Färber, R., Gysel, M., Kaspari, S. D., Laborde, M. J. G., and Schwikowski, M.: Optimized method for black carbon analysis in ice and snow using the Single Particle Soot Photometer, Atmos. Meas. Tech., 7, 2667–2681, https://doi.org/10.5194/amt-7-2667-2014, 2014. a
Ye, H., Zhang, R. Shi, J., Huang, J., Warren, S. G., and Fu, Q.: Black carbon in seasonal snow across northern Xinjiang in northwestern China, Environ. Res. Lett., 7, 044002, https://doi.org/10.1088/1748-9326/7/4/044002, 2012. a
Zanatta, M., Gysel, M., Bukowiecki, N., Müller, T., Weingartner, E., Areskoug, H., Fiebig, M., Yttri, K. E., Mihalopoulos, N., Kouvarakis, G., Beddows, D., Harrison, R. M., Cavalli, F., Putaud, J. P., Spindler, G., Wiedensohler, A., Alastuey, A., Pandolfi, M., Sellegri, K., Swietlicki, E., Jaffrezo, J. L., Baltensperger, U., and Laj, P.: A European aerosol phenomenology-5: Climatology of black carbon optical properties at 9 regional background sites across Europe, Atmos. Environ., 145, 346–364, 2016. a, b
- Abstract
- Introduction
- Materials and methods
- Results
- Discussion
- Conclusion
- Appendix A: Computation of eqBC concentration
- Appendix B: Prescribed deposition fluxes from ALADIN-Climate
- Appendix C: Autosolexs inversion details
- Appendix D: Linear regressions of measured near-surface properties
- Appendix E: Summary of the acronyms used in the present study
- Code availability
- Data availability
- Author contributions
- Competing interests
- Acknowledgements
- Financial support
- Review statement
- References