the Creative Commons Attribution 4.0 License.
the Creative Commons Attribution 4.0 License.
 | 02 Sep 2020
Brief communication: Mapping Greenland's perennial firn aquifers using enhanced-resolution L-band brightness temperature image time series
Julie Z. Miller
David G. Long
Kenneth C. Jezek
Joel T. Johnson
Mary J. Brodzik
Christopher A. Shuman
Lora S. Koenig
Ted A. Scambos
Enhanced-resolution L-band brightness temperature (TB) image time series generated from observations collected over the Greenland Ice Sheet by NASA's Soil Moisture Active Passive (SMAP) satellite are used to map Greenland's perennial firn aquifers from space. Exponentially decreasing L-band TB signatures are correlated with perennial firn aquifer areas identified via the Center for Remote Sensing of Ice Sheets (CReSIS) Multi-Channel Coherent Radar Depth Sounder (MCoRDS) that was flown by NASA's Operation IceBridge (OIB) campaign. An empirical algorithm to map extent is developed by fitting these signatures to a set of sigmoidal curves. During the spring of 2016, perennial firn aquifer areas are found to extend over ∼66 000 km2.
- Article
(4972 KB) - Full-text XML
- BibTeX
- EndNote


Firn is a porous layer of recrystallized snow near the surface of a glacier or an ice sheet. Under certain climate conditions, firn can host a laterally unconfined aquifer and thereby buffer meltwater flow across the near surface to the periphery. Given sufficiently high surface melting, firn aquifers form, or recharge, in the percolation facies as a result of vertical and lateral percolation of meltwater into the pore space of firn layers overlying impermeable ice layers. If a firn aquifer is adjacent to, or is crossed by, a crevasse, mobile meltwater can initiate meltwater-driven hydrofracture, drain into the subglacial hydrological system and accelerate ice flow (Fountain and Walder, 1998).
Although common on glaciers, firn aquifers were unknown on ice sheets until their discovery during an April 2011 field expedition to the percolation facies of southeastern Greenland (Forster et al., 2014). Greenland's firn aquifers store meltwater seasonally, intermittently or perennially, depending on location and climate. They range from shallow water-saturated firn layers that perch on top of near-surface ice layers to deeper water-saturated firn layers that extend from the ice sheet surface to the firn–ice transition. Simulations using a simple firn model suggest that high snowfall thermally insulates water-saturated firn layers, allowing meltwater to be stored in liquid form throughout the freezing season (i.e., the time between surface freeze-up to melt onset) if the overlying snow layer is sufficiently deep (Munneke et al., 2014).
The existence and approximate extent of Greenland's perennial firn aquifers has been demonstrated using shallow firn cores and ground-penetrating radar surveys collected at several sites in southeastern Greenland during recent field expeditions (Forster et al., 2014; Koenig et al., 2014; Miller et al., 2017) as well as locations detected using ice-penetrating radar surveys collected by the CReSIS Accumulation Radar flown by NASA's OIB campaign (Miège et al., 2016). Additional locations have more recently been detected using ice-penetrating radar surveys collected by the MCoRDS instrument. However, these airborne observations are not comprehensive over the Greenland Ice Sheet, typically occur only during the spring months, and are often non-repeating in space and time. The 2019 conclusion of NASA's OIB campaigns ended even these sparse mapping activities.
Initial studies have shown that C-band radar backscatter collected by satellite radar scatterometers (Miller et al., 2013), and more recently by satellite synthetic aperture radar (Brangers et al., 2020), is sensitive to subsurface meltwater storage in the upper snow and firn layers. However, the C-band penetration depth in the frozen snow and firn layers of Greenland's percolation facies is on the order of several meters, and the mean depth of the upper surface of meltwater in Greenland's perennial firn aquifers just prior to melt onset is ∼22 m (Miège et al., 2016).
Here, we demonstrate the potential for mapping Greenland's perennial firn aquifers from space using satellite L-band microwave radiometry. These instruments are capable of detecting L-band perennial firn aquifer emissions from tens of meters beneath the firn, deep enough to directly observe the upper surface of stored meltwater over the entire depth range (∼1–40 m) mapped by airborne ice-penetrating radar surveys (Miège et al., 2016). We use recently released enhanced-resolution L-band TB image time series collected over the Greenland Ice Sheet by the microwave radiometer on the SMAP satellite (Long et al., 2019) together with coincident thermal infrared (TIR) TB image time series collected by the Moderate Resolution Imaging Spectroradiometer (MODIS) on the Terra and Aqua satellites (Hall et al., 2012) to develop an empirical algorithm to map extent.
2.1 Enhanced-resolution L-band TB image time series
The SMAP satellite was launched 31 January 2015 and carries a microwave radiometer that operates at a frequency of 1.41 GHz (L-band). It is currently collecting global observations of vertically and horizontally (V- and H-pol, respectively) polarized TB. The surface incidence angle is ∼40∘, and the radiometric accuracy is ∼1.3 K.
The microwave radiometer form of the Scatterometer Image Reconstruction (rSIR) algorithm generates TB on a fine posting grid using satellite observations (Long et al., 2019). The rSIR algorithm exploits the measurement response function (MRF) for each observation, which is a smeared version of the antenna pattern. Using the overlapping MRFs, the rSIR algorithm reconstructs TB from the spatially filtered, low-resolution sampling provided by the observations. In effect, it generates an MRF deconvolved TB image. Combining multiple passes increases the sampling density, which improves the accuracy and resolution of the rSIR reconstruction.
Given converging orbital passes in the polar regions, the SMAP satellite passes over Greenland several times each day and provides nearly complete coverage during two distinct local time-of-day intervals. The rSIR algorithm combines orbital passes that occur between 08:00 and 16:00 (±2 h) local time of day to reconstruct twice-daily (i.e., morning and evening orbital pass interval) TB images. TB image data are projected on the Equal-Area Scalable Earth Grid (EASE-Grid 2.0) (Brodzik et al., 2012) at a 3.125 km posting resolution or grid cell spacing. The effective resolution for each grid cell is dependent on the number of observations used in the rSIR reconstruction and is coarser than the grid cell spacing. While the effective resolution of conventionally processed TB images posted on a 25 km grid is ∼30 km, the effective resolution of enhanced resolution TB images posted on a 3.125 km grid is ∼18 km, an improvement of ∼60 %.
Figure 1 demonstrates the improvement in the effective resolution provided by the rSIR reconstruction. It shows an MRF deconvolved TB image posted on a 3.125 km grid versus a conventionally processed TB image posted on a 25 km grid. These images were generated using V-pol TB observations collected during the evening orbital pass interval on 15 April 2016, coincident with airborne ice-penetrating radar surveys, and are projected on the Northern Hemisphere EASE-Grid 2.0 over Greenland. The enhanced-resolution TB image clearly captures many ice sheet features not captured in the conventionally processed TB images, particularly in Greenland's percolation facies where perennial firn aquifer areas have been mapped.

Figure 1(a) Gridded (25 km) and (b) enhanced-resolution (3.125 km) V-pol L-band TB images collected 15 April 2016 by the microwave radiometer on the SMAP satellite during the evening orbital pass interval over Greenland (Long et al., 2019). Black and dark grey regions of low L-band TB values are Greenland's percolation facies. Zoom areas (red boxes, c and d) are 2016 MCoRDS-derived perennial firn aquifer locations (small blue circles) in the southeastern percolation facies along OIB flight lines (yellow lines). Test site 1 (blue circle); test site 2 (cyan circle); test site 3 (red circle); test site 4 (green circle); test site 5 (orange circle); test site 6 (yellow circle); GIMP-derived ice extent (white lines; Howat et al., 2014); coastlines (black lines; Wessel and Smith, 1996). Several shallow firn core sites where meltwater was found stored at depths of 10, 12 and 25 m throughout the freezing season (Forster et al., 2014) are within the test site 1 grid cell.
We analyzed SMAP 2015–2016 morning and evening V- and H-pol TB images together with coincident MODIS 2016 TIR TB-derived surface meltwater maps (described in Sect. 2.2) in Greenland's percolation facies. Although sharp increases in TB delineate the extent of surface melting and provide a qualitative indication of the volumetric fraction of near-surface meltwater, a distinct subsurface meltwater signal is not easily distinguishable in any of the TB images during the freezing season.
To discriminate between L-band perennial firn aquifer emissions and background emissions, we used TB image time series analysis. We used the Greenland Ice Mapping Project (GIMP) Land Ice and Ocean Classification Mask (Howat et al., 2014) to construct an ice-masked V- and H-pol TB image time series that alternates morning and evening observations collected between 31 March 2015 (i.e., the beginning of the SMAP record) and 31 December 2016. These TB image time series provide sufficient detail to analyze spatiotemporal differences in exponentially decreasing L-band TB signatures over perennial firn aquifer areas compared to other percolation facies areas where seasonal meltwater is refrozen and stored exclusively as embedded ice.
2.2 Thermal infrared TB-derived surface freeze-up and melt onset dates
The ice surface temperature (IST) algorithm (Hall et al., 2012) retrieves a clear-sky ice surface skin temperature (i.e., the temperature at radiative equilibrium) over the Greenland Ice Sheet accurate within ±1 ∘C using a split window technique and satellite observations collected by MODIS TIR TB channels 31 (10.78–11.28 µm) and 32 (11.77–12.27 µm) during daily orbital passes that occur between 00:00 and 12:00 local time of day. The resolution is 0.78 km. For temperatures that are close to 0 ∘C, IST values are closely compatible with contemporaneous NOAA near-surface air temperature data (Shuman et al., 2014). IST data use the standard MODIS 1 km resolution cloud mask (“MOD35”) that uses up to 14 spectral bands and multiple spectral and thermal tests to identify clouds.
We projected the IST image data onto the EASE-Grid 2.0 at a 3.125 km grid cell spacing using rigorous orthorectification and cubic convolution, and then we used the GIMP mask (Howat et al., 2014) to construct ice-masked IST image time series between 31 March 2015 and 31 December 2016. Using the IST image time series, we retrieved surface meltwater maps for the 2015 and 2016 melting season. We set a threshold of IST ∘C for surface meltwater detection (Nghiem et al., 2012), consistent with the ±1 ∘C accuracy of the IST image data (i.e., surface meltwater is inferred when IST is as low as −1 ∘C). This threshold represents a penetration depth from ∼2 µm beneath the snow. We constructed a 2015 surface meltwater mask by identifying each grid cell in which surface meltwater was detected in at least one time step. We estimated the 2015 surface freeze-up date for each grid cell as the time step following the last time step at which surface meltwater was detected. For each grid cell that melted in 2015, we estimated the 2016 melt onset date as the first time step at which surface meltwater was detected.
2.3 Airborne ice-penetrating radar surveys
In April and May 2016, MCoRDS was flown over the Greenland Ice Sheet on a NOAA P-3 aircraft as part of NASA's OIB campaigns (Leuschen et al., 2014). The instrument operated at center frequencies ranging between 125 and 210 MHz. For a P-3 flying at a height of 500 m over a smooth surface (i.e., the ice sheet surface over Greenland's percolation facies), the along-track resolution is 323 m, and the across-track resolution is 25 m at a 14 m grid cell spacing (i.e., the extent of one grid cell is ∼0.005 km2). The penetration depth is as deep as several kilometers. Perennial firn aquifer locations were detected along flight lines using radar echograms collected by MCoRDS and the semiautomated methodology described in Miège et al. (2016). Strong non-conformal upper reflectors in radar echograms were interpreted as the upper surface of stored meltwater. The total number of mapped perennial firn aquifer grid cells is 78 343 corresponding to an extent of ∼354 km2 (Fig. 1).
We projected the MCoRDS-derived perennial firn aquifer locations on the EASE-Grid 2.0 at a grid cell spacing of 3.125 km. Each grid cell has an extent of ∼10 km. The total number of grid cells with at least one location is 780 corresponding to an extent of ∼7617 km2; however, less than ∼5 % of this extent is an actual detection. The maximum number of detections in a grid cell is 50, corresponding to an extent of ∼0.25 km2 or ∼8 % of a grid cell. These three locations are along crossing flight lines near test site 1 (Fig. 1). The remaining detections are along linear flight lines. The mean number of detections in a grid cell is 18, corresponding to ∼0.09 km2 or ∼1 % of a grid cell.
2.4 Algorithm
2.4.1 L-band perennial firn aquifer signatures
We analyzed V- and H-pol TB time series over and around the MCoRDS-derived perennial firn aquifer locations projected on the EASE-Grid 2.0. These time series were overlaid with TIR TB-derived surface freeze-up and melt onset dates to partition the freezing season. Throughout Greenland's percolation facies, TB magnitudes over perennial firn aquifer areas are radiometrically warm, ranging from ∼200 to 240 K (V-pol channel) and ∼160 to 200 K (H-pol channel). L-band TB signatures exhibit relatively slow (i.e., timescales of months) exponential decreases that approach or achieve relatively stable TB magnitudes late in the freezing season. Exponential decreases are the slowest in the physically warmer southern regions of the Greenland Ice Sheet and increase moving toward the colder northern regions. In contrast, TB magnitudes over other percolation facies areas where seasonal meltwater is refrozen and stored exclusively as embedded ice are radiometrically colder, ranging from ∼130 to 200 K (V-pol channel) and ∼100 to 160 K (H-pol channel). L-band TB signatures exhibit relatively rapid (i.e., timescales of weeks to days) exponential decreases, subsequently achieve relatively stable TB magnitudes early in the freezing season and remain relatively stable until melt onset the following year. Exponentially decreasing signatures transition smoothly between these two areas – there is no distinct TB signature that delineates a boundary.
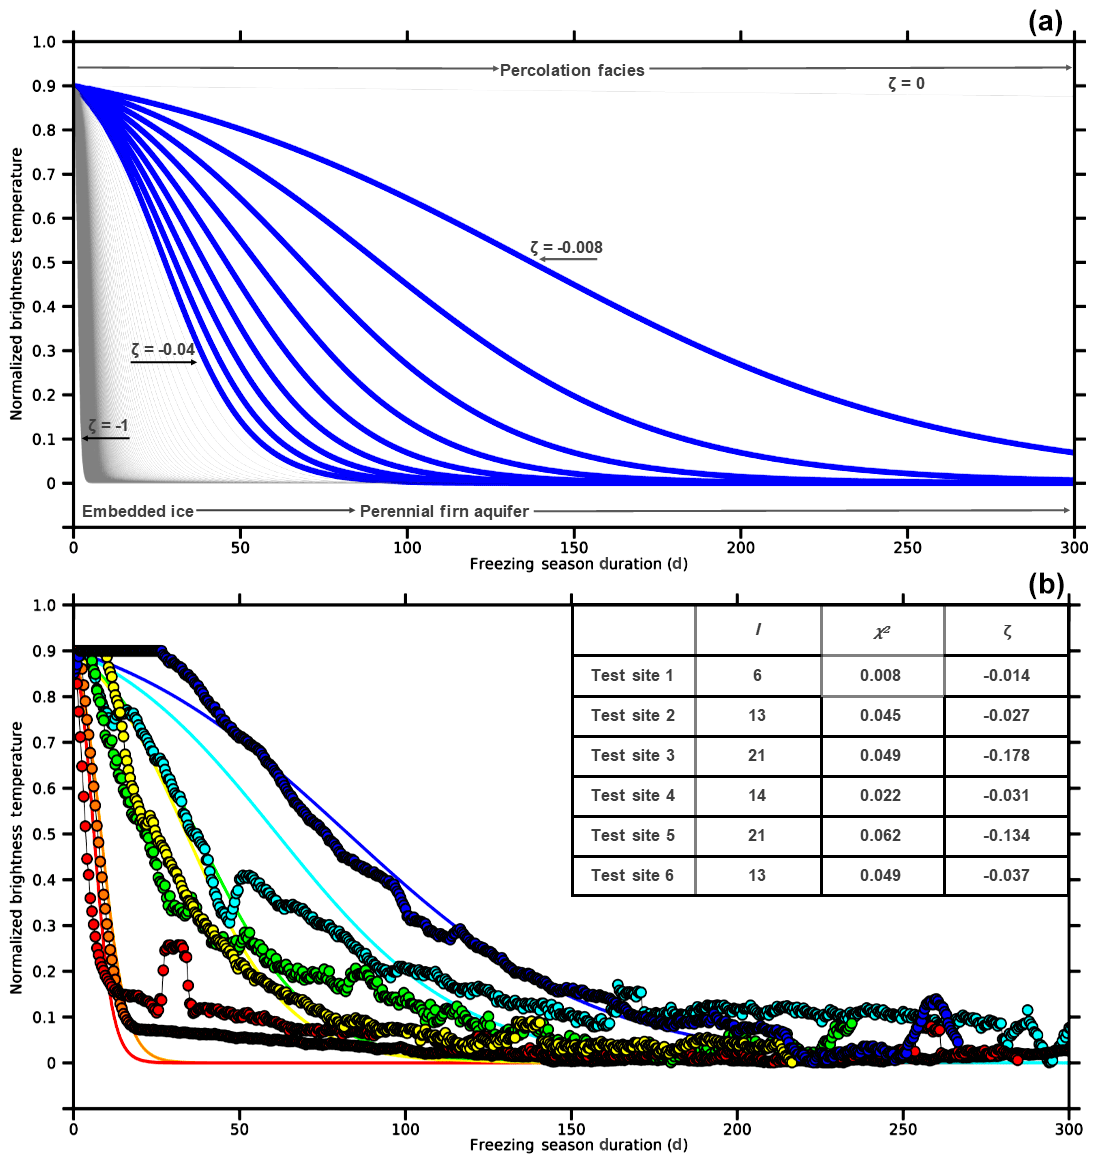
Figure 2(a) Example set of simulated sigmoidal curves corresponding to the interval which represents our model of exponentially decreasing L-band TB signatures over Greenland's percolation facies. Blue lines correspond to the MCoRDS-derived calibration interval used to map Greenland's perennial firn aquifers; grey lines correspond to the interval , which represents percolation facies areas where seasonal meltwater is refrozen and stored exclusively as embedded ice. (b) Examples of TB time series over test sites 1–6 that have been iteratively fit to the sigmoid function using the curve fitting algorithm. Test site 1 (blue circles and line); test site 2 (cyan circles and line); test site 3 (red circles and line); test site 4 (green circles and line); test site 5 (orange circles and line); test site 6 (yellow circles and line); associated curve fitting parameters (i.e., )(upper right table).
2.4.2 Continuous logistic model
We seek a simple mathematical relation that can be fit to the exponentially decreasing L-band TB signatures observed over Greenland's percolation facies. The continuous logistic model satisfies this requirement. It is based on a differential equation that models the increase or decrease in many types of physical systems as a set of simple S-shaped or “sigmoidal” curves. These curves begin with an initial interval of increase or decrease that is approximately exponential. Then, as the function approaches its limit, the increase or decrease slows to approximately linear. Finally, as the function asymptotically reaches its limit, the increase or decrease exponentially tails off and achieves stable values. The continuous logistic model is described by a differential equation known as the logistic equation:
which has the solution
where xo is the function's initial value, ζ is the function's exponential rate of increase or decrease, and t is time. The function x(t) is also known as the sigmoid function. We use the sigmoid function to model the observed exponentially decreasing L-band TB signatures as a set of decreasing sigmoidal curves. To simplify the analysis, the TB time series for each grid cell is first normalized
where is the minimum brightness temperature and is the maximum brightness temperature. The sigmoid fit is then applied as
Here, is the normalized brightness temperature during the freezing season on the time interval t ∈ [tsfu,tmo], where tsfu is the surface freeze-up date, and tmo is the melt onset date. The initial normalized brightness temperature is the function's value at the surface freeze-up date, TB,N(tsfu), while the final normalized brightness temperature is the function's value at the melt onset date TB,N(tmo). TB,N(tmo) can be set by an appropriate selection of a ζ value.
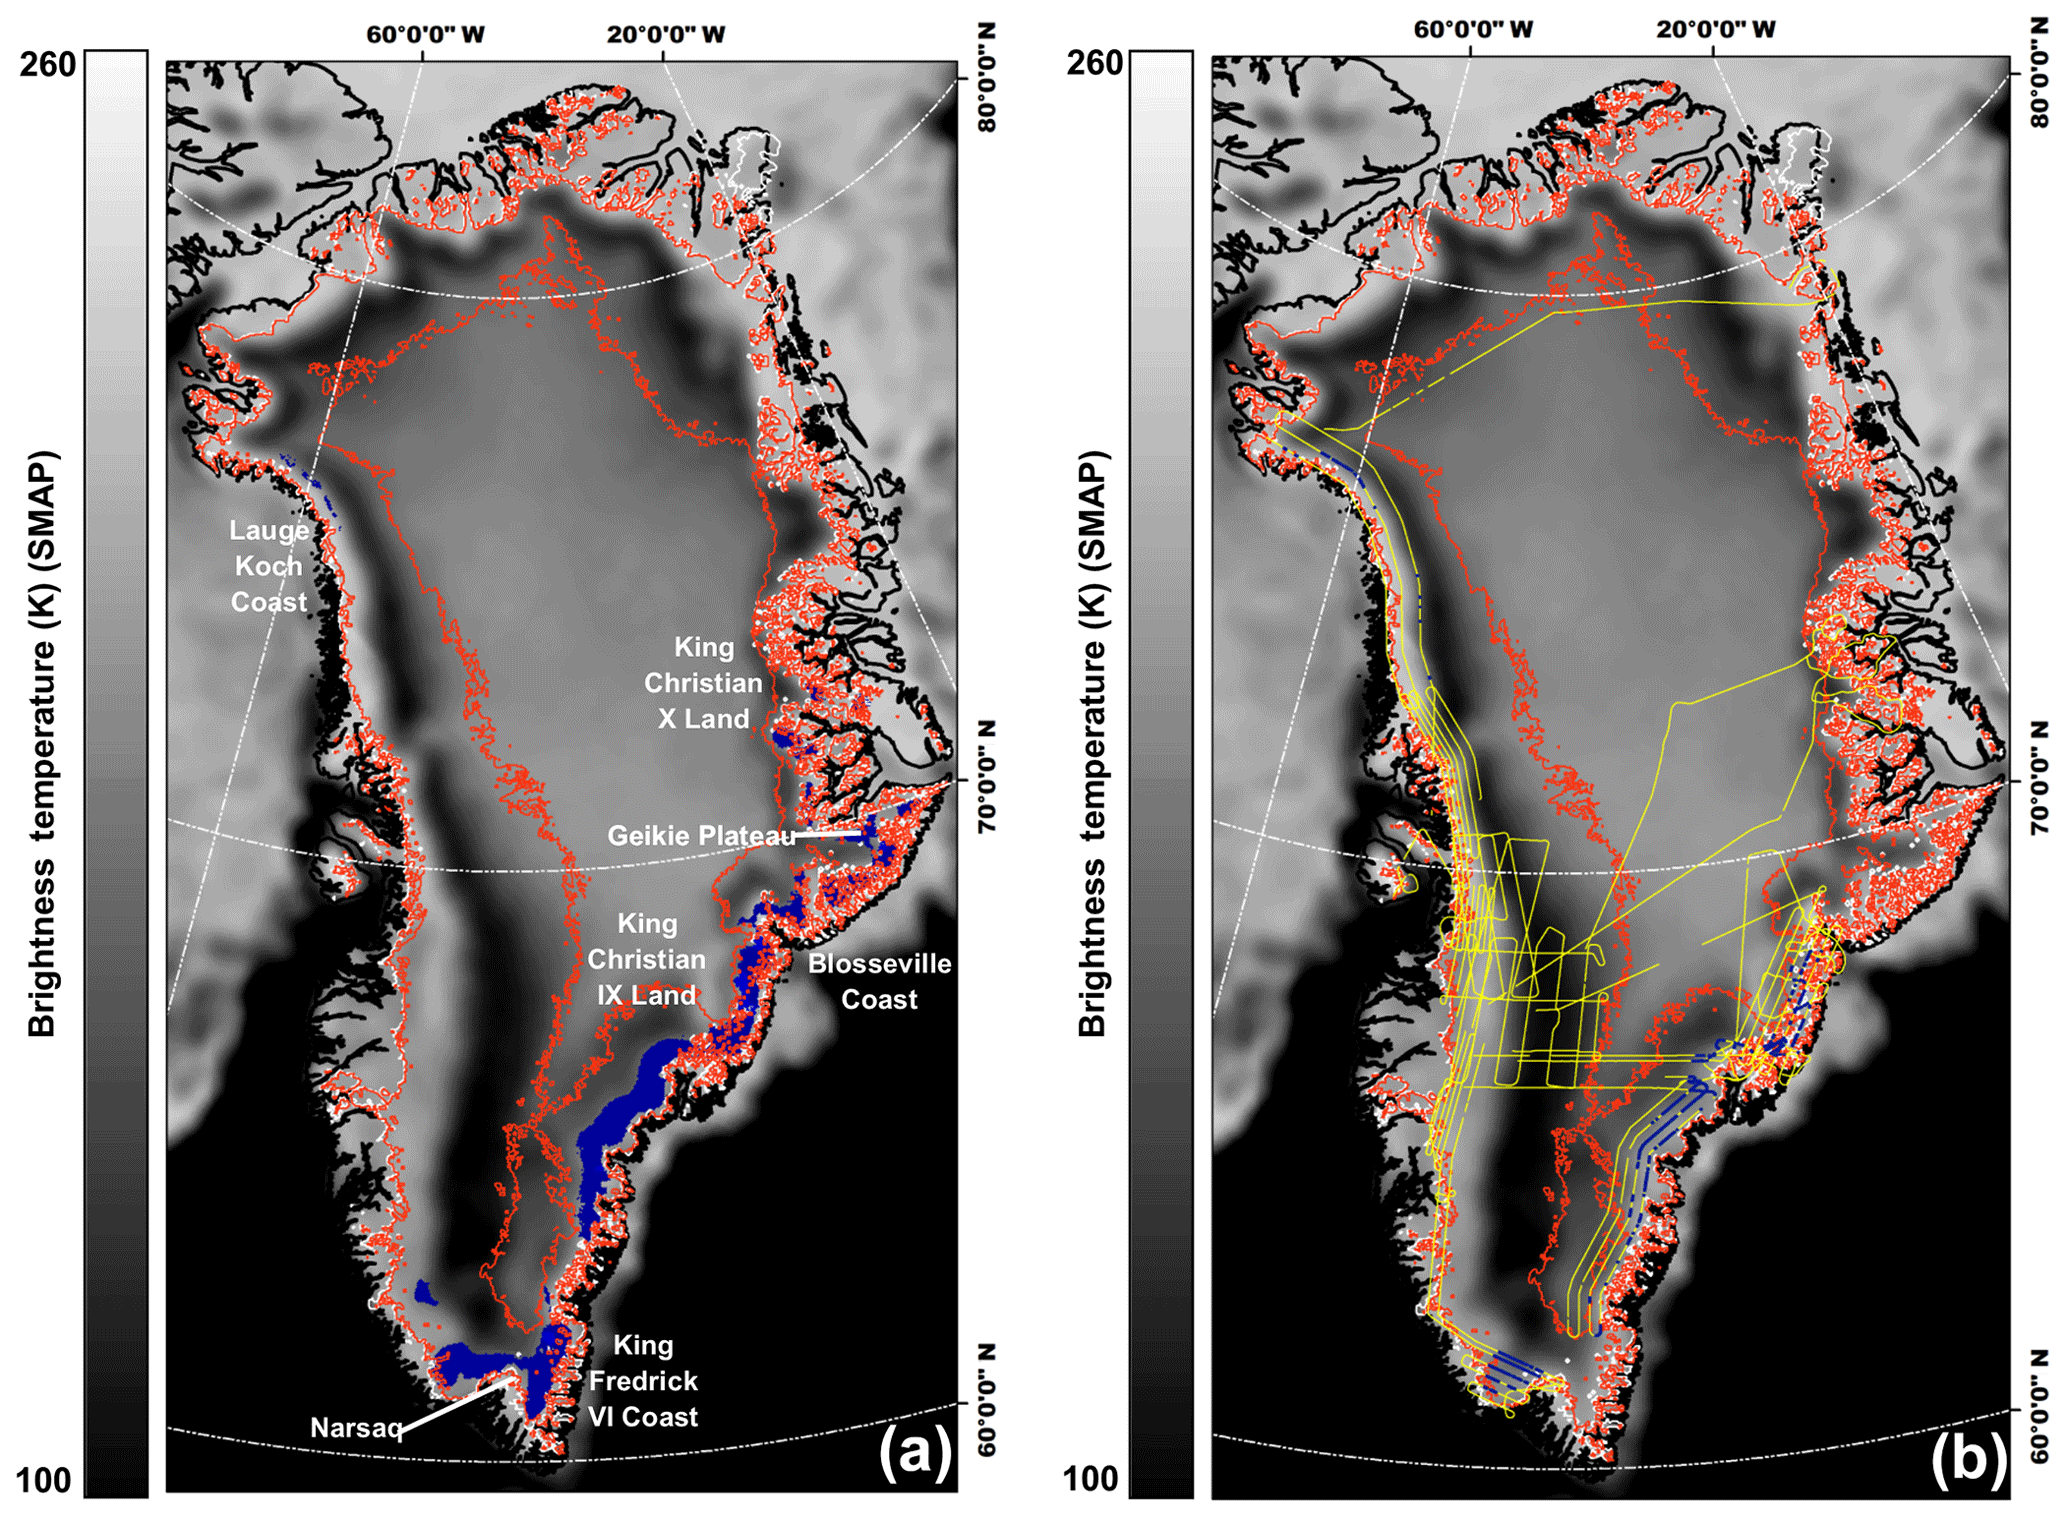
Figure 3(a) The 2015–2016 L-band TB-derived perennial firn aquifer extent (blue shading) overlaid on an enhanced-resolution (3.125 km) V-pol L-band TB image collected 15 April 2016 by the microwave radiometer on the SMAP satellite during the evening orbital pass interval over Greenland (Long et al., 2019). (b) MCoRDS-derived perennial firn aquifer locations (blue circles; Miège et al., 2016) along OIB flight lines (yellow lines), MODIS TIR TB-derived seasonal surface meltwater extent (red lines), GIMP-derived ice extent (white lines; Howat et al., 2014), and coastlines (black lines; Wessel and Smith, 1996).
An example set of simulated sigmoidal curves generated using Eqs. (3) and (4) is shown in Fig. 2a. For these simulated curves, the normalized brightness temperature at surface freeze-up is fixed to a value of , and the freezing season duration is set to a value of t∈ [tsfu,tmo] =300 d, which is within the TIR TB-derived freezing season duration range t= [178, 364 d]. The function's exponential rate of normalized brightness temperature decrease is set to values in the interval , incremented by steps of 0.004. This interval represents our model of exponentially decreasing L-band TB signatures over Greenland's percolation facies. The blue lines correspond to the interval and produce curves similar to those over perennial firn aquifer areas identified via airborne ice-penetrating radar surveys. This interval is used to calibrate the curve fitting algorithm (described in Sect. 2.5). The grey lines correspond to the interval and produce curves similar to those over percolation facies areas where seasonal meltwater is refrozen and stored exclusively as embedded ice.
2.5 L-band TB-derived perennial firn aquifer maps
The curve fitting algorithm proceeds by smoothing V-pol TB time series that have been partitioned by TIR TB-derived surface freeze-up and melt onset dates and then iteratively applying the sigmoid fit. This results in a reduced chi-squared error statistic when fitting V-pol TB time series to the sigmoid function. The V-pol channel exhibits decreased sensitivity to changes in the volumetric fraction of meltwater compared to the H-pol channel. We attribute these differences to reflection coefficient differences between channels. We note, however, that both channels provide reasonable results. Normalized brightness temperature at surface freeze-up is fixed at a value of . Fixing this parameter provides a uniform parameter space in which we can simply analyze ζ values. Although several fixed parameters were tested, this value minimized the influence of meltwater detection (i.e., sharp increases in TB time series) resulting from observational gaps and cloud contamination in the surface freeze-up dates and provided more robust curve fitting.
To distinguish between perennial firn aquifer areas and percolation facies areas where seasonal meltwater is refrozen and stored exclusively as embedded ice, we calibrated the curve fitting algorithm using the MCoRDS-derived perennial firn aquifer locations projected on the EASE-Grid 2.0. For each grid cell we extracted V-pol TB time series and ζ values, and for each of these calibration parameters we calculated the standard deviation (σ). We set thresholds of ±2σ in an attempt to eliminate peripheral grid cells near the ice sheet edge and near the upper perennial firn aquifer boundary where L-band emissions are influenced by morphological features, such as crevasses and exposed glacial ice, and mix with emissions from rock, land, the ocean and adjacent percolation facies areas. We set a minimum brightness temperature threshold of , a maximum brightness temperature threshold of and an exponential rate of normalized brightness temperature decrease threshold of . If the calibration parameters are within the threshold intervals, the grid cell is converted to a simple binary parameter to map extent. V-pol TB time series iteratively fit to the sigmoid function converge quickly (i.e., algorithm iterations ), and observations are a good fit (i.e., chi-squared error statistic is ), indicating our algorithm provides a plausible satellite-derived map of the extent of Greenland's perennial firn aquifers.
We note, however, that the lack of a distinct L-band TB signature that delineates the boundary between perennial firn aquifer areas and adjacent percolation facies areas, and the limited extent the of MCoRDS-derived perennial firn aquifer locations compared to the grid cell size and effective resolution of the V-pol TB time series results in significant uncertainty in the mapped extent. If V-pol TB time series are not quite within the calibration intervals, it does not necessarily indicate that a perennial firn aquifer is not present over at least a percentage of a grid cell. A sensitivity analysis suggests that even small changes in the calibration intervals (i.e., several kelvin for and values and several hundredths of a percentage point for ζ values) can result in extent changes of hundreds of square kilometers. Thus, the mapped extent should simply be considered a rough estimate.
Figure 2b illustrates examples of V-pol TB time series over test sites 1–6 (Fig. 1) that have been iteratively fit to the sigmoid function using the curve fitting algorithm. Test sites 1–4 (blue, cyan, green and yellow circles and lines) are examples of the relatively slowly exponentially decreasing L-band TB signatures exhibited over perennial firn aquifer areas. Test sites 4 and 5 (red and orange circles and lines) are examples of the relatively rapidly exponentially decreasing L-band TB signatures exhibited over other percolation facies areas. The associated curve fitting parameters (i.e., I,χ2, ζ) for each of the test sites are given in the upper right table.
Figure 3 shows the 2015–2016 L-band TB-derived perennial firn aquifer extent generated by the curve fitting algorithm (Fig. 3a) versus the 2016 MCoRDS-derived perennial firn aquifer locations (Fig. 3b). The GIMP-derived ice sheet extent ( km2) is delineated via the peripheral white line. During the 2015 melting season, the TIR TB-derived seasonal surface meltwater extent ( km2) is delineated via the red lines and extends over ∼57 % of the total ice sheet extent. During the spring of 2016, the L-band TB-derived perennial firn aquifer extent (66 000 km2) is mapped in blue and extends over ∼7 % of the seasonal surface meltwater extent and ∼4 % of the total ice sheet extent. Perennial firn aquifer areas are mapped in northwestern Greenland along the Lauge Koch coast, in southern Greenland near Narsaq, in southeastern Greenland along the King Frederick VI Coast and in King Christian IX's Land, and in central eastern Greenland along the Blosseville Coast, on the Geikie Plateau, and in King Christians X's Land.
The L-band TB-derived perennial firn aquifer extent is generally consistent with previous C-band (5.3 GHz) satellite radar scatterometer-derived extents mapped using the Advanced SCATterometer (ASCAT) on the European Organization for the Exploitation of Meteorological Satellites (EUMETSAT) Meteorological Operational A (MetOp-A) satellite (2009–2016, ∼52 000–153 000 km2; Miller, 2019) and the Active Microwave Instrument in scatterometer mode (ESCAT) on the ESA's European Remote Sensing (ERS) satellite series (1992–2001, ∼37 000–64 000 km2; Miller, 2019) as well as with the C-band (5.4 GHz) synthetic aperture radar-derived extent mapped using the synthetic aperture radar on the ESA's Sentinel-1 satellite (2014–2019, 54 000 km2; Brangers et al., 2020).
Our results indicate satellite L-band microwave radiometry is an effective tool for mapping the extent of Greenland's perennial firn aquifers. We have derived an empirical algorithm by analyzing spatiotemporal differences in exponentially decreasing TB signatures over Greenland's percolation facies. We have found that by correlating exponentially decreasing TB signatures with perennial firn aquifer areas identified via airborne ice-penetrating radar surveys that this algorithm can be calibrated, however, with significant uncertainty in the boundary between perennial firn aquifer areas and other percolation facies areas where seasonal meltwater is refrozen and stored exclusively as embedded ice.
While in this study we converted the exponential rate of TB decrease to a simple binary mapping parameter and normalized TB time series, an improved understanding of the physics controlling L-band perennial firn aquifer emissions is critical for the development of more sophisticated retrieval techniques to map a more accurate extent as well as other parameters, such as physical temperature (Jezek et al., 2015) and depth to the upper surface of stored meltwater. Depth is a key control on meltwater-driven hydrofracture (van der Veen, 2007), and thus, the retrieval of this parameter from space has important implications for monitoring ice-sheet-wide instability and ongoing mass loss.
Perennial firn aquifers represent a radiometrically cold subsurface reservoir, similar to subglacial lakes, as suggested by Jezek et al. (2015). Field measurements suggest that the volumetric fraction of meltwater within Greenland's perennial firn aquifers may be as high as ∼25 % (Koenig et al., 2014), resulting in high permittivity (), which limits the transmission of electromagnetic radiation (∼10 %). Upwelling L-band emissions from deeper glacial ice, and from below the upper surface of stored meltwater, are extinguished by reflection at water-saturated layer interfaces. While radiometrically cold, the slow refreezing of deeper firn layers saturated with large volumetric fractions of meltwater represents a significant source of latent heat that is continuously released throughout the freezing season. Refreezing of seasonal meltwater by the descending winter cold wave, and the subsequent formation of embedded ice structures within the upper firn layers, represents a secondary source of latent heat. Perennial firn aquifer areas are physically, and thus radiometrically, warmer than other percolation facies areas where the single source of latent heat is via refreezing of seasonal meltwater and the formation of embedded ice structures.
We hypothesize the key control on the relatively slow exponential rate of TB decrease in perennial firn aquifer areas is physical temperature at depth. L-band emissions from radiometrically warm firn layers are decreased over time as embedded ice structures slowly refreeze at increased depths below the ice sheet surface. Refreezing of seasonal meltwater results in the formation of an intricate network of embedded ice structures (i.e., ice pipes, lenses and layers) that are large (∼10–100 cm long, ∼10–20 cm wide; Jezek et al., 1994) relative to the L-band wavelength (∼21 cm) and induce strong volume scattering (Rignot, 1995). Simulating the exponential rate of TB decrease and the associated changes in TB magnitudes over perennial firn aquifer areas by combining electromagnetic forward models that include embedded ice structure parametrizations (Jezek et al., 2018) with plausible models of depth-dependent physical properties can test this hypothesis and is the focus of ongoing studies. Of particular interest is understanding the relationship between the exponential rate of TB decrease and changes in the depth to the upper surface of stored meltwater over time.
Enhanced-resolution L-band TB image time series have been produced as part of the NASA Science Utilization of SMAP project and are available at https://doi.org/10.5067/QZ3WJNOUZLFK (Brodzik et al., 2019). IST image time series have been produced as part of the Multilayer Greenland Ice Surface Temperature, Surface Albedo, and Water Vapor from MODIS V001 data set and are available at https://doi.org/10.5067/7THUWT9NMPDK (Hall and DiGirolamo, 2019). The NASA MEaSURE's Greenland Ice Mapping Project (GIMP) Land Ice and Ocean Classification Mask, version 1 is available at https://doi.org/10.5067/B8X58MQBFUPA (Howat, 2017). The coastline data are available from GSHHG – A Global Self-consistent, Hierarchical, High-resolution Geography Database https://doi.org/10.1029/96JB00104 (Wessel and Smith, 1996).
JZM initiated the study, performed the analyses and wrote the manuscript. DGL and MJB generated the enhanced-resolution L-band TB image time series. JZM and DGL developed the empirical algorithm. CAS provided perspective on the IST data. KCJ and JZM imagined the emissions concept. All authors reviewed and commented on manuscript drafts.
The authors declare that they have no conflict of interest.
Julie Z. Miller would like to thank the Byrd Postdoctoral Fellowship Program. We would like to thank Dorothy Hall for providing the IST image time series very early in the study and Clement Miège for providing the MCoRDS-derived perennial firn aquifer locations.
This research has been supported by the NASA Instrument Incubator Program (no. NNX14AE68G) and the NASA Cryospheric Science Program (no. 80NSSC18K0550) under grants to The Ohio State University and by the NASA Cryospheric Science Program (no. 80NSSC18K1055) and the NSF Antarctic Glaciology Program (no. PLR-1745116) under grants to the University of Colorado. Additional support was provided by NASA Headquarters Cryospheric Science Program. Development and production of the enhanced-resolution SMAP data used for this research was supported by NASA ROSES Program Element “Science Utilization of Soil Moisture Active Passive Mission” under grants to Brigham Young University (no. NNX16AN01G) and the University of Colorado at Boulder (no. NNX16AN02G).
This paper was edited by Ruth Mottram and reviewed by two anonymous referees.
Brangers, I., Lievens, H., Miège, C., Demuzere, M., Brucker, L., and De Lannoy, G. J. M.: Sentinel-1 detects firn aquifers in the Greenland ice sheet, Geophys. Res. Lett., 47, e2019GL085192, https://doi.org/10.1029/2019GL085192, 2020.
Brodzik, M. J., Billingsley, B., Haran, T., Raup, B., and Savoie, M. H.: EASE-Grid 2.0: incremental but significant improvements for Earth-gridded data sets, ISPRS Int. Geo-Inf., 1, 32–45, 2012.
Brodzik, M. J., Long, D. G., and Hardman, M. A.: SMAP Radiometer Twice-Daily rSIR-Enhanced EASE-Grid 2.0 Brightness Temperatures, Version 1, Boulder, Colorado USA, NASA National Snow and Ice Data Center Distributed Active Archive Center, https://doi.org/10.5067/QZ3WJNOUZLFK (last access: 27 January 2020), 2019.
Forster, R. R., Box, J. E., Van Den Broeke, M. R., Miège, C., Burgess, E. W., Van Angelen, J. H., Lenaerts, J. T. M., Koenig, L. S., Paden, J., Lewis, C., Gogineni, S. P., Leuschen, C., and McConnell, J. R.: Extensive liquid meltwater storage in firn within the Greenland Ice Sheet, Nat. Geosci., 7, 95–98, https://doi.org/10.1038/ngeo2043, 2014.
Fountain, A. G. and Walder, J. S.: Water flow through temperate glaciers, Rev. Geophys., 36, 299–328, https://doi.org/10.1029/97RG03579, 1998.
Hall, D. K. and DiGirolamo, N.: Multilayer Greenland Ice Surface Temperature, Surface Albedo, and Water Vapor from MODIS, Version 1, Boulder, Colorado USA, NASA National Snow and Ice Data Center Distributed Active Archive Center, https://doi.org/10.5067/7THUWT9NMPDK (last access: 27 January 2020), 2019.
Hall, D. K., Comiso, J. C., Digirolamo, N. E., Shuman, C. A., Key, J. R., and Koenig, L. S.: A satellite-derived climate-quality data record of the clear-sky surface temperature of the Greenland ice sheet, J. Clim., 25, 4785–4798, https://doi.org/10.1175/JCLI-D-11-00365.1, 2012.
Howat, I.: MEaSUREs Greenland Ice Mapping Project (GIMP) Land Ice and Ocean Classification Mask, Version 1, Boulder, Colorado USA, NASA National Snow and Ice Data Center Distributed Active Archive Center, https://doi.org/10.5067/B8X58MQBFUPA (last access: 27 January 2020), 2017.
Howat, I., Negrete, A., and Smith, B.: The Greenland Ice Mapping Project (GIMP) land classification and surface elevation data sets, The Cryosphere, 8, 1509–1518, https://doi.org/10.5194/tc-8-1509-2014, 2014.
Jezek, K. C., Gogineni, P., and Shanableh, M.: Radar measurements of melt zones on the Greenland Ice Sheet, Geophys. Res. Lett., 21, 33–36, https://doi.org/10.1029/93GL03377, 1994.
Jezek, K. C., Johnson, J. T., Drinkwater M. R., Macelloni G., Tsang L., Aksoy M., and Durand M.: Radiometric Approach for Estimating Relative Changes in Intraglacier Average Temperature, IEEE Trans. Geosci. Remote S., 53, 134–143, https://doi.org/10.1109/TGRS.2014.2319265, 2015.
Jezek, K. C., Johnson J.T., Tan S., Tsang L., Andrews, M. J., Brogioni M., Macelloni G., Durand M., Chen, C. C., Belgiovane, D. J., Duan, Y., Yardim, C., Li, H., Bringer, A., Leuski, V., and Aksoy, M.: 500–2000-MHz brightness temperature spectra of the northwestern Greenland Ice Sheet, IEEE Trans. Geosci. Remote S., 56, 1485–1496, https://doi.org/10.1109/TGRS.2017.2764381, 2018.
Koenig, L. S., Miège, C., Forster, R. R., and Brucker, L.: Initial in situ measurements of perennial meltwater storage in the Greenland firn aquifer, Geophys. Res. Lett., 41, 81–85, https://doi.org/10.1002/2013GL058083, 2014.
Leuschen, C., Gogineni, P., Hale, R., Paden, J., Rodriguez-Morales, F., Panzer B., and Gomez, D.: IceBridge MCoRDS L1B geolocated radar echo strength profiles, version 2, NASA DAAC at the National, Snow and Ice Data Center, Boulder, Colorado, 2014.
Long, D. G., Brodzik, M. J., and Hardman, M. A.: Enhanced–resolution, SMAP brightness temperature image products, IEEE Trans. Geosci. Remote S., 57, 4151–4163, https://doi.org/10.1109/TGRS.2018.2889427, 2019.
Miège, C., Forster, R. R., Brucker, L., Koenig, L. S., Solomon, D. K., Paden, J. D., Box, J. E., Burgess, E. W., Miller, J. Z., McNerney, L., Brautigam, N., Fausto, R. S., and Gogineni, S.: Spatial extent and temporal variability of Greenland firn aquifers detected by ground and airborne radars, J. Geophys. Res.-Earth, 121, 2381–2398, https://doi.org/10.1002/2016JF003869, 2016.
Miller, J. Z.: Mapping Greenland's firn aquifers from space, Ph.D. thesis, Department of Geography, University of Utah, 135 pp., 2019.
Miller, J. Z., Forster, R. R., Long, D. G., and Brewer, S.: Satellite observation of winter season subsurface liquid melt water retention on the Greenland Ice Sheet using spectroradiometer and scatterometer data, AGU Fall Meeting, San Francisco, California, USA, 9–13 December 2013, C51A-0508, 2013.
Miller, O. L., Solomon, D. K., Miège, C., Koenig, L. S., Forster, R. R., Montgomery, L. N., Schmerr, N., Ligtenberg, S. R. M., Legchenko, A., and Brucker, L.: Hydraulic conductivity of a firn aquifer in southeast Greenland, Front. Earth Sci., 5, https://doi.org/10.3389/feart.2017.00038, 2017.
Munneke, P. K., Ligtenberg, S. R. M., Van Den Broeke, M. R., Van Angelen, J. H., and Forster, R. R.: Explaining the presence of perennial liquid water bodies in the firn of the Greenland Ice Sheet, Geophys. Res. Lett., 41, 476–483, https://doi.org/10.1002/2013GL058389, 2014.
Nghiem, S. V., Hall, D. K., Mote, T. L., Tedesco, M., Albert, M. R., Keegan, K., Shuman, C. A., DiGirolamo, N. E., and Neumann, G.: The extreme melt across the Greenland Ice Sheet in 2012, Geophys. Res. Lett., 39, L20502, https://doi.org/10.1029/2012GL053611, 2012.
Rignot, E.: Backscatter model for the unusual radar properties of the Greenland Ice Sheet, J. Geophys. Res., 100, 9389–9400, https://doi.org/10.1029/95JE00485, 1995.
Shuman, C. A., Halle, D. K., DiGirolamo, N. E, Mefford T. K., and Schnaubelt, M. J.: Comparison of near-surface air temperatures and MODIS ice-surface temperatures at Summit, Greenland (2008–2013), J. Appl. Meteor. Climatol., 53, 2171–2180, https://doi.org/10.1175/JAMC-D-14-0023.1, 2014.
van der Veen, C. J.: Fracture propagation as means of rapidly transferring surface meltwater to the base of glaciers, Geophys. Res. Lett., 34, L01501, doi:10.1029/2006GL028385, 2007.
Wessel, P. and Smith, W. H. F.: A global, self-consistent, hierarchical, high-resolution shoreline database, J. Geophys. Res., 101, 8741–8743, https://doi.org/10.1029/96JB00104, 1996.