the Creative Commons Attribution 4.0 License.
the Creative Commons Attribution 4.0 License.
 | 13 Aug 2020
Applying artificial snowfall to reduce the melting of the Muz Taw Glacier, Sawir Mountains
Xiaoying Yue
Lin Wang
Huilin Li
Zhencai Du
Jing Ming
Zhongqin Li
The glaciers in the Sawir Mountains, Altai area, have been experiencing a continuing and accelerating ice loss since 1959, although the snowfall is abundant and evenly distributed over the year. As an attempt to reduce their melting, we carried out two artificial snowfall experiments on the Muz Taw Glacier during 19–22 August 2018. We measured the albedo and mass balance at different sites along the glacier before and after the experiments. Two automatic weather stations (AWSs) were set up at the equilibrium line altitude (ELA) of the glacier as the target area and the forefield as the control area to record the precipitation, respectively. A comparison of the two precipitation records from the two AWSs suggests that natural precipitation could account for up to 21 % of the snowfall received by the glacier during the experiments. Because of the snowfalls, the glacier's surface albedo significantly increased in the middle to upper part; the average mass loss during 18–24 August (after the experiments) decreased by between 32 and 41 mm w.e (14 %–17 %) compared to during 12–18 August (before the experiments); and the mass resulting from the snowfall accounted for between 42 % and 54 % of the total melt during 18–24 August. We also propose a mechanism involving artificial snowfall, albedo, and mass balance, and the feedbacks describing the role of snowfall in reducing the melting of the glacier. The current status of the work is primitive as it is a preliminary trial, and the conclusions need more controlling experiments to validate it against larger spatio-temporal scales in future.
- Article
(9333 KB) - Full-text XML
- BibTeX
- EndNote


Mountain glaciers are an essential part of the cryosphere. As high-altitude reservoirs, they are vital solid-water resources (Immerzeel et al., 2019; Immerzeel et al., 2010). Glacier fluctuations represent an integration of changes in the mass and energy balance and are well recognized as high-confidence indicators of climate change (Bojinski et al., 2014). Satellite and in situ observations of changes in the glacial area, namely length and mass, show a global coherence of continued mountain–glacier recession in the last 3 decades, with only a few exceptions (Zemp et al., 2019). For the Sawir Mountains, the ablation of the glaciers is more intense than the global average, and the total area of the glaciers reduced by 46 %, from 23 km2 in 1977 to 12.5 km2 in 2017 (Wang et al., 2019). The accelerated retreat of glaciers not only causes spatio-temporal changes in water resources but also has a significant impact on sea level rise, regional water cycles, ecosystems, and socioeconomic systems (such as agriculture, hydropower, and tourism); the melting of glaciers also increases the occurrence of glacial disasters, such as glacial lake outburst flooding, icefalls, and glacial debris flows (Hock et al., 2019).
So far, there are not so many approaches used in practice for reducing the rate of glacier ablation. Some technical measures, including energy conservation, temperature-increase control, and establishing glacial reserves, have been taken to reduce the ice melting on Earth. In recent years, new ideas and techniques have emerged to slow the melting of glaciers. For example, in the Rhône Glacier in the Swiss Alps, white blankets are used to shelter the glacier and slow down its melting (Dyer, 2019). In the Morteratsch Glacier in the Swiss Alps, artificial snow was expected to be applied to slow down the glacier melting (Oerlemans et al., 2017). In Austrian glacier ski resorts, an over 20 m thickness of the ice was preserved on mass balance managed areas compared to non-maintained areas during 1997–2006 (Fischer et al., 2016).
Cloud seeding over a glacier to generate and enhance snowfall to reduce mass loss has rarely been tested in previous studies. There have always been controversial discussions on the virtual efficacy and advantages of using silver iodine (AgI) smoke to seed clouds and enhance precipitation since the measure was introduced by Vonnegut (1947). The controversy mainly resides in two sides. One side claimed that no statistical or physical evidence had been provided to establish the scientific validity of the operations (Council, 2003; Silverman, 2001), while the other affirmed that the past operations conducted in Australia successfully increased precipitation from 5 % to 50 % (Bowen, 1952; CSIRO, 1978; Smith, 1967). However, both sides agreed that the experiments of seeding clouds and producing more precipitation were promising and deserved more observations to understand the link between physical reactions leading to precipitation (Council, 2003). A peer-reviewed report on global artificial snowfall activities by the World Meteorological Organization suggests that the toxicity of the seeding material (mainly silver iodine, i.e. AgI) is unlikely to trigger environmental hazards (Flossmann et al., 2018). A potential concern is that artificial precipitation activities might redistribute the natural precipitation over a region; however, applying cloud seeding over the mountain glaciers, usually up to 5 km in length, in central Asia is presumably acceptable.
As an attempt, we selected the Muz Tau glacier in the Sawir Mountains as the projected glacier. During the glacier's ablation period in 2018, we tried to induce artificial precipitation by using the ground AgI smoke generators to seed clouds over the glacier. These smog generators were set up there by the local meteorological service for artificial precipitation tasks. We also combined the precipitation amounts and type, time and frequency recorded by the rainfall gauge, and the mass balance and albedo of the glacier measured to study the role of artificial snowfall in reducing the mass loss of the glacier.
The Sawir Mountains span the border shared by China and Kazakhstan and are the transitional section between the Tian Shan Mountains and the central Altai Mountains. The Muz Taw Glacier (47∘04′ N, 85∘34′ E) is a northeast-orientated valley glacier with an area of 3.13 km2 and a length of 3.2 km in 2016, located on the northern side of the Sawir Mountains (Fig. 1). Its elevation, from the terminus to the highest point, ranges from 3137 to 3818 m a.s.l., and its ice volume is 0.28 km3 with an average ice thickness of 66 m (Wang et al., 2018).
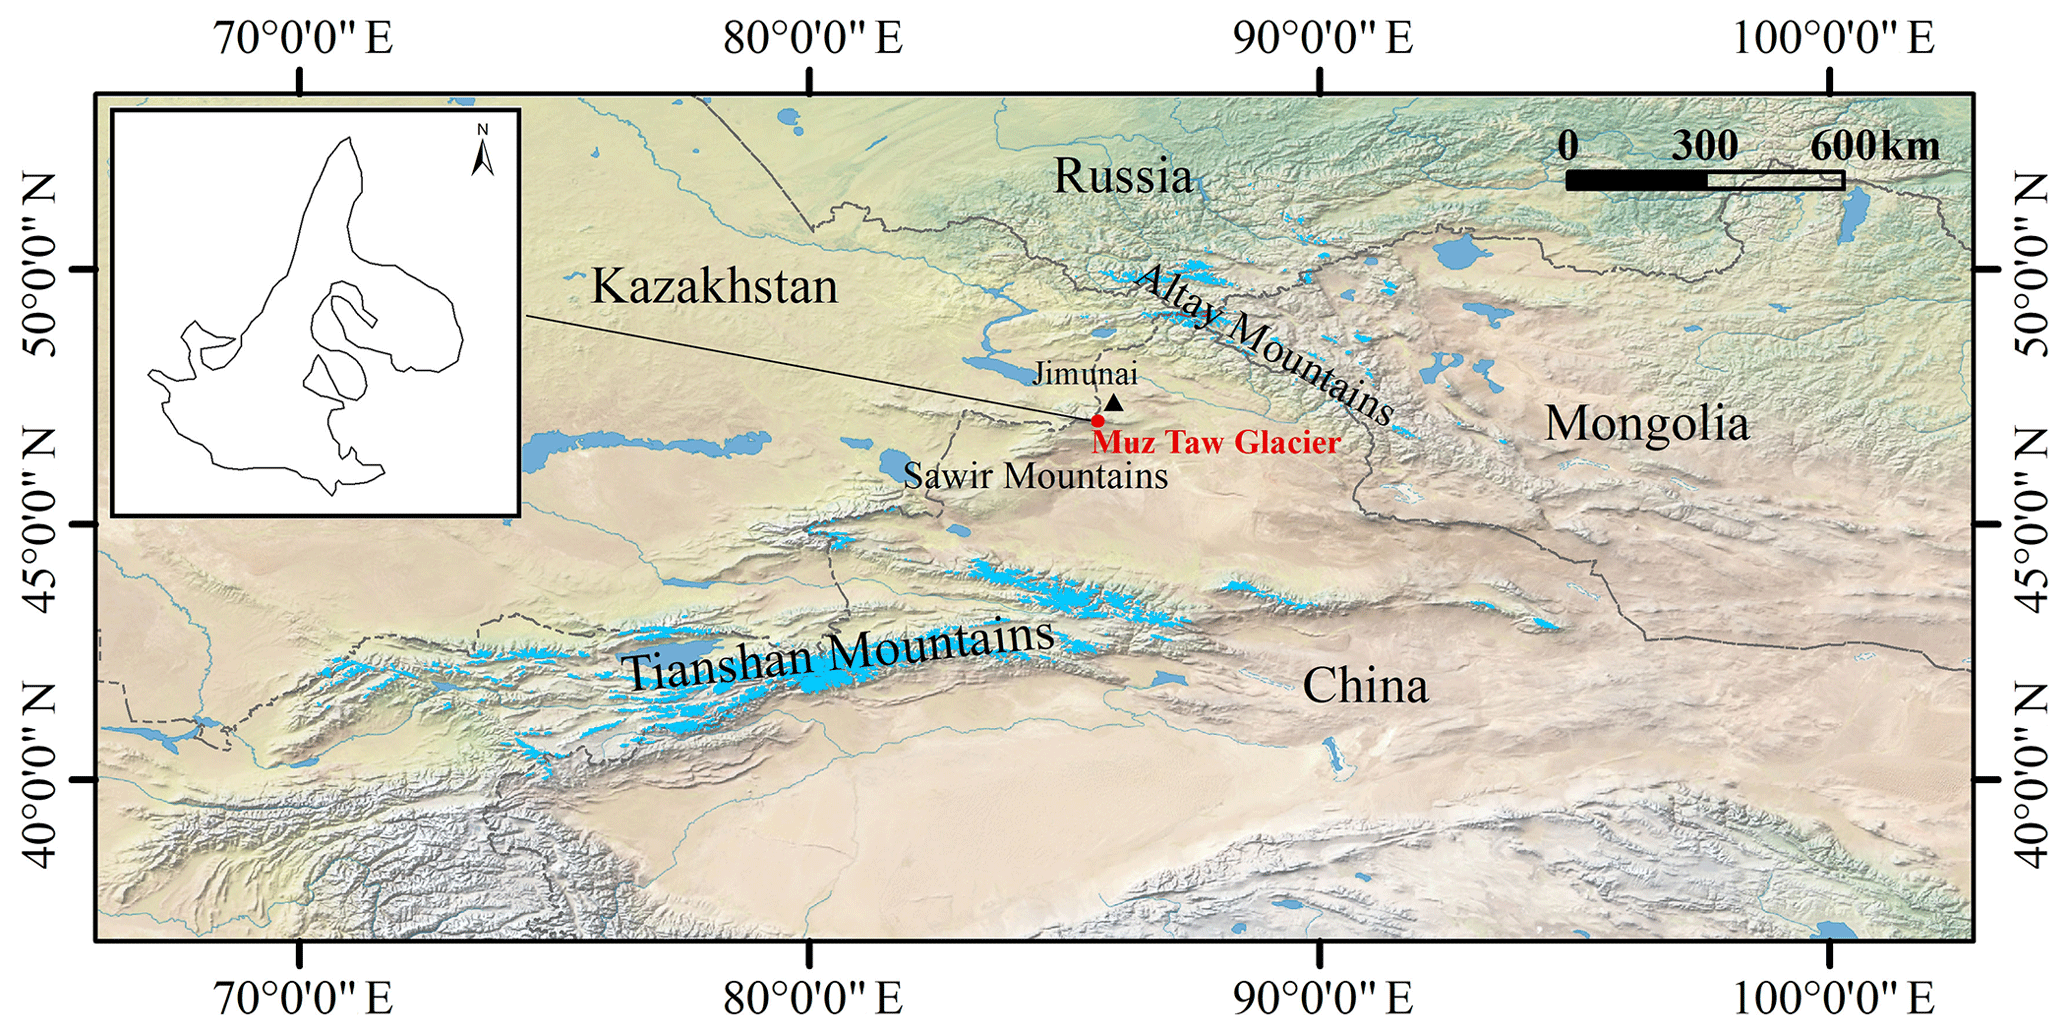
Figure 1Location of the Muz Taw Glacier and the Sawir Mountains; the map in the background was made with © Natural Earth and is available at https://www.naturalearthdata.com/ (last access: 2 August 2020), and the outline of the glacier was sourced from Guo et al. (2015).
The general circulation over the study area features the prevailing westerlies interacting with the Asian anticyclone and polar air mass in winter (Panagiotopoulos et al., 2005). At the Jimunai Meteorological Station (984 m a.s.l.), 46 km northeast of the Muz Taw Glacier, the annual mean air temperature measured was 4.27 ∘C, the annual mean precipitation was 212 mm during 1961–2016, and the winter precipitation accounted for 10 %–30 % of the annual total.
The Muz Taw Glacier has been in constant recession since 1959 (Wang et al., 2019). Especially over the past 20 years, it has been experiencing a rapid and accelerated shrinkage. From 1977 to 2017, the glacier area decreased by 10.51 km2, accounting for 46 % of its previous surface area (Wang et al., 2019). The average retreat rate of the glacier terminus was 11.5 m a−1 during 1989–2017. The latest measurements show the mass balance of the Muz Taw Glacier was −975 mm w.e. in 2016, −1192 mm w.e. in 2017, and −1286 mm w.e. in 2018, respectively, and the annual equilibrium line of the glacier was approximately 3400 m a.s.l. (Song et al., 2019).
3.1 Meteorological radar observations
We used a WR-08X digital radar system (Wuxi Leyoung Electronics Technology Co., Ltd) built up at the Jimunai Meteorological Station to identify the precipitation clouds around the Sawir Mountains. The radar is a new X band digital weather radar capable of detecting meteorological targets within 300 km. The radar can quantitatively detect the spatial distribution of the intensity of rain cloud targets below 20 km, distanced from 5 to 150 km, and their motions (e.g. developing height, moving direction, and speed.). It can also provide real-time meteorological information. A more detailed description of its application in this area can be referred to in Xu et al. (2017).
3.2 Artificial precipitation experiment
The Muz Taw Glacier is developing along the valley, and the terminal is the heading source of the Ulequin Urastu River and Ulast River. A total of 14 silver iodide (AgI) smog generators have been distributed along the rivers for artificial precipitation tasks by the local meteorological service. These smog generators use solar power to light and are remotely controlled. The AgI sticks used in the generators allowed us to generate 1014 AgI-containing ice nuclei per gram at −7.5 ∘C ∘C (Kong et al., 2016). In the daytime, valley winds prevail along the valley up to the glacier due to intense radiation and the heating and lifting effect for air over the snow surface. It is ideal for generating AgI smog and carrying it with the upward air stream over the glacier surface to form precipitation. No extra water is needed to form precipitation in our experiments. We monitored the distribution and structural development of clouds and identified the orientation, height, and distance of the clouds approaching the glacier at the radar station. After observing the movements of the potential target clouds and receiving the reflection of the radar transmission, we ignited the smog generators to seed artificial precipitation when we realized that the possibility was high enough to potentially form precipitation (Fig. 2). The detailed operation of conducting artificial precipitation in the studied glacier has been described in Xu et al. (2017).
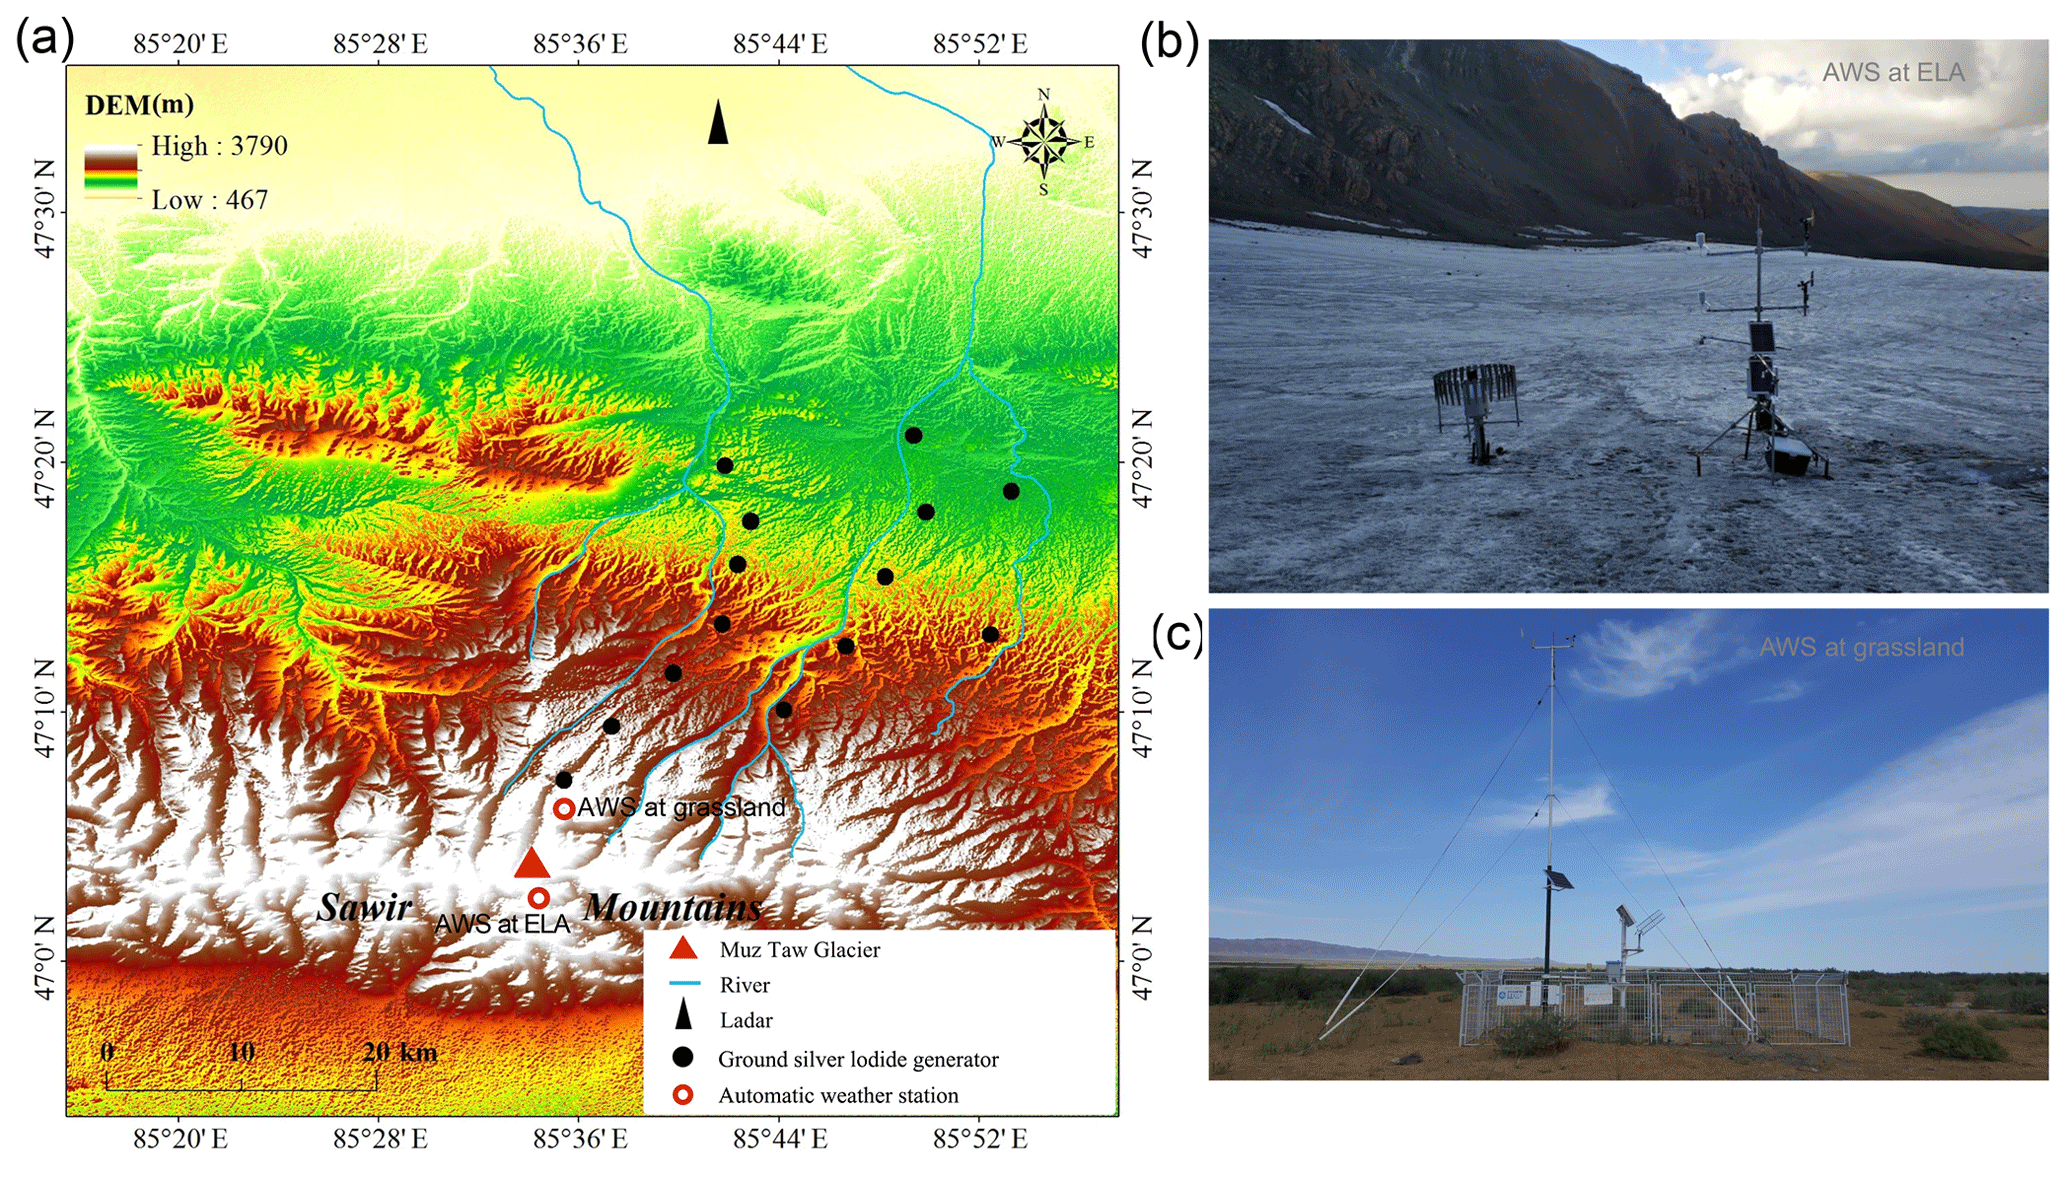
Figure 2(a) The map of the study area including the Muz Taw Glacier, the two automatic weather stations (AWSs) set up at the equilibrium line elevation (ELA), and the forefield of the glacier and the distribution of the silver iodide smog generators along the Ulequin Urastu River and Ulast River in the Sawir Mountains for seeding artificial precipitation. (b) The AWS set-up at ELA and (c) the AWS set-up at grassland, with a straight distance of ∼5 km north to the AWS at ELA.
First, we used the radar to identify local convective clouds in the background of synoptic clouds and measured the orientation, height, and distance of the convections to determine the time and place to perform the artificial precipitation seeding. And then we chose the most favourable time to ignite the silver iodide smog generators (Fig. 3a) and let the silver iodide (AgI) particles act as catalysers and help to form artificial ice nuclei (Fig. 3b) to absorb more water vapour and promote the formation of precipitation.
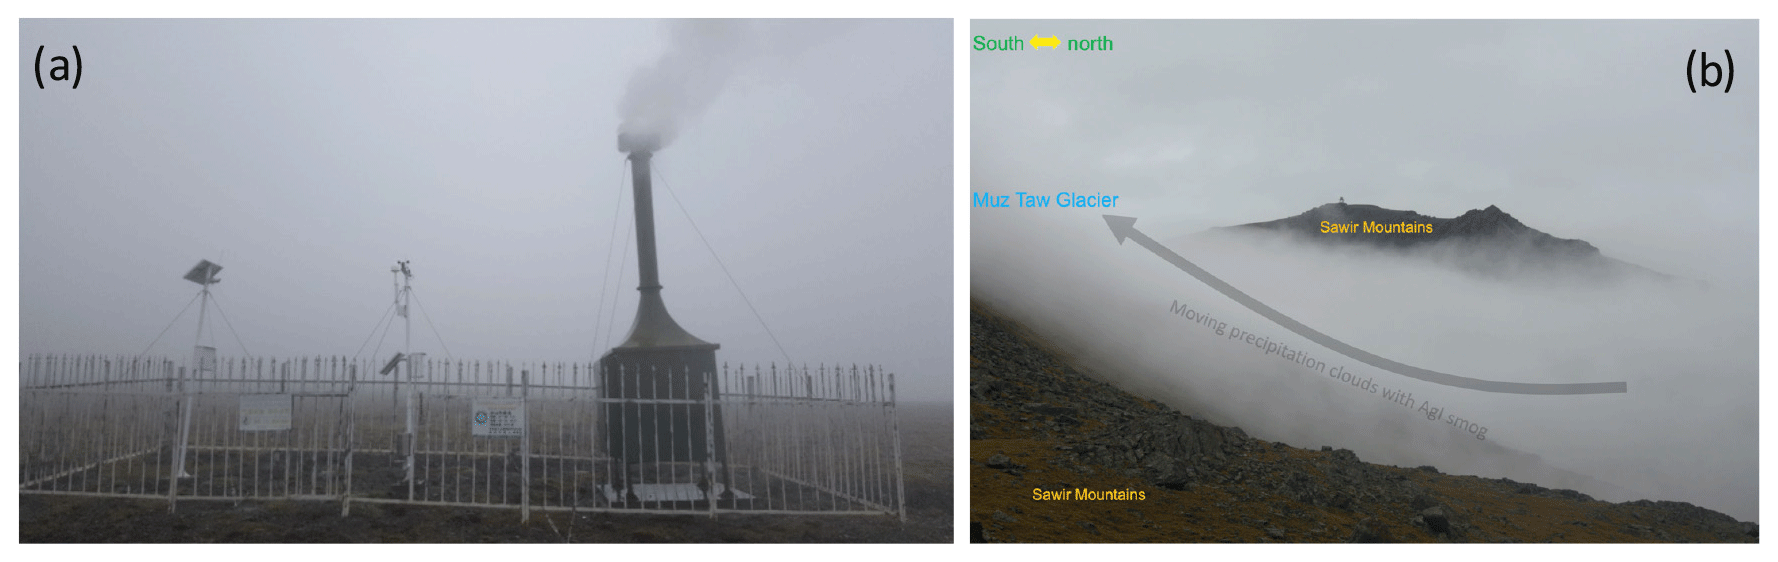
Figure 3(a) Igniting the AgI smog generators along the terminal river when the clouds accumulated late in the afternoon of 19 and 22 August 2018. (b) The accumulation of clouds in the valley of the Muz Taw Glacier, favoured by the AgI particles, moved up towards the summit of the glacier.
3.3 Measurement by the automatic weather stations (AWSs)
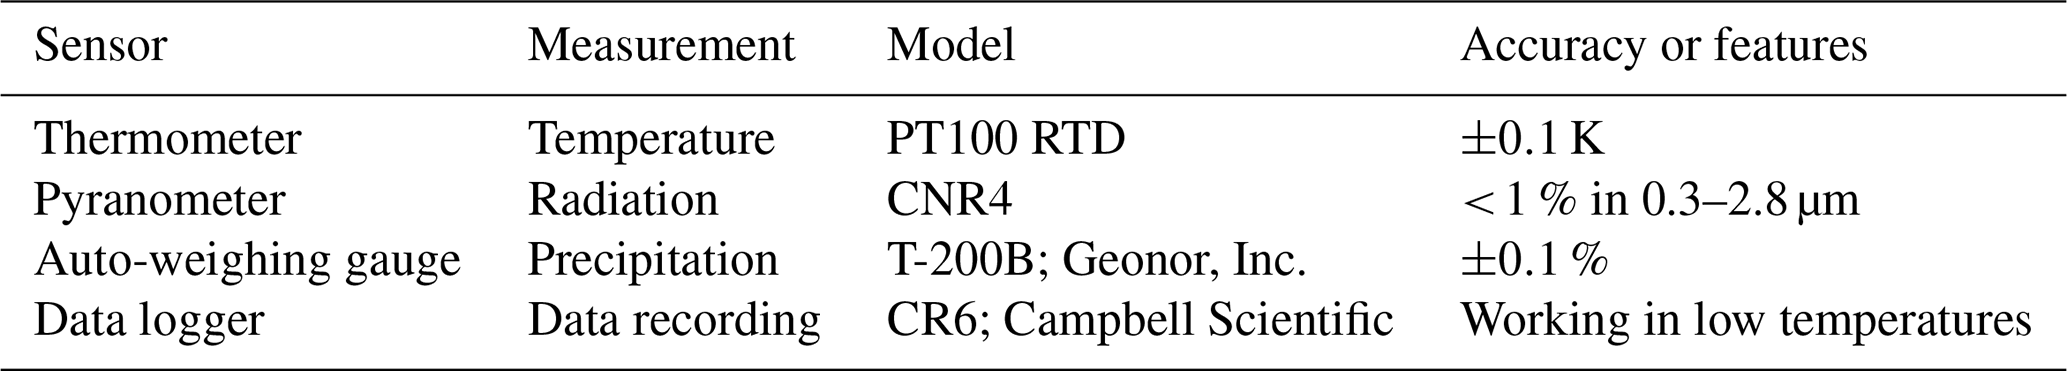
We set up an automatic weather station (AWS at the equilibrium line altitude) on a relatively flat surface near the equilibrium line altitude (ELA) of the Muz Taw Glacier from 8 August 2018 (47∘03′36′′ N, 85∘33′43′′ E, 3430 m a.s.l.; Figs. 2a–b and 4). The AWS has various sensors to fulfil the requirements of our study (Table 1). A thermometer (PT100 RTD, ±0.1 K) was mounted horizontally at 1.5 m above the surface to measure the air temperature. The measurement of albedo was calculated by measuring incoming and reflected shortwave radiation with the CNR4 pyranometer mounted on the AWS at a height of 1.5 m. The error of the pyranometer is smaller than 1 % in the wavelength from 0.3 to 2.8 µm. Precipitation was measured by an auto-weighing gauge (T-200B; Geonor, Inc.) with an accuracy of about ±0.1 %. All sensors were connected to a data logger (CR6; Campbell Scientific) which is able to work in low temperatures (−55 ∘C) and record the hourly means every 10 s. In the forefield of the glacier, around 5 km north of the AWS at the ELA, another AWS on the grassland (AWS at grassland) was set up by the local meteorological service to monitor conventional meteorology (Fig. 2a and c).
Table 1The sensors mounted on the AWS at ELA and their technical features.
3.4 Measurement of the surface spectral reflectance
We used an ASD FieldSpec HandHeld 2 spectroradiometer to measure the reflectance data at 325–1075 nm, with a resolution of 3 nm and an error of less than 4 %. The measurement sensor, fitted with a bare fibre, was mounted on a tripod at 0.5 m above the surface and had a 25∘ field of view to a spot sized ∼0.225 m in diameter. The spectroradiometer was calibrated to the hemispherical atmospheric conditions at the time, by viewing a white reference panel and then viewing the glacier surface. We recalibrated the instrument on occasions when the sky radiation conditions changed. To minimize the influence of slope and solar zenith angle on albedo, we conducted the measurements in a water level plane within 12:00–16:00 local time (LT). At each sampling site, three consecutive spectra, consisting of 10 dark currents per scan and 10 white reference measurements, were recorded and averaged. Meanwhile, cloud cover and surface type were noted for each measurement.
We measured spectral reflectance at 14 sites across the glacier on 18, 20, 22, and 24 August 2018 (Fig. 4). Upon returning to the station house, the spectral data were exported from the instrument by the Spectral Analysis and Management System (SAMS) software (hh2 Synchronization). The broadband albedo was calculated as a weighted average based on the spectral reflectance and the incoming solar radiation across the entire spectral wavelengths at each site (Ming et al., 2016; Moustafa et al., 2015; Wright et al., 2014; Yue et al., 2017). The period-mean albedo averaged for the 14 sites before and after conducting the artificial precipitation experiments (12–18 and 18–24 August) are shown in Table 2. We excluded the apparent outliers (higher than 0.98) of the albedo data, which are physically unrealistic.

Figure 4The location of the AWS at ELA, and the measuring sites for surface albedo and mass balance on the Muz Taw Glacier.
3.5 Measurement of the mass balance
We have measured the mass balance of the Muz Taw Glacier annually since 2014 with the method introduced in Østrem and Brugman (1991). Metal stakes for mass-balance measurements were fixed into the ice with a portable steam drill. The stake network consisted of 23 stakes being evenly distributed at different altitudes, with roughly three stakes in every row (Fig. 4). The stick scale for measuring the balance was read thrice, on 12, 18, and 24 August, respectively. We compared the mass varying between the two periods (12–18 and 18–24 August). The snow depth at each stake was measured by reading the scale, and the density of snow was measured by weighing the mass of snow with a given volume. We used the depth and density data of the snow to calculate the mass balance at the stake sites. The mass balance was obtained on 1 May and 31 August annually. To verify the effect of the artificial snowfalls on the mass balance of the glacier, in particular, we conducted three additional measurements for the mass balance on 12, 18, and 24 August 2018, respectively. The baseline of all the mass balance data in this study is the mass balance measured by the stakes on 12 August. The calculation of the mass balance of the whole glacier follows an interpolated method based on singular point measurements introduced by Wang et al. (2014).
4.1 Natural or artificial precipitation and their amounts and forms
Figure 5a shows the hourly temperature and precipitation recorded by the AWS at ELA from 12 to 24 August 2018. There was some natural precipitation during 12–14 August; apart from this and the precipitation on the experiment days, the whole period of 12–24 August was sparse in precipitation. Artificial precipitation experiments were carried out on 19, 22, and 23 August. The precipitation rates on 19th, 20th, 22nd, and 23rd were 6.2, 1.3, 1.8, and 10.6 mm d−1, respectively. Most snowfalls were observed at midnight and in the early mornings. It seems unlikely that the artificial precipitation can be distinguished from the natural precipitation if it was simultaneously mixed during all these events.
Previous weather-modification experiments using the same method as ours concluded that it was challenging to tell how much artificial precipitation mixed in the whole amount directly after conducting the cloud seeding (CSIRO, 1978; Qiu and Cressey, 2008; Ryan and King, 1997). The results from the measurements by Marcolli et al. (2016) and (Fisher et al., 2018) suggested the efficacy and success of using AgI on growing ice nuclei in clouds and promoting snowfall. In our study, there were significant precipitation amounts recorded by the AWS at ELA every single time after we ignited the smoke generators, which is associated with a highly significant linear relationship (n=10; r2=0.9999) between the timings of igniting AgI and recording the snowfall (Fig. 5b). The co-occurrence of the significant snowfall, using the AgI smoke to seed clouds (Figs. 3 and 5b), allows the supposition that we were producing artificial precipitation.
The AWS at grassland in the forefield of the Muz Taw Glacier was free from the AgI smoke during the artificial precipitation (AP) experiments. This allowed us to use the precipitation data recorded by it as a control to distinguish the natural precipitation from the artificial precipitation recorded by the AWS at ELA. We lost the precipitation data from the AWS at grassland during the first AP experiment on 19 August because the rain gauge was full and it overflowed. However, for the second experiment, the precipitation data were successfully collected from the AWS at grassland for a comparison.
Figure 6 shows the precipitation recorded by both AWSs and the record ratio of grassland to ELA during the second AP experiment (22–23 August). The precipitation recorded by the two AWSs was not synchronized. The AWS at ELA did not record any precipitation when the AWS at grassland recorded it at 19:00 LT and 20:00 LT on 22 August; however, there were records after 06:00 LT by the AWS at ELA but none at grassland. The correlation between the two precipitation records is fairly weak (r2=0.05) when they were both recorded by the AWSs, implying that the cause of precipitation (i.e. natural or artificial) might be distinctly different or likely mixed in the target area.
We presume two possibilities for whether there was natural precipitation that joined the artificial process targeted at the glacier. On the one hand, no natural precipitation contributed to the formation of the artificial snow, while, on the other hand, there was natural precipitation involved. The ratio of precipitation by the AWS at grassland to that at ELA was smaller than 35 %, with a mean of 21±3 % (Fig. 6), which could be used to estimate how much naturally induced precipitation took part in the AP experiment, based on the second presumption.
To determine the amount of solid precipitation that accumulates on the glacier surface, we applied a sinusoidal function (Möller et al., 2007) on the total precipitation. The function describes the transition between solid and liquid precipitation in a temperature range between +2 and +4 ∘C (Fujita and Ageta, 2000; Mölg et al., 2012). When the air temperature is lower than 2 ∘C, solid precipitation (snow) will occur, and between 2 and 4 ∘C, rain would fall with snow. During our experiments, the air temperatures were below 2 ∘C when precipitation occurred, implying that the precipitation in the two experiments was solid.
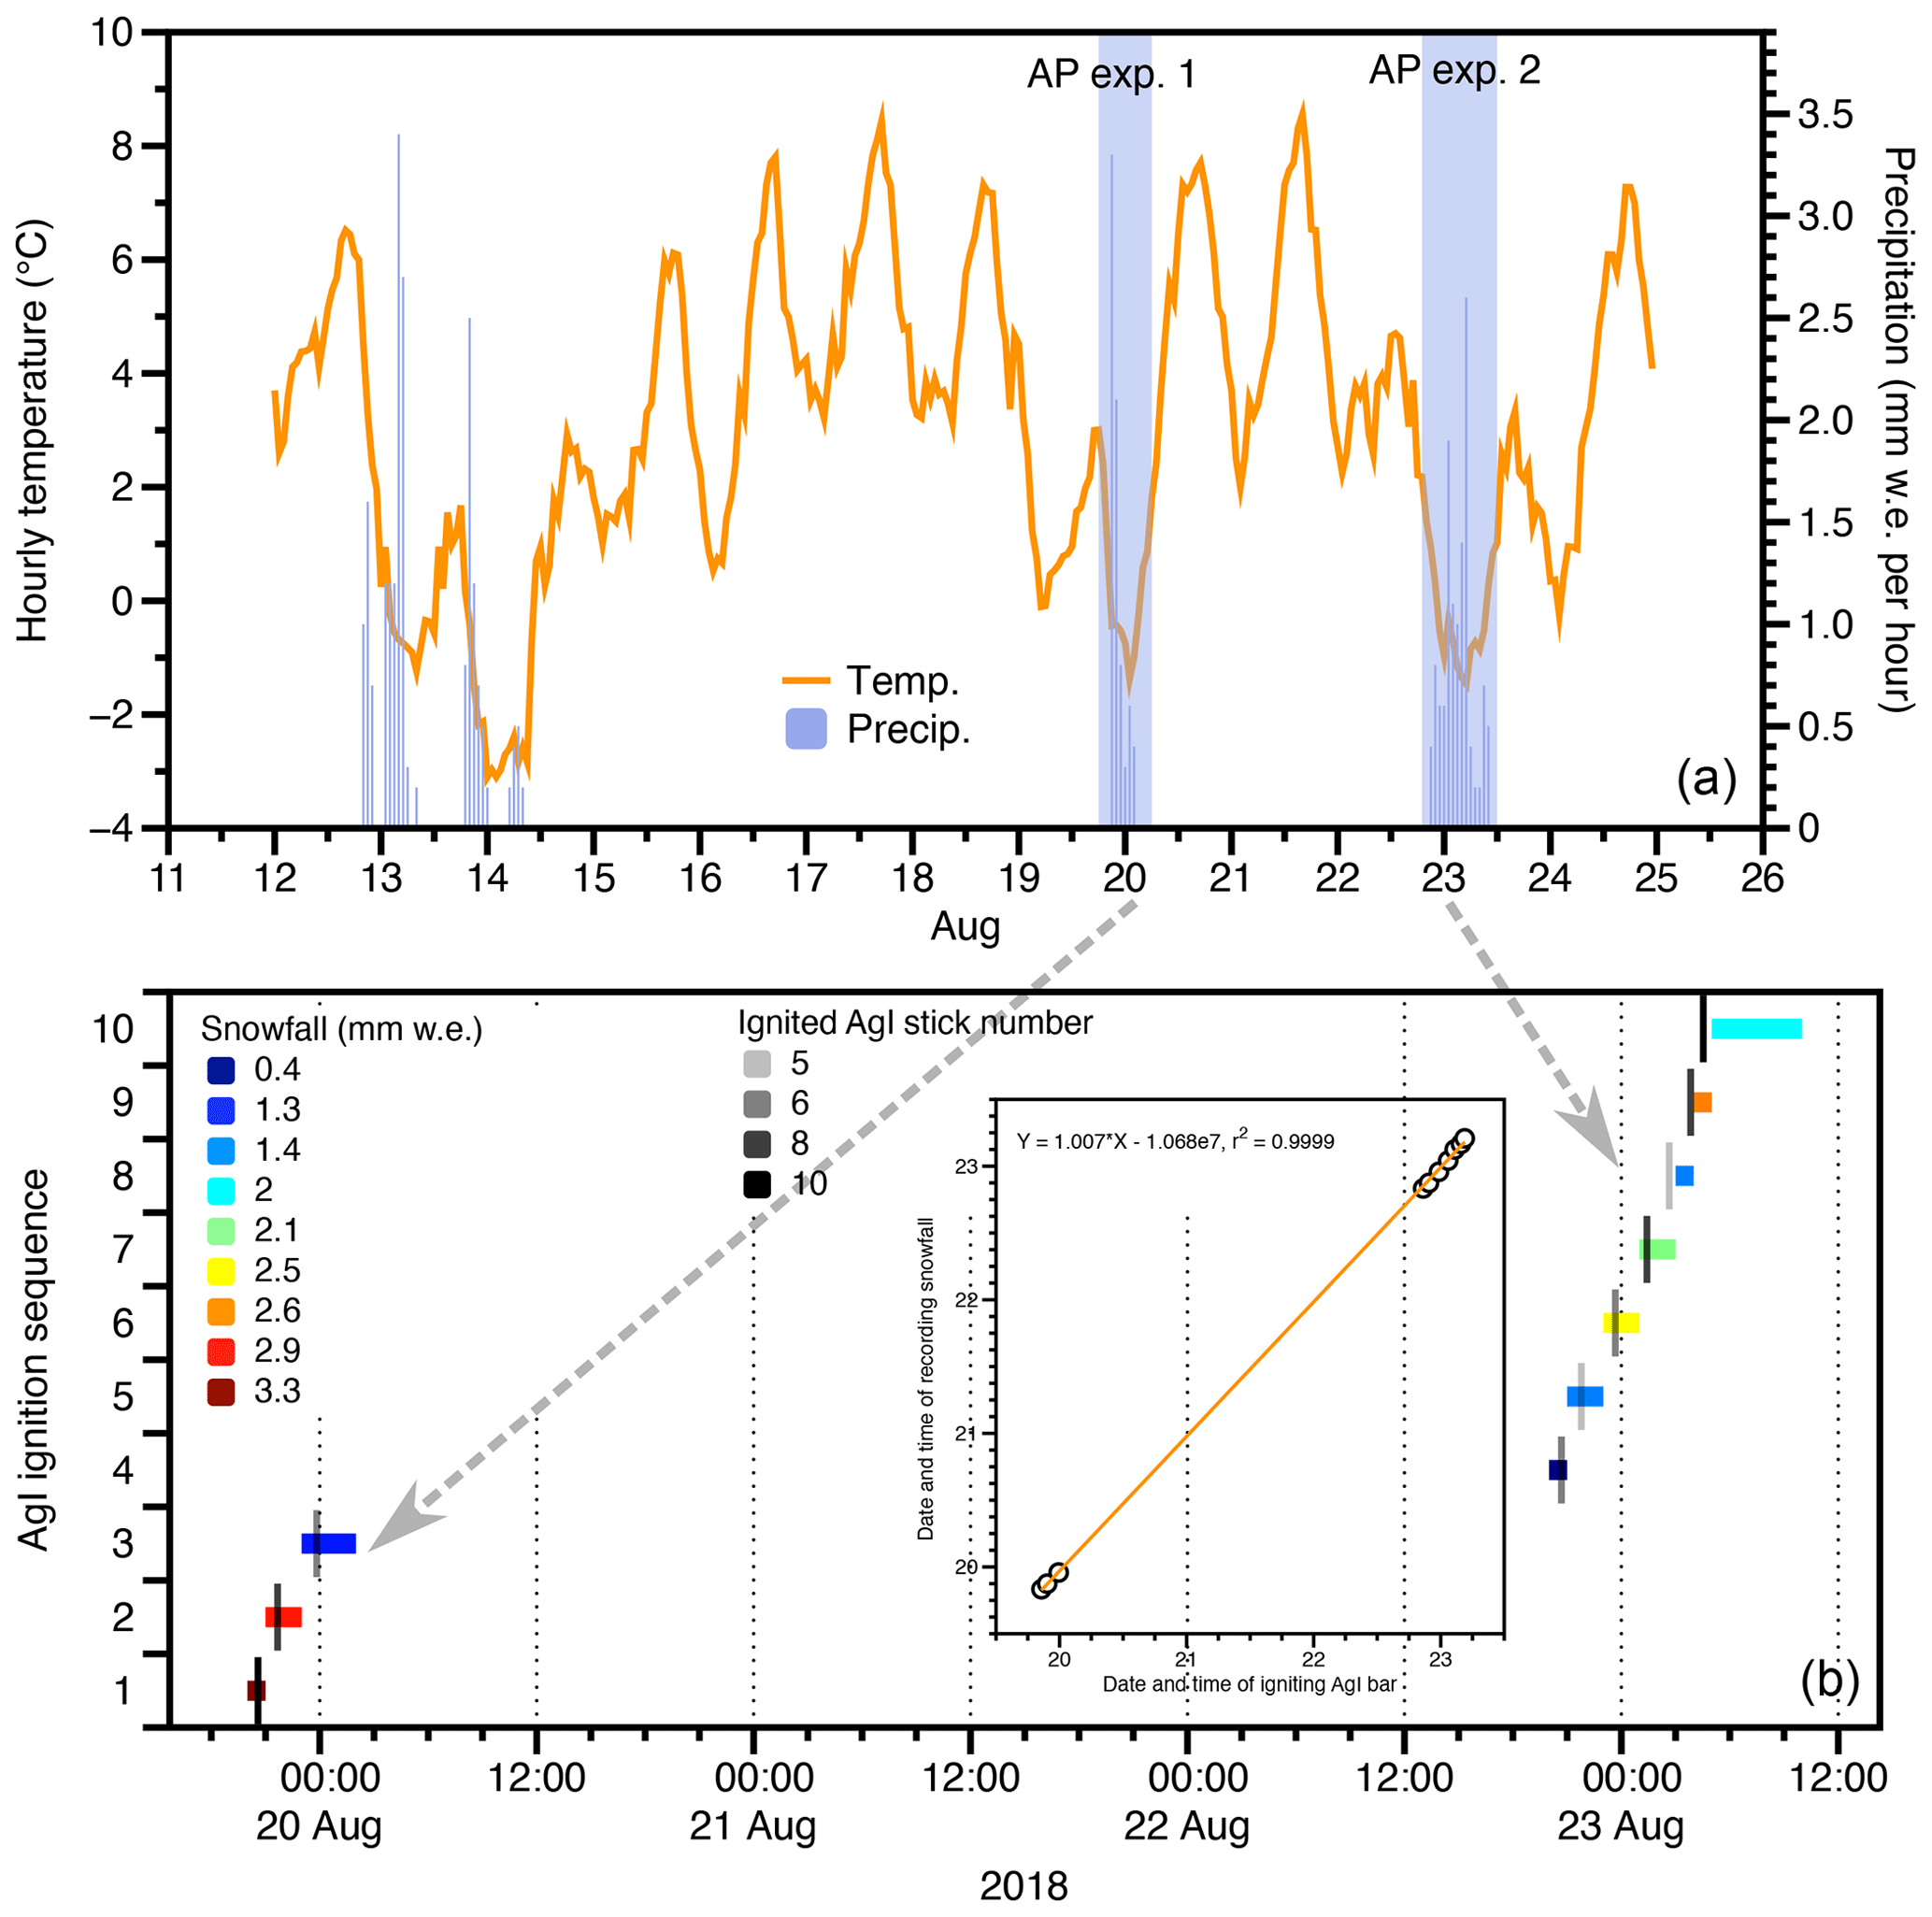
Figure 5(a) The daily snowfalls and hourly averaged temperature recorded by the AWS at ELA from 12 to 24 August 2018, where the two artificial precipitation experiments (AP experiment 1 and 2) are marked. (b) The hourly snowfall amounts (indicated by colour) and time periods (indicated by length) recorded by the AWS at ELA and the ignited AgI stick number (indicated by colour) and time during the two experiments.

Figure 6The precipitation recorded by the AWSs at grassland (inverse blue solid triangles) and ELA (hollow blue squares), and the precipitation record ratio of grassland to ELA (hollow red circles) during 22–23 August, in which the scatterplot of the precipitation from both AWSs is included. The green and red dashed lines indicate the upper limit and mean of the ratios.
4.2 The effects of artificial snowfall on surface albedo
Glacier albedo is highly sensitive to snowfall. Once snowfall occurs, it will quickly whiten the surface of the glacier and increase the albedo. Figure 7 shows the surface albedo of the Muz Taw Glacier at different locations before and after the artificial snowfall experiments. We observed that the surface albedo at the sites varied from relative flatness (e.g. at site I and site III) to more significant fluctuations (e.g. at site XII and site VII) between 18 and 24 August.
Below 3250 m, the surface albedo (at sites I–IV) was generally smaller than 0.4 (typical albedo of ice with debris), with mild fluctuations as shown in Fig. 7. From 3250 to 3350 m a.s.l. (at sites V–VIII), significant variations in albedo were observed, ranging from 0.2 to 0.6. In the area of 3350–3400 m a.s.l., more significant variations in albedo were observed between 0.1 and 0.7. Because this area was located near the equilibrium line, it was highly sensitive to air temperature and snowfall. Artificial snowfall frequently changed the surface from ice to snow, air temperature inversely turned the surface from snow to ice, and thus, dramatic changes occurred in the albedo. At sites XIII and XIV, which are much higher than the equilibrium line, the overall albedo exceeded 0.4 and rose up to 0.8. We observed a slightly increasing trend in albedo at these two sites (XIII–XIV), suggesting that the surface was covered by relatively lasting snow owing to artificial snowfalls.
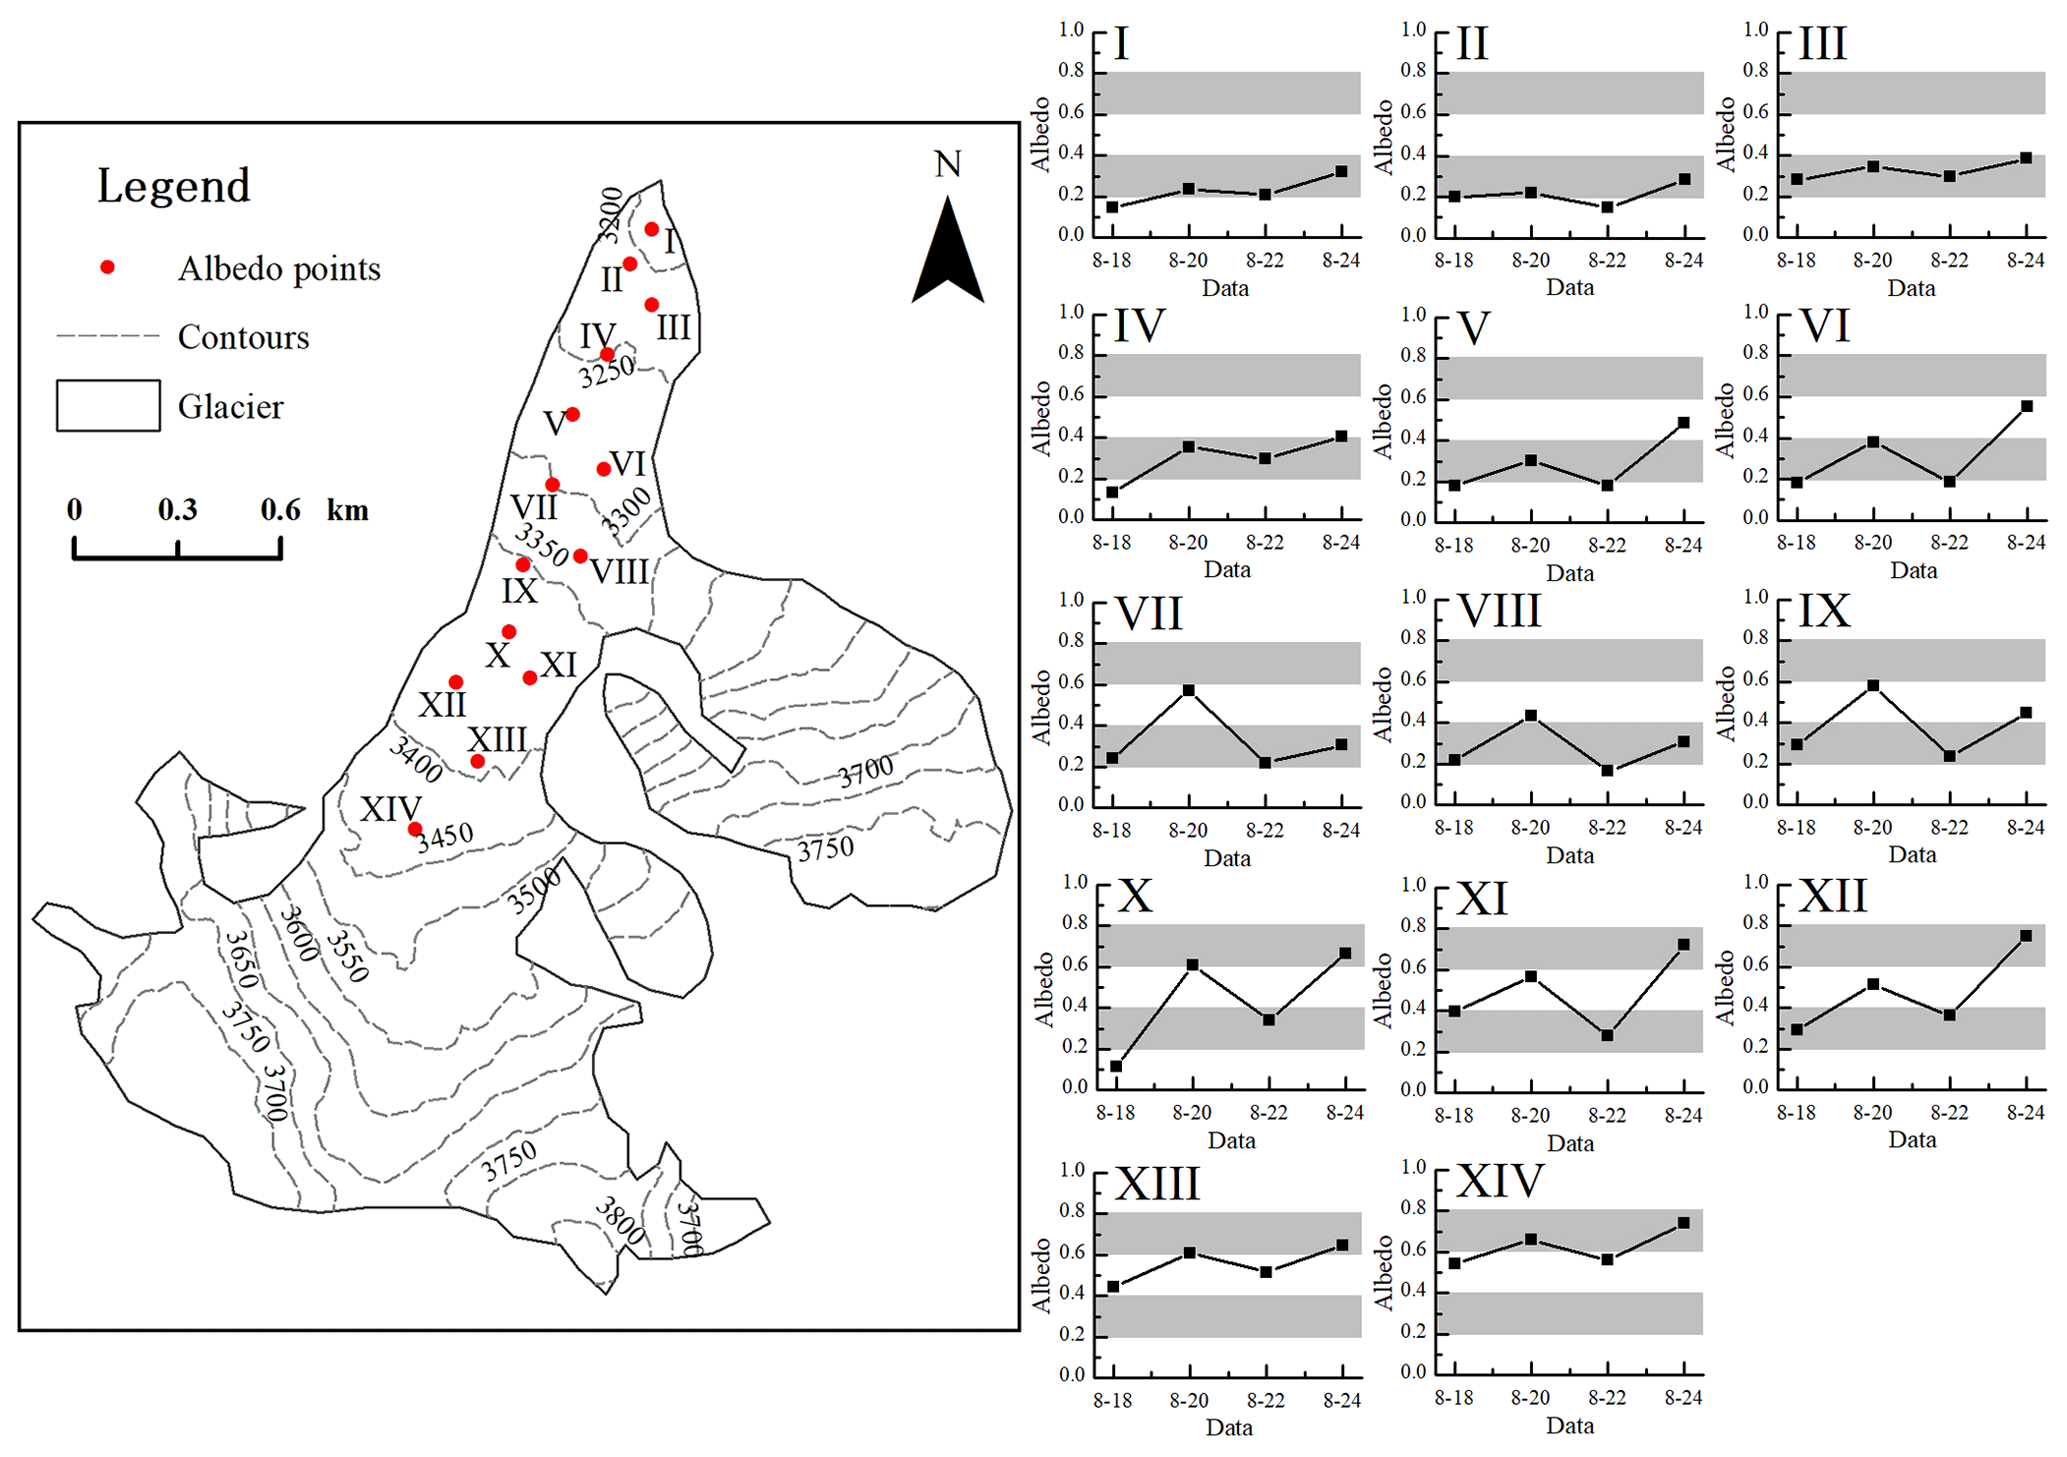
Figure 7The surface albedo at the 14 sites (I–XIV) of the Muz Taw Glacier, where the red points denote the sites. The map on the left-hand side is the reference for the 14 charts (sites I–XIV) and marks the albedo scale and date with the grey shading.
4.3 The varying mass balance responding to the artificial snowfalls
As mentioned in Sect. 3.4, the stick scale for measuring balance was read thrice at each site, on 12, 18, and 24 August, respectively. To study the effects of the artificial snowfalls on the mass balance of the glacier, we calculated the mass balance measured by the stakes during the two periods, i.e. before the artificial snowfalls (12–18 August) and after the artificial snowfalls (18–24 August), respectively. The stakes in a group (A to I) were roughly along the altitude contour (Fig. 4), and the correspondingly measured mass balance of the same group was averaged (Fig. 8). The mass balance decreased in altitude from approximately −400 mm w.e. at 3100 m to approximately −100 mm w.e. at the equilibrium line measured by the stakes before the artificial snowfalls, and decreased from approximately −300 mm w.e. at 3100 m to approximately −100 mm w.e. at the equilibrium line after the artificial snowfalls. The difference in the mass balances measured at the sites between the two periods was 41±15 mm w.e., averaged on the stake measurements for the Muz Taw Glacier, and considering that the difference was completely due to artificial precipitation. If we take 21 % of the difference to be due to natural precipitation (Fig. 6), then the difference would be 32 mm w.e. Therefore, the difference resulting from the artificial snowfalls accounted for between 14 % (with 21 % natural precipitation) and 17 % (without natural precipitation) of the mass balance before the artificial snowfalls (−237 mm w.e.).
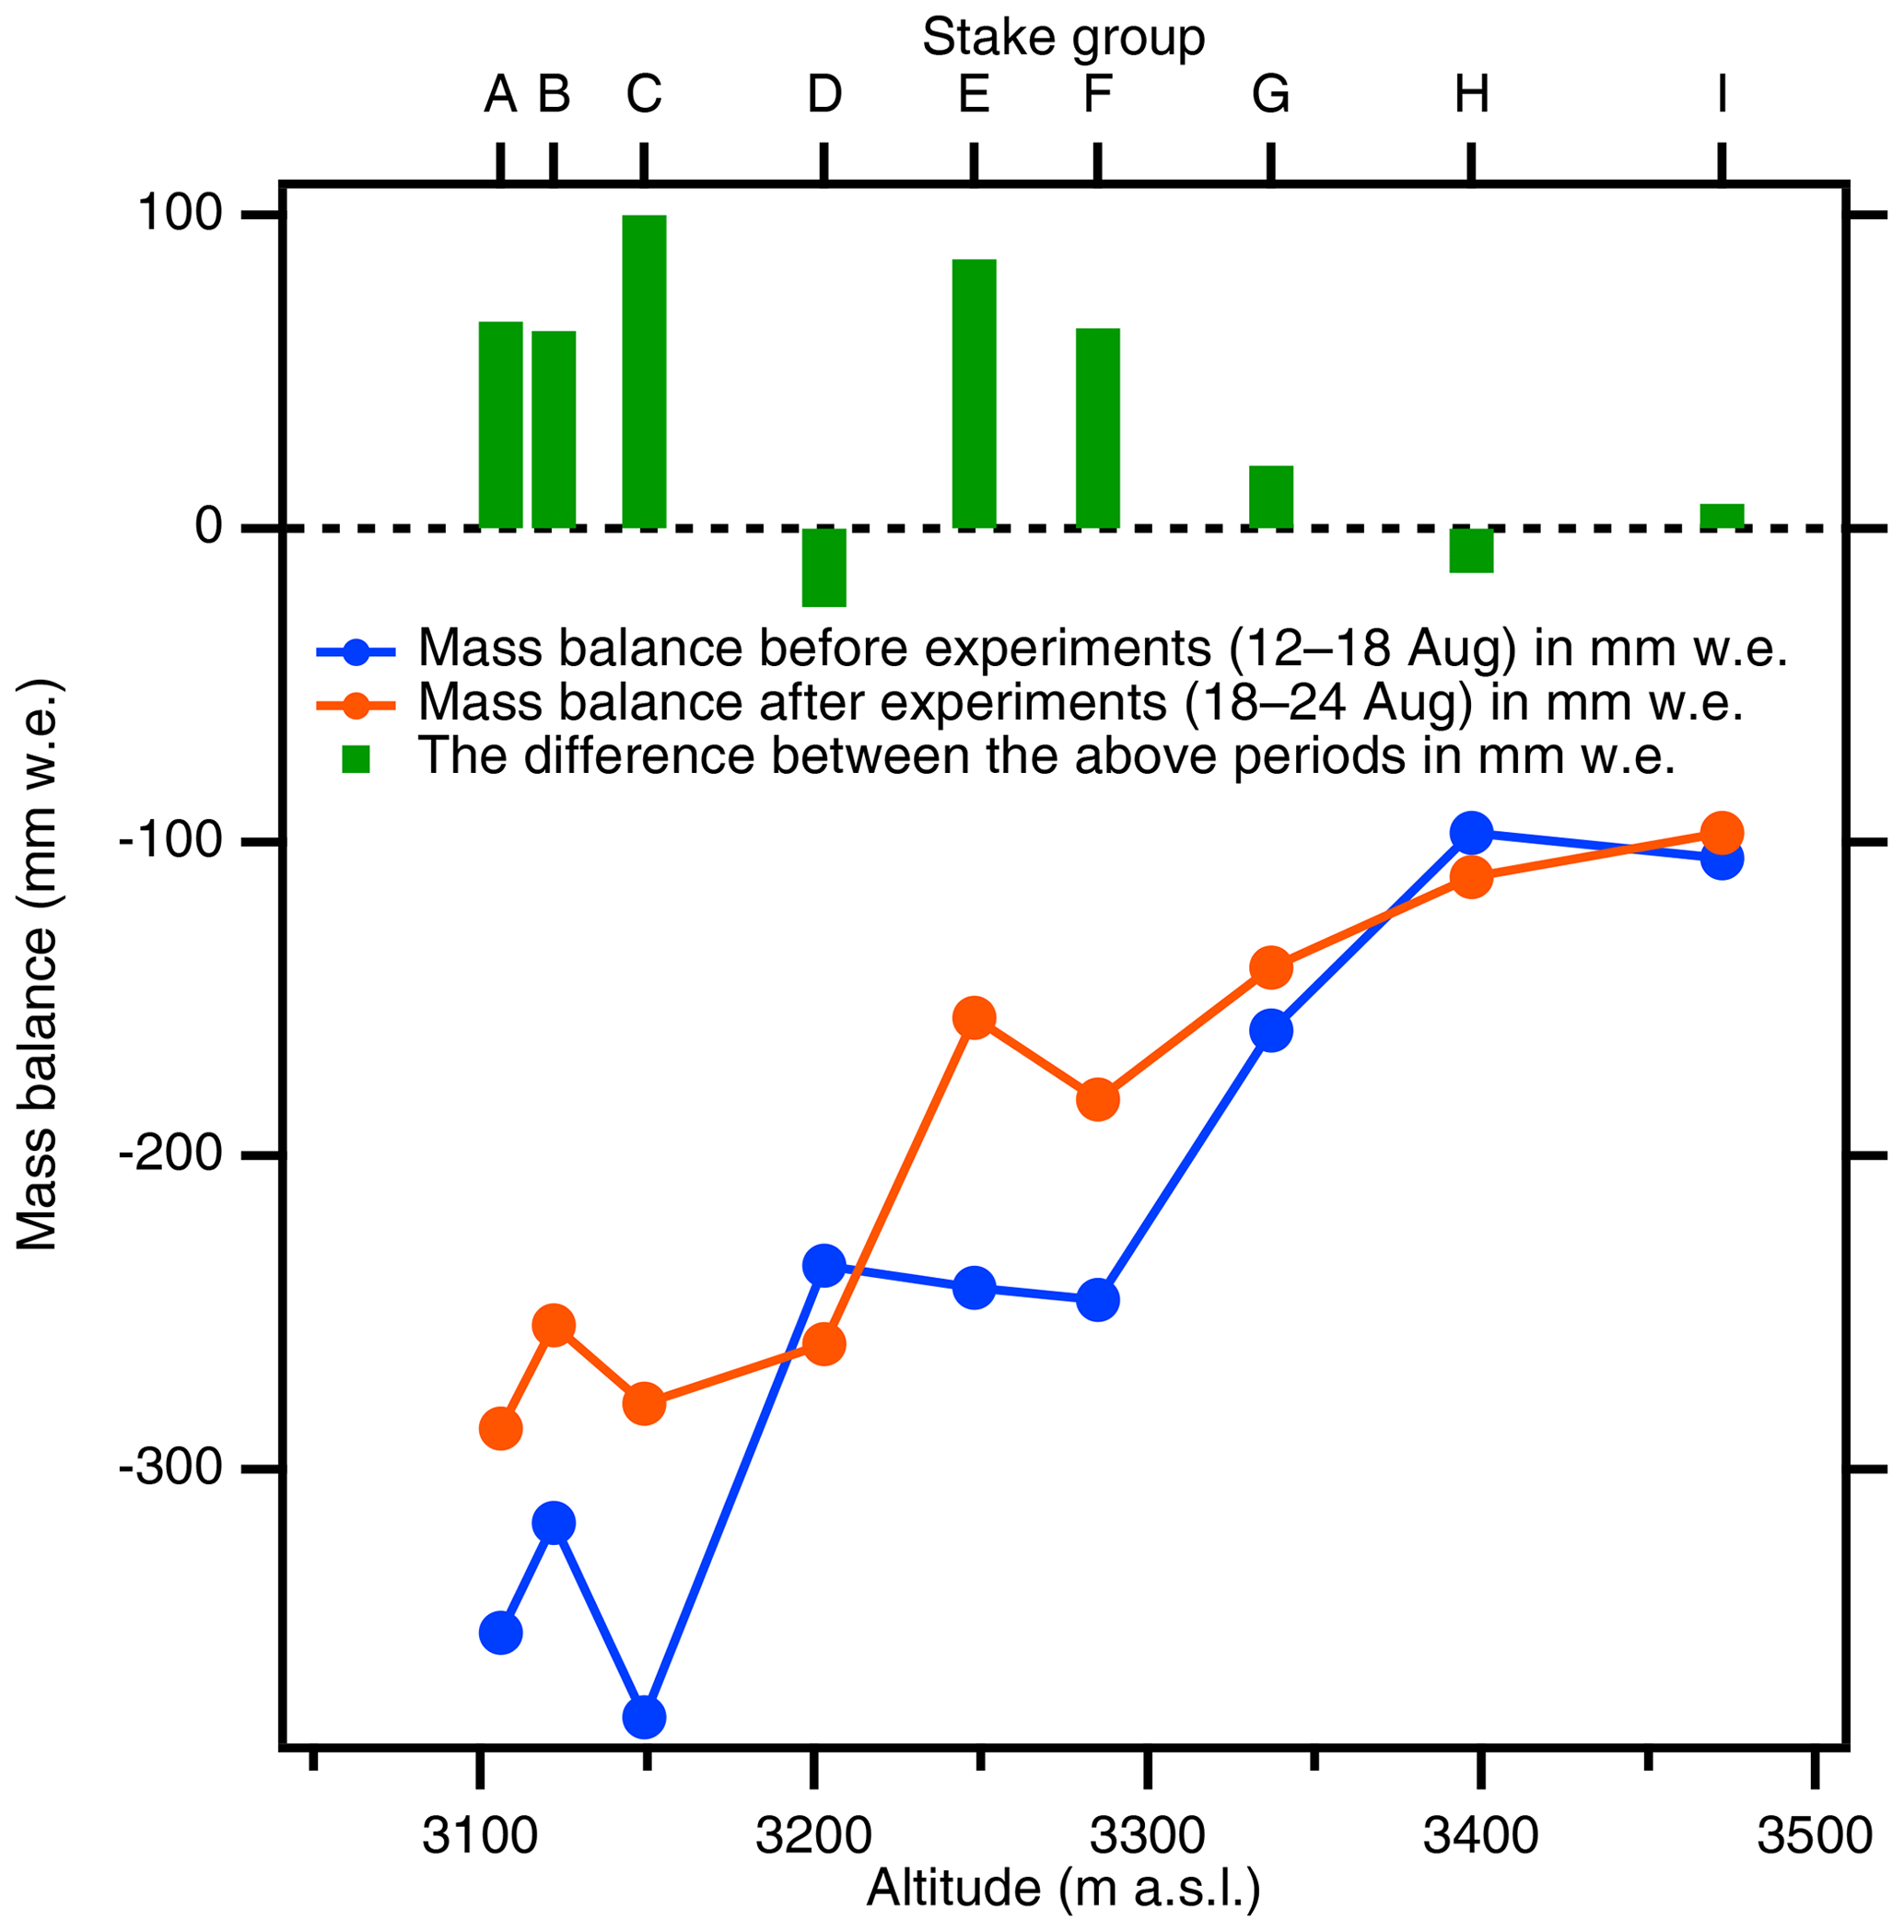
Figure 8The averaged mass balance measured at the sites (stakes A–I) before (blue) and after (orange) the artificial snowfall on 18 and 20 August, compared with 12 August (the zero line), and the gained mass (green = orange – blue) due to the artificial snowfall.
Table 2The positively accumulated temperatures, snowfalls, and albedo measured by the instruments on the AWS at ELA, and the calculated mass balances of the Muz Taw Glacier before and after the two artificial snowfall experiments (t1=12–18 August and t2=18–24 August).
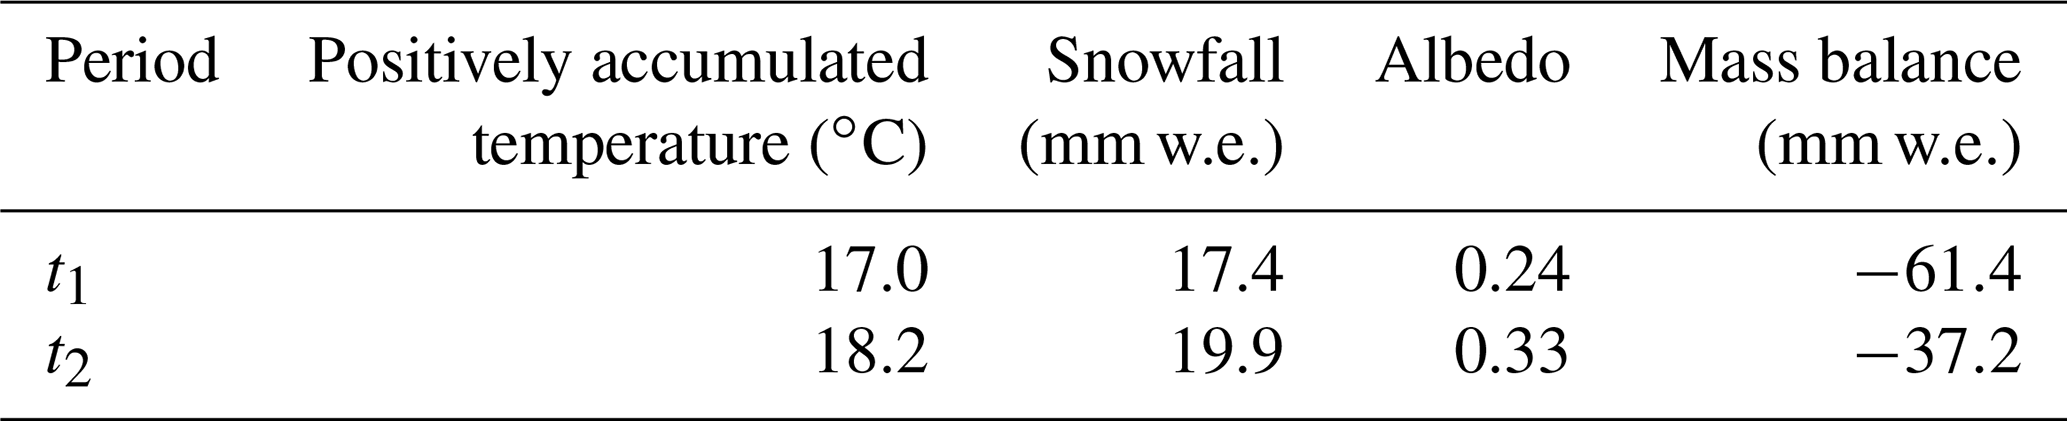
We compare the positively accumulated temperature (PAT = , where n is the number of days and T is the daily averaged temperature in ∘C), the amounts of snowfall, and the surface albedo of the measurements from 12 to 18 August (t1) and from 18 to 24 August (t2; Table 2), respectively. The two periods represent the same time span before and after the artificial snowfalls, respectively. The temperature, snowfall, and albedo data in this comparison are all from the measurements of the AWS at ELA. The estimated mass balance after interpolating the measured mass balance by the stakes to the whole glacier during t1 and t2 were −61.4 mm w.e. and −37.2 mm w.e., respectively. Although the PAT was higher during t2 than during t1, the mass loss of the glacier was 40 % lower than t1. More snowfall and higher albedo resulting from the artificial snowfall can explain the lower mass loss during t2.
The accumulation at the equilibrium line altitude (ELA) of a glacier is approximately equal to the area average of accumulation over the whole glacier (Braithwaite, 2008). We can presume that the snowfall amount measured by the AWS at ELA of the Muz Taw Glacier during t2 was the average received mass of the whole glacier after implementing the AP experiments. The extra melt amount from the glacier, besides the gained mass during t2, would be the difference between the calculated mass loss (37.2 mm w.e.) and the snow mass measured by the AWS at ELA (19.9 mm w.e.), and that would be 17.3 mm w.e. The artificial snowfall may significantly save the melt of the glacier by 54 % during t2, calculated as the percentage of the snowfall divided by the estimated mass balance. Excluding 21 % of the mass measured by the AWS at ELA that is presumed to be the contribution of natural precipitation, we conclude that the artificial precipitation buffered the total melting during t2 by 42 %.
4.4 The mechanism: how artificial snowfalls reduce the melting of a glacier
In air temperatures lower than 2 ∘C, the artificial snowfall promotes the formation of snow, which directly adds mass onto the glacier and increases the mass balance of the glacier and, thereby, albedo; the snow cools the surface and increases the surface albedo; the increased albedo will then decrease the solar radiation absorption on the surface and favour retaining the mass which will, in turn, save the albedo and eventually the whole process forms a positive feedback system.
This is a very preliminary theory based on the limited data derived from the short-term experiments, and we need further studies to validate the theory. The albedo decay of artificial snowfall and snow physics is required to claim a long-term impact on the mass balance of glaciers. Particularly, the variation in the likelihood of a snowfall event occurring with or without smoke generators and the partition of natural and artificial precipitation need to be quantified more confidently, and for which more controlling experiments are needed in future.
We used AgI smoke generators to induce artificial snow on the Muz Taw Glacier in Sawir Mountains on 19 and 22 August 2018. Two AWSs were set up on the target glacier and control area, respectively. The albedo and mass balance were measured at the stakes that are evenly distributed along the altitude contours of the glacier before and after the artificial snowfall experiments. The glacier received a total snow amount of ∼20 mm w.e. from two experiments, which increased the surface albedo of the glacier. Larger fluctuations in albedo were measured at the higher sites compared to the lower sites.
By comparing the precipitation measured by the two AWSs, we conclude that artificially induced snow could account for at least 79 % of the total snow measured by the AWS at ELA. After interpolating the mass balance measured by the stakes to the whole glacier, we found a mass balance of −61 mm w.e. for the period of 12–18 August and −37 mm w.e. for the period of 18–24 August, respectively. The artificial snow reduced the mass loss of the glacier by ∼40 % due to more snowfall and higher albedo; nevertheless, the positively accumulated temperature during the latter period was higher than the former.
We compared the mass balances directly calculated from the measurements of the stakes before the experiments (12–18 August) with those taken after (18–24 August). The difference between the two periods was between 32 and 41 mm w.e., taking possible natural snow into account. This suggests that artificial snow does add mass to the glacier, which is consistent with the result, by interpolating stake measurements to the whole glacier. We also compared the total melt of the glacier during 18–24 August with the artificial snow received by the glacier, implying that artificial snow significantly saved the mass loss by between 42 % and 54 % after the experiments.
We propose a theory describing the role of snowfall in reducing the melting of the glacier. The mechanism determines that the environmental temperature and the form of snowfall and clouds are the two main factors resulting in the mass gain or loss of a glacier. Mechanical erosion, energy exchange (thermal dynamic), and albedo-induced radiation absorption play major roles in the process of mass varying. This hypothesized mechanism is preliminary and needs more measurements to consolidate.
The approach in our work uses solar power to ignite the seeding material to form clouds and uses no extra water but redistributes natural water in the local atmosphere at a small spatial scale. The energy- and water-saving techniques of the approach, with reasonable mass-loss-reducing efficiency from the Muz Taw Glacier, validates its efficiency to possibly be applied at more central Asian glaciers to reduce their rapid melting. Especially in summer when the melting is dramatic in central Asian glaciers, applying the approach suggested by our study on a much broader scale might reduce the melting significantly. However, it is important to note that our approach needs a priori atmospheric conditions favourable to precipitation and cannot be applied if the weather is dry and sunny. This study is preliminary and short in operating time and needs more sophisticated experiments at control and target areas to partition natural and artificial precipitation. The approach would fine-tune itself when being implemented more regularly in future repeated and longer-term, or scaled-up, experiments.
We hope that the data set will be publicly available soon. Please contact the corresponding author, Feiteng Wang (wangfeiteng@lzb.ac.cn), or the coordinating author, Jing Ming (petermingjing@hotmail.com), directly for the data repository, and they will respond accordingly.
FW conceived the main ideas, designed the experiment, and drafted the paper. XY, LW, HL, and ZD helped to design the experiment and collect the data. JM reanalysed the data and plots, edited, and fine-tuned the paper. ZL helped with the final revision.
The authors declare that they have no conflict of interest.
The authors thank Samuel Morin and Suryanarayanan Balasubramanian for their comments, which were crucial for improving this work.
This work has been supported by the Strategic Priority Research Program of the Chinese Academy of Sciences (grant nos. XDA2006020103 and XDA20040501), the National Natural Science Foundation of China (grant no. 41721091), the Second Tibetan Plateau Scientific Expedition and Research (STEP) programme (grant no. 2019QZKK0201), the State Key Laboratory of Cryospheric Science (grant no. SKLCS-ZZ-2019), the Key Research Program of Frontier Sciences of the Chinese Academy of Sciences (grant no. QYZDB-SSW-SYS024), and the Foundation for Excellent Youth Scholars of NIEER (CAS grant no. FEYS2019003).
This paper was edited by Xavier Fettweis and reviewed by Samuel Morin and Suryanarayanan Balasubramanian.
Bojinski, S., Verstraete, M., Peterson, T. C., Richter, C., Simmons, A., and Zemp, M.: The Concept of Essential Climate Variables in Support of Climate Research, Applications, and Policy, B. Am. Meteorol. Soc., 95, 1431–1443, 2014.
Bowen, E. G.: AUSTRALIAN EXPERIMENTS ON ARTIFICIAL STIMULATION OF RAINFALL, Weather, 7, 204–209, 1952.
Braithwaite, R. J.: Temperature and precipitation climate at the equilibrium-line altitude of glaciers expressed by the degree-day factor for melting snow, J. Glaciol., 54, 437–444, 2008.
Council, N. R.: Critical Issues in Weather Modification Research, The National Academies Press, Washington, DC, 2003.
CSIRO: Rainmaking; the state of the art, ECOS, 16, 15–18, 1978.
Dyer, C.: Now THAT'S a wrap! Swiss glacier is shrouded in UV-resistant blankets to stop it melting in the summer heat, Daily Mail, available at: https://www.dailymail.co.uk/news/article-7287799/Blankets-used-cover-five-acres-melting-Rhone-Glacier-Switzerland-protect-heat.html (last access: 2 August 2020) 2019.
Fischer, A., Helfricht, K., and Stocker-Waldhuber, M.: Local reduction of decadal glacier thickness loss through mass balance management in ski resorts, The Cryosphere, 10, 2941–2952, https://doi.org/10.5194/tc-10-2941-2016, 2016.
Fisher, J. M., Lytle, M. L., Kunkel, M. L., Blestrud, D. R., Dawson, N. W., Parkinson, S. K., Edwards, R., and Benner, S. G.: Assessment of Ground-Based and Aerial Cloud Seeding Using Trace Chemistry, Adv. Meteorol., 2018, 1–15, 2018.
Flossmann, A., Manton, M., Abshaev, A., Bruintjes, R., Murakami, M., Prabhakaran, T., and Yao, Z.: Peer Review Report on Global Precipitation Enhancement Activities, WWRP (2018-1), in: World Weather Research Programme, WMO Research Department Switzerland, 2018.
Fujita, K. and Ageta, Y.: Effect of summer accumulation on glacier mass balance on the Tibetan Plateau revealed by mass-balance model, J. Glaciol., 46, 244–252, 2000.
Guo, W., Liu, S., Xu, J., Wu, L., Shangguan, D., Yao, X., Wei, J., Bao, W., Yu, P., and Liu, Q.: The second Chinese glacier inventory: data, methods and results, J. Glaciol., 61, 357–372, 2015.
Hock, R., Rasul, G., Adler, C., Cáceres, B., Gruber, S., Hirabayashi, Y., Jackson, M., Kääb, A., Kang, S., Kutuzov, S., Milner, A., Molau, U., Morin, S., Orlove, B., and Steltzer, H.: High Mountain Areas. In: IPCC Special Report on the Ocean and Cryosphere in a Changing Climate, IPCC, New York, 2019.
Immerzeel, W. W., Lutz, A. F., Andrade, M., Bahl, A., Biemans, H., Bolch, T., Hyde, S., Brumby, S., Davies, B. J., Elmore, A. C., Emmer, A., Feng, M., Fernández, A., Haritashya, U., Kargel, J. S., Koppes, M., Kraaijenbrink, P. D. A., Kulkarni, A. V., Mayewski, P., Nepal, S., Pacheco, P., Painter, T. H., Pellicciotti, F., Rajaram, H., Rupper, S., Sinisalo, A., Shrestha, A. B., Viviroli, D., Wada, Y., Xiao, C., Yao, T., and Baillie, J. E. M.: Importance and vulnerability of the world's water towers, Nature, 577, 364–369, https://doi.org/10.1038/s41586-019-1822-y, 2019. 2019.
Immerzeel, W. W., van Beek, L. P. H., and Bierkens, M. F. P.: Climate Change Will Affect the Asian Water Towers, Science, 328, 1382–1385, 2010.
Kong, J., Wang, G., Fang, W., and Su, Z.: Laboratory study on nucleating properties and microstructure of AgI pyrotechnics, Meteor. Mon., 42, 74–79, 2016.
Marcolli, C., Nagare, B., Welti, A., and Lohmann, U.: Ice nucleation efficiency of AgI: review and new insights, Atmos. Chem. Phys., 16, 8915–8937, https://doi.org/10.5194/acp-16-8915-2016, 2016.
Ming, J., Xiao, C., Wang, F., Li, Z., and Li, Y.: Grey Tienshan Urumqi Glacier No.1 and light-absorbing impurities, Environ. Sci. Pollut. R., 23, 9549–9558, 2016.
Mölg, T., Maussion, F., Yang, W., and Scherer, D.: The footprint of Asian monsoon dynamics in the mass and energy balance of a Tibetan glacier, The Cryosphere, 6, 1445–1461, https://doi.org/10.5194/tc-6-1445-2012, 2012.
Möller, M., Schneider, C., and Kilian, R.: Glacier change and climate forcing in recent decades at Gran Campo Nevado, southernmost Patagonia, Ann. Glaciol., 46, 136–144, 2007.
Moustafa, S. E., Rennermalm, A. K., Smith, L. C., Miller, M. A., Mioduszewski, J. R., Koenig, L. S., Hom, M. G., and Shuman, C. A.: Multi-modal albedo distributions in the ablation area of the southwestern Greenland Ice Sheet, The Cryosphere, 9, 905–923, https://doi.org/10.5194/tc-9-905-2015, 2015.
Oerlemans, J., Haag, M., and Keller, F.: Slowing down the retreat of the Morteratsch glacier, Switzerland, by artificially produced summer snow: a feasibility study, Climatic Change, 145, 189–203, 2017.
Østrem, G. and Brugman, M.: Glacier mass-balance measurements: a manual for field and office work, National Hydrology Research Institute, Inland Waters Directorate Conservation and Protection Environment Canada, Saskatoon, Sask, Canada, 224 pp., 1991.
Panagiotopoulos, F., Shahgedanova, M., Hannachi, A., and Stephenson, D. B.: Observed Trends and Teleconnections of the Siberian High: A Recently Declining Center of Action, J. Climate, 18, 1411–1422, 2005.
Qiu, J. and Cressey, D.: Meteorology: Taming the sky, Nature, 453, 970–974, 2008.
Ryan, B. F. and King, W. D.: A Critical Review of the Australian Experience in Cloud Seeding, B. Am. Meteorol. Soc., 78, 239–254, 1997.
Silverman, B. A.: A Critical Assessment of Glaciogenic Seeding of Convective Clouds for Rainfall Enhancement, B. Am. Meteorol. Soc., 82, 903–924, 2001.
Smith, E. J.: Cloud seeding experiments in Australia, Proc. Fifth Berkeley Symposium on Mathematical Statistics and Probability, 5, University of California Press, 161–176, 1967.
Song, L., Chao, C., and Wang, P.: Blue book on the climate change in China, Centre on Climate Change, China Meteorological Administration, Beijing, 2019.
Vonnegut, B.: The Nucleation of Ice Formation by Silver Iodide, J. Appl. Phys., 18, 593–595, 1947.
Wang, F., Xu, C., Li, Z., Anjum, M. N., and Wang, L.: Applicability of an ultra-long-range terrestrial laser scanner to monitor the mass balance of Muz Taw Glacier, Sawir Mountains, China, Sciences in Cold and Arid Regions, 10, 0047–0054, 2018.
Wang, P., Li, Z., Li, H., Wang, W., and Yao, H.: Comparison of glaciological and geodetic mass balance at Urumqi Glacier No. 1, Tian Shan, Central Asia, Global Planet. Change, 114, 14–22, 2014.
Wang, Y. Q., Zhao, J., Li, Z. Q., and Zhang, M. J.: Glacier changes in the Sawuer Mountain during 1977–2017 and their response to climate change, Journal of Natural Resources, 34, 802–814, 2019 (in Chinese).
Wright, P., Bergin, M., Dibb, J., Lefer, B., Domine, F., Carman, T., Carmagnola, C., Dumont, M., Courville, Z., and Schaaf, C.: Comparing MODIS daily snow albedo to spectral albedo field measurements in Central Greenland, Remote Sens. Environ., 140, 118–129, 2014.
Xu, Z., Jing, H., Zou, L., and Li, Y.: Application research of type WR-08X digital radar on artificial precipitation in Saur Mountains area, Jiangxi Science, 35, 727–730, 2017 (in Chinese).
Yue, X., Zhao, J. U. N., Li, Z., Zhang, M., Fan, J. I. N., Wang, L. I. N., and Wang, P.: Spatial and temporal variations of the surface albedo and other factors influencing Urumqi Glacier No. 1 in Tien Shan, China, J. Glaciol,, 63, 899–911, 2017.
Zemp, M., Huss, M., Thibert, E., Eckert, N., McNabb, R., Huber, J., Barandun, M., Machguth, H., Nussbaumer, S. U., Gartner-Roer, I., Thomson, L., Paul, F., Maussion, F., Kutuzov, S., and Cogley, J. G.: Global glacier mass changes and their contributions to sea-level rise from 1961 to 2016, Nature, 568, 382–386, 2019.