the Creative Commons Attribution 4.0 License.
the Creative Commons Attribution 4.0 License.
 | 12 Aug 2020
The ERA5-Land soil temperature bias in permafrost regions
Stephan Gruber
Xin Li
ERA5-Land (ERA5L) is a reanalysis product derived by running the land component of ERA5 at increased resolution. This study evaluates ERA5L soil temperature in permafrost regions based on observations and published permafrost products. We find that ERA5L overestimates soil temperature in northern Canada and Alaska but underestimates it in mid–low latitudes, leading to an average bias of −0.08 ∘C. The warm bias of ERA5L soil is stronger in winter than in other seasons. As calculated from its soil temperature, ERA5L overestimates active-layer thickness and underestimates near-surface (<1.89 m) permafrost area. This is thought to be due in part to the shallow soil column and coarse vertical discretization of the land surface model and to warmer simulated soil. The soil temperature bias in permafrost regions correlates well with the bias in air temperature and with maximum snow height. A review of the ERA5L snow parameterization and a simulation example both point to a low bias in ERA5L snow density as a possible cause for the warm bias in soil temperature. The apparent disagreement of station-based and areal evaluation techniques highlights challenges in our ability to test permafrost simulation models. While global reanalyses are important drivers for permafrost simulation, we conclude that ERA5L soil data are not well suited for informing permafrost research and decision making directly. To address this, future soil temperature products in reanalyses will require permafrost-specific alterations to their land surface models.
- Article
(3568 KB) - Full-text XML
-
Supplement
(104 KB) - BibTeX
- EndNote


Permafrost regions occupy more than one fifth of the exposed land area in the Northern Hemisphere (Gruber, 2012) and are subject to important temperature-dependent processes (Cheng and Wu, 2007; Westermann et al., 2009; Schuur et al., 2015; Walvoord and Kurylyk, 2016). Research on permafrost is often impeded by sparse observations and difficult or costly access to study sites (e.g., Ran et al., 2018; Luo et al., 2020). Global simulation products have the potential to be an important source of insight if their suitability can be established. To this end, we investigate the accuracy of soil temperature from the new ERA5-Land (ERA5L) high-resolution reanalysis with a focus on permafrost area.
Reanalysis consists of assimilating a broad range of observations into fully coupled process-based models (land, atmosphere, ocean, sea ice, and often biogeochemical components). It is a valuable source of data for permafrost science. Reanalysis products have been successfully used to analyze and simulate various permafrost phenomena at different scales, such as its spatial distribution (e.g., Cao et al., 2019b; Fiddes et al., 2015; Slater and Lawrence, 2013), thermal state (e.g., Guo and Wang, 2017; Koven et al., 2013), active-layer thickness (e.g., Tao et al., 2019; Qin et al., 2017), ground ice loss (e.g., Aas et al., 2019), and carbon release (e.g., Koven et al., 2015). These applications are mostly restricted to the use of atmospheric variables to drive models. Reanalysis-derived soil temperature is rarely used directly due to its coarse spatial resolution (50–150 km) and bias. For example, over the Qinghai–Tibetan Plateau (QTP), Hu et al. (2019) and Yang and Zhang (2018) reported that the root mean squared error (RMSE) of daily soil temperature from different reanalyses (i.e., ERA-Interim/Land, MERRA-2, and CFSR) ranged between 1.8 and 5.1 ∘C. This error is most often expressed as a cold bias.
ERA5 is the latest reanalysis product produced by the European Centre for Medium-Range Weather Forecasts (ECMWF). Compared to ERA-Interim, it includes new observations and revised processes, such as surface runoff and snow thermal insulation (Hersbach et al., 2020; European Centre for Medium-Range Weather Forecasts, 2018). Cao et al. (2019a) proposed the suitability of ERA5 meteorological data as forcing for permafrost temperature simulation, and Graham et al. (2019) reported the improved performance of ERA5 in high latitudes relative to other modern reanalysis products. More recently, ERA5L was released as an improved land-only complement to ERA5. It incorporates new soil and snow hydrology (Balsamo et al., 2009; Dutra et al., 2010), revised soil thermal conductivity (Peters-Lidard et al., 1998), vegetation seasonality (Boussetta et al., 2013), and bare soil evaporation (Albergel et al., 2012). These improvements are expected to make ERA5L more accurate for many land applications; with a spatial resolution of 0.1∘, ERA5L is the first global reanalysis product at an intermediate spatial scale between Earth system land surface models (e.g., Melton et al., 2019; Chadburn et al., 2015) and statistical- and/or remote-sensing-based permafrost products (e.g., Obu et al., 2019; Karjalainen et al., 2019b).
Here, we evaluate the soil temperature of ERA5L in permafrost regions using observations and other published permafrost data products. We also investigate temperature bias using statistical analysis and numerical simulation at a well-instrumented location. The objectives of this study are to (1) assess the accuracy of ERA5L soil temperature in permafrost regions and (2) discuss the usability of ERA5L for permafrost research in light of the revealed bias and its potential causes.
2.1 ERA5 and ERA5-Land
ERA5 is the latest generation atmospheric reanalysis produced by ECMWF. Data are currently available from 1979 onward, and availability from 1950 onward is planned. ERA5 is produced using four-dimensional variational data assimilation in ECMWF's Integrated Forecast System; it has a horizontal resolution of 0.25∘ (31 km), a temporal resolution of 1 h, and a vertical resolution of 137 hybrid sigma model levels. The 37 pressure levels of ERA5 are identical to those of ERA-Interim (Noël et al., 2020). ERA5 assimilates improved input data that better reflect observed changes in climate forcing, as well as many new or reprocessed observations that were not available during the production of ERA-Interim. Unlike other reanalyses, ERA5 also includes an estimate of uncertainty based on a 10-member ensemble with a reduced temporal resolution of 3 h and a spatial resolution of 0.5∘ (Albergel et al., 2018).
The new ERA5L product was created by forcing the land component of the model with the atmospheric models but without coupling them. It uses the Tiled ECMWF Scheme for Surface Exchanges over Land with a revised land surface hydrology (HTESSEL; CY45R1; Hersbach et al., 2020). ERA5L is forced by the atmospheric analysis of ERA5, and hence the assimilated observations indirectly influence the simulations. It is delivered at the same temporal resolution as ERA5 and with a higher spatial resolution of 0.1∘. ERA5L is currently available for the period 1981–2018 and will eventually extend back to 1950 and be updated to the present time with little delay. Note that at the time of writing only ERA5L data after 2001 had been released to the public, and so this evaluation is conducted using data between 2001 and 2018.
2.2 HTESSEL
2.2.1 Snow scheme
A more realistic representation of snow is used in the ERA5 land surface model compared with its predecessor, ERA-Interim. ERA5L uses HTESSEL which treats snow as a single layer above the soil with independent prognostic temperature, mass, density, and albedo (Orsolini et al., 2019). The description of snow processes in HTESSEL is summarized by Dutra et al. (2010) as the following: (1) liquid water with phase changes coexists with ice in the snow pack and is diagnosed from its temperature, mass, and density (Appendix B1); (2) snow density changes according to overburden, thermal metamorphism, and retained liquid water following Lynch-Stieglitz (1994) (Appendix B1); (3) albedo changes exponentially with snow age and is adjusted by vegetation conditions; and (4) snow cover fraction depends on both snow water equivalent (SWE) and density (Appendix B2).
2.2.2 Soil scheme
Soil heat transfer in ERA5L is governed by the Fourier law. The thermal effects associated with latent heat are accounted for by following the method of Rouse (1984). However, soil thermal conductivity depends only on moisture content, and the influence of phase change is not represented. The upper boundary condition is given by a heat flux at the ground surface derived from a weighted average over eight subgrid fractions (or “tiles”). A zero heat flux is assumed at the lower boundary. The ERA5L soil column is discretized into four layers with node depths (layer boundaries) at 0.07 m (0–0.07 m), 0.21 m (0.07–0.28 m), 0.72 m (0.28–1.00 m), and 1.89 m (1.00–2.89 m).
2.3 Observations and quality control
Soil temperature time series from 639 sites located in permafrost regions were compiled from a variety of sources (Table 1; Fig. B1. See station metadata from the Supplement). Sites consist of both meteorological stations and boreholes. Of these, there are 56 from the China Meteorological Administration (CMA; Wang et al., 2015), 105 from World Data Centers (WDCs) in Russia and Ukraine, 219 from Nordicana D, 95 from the Geophysical Institute, University of Alaska Fairbanks (GI-UAF), 10 from the Tibetan Plateau observatory of plateau scale soil moisture and soil temperature (Tibet-Obs) (Su et al., 2011), 60 from the multiscale Soil Moisture and Temperature Monitoring Network in the Central Tibetan Plateau (CTP-SMTMN) (Yang et al., 2013), 40 from the Global Terrestrial Network for Permafrost (GTN-P; Biskaborn et al., 2015), 28 from National Park Service (NPS) in Alaska (Wang et al., 2018), 16 from the U.S. Geological Survey (USGS; Urban and Clow, 2017; Wang et al., 2018), 8 from HiWATER (Che et al., 2019), and 2 from Boike et al. (2018, 2019a). The permafrost zone of each site was determined based on its location using the digitized circum-Arctic map of permafrost and ground-ice conditions (hereafter referred to as the IPA map; Brown et al., 1997). The observed mean daily soil temperature of these stations ranges from −42 to 38 ∘C, and the elevation of the sites ranges from 0 to 5500 m. An additional 931 stations in non-permafrost regions were also used for comparison. All the temperature time series were visually checked to remove obvious out-of-range values. The mean annual temperature was calculated for sites with data completeness greater than 95 %. Observed active-layer thicknesses (ALTs) were obtained from Peng et al. (2018).
Wang et al. (2015)Wang et al. (2018)Su et al. (2011)Yang et al. (2013)Biskaborn et al. (2015)Wang et al. (2018)Urban and Clow (2017)Che et al. (2019)Boike et al. (2018, 2019a)Table 1Summary of soil temperature observations in permafrost regions, including the total number of stations (N), the temporal coverage and range of temperatures (Coverage), the corresponding ERA5L soil layers and depth range in meters (SL), and a reference for each dataset when available.
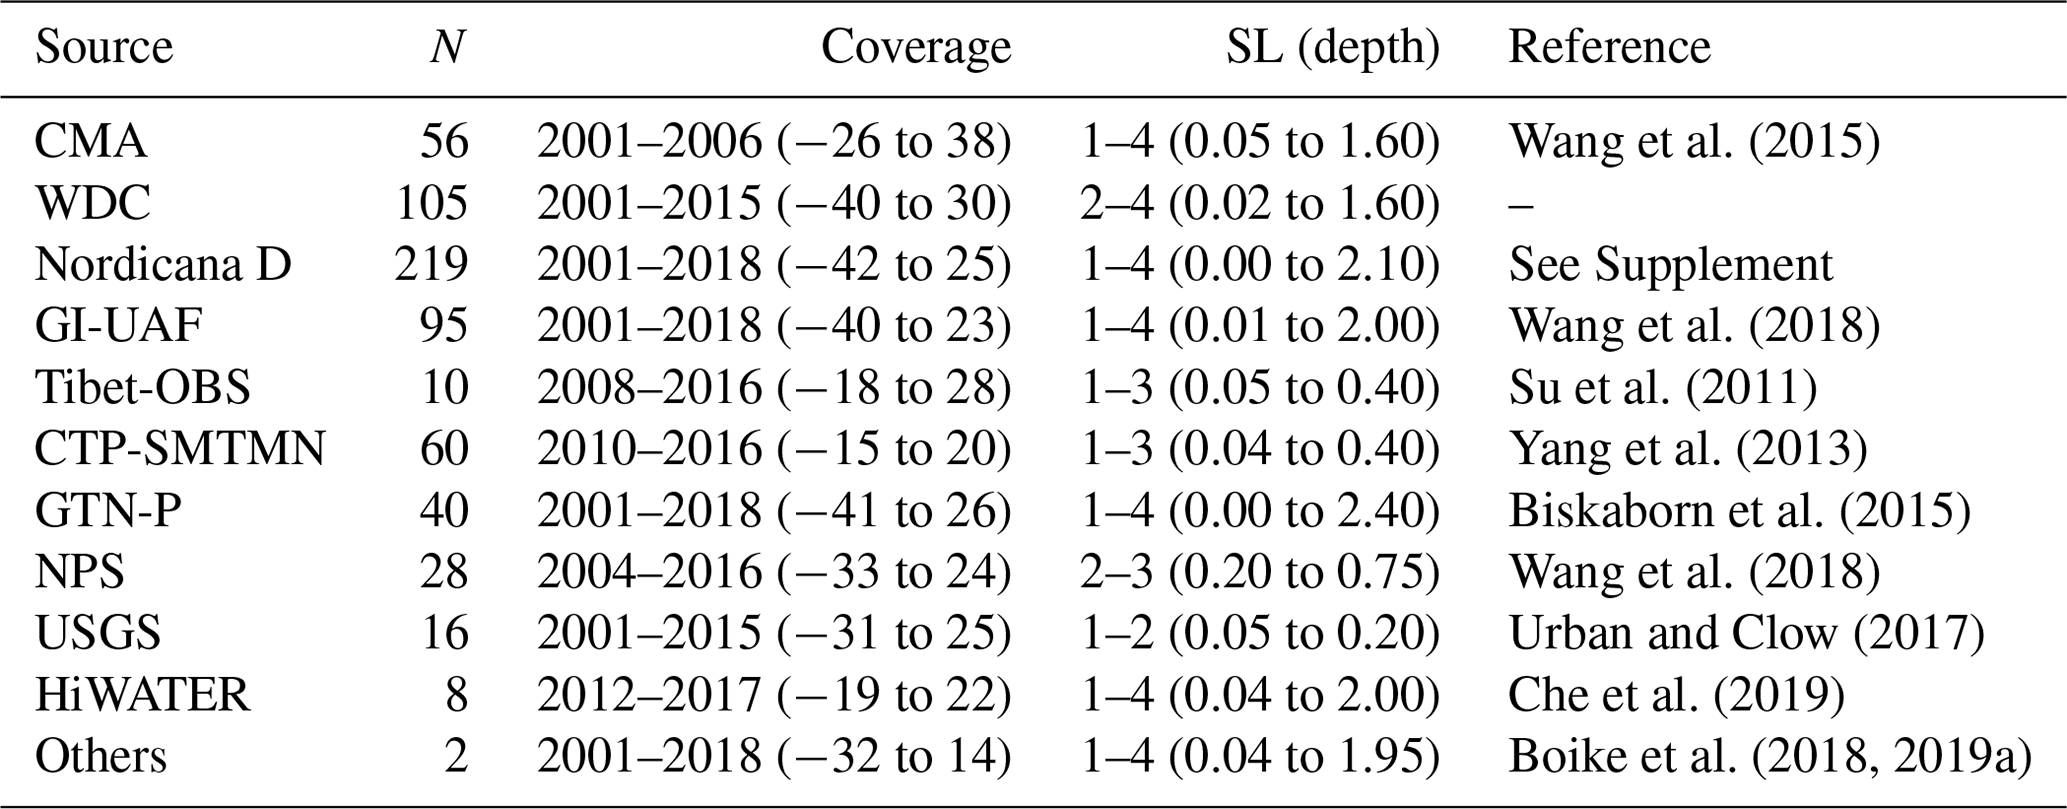
Note that references of the Nordicana D dataset are given for each site in the Supplement.
2.4 Existing permafrost maps
Four permafrost maps were used as benchmarks to evaluate permafrost area derived from ERA5L soil temperatures. They are (1) the IPA map, which is based on observations and mean annual air temperature (MAAT), (2) the heuristic 1 km global permafrost zonation index (PZI) map from Gruber (2012) (hereafter referred to as the PZI map), (3) the 1 km Northern Hemisphere permafrost map (Obu et al., 2019), which is based on the semi-physical temperature at the top of permafrost (TTOP) model (TTOP map) driven by Moderate Resolution Imaging Spectroradiometer (MODIS) land surface temperature that is filled by downscaled ERA-Interim air temperature, and (4) the 1 km circumpolar permafrost map (CP map), which is derived from a statistical model (Karjalainen et al., 2019a).
Whereas ERA5L, TTOP, and CP maps represent permafrost as a boolean variable (i.e., present or absent according to soil temperature), the IPA map and PZI map represent permafrost using either a categorical variable (e.g., continuous, discontinuous, sporadic, or isolated permafrost) or a continuous index (0.01–1) as a proxy to approximately represent the proportion of an area underlain by permafrost (i.e., the permafrost extent). Following Melton et al. (2019), we apply a threshold of 50 % (corresponding to the continuous and discontinuous permafrost zones) and 0.5 for the IPA map and the PZI map, respectively, to allow for meaningful comparison with the other maps. Values greater than this are considered to represent permafrost areas. The mean annual ground temperatures (MAGT) from the TTOP and CP maps were also used to evaluate ERA5L.
3.1 Evaluation
For the purposes of evaluation, temperature observations were only used from depths between 0 and 2.89 m, corresponding to the range of the ERA5L soil column. Temperature values were grouped according to their depth in one of the ERA5L soil layers. When this mapping resulted in multiple depths being assigned to a single soil layer, the one nearest to the ERA5L grid center was selected. The ERA5L soil temperatures were nearest neighbor interpolated to each of the observation sites to avoid missing values caused by adjacent water bodies. The mean bias (BIAS), mean absolute error (MAE), and RMSE were used as metrics to compare observations to ERA5L at the station scale (see Appendix A). In the case where multiple sites were located in the same ERA5L grid cell, BIAS, MAE, and RMSE were calculated for each site individually and then aggregated by averaging all stations in each grid cell with equal weight. For the evaluation at ERA5L grid scale, these aggregate metrics (for example, weighted mean bias, wBIAS) were used.
MAAT bias and maximum snow depth (SDmax) were selected as candidate variables to be assessed as possible predictors of ERA5L soil temperature bias (see Eq. 1). SDmax was defined as the median of annual maximum monthly snow depth during the period 2001–2018. The surface offset (SO), which quantifies the influence of surface conditions such as snow and vegetation cover (Smith and Riseborough, 2002), is defined here as the difference between MAAT and MAGT of the uppermost soil layer in ERA5L.
ERA5L ALT was derived by linearly interpolating the ERA5L soil temperature–depth profiles. The TTOP and CP map were derived using an equilibrium model, and MAGT is given as an average of the entire period (MAGTavg). This corresponds to 2002–2014 for the CP map and 2002–2016 for the TTOP map without uniform or specific soil depth. To better evaluate, we aggregated all available observed MAGTs during the period by averaging and then comparing them against the MAGTavg of these two maps. Note that the performance of CP and TTOP maps may be lower here than reported in the original publications due to the fact that we evaluate them with a different set of observations (different depths, periods, and proportion of sites in mountains).
Permafrost in ERA5L is limited to the near-surface due to the shallow simulation depth; consequently, only sites with shallow ALTs (<1.89 m) are evaluated here. The ERA5L near-surface permafrost area is evaluated using existing permafrost maps. An ERA5L grid cell is considered to be underlain by permafrost if either of the following conditions are true: (1) soil temperature in any of the four soil layers has an hourly temperature below 0 ∘C for 2 consecutive years (ERA5LH) or (2) the MAGT of the fourth soil layer is below 0 ∘C for 2 consecutive years (ERA5LA).
3.2 Detailed permafrost simulation example
Our results show remarkable bias of ERA5L soil temperature in winter that is thought to correlate with snow depth (Fig. 2). For this reason, the suitability of ERA5L soil temperature and the effect of the snow density bias are further investigated using a site-specific simulation example at a densely instrumented location near Lac de Gras (LdG), N.W.T., Canada (Fig. 1a). This simulation provides an opportunity to evaluate ERA5L soil temperature under different terrain (e.g., vegetation, soil properties) and snow conditions. We used GEOtop 2.0 (Endrizzi et al., 2014), a process-based numerical model, to simulate snow characteristics and soil temperature for 10 terrain types between September 2015 and August 2017, as described in detail by Cao et al. (2019a). Snow compaction due to wind effects is considered in one-dimension for all terrain types except for the tall shrub site (Pomeroy et al., 1993). The snow correction factor (SCF) is used to scale modeled snow mass via precipitation. It is used as a lumped variable for representing precipitation bias in the driving reanalysis, as well as differences between terrain types that are caused by preferential accumulation and lateral transport by snow drifting. The ERA5 reanalysis and its 10-member ensemble are used as forcing data for the simulation.
Table 2Comparison of ERA5L with observations and published data products for mean annual air temperature (MAAT), mean annual ground temperature (MAGT) of different soil layers, and surface offset (SO).
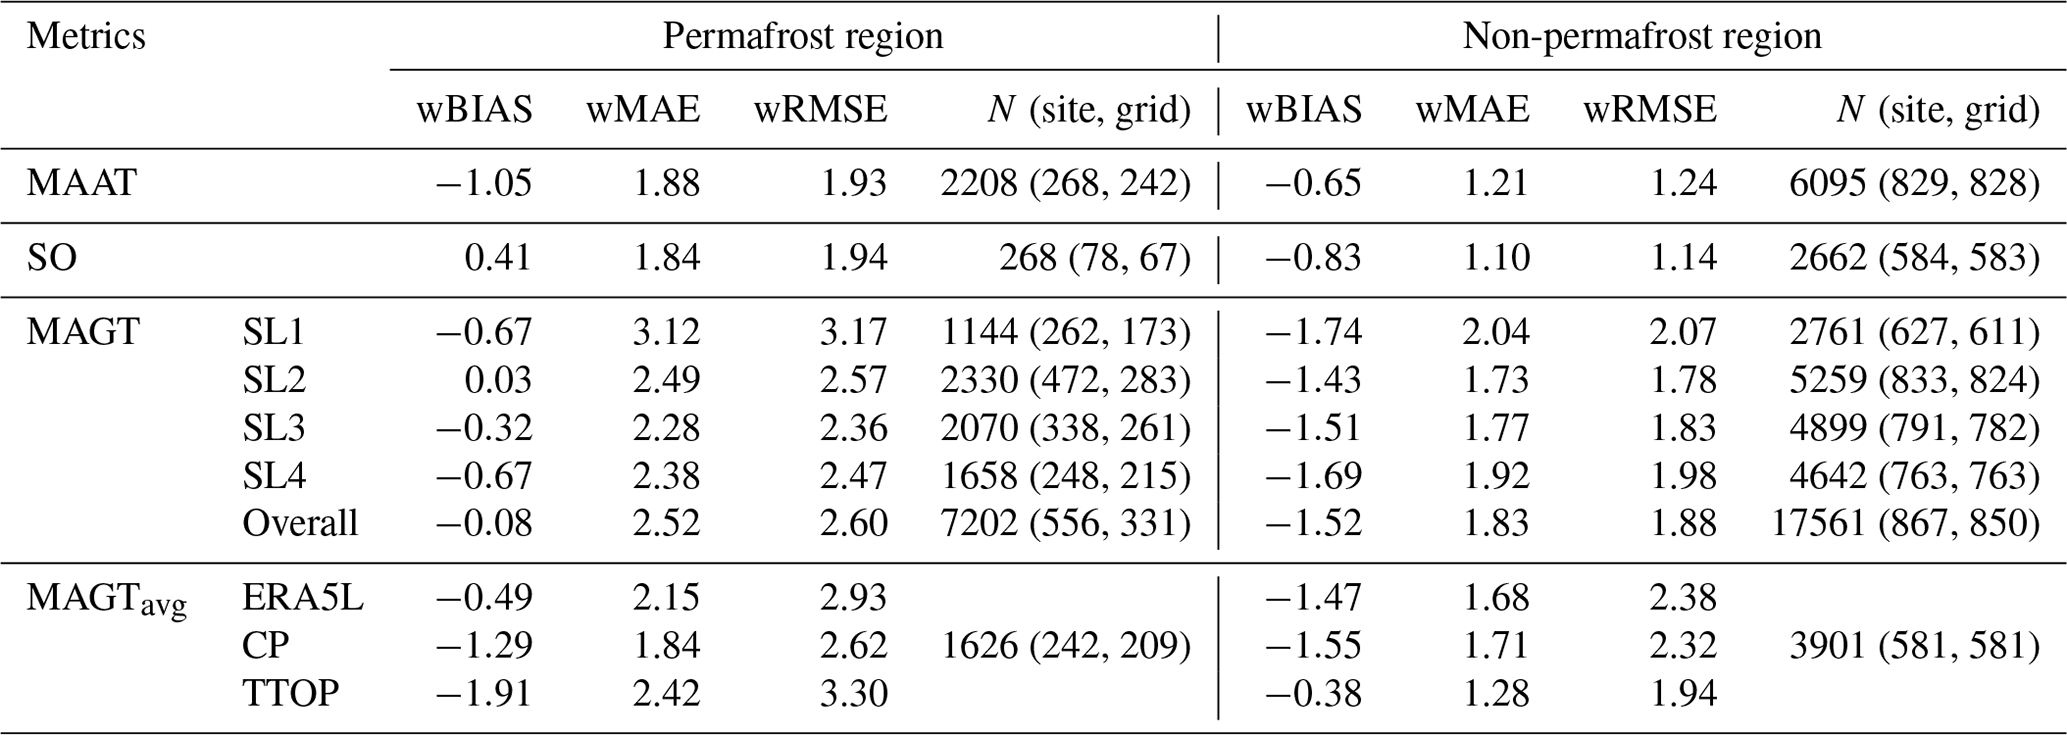
N is the total number of observations, annual or as averages over many years. The number of sites and unique grid cells are also shown in parentheses. SL1 through SL4 correspond to individual ERA5L soil layers, while “Overall” represents an average over the entire soil column. The MAGTavg is the average MAGT over the period 2001–2018 for ERA5L, 2000–2014 for the CP map (Karjalainen et al., 2019a), and 2002–2016 for the TTOP map (Obu et al., 2019). MAAT, SO, and MAGT were evaluated for each individual year, while MAGTavg was carried through once for the entire period, and all were based on sparse data. MAGTavg must be interpreted cautiously, taking into consideration the points outlined in Sect. 5.2. Permafrost regions are separated based on the IPA map.
Table 3Comparison of ERA5L permafrost area (PA) with previous estimates.
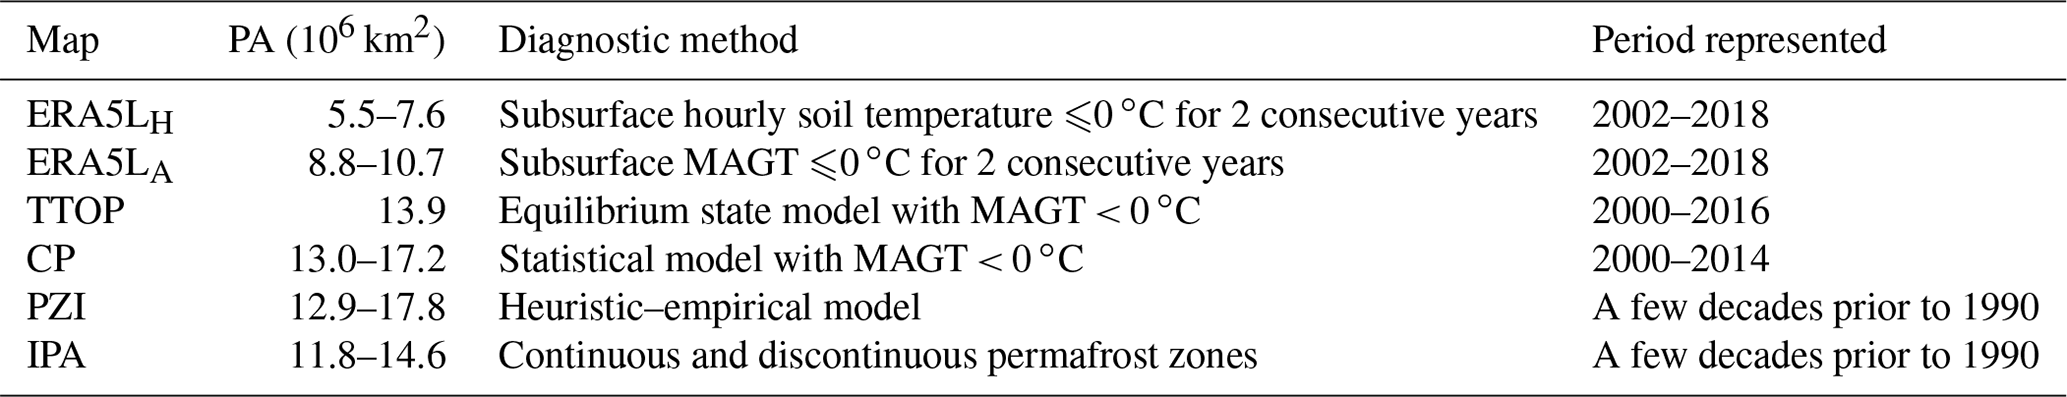
Note that the CP map only represents permafrost distribution north of 30∘ N (Karjalainen et al., 2019a), the TTOP map represents the permafrost distribution within the Northern Hemisphere (Obu et al., 2019), and the others represent the permafrost area north of 60∘ S. Permafrost area from the literature is given with their definition in this study.
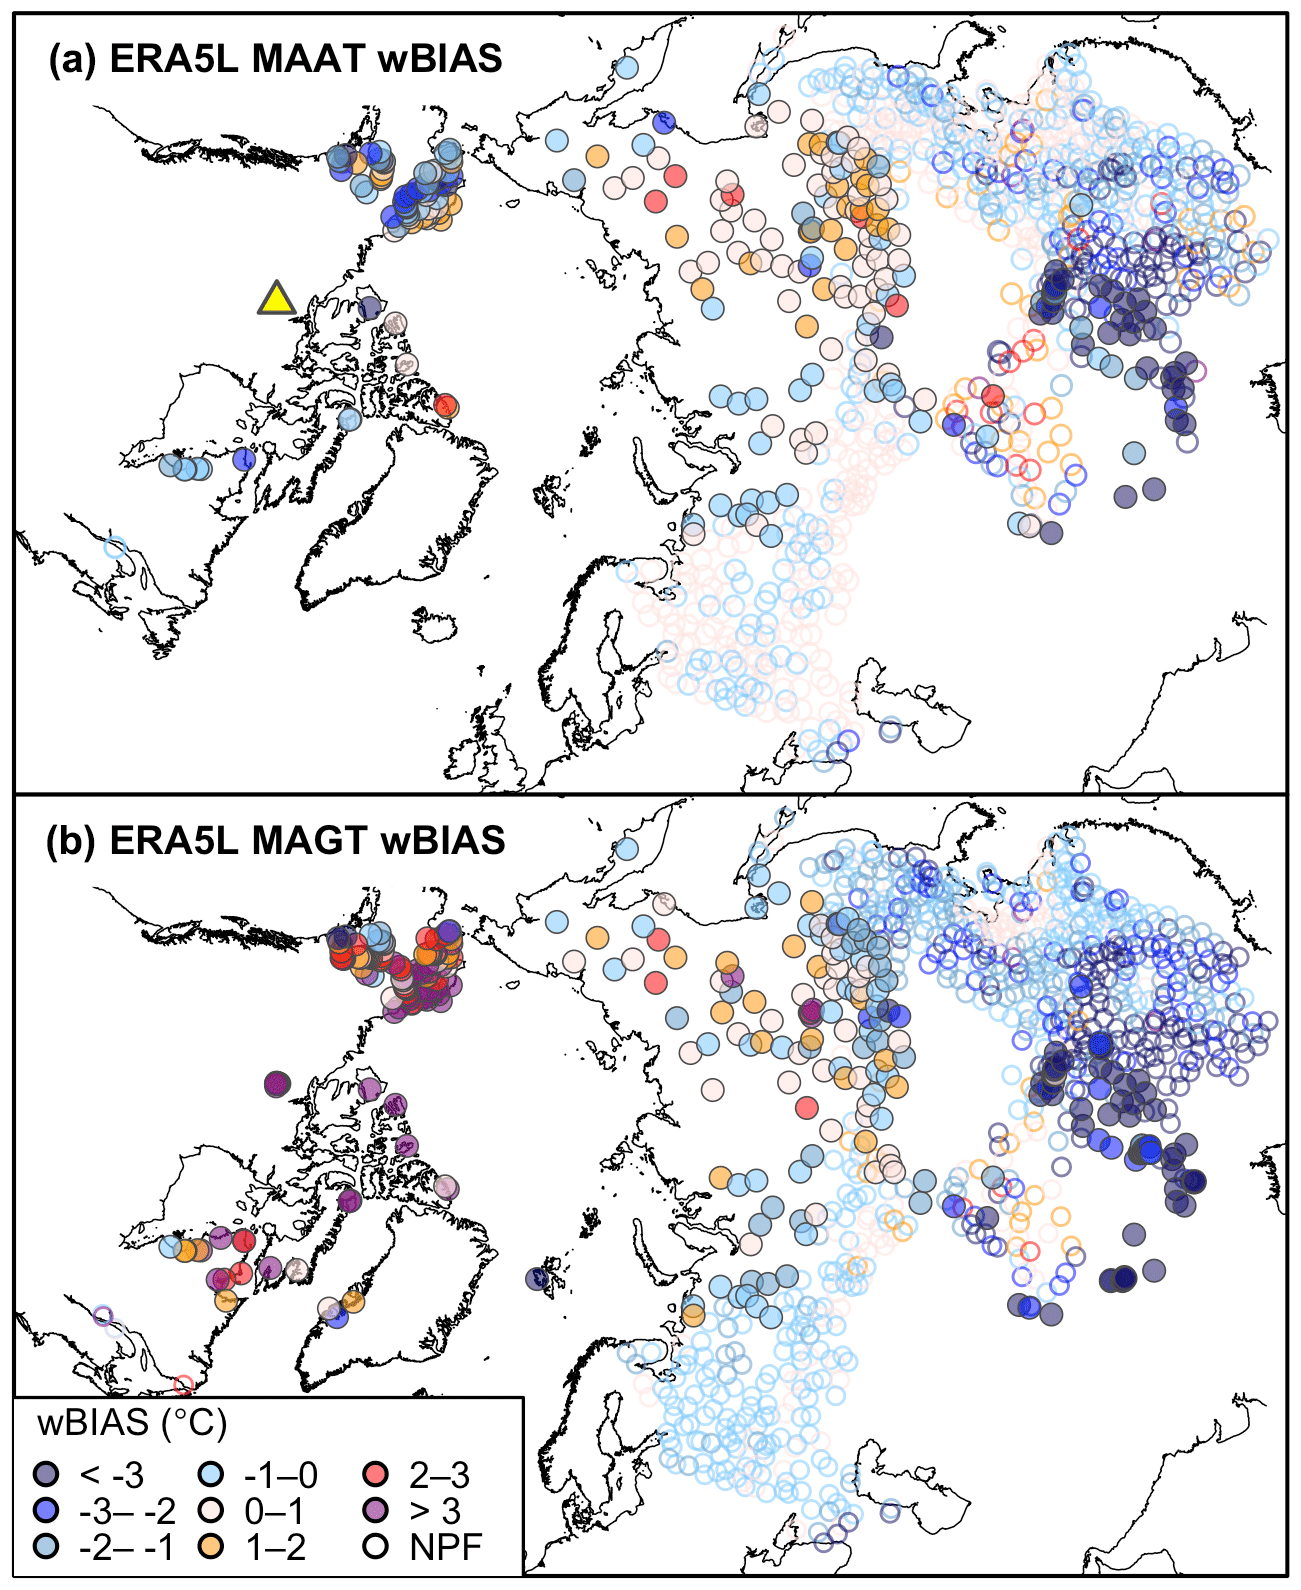
Figure 1Comparison of ERA5L MAAT (a) and MAGT (b) with observations. wBIAS is calculated using all available MAGTs from the four soil layers. Filled circles represent locations underlain by permafrost, and unfilled circles represent locations not underlain by permafrost (NPF) based on the IPA map. The yellow triangle in (a) marks the location of Lac de Gras, where the detailed permafrost simulation is conducted.
4.1 Soil temperature
ERA5L MAGT in the four soil layers has an overall weighted MAE (wMAE) of 2.52 ∘C and a weighted RMSE (wRMSE) of 2.60 ∘C (Table 2). Soil temperature is found to have a warm bias in western Canada and Alaska but a cold bias in mid–low latitudes such as the QTP, leading to a near-zero wBIAS of −0.08 ∘C (Fig. 3). Among the 932 MAGTs from 331 ERA5L grid cells, 20.7 % have an RMSE less than 1 ∘C, 53.5 % have an RMSE less than 2 ∘C, and 68.9 % have an RMSE less than 3 ∘C.
The following linear model was used to predict ERA5L soil temperature bias in permafrost regions using MAAT bias and snow depth as predictor variables:
where wBIASMAAT is the weighted bias of MAAT. The model was fit using 239 grid cells and has an R2 of 0.47. Both predictors were found to be statistically significant with p<0.01. The result suggests that MAAT and snow depth both influence ERA5L soil temperature. An increase of 1 ∘C in MAAT wBIAS corresponds to an increase of 0.76 ∘C in ERA5L MAGT wBIAS, and an increase of 1 m in wSDmax (weighted maximum snow depth) corresponds to an increase of 0.77 ∘C in wBIAS. The overall wRMSE of SO is 1.94 ∘C, and wBIAS is 0.21 ∘C. These results are comparable to those obtained for the land surface scheme (JULES) of the UK Earth System Model (UKESM) (Chadburn et al., 2015).
Averaged MAGTs from the CP and TTOP map were bilinearly interpolated to the observed sites and compared against the observations of the deepest soil layer. We found that the performance of ERA5L is intermediate between the two maps (Table 2). Whereas Karjalainen et al. (2019b) found that the predictive accuracy of their statistical model was similar between permafrost and non-permafrost regions, our results show ERA5L and TTOP soil temperature agree less with observations in permafrost regions than in non-permafrost regions (Table 2; Fig. 3). In addition to the worse performance of MAAT in these regions, the result suggests that HTESSEL may be less suitable for soil temperature simulation in areas with more prevalent snow and soil freezing. The large warm bias of ERA5L soil temperature during winter (Fig. 2) further supports this notion.
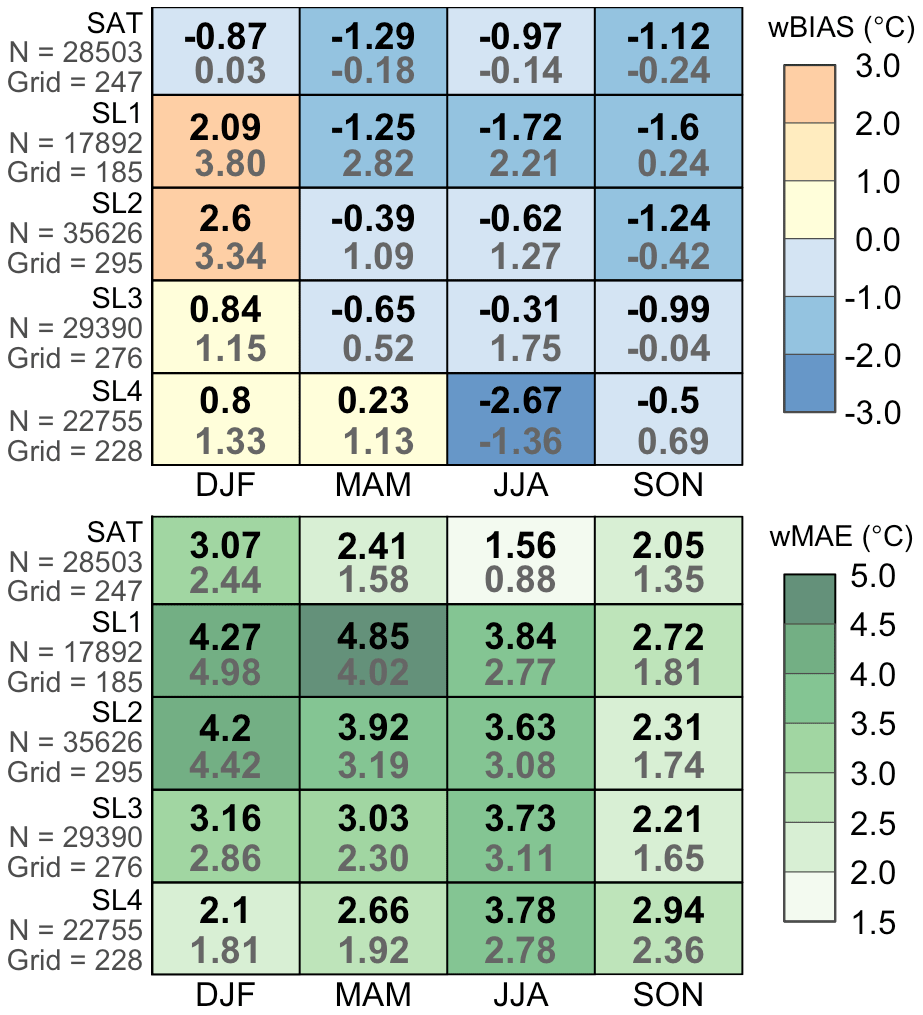
Figure 2Monthly deviations of ERA5L soil temperature over permafrost regions. Monthly soil temperature is first simulated for each depth and grid, and then the comparison is conducted for each season by averaging the MAE of all grids. Numbers in black at the top of each cell are for all permafrost regions. Numbers at the bottom of each cell in gray are limited to results from Russia and Alaska to permit comparison with the results of Melton et al. (2019). SAT is the near-surface air temperature.
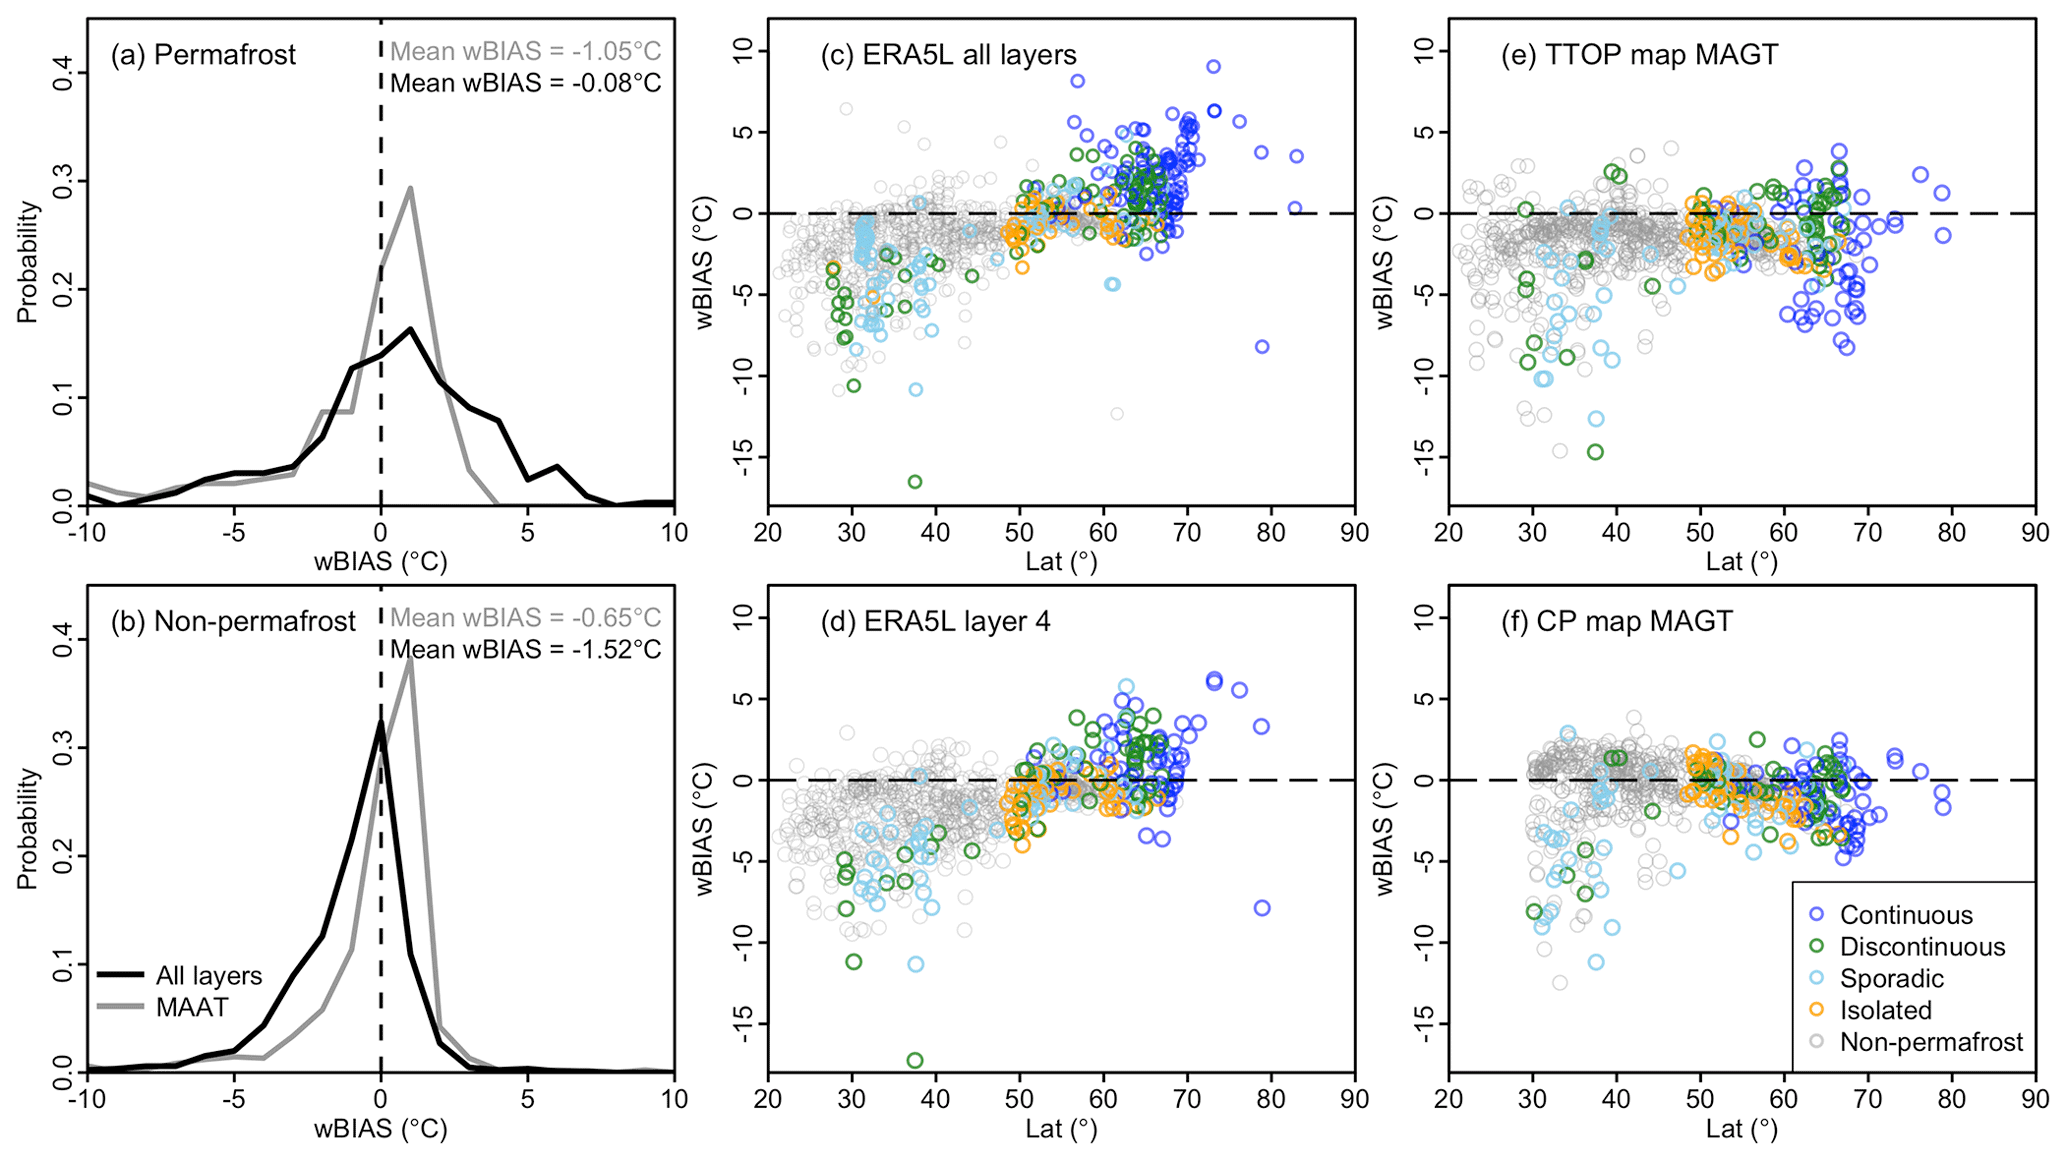
Figure 3(a, b) The wBIAS (observations − ERA5L) density of ERA5L mean annual air temperature (MAAT) and mean annual ground temperature (MAGT) in permafrost (a) and non-permafrost (b) regions as a whole. (c–f) wBIAS of ERA5L overall MAGT (c), the last layer (d), TTOP map MAGT (e), and CP map MAGT (f) grouped by permafrost zone.

4.2 Active-layer thickness and permafrost distribution
While ERA5L is not capable of representing deep ALT, our results show that even for shallow ALT grids the mean ERA5L ALT (1.67 m) was more than twice the mean observed ALT (0.82 m) (Fig. 4). ERA5L ALT is substantially overestimated for most (72 of 79) of the grids with wRMSE values up to 0.98 m. Excluding glaciers, the mean near-surface permafrost area of the Northern Hemisphere was estimated as km2 based on hourly soil temperature and km2 based on MAGT during 2002–2018 (Table 2; Fig. 5). ERA5L underestimates permafrost area compared to previous estimations (e.g., Brown et al., 1997; Gruber, 2012; Obu et al., 2019; Karjalainen et al., 2019b). Near-surface permafrost area of ERA5L as defined in this study decreased at a rate of −0.11 (−0.08) × 106 km2 yr−1 based on hourly (annual) mean soil temperature. This corresponds to a loss of 1.7 (1.4) × 106 km2 of near-surface permafrost area since 2002.
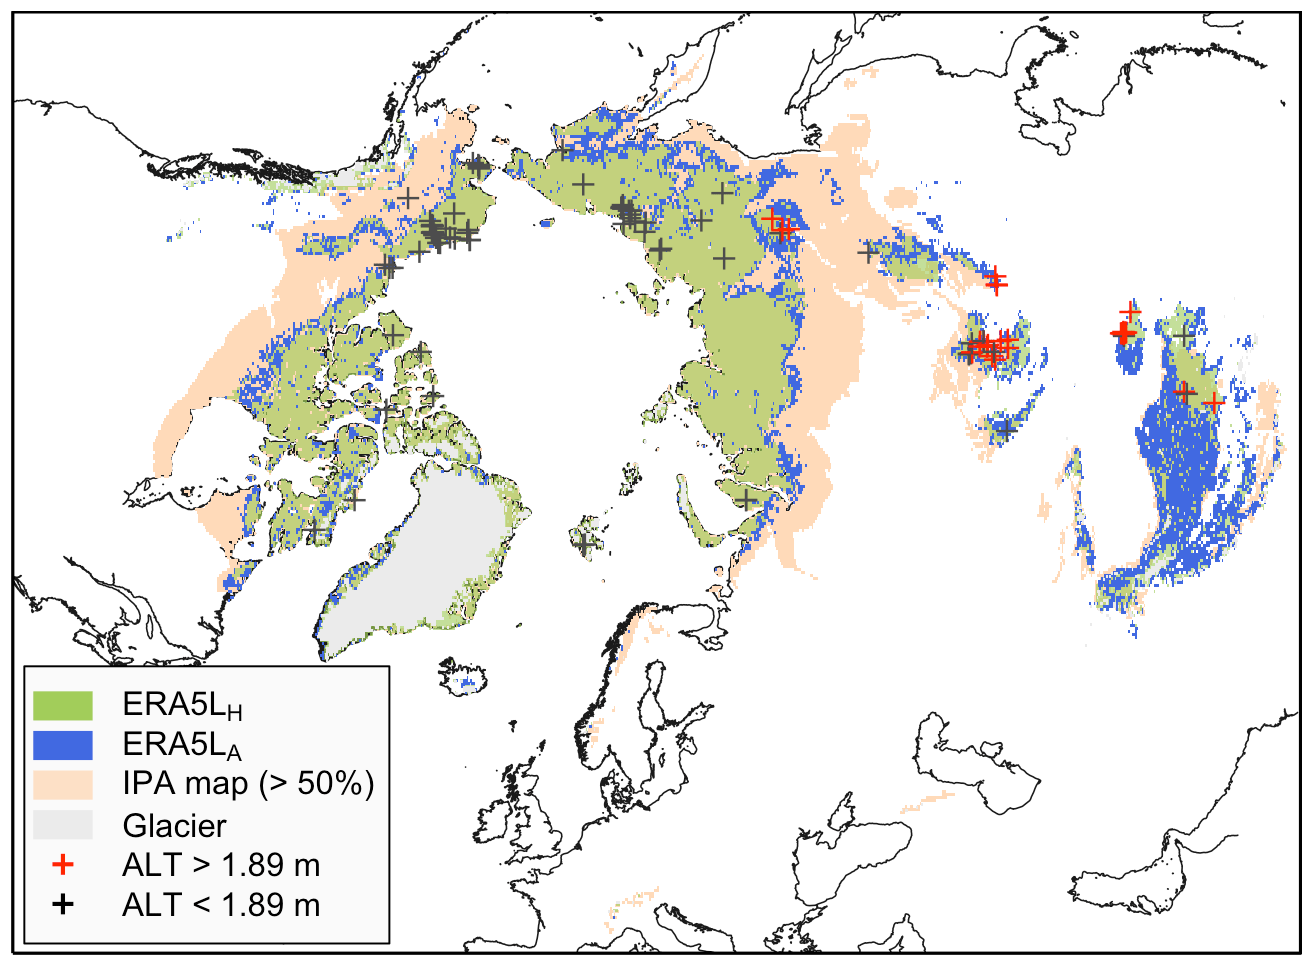
Figure 5Near-surface permafrost area in 2002 derived from hourly (ERA5LH) and annual (ERA5LA) ERA5L soil temperature overlapping the continuous and discontinuous permafrost zones (permafrost extent > 50 %) of the IPA map. Active-layer thicknesses taken from Peng et al. (2018).
4.3 Detailed permafrost simulation example
The detailed example simulation indicates that ERA5L soil temperature has a warm bias (from 0.95 to 5.48 ∘C) in all terrain types, whereas GEOtop forced by ERA5 and its 10 ensemble members show more reasonable results even when SCF equals 1 (Fig. 6). More specifically, ERA5L was only found to be suitable in terrain types with significant snow deposition (e.g., in snowdrifts, tall shrubs, and sedge fen). For all other terrain types, ERA5L showed a significant warm bias during winter and, consequently, in the annual mean. Although the ERA5L results for SWE agreed with GEOtop when driven by the same data (SCF = 1), the mean snow depth was approximately 1.53 times that of GEOtop, and the snow density was much lower (Table 4).
Table 4Comparisons of September to March average snow water equivalent (SWE; m), depth (m), and density (kg m−3) near Lac de Gras for ERA5L and a GEOtop simulation driven by ERA5.
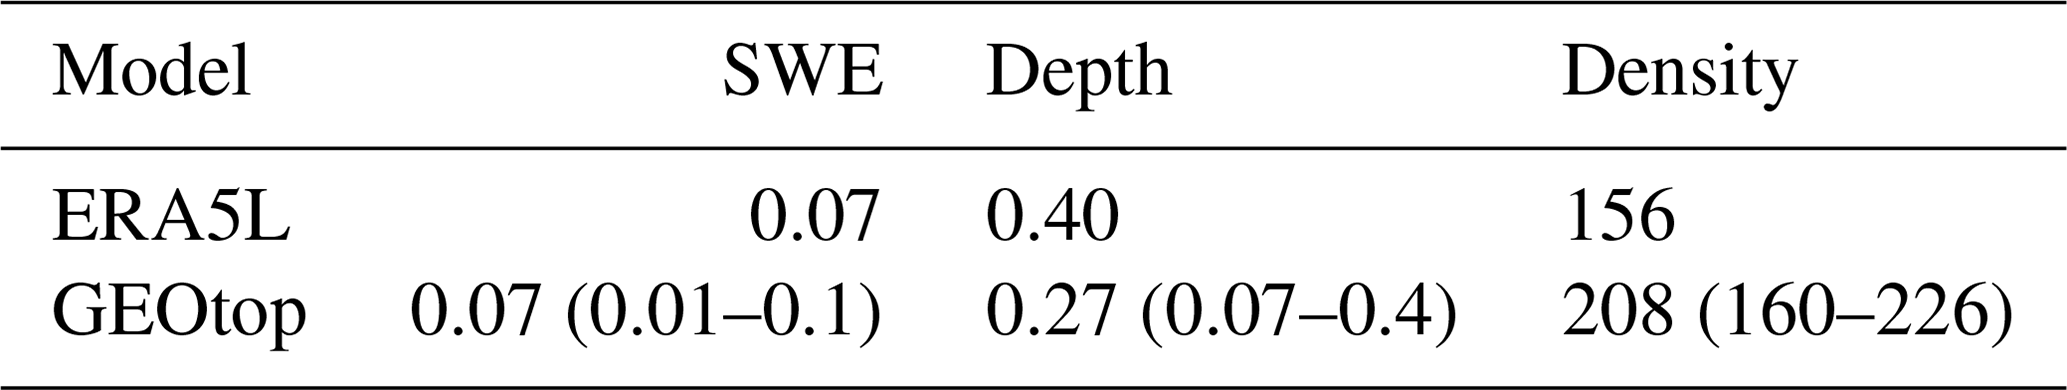
The snow characteristics of GEOtop are derived using SCF equal to 1. The range in parentheses represents SCFs between 0.30 and 1.62 depending on the exact value used for each different terrain type in Fig. 6.
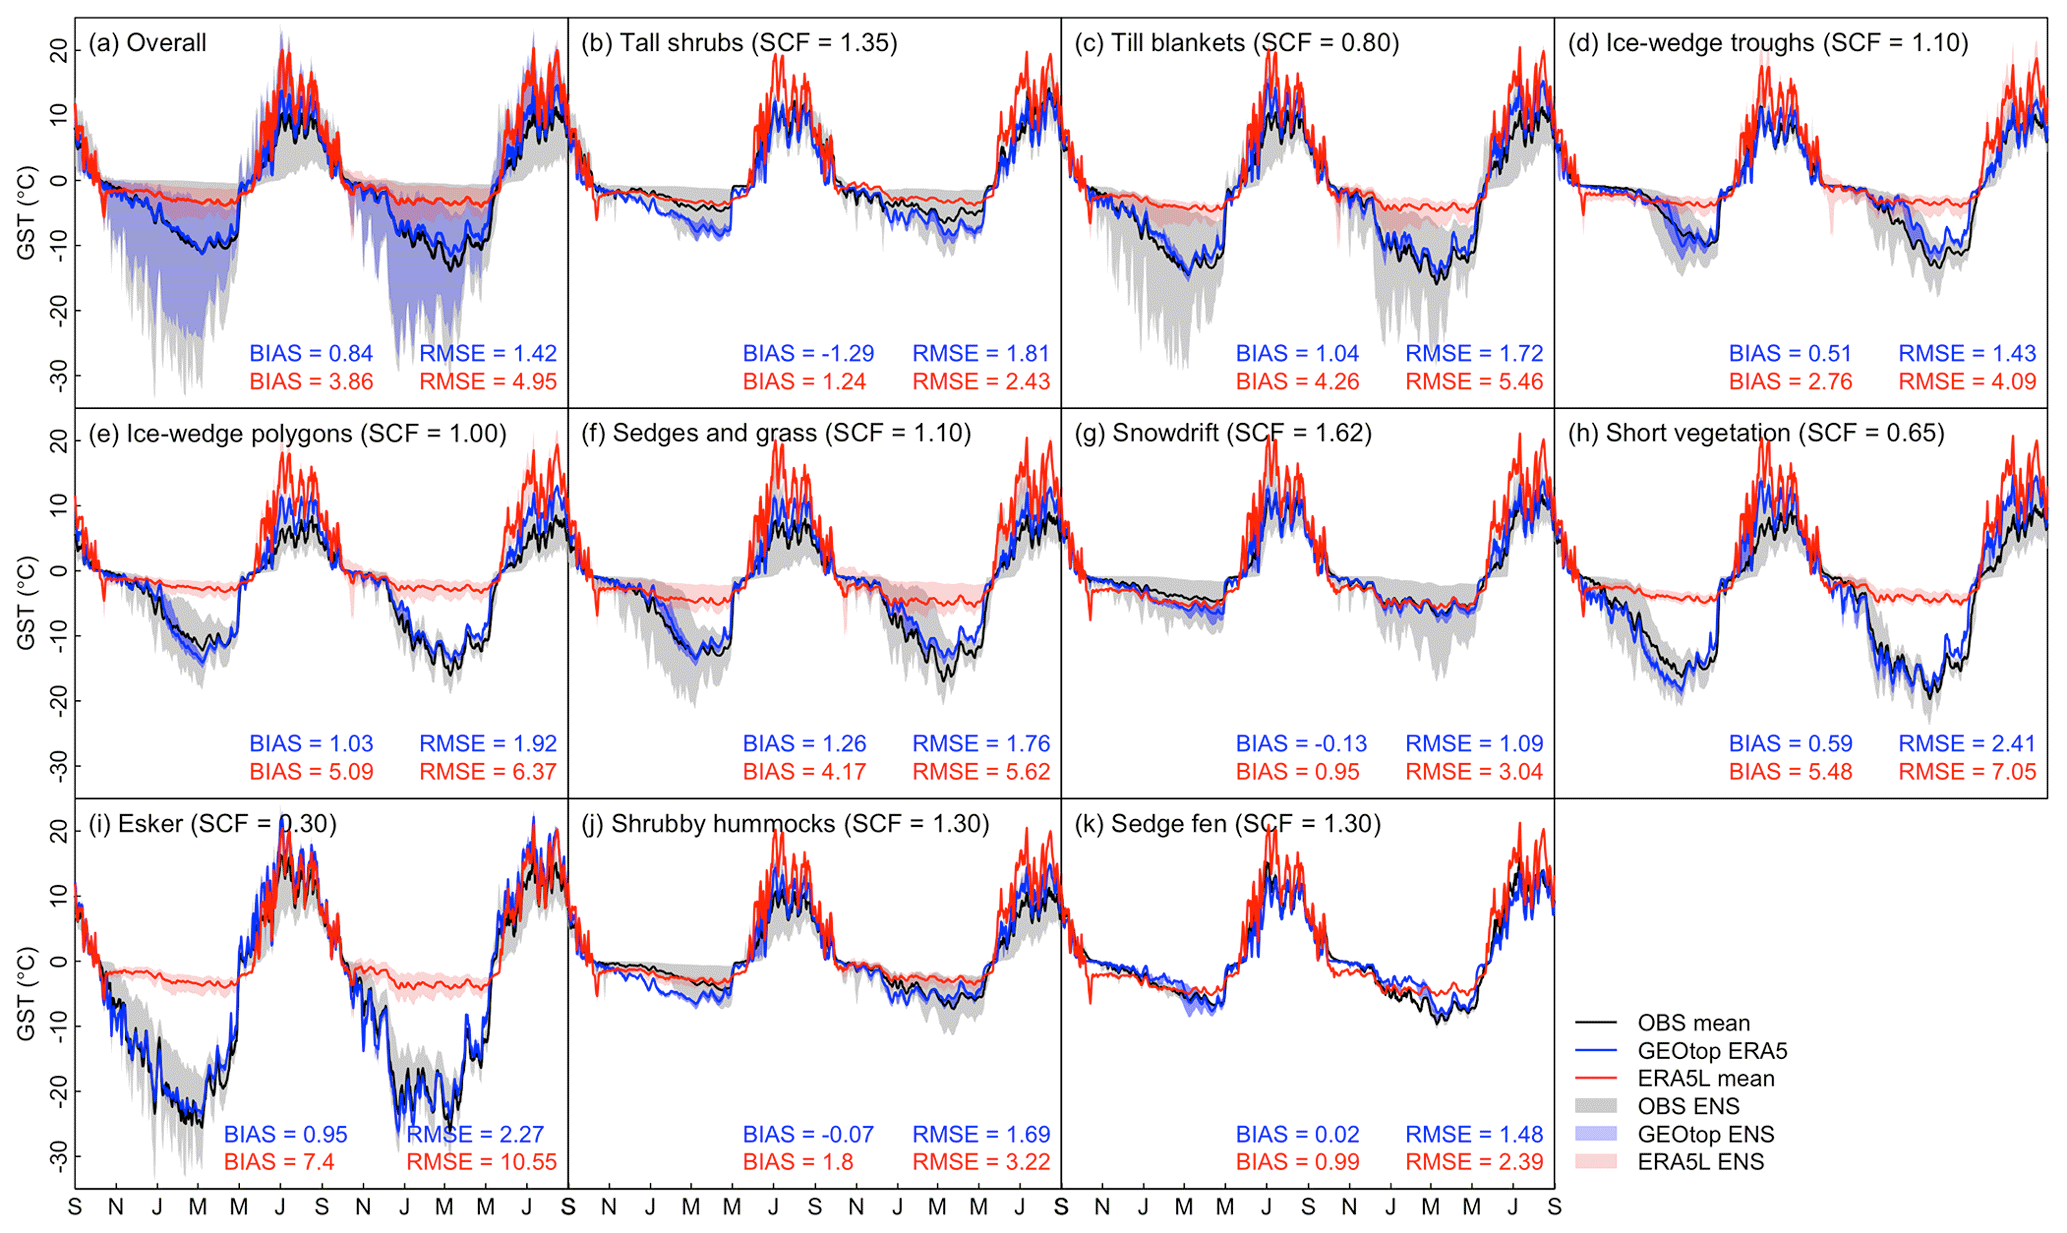
Figure 6Ground surface temperature (GST) at 0.1 m depth for 10 terrain types with different snow accumulation tendencies in LdG, northern Canada. Observations and GEOtop ERA5 are taken from Cao et al. (2019a), and GEOtop ENS is the modeled ensemble range forced by the 10-member ensemble of ERA5. Note that soil temperatures from the first layer of ERA5L are used here. The BIAS and RMSE are simulated at a daily scale for each terrain type.
5.1 Suitability of ERA5L soil temperature
ERA5L has a number of advantages for permafrost research; it provides a long historical record (back to 1950, eventually), high spatial resolution, and global coverage. While it could be seen to provide an opportunity to study long-term changes in permafrost at an intermediate scale (∼9 km) without additional model simulation, our results indicate that significant bias in ERA5L soil temperature limits its utility for permafrost research.
Compared to a coarse-grid (∼2.8∘) simulation (Fig. 4 from Melton et al., 2019), ERA5L often has more reasonable results in its deepest soil layer despite the fact that fewer permafrost-specific physics are included in the HTESSEL. The results of ERA5L are generally worse in the shallow soil layers (Fig. 2). ERA5L does not reproduce ALT well (Fig. 4) likely due to its shallow soil column, coarse vertical discretization, warm bias in soil temperature, and lack of phase-dependent thermal conductivity in soil. Furthermore, ERA5L shows a remarkable underestimation of total permafrost area (Table 3; Fig. 5) when compared with previous estimates. An explanation for this is that large ALTs (i.e., >1.89 m) that frequently develop in midlatitude mountains (e.g., Zhao et al., 2010; Cao et al., 2017) cannot be represented by the shallow soil column of ERA5L. While this could contribute to an underestimation of permafrost area on the QTP, where observed ALT is generally large, we observe a simultaneous cold bias in soil temperature which counteracts the first effect. Our results indicate that the cold bias of ERA5L in mid–low latitudes is highly aligned with the MAAT bias (Fig. 1). This is also suggested by the linear model (Eq. 1). On the other hand, ERA5L underestimates permafrost area in Canada and Alaska despite the observed ALT there being mostly low. This is because the ERA5L soil temperature in western Canada and Alaska is too warm with a wBIAS of about +1.5 ∘C.
Loss of permafrost is an expected consequence of a warming atmosphere. While the loss of near-surface permafrost area derived from ERA5L is similar to previous land surface model simulations (Lawrence et al., 2008; Slater and Lawrence, 2013), the absolute numbers and the rate of loss have little value for further interpretation because the permafrost area has a pronounced bias to begin with and because its temporal dynamics are known to be poorly represented with a shallow soil column and are likely affected by an inadequate representation of snow. Furthermore, because permafrost extent is a variable that cannot be observed, we fundamentally lack possibilities for proper validation (Gruber, 2012).
5.2 Model evaluation with sparse data
Looking exclusively at summary statistics from 242 sites in 209 grid cells would misleadingly show that ERA5L has a relatively good ability to represent the thermal state of permafrost. For example, consider that ERA5L outperformed the TTOP map in all evaluation metrics (Table 2). However, its simulated permafrost area is visibly low when plotted on a map (Fig. 5). These contradictory findings can be reconciled because of the warm bias at high latitudes and cold bias in midlatitudes which cancel each other out based on the available observations (Fig. 3). Clearly, an improvement in summary statistics alone is not a sufficient criterion for superior model performance. Notably, the International Permafrost Association action group “Specification of a Permafrost Reference Product in Succession of the IPA Map” reported in 2016 that, in order to make progress, we needed the capability to measure whether a new map or model output was of superior quality compared with an old one. For this, they recommended that the permafrost community develop and provide the necessary data, methods, and standards (Gruber, 2016).
5.3 Scale effects
Even for a small area within a single grid cell of Earth system models or reanalyses (10–100 km), evaluation with point observations remains difficult. This is demonstrated by our simulation example at LdG; within an area of about 20 km × 30 km, MAGT and SO can vary by almost 7 ∘C based on plot sizes on the order of 15 m × 15 m (Gruber et al., 2018). This is important for two reasons. First, the results from statistical evaluations of coarse-scale products such as ERA5L depend significantly on the local selection of observation sites. This issue is known as the spatial effect which is when the lack of spatially distributed measurements consistent with the size of model grid cells (i.e., 0.1∘ in ERA5L) is a potential source of error for model evaluation (Gupta et al., 2006; Gubler et al., 2011). Second, ERA5L ground temperatures can only represent at best a small fraction of the area within each individual grid cell. Consequently, their value as part of a permafrost climate services system for informing local decision making (e.g., for adaptation) is limited.
5.4 Snow densification and heat transfer
The seasonal ERA5L soil temperature deviance (Fig. 2a) and linear model (Eq. 1) show a remarkable bias toward high soil temperature in winter that is correlated with snow height. While we do not imply that the GEOtop simulations are correct or accurately represent metamorphism in Arctic snow (see Domine et al., 2019), they do demonstrate that simulations with snow cover of similar mass but different density are able to match ground temperature observations far better than ERA5L. Since snow thermal conductivity can be described as an exponential function of its density (Eq. B12), the low-biased snow density of HTESSEL would contribute to a much lower snow thermal conductivity. With the same SWE, a low bias in snow density implies a high bias in snow depth. In this context, the temperature gradient and hence the heat flux through the snow pack are both reduced. Using the mean snow density in Table 4 as an example, a snow density of 75 % would reduce ground heat loss through the winter to about 44 %. Even though this represents only one local case study at LdG, it sheds light on a possible cause of the ERA5L soil temperature bias in cold regions more broadly. Interestingly, HTESSEL and GEOtop both use the same exponential formulation of snow thermal metamorphism proposed by Anderson (1976) but with different parameters. HTESSEL uses a value of 460 m3 kg−1 for cξ, a parameter controlling change in snow density due to thermal metamorphism (Eq. B5) (Dutra et al., 2010). This value is 104 times greater than the value for cξ in GEOtop (Endrizzi et al., 2014) and Anderson (1976). Consequently, for snow densities greater than 150 kg m−3, the change rate (s−1) related to thermal metamorphism remains near zero in HTESSEL. While this may explain, at least in part, the bias in ERA5L snow density and soil temperature, it is unknown whether the excessively high value for HTESSEL is merely an error in the publication cited or whether it reflects the value in the code. An additional contribution of GEOtop to higher snow densities in tundra environments may be the effect of blowing snow (cf. Pomeroy et al., 1993).
5.5 Implications
While global reanalyses provide urgently needed meteorological drivers for permafrost simulation, their soil data are not well suited for directly informing permafrost research or local adaptation decisions. As such, simulations using permafrost-specific land surface models driven by reanalyses (Cao et al., 2019a; Fiddes et al., 2015) will likely be increasingly important in the provision of permafrost climate services. Making future soil temperature products like ERA5L directly usable will require significant permafrost-specific alterations in model design, especially with respect to snow cover and the total depth of the ground representation for the land surface models that are used. If indeed the value of the parameter cξ in the snow metamorphism of HTESSEL is in error, then this would be an easy improvement.
Our results support five conclusions.
-
ERA5L soil temperature has a warm bias at high latitude and a cold bias in mid–low-latitude, high-elevation areas. The soil temperature bias in permafrost regions correlates with bias in air temperature and with maximum snow height. Seasonally, soil temperatures in winter are more strongly warm biased than in other seasons. With more prevalent snow and ice, ERA5L soil temperatures match observations less well in permafrost-affected regions than in non-permafrost conditions.
-
Permafrost area is strongly underestimated when derived from ERA5L soil temperature, and its temporal trend cannot be interpreted with confidence due to the bias in absolute area, as well as model limitations.
-
Active-layer thickness is overestimated when derived from ERA5L soil temperature. This is due to the warm bias in simulations, as well as the shallow soil column and coarse vertical discretization used.
-
ERA5L snow density is hypothesized as having a low bias, at least in high-latitude areas, explaining part of the warm bias in soil temperature.
-
Summary statistics comparing ERA5L with other spatial permafrost data based on their skill in reproducing observations do not agree with a geographic comparison of permafrost zones that are known to exist with some (albeit difficult to quantify) confidence. Whereas ERA5L performs well in the statistical evaluation, it severely underestimates permafrost area especially in Canada and Alaska. This highlights the remaining challenges in developing data and procedures for testing permafrost simulation models and products.
where Tobs is observed soil temperature and Tmod is the temperature from ERA5-Land soil temperature, GEOtop, or the literature.
B1 Snow densification
Snow density ρs (kg m−3) is constrained to be between 50 and 450 kg m−3. The compaction of snow density, or change rate (s−1), is parameterized as
where the first term represents overburden, the second term is thermal metamorphism (Anderson, 1976; Boone and Etchevers, 2001), and the last term is the influence of liquid water in snow (Ls; kg m−2) following Lynch-Stieglitz (1994). Ws (Pa) is the pressure of overlying snow mass or snow water equivalent (SWE; m) , and η (Pa s−1) is the viscosity coefficient of snow.
where g is the acceleration of gravity of 9.807 m s−2. Snow viscosity is described as a function of snow temperature (Ts; K) and density following Anderson (1976):
where Pa, aη=0.081 K−1, and bη= 0.018 m kg−3. TD (K) is the depression temperature:
The change rate in ρs related to thermal metamorphism is parameterized as
where aξ, bξ, and cξ are constant values of 2.8 s−1, 0.042 (unitless), and 460 m3 kg−1 derived or modified from Anderson (1976) and Jordan et al. (1999). Δβs (kg m−3) is given as
where ρξ (kg m−3) is equal to 150 kg m−3. Ls is diagnosed from snow temperature, SWE, and snow density:
where f(Ts) is the snow temperature function and is the liquid water in snow capacity (kg m−2).
where Tf is 273.16 K. is parameterized as a function of SWE and βs:
where and are constant values of 0.03 and 0.1, and C is given as
where is 200 kg m−3.
B2 Snow cover fraction
Snow cover fraction (SCF) can be given as
where SDcr, the minimum snow depth that ensures complete coverage of the grid box, is set as 0.1 m.
B3 Snow thermal conductivity
By following Douville et al. (1995), the snow thermal conductivity λs is treated as a function of snow density:
where λi is the thermal conductivity of ice of 2.2 W m−1 K−1 and ρi is ice density of 920 kg m−3.

Figure B1Distribution of soil temperature stations. Stations in permafrost regions are in color, while the gray ones are non-permafrost (NPF) stations. Stations in a circle have additional air temperature observations; stations marked by a triangle do not.
The Python script for downloading ERA5-Land is developed and provided through an application programming interface (API) request by ECMWF Climate Data Store (CDS) service and is available from the Supplement.
Soil temperature over China is not publicly available but could be requested from the National Meteorological Information Center (http://data.cma.cn/, last access: 4 August 2020). The other datasets are open access (last access: 4 August 2020). Further information can also be found in Table 1. The WDC dataset is available from http://www.wdcb.ru/ (WDC, 2020), the GTN-P dataset is available from https://gtnp.arcticportal.org/ (GTN-P, 2020), the USGS dataset is available from https://pubs.er.usgs.gov/publication/ds1021, NPS is available from https://irma.nps.gov/DataStore/ (Data Store, 2020), the HiWATER dataset is from the Cold and Arid Regions Science Data Center at Lanzhou (https://doi.org/10.3972/hiwater.001.2019.db; Che et al., 2018), and Tibet-Obs and CTP-SMTMN are available from the National Tibetan Plateau Data Center (https://data.tpdc.ac.cn/zh-hans/data/ef949bb0-26d4-4cb6-acc2-3385413b91ee/; Su and Yang, 2019). The Nordicana D data are available from http://www.cen.ulaval.ca/nordicanad/en_index.aspx (Nordicana D, 2020), GI-UAF is available from the Permafrost Laboratory of the University of Alaska (https://permafrost.gi.alaska.edu/content/data-and-maps; Permafrost Laboratory, 2020), and the datasets from Julia Boike are available from https://doi.pangaea.de/10.1594/PANGAEA.880120 (Boike et al., 2017) and https://doi.pangaea.de/10.1594/PANGAEA.905236 (Boike et al., 2019b). The PZI and TTOP maps are available from their publication, and the IPA map is available from the National Snow & Ice Data Center (https://nsidc.org/data/GGD318/versions/2).
The supplement related to this article is available online at: https://doi.org/10.5194/tc-14-2581-2020-supplement.
BC carried out this study by analyzing data, performing the simulations, and organizing and writing the paper and was responsible for the compilation and quality control of the observations. SG proposed the initial idea and contributed to organizing as well as writing the paper. XL and DHZ contributed to the writing of the paper.
The authors declare that they have no conflict of interest.
The authors thank Joe Melton for his helpful comments. We thank Jaroslav Obu for the guideline of the TTOP map, Kang Wang for the introduction to soil temperature datasets over Alaska, Frank E. Urban and Gary D. Clow for providing access to the NPS datasets, and Xiaoqing Peng for providing the active-layer thickness datasets. ERA5-Land reanalysis data and the ESA CCI LC map are provided by the ECMWF.
This research has been supported by the Strategic Priority Research Program of Chinese Academy of Sciences (grant nos. XDA20100000 and XDA20100104), the NSERC Permafrost Partnership Network for Canada (NSERC PermafrostNet) and the China Postdoctoral Science Foundation (grant no. 2019M660046).
This paper was edited by Chris Derksen and reviewed by three anonymous referees.
Aas, K. S., Martin, L., Nitzbon, J., Langer, M., Boike, J., Lee, H., Berntsen, T. K., and Westermann, S.: Thaw processes in ice-rich permafrost landscapes represented with laterally coupled tiles in a land surface model, The Cryosphere, 13, 591–609, https://doi.org/10.5194/tc-13-591-2019, 2019. a
Albergel, C., Balsamo, G., de Rosnay, P., Muñoz-Sabater, J., and Boussetta, S.: A bare ground evaporation revision in the ECMWF land-surface scheme: evaluation of its impact using ground soil moisture and satellite microwave data, Hydrol. Earth Syst. Sci., 16, 3607–3620, https://doi.org/10.5194/hess-16-3607-2012, 2012. a
Albergel, C., Dutra, E., Munier, S., Calvet, J.-C., Munoz-Sabater, J., de Rosnay, P., and Balsamo, G.: ERA-5 and ERA-Interim driven ISBA land surface model simulations: which one performs better?, Hydrol. Earth Syst. Sci., 22, 3515–3532, https://doi.org/10.5194/hess-22-3515-2018, 2018. a
Anderson, E. A.: A point energy and mass balance model of a snow cover, U.S. Department of Commerce, National Oceanic and Atmospheric Administration, National Weather Service, Office of Hydrology, 1976. a, b, c, d, e
Balsamo, G., Viterbo, P., Beijaars, A., van den Hurk, B., Hirschi, M., Betts, A. K., and Scipal, K.: A revised hydrology for the ECMWF model: Verification from field site to terrestrial water storage and impact in the integrated forecast system, J. Hydrometeorol., 10, 623–643, https://doi.org/10.1175/2008JHM1068.1, 2009. a
Biskaborn, B. K., Lanckman, J.-P., Lantuit, H., Elger, K., Streletskiy, D. A., Cable, W. L., and Romanovsky, V. E.: The new database of the Global Terrestrial Network for Permafrost (GTN-P), Earth Syst. Sci. Data, 7, 245–259, https://doi.org/10.5194/essd-7-245-2015, 2015. a, b
Boike, J., Juszak, I., Lange, S., Chadburn, S., Burke, E. J., Overduin, P. P., Roth, K., Ippisch, O., Bornemann, N., Stern, L., Gouttevin, I., Hauber, E., and Westermann, S.: Measurements in soil and air at Bayelva Station, PANGAEA, https://doi.org/10.1594/PANGAEA.880120, 2017. a
Boike, J., Juszak, I., Lange, S., Chadburn, S., Burke, E., Overduin, P. P., Roth, K., Ippisch, O., Bornemann, N., Stern, L., Gouttevin, I., Hauber, E., and Westermann, S.: A 20-year record (1998–2017) of permafrost, active layer and meteorological conditions at a high Arctic permafrost research site (Bayelva, Spitsbergen), Earth Syst. Sci. Data, 10, 355–390, https://doi.org/10.5194/essd-10-355-2018, 2018. a, b
Boike, J., Nitzbon, J., Anders, K., Grigoriev, M., Bolshiyanov, D., Langer, M., Lange, S., Bornemann, N., Morgenstern, A., Schreiber, P., Wille, C., Chadburn, S., Gouttevin, I., Burke, E., and Kutzbach, L.: A 16-year record (2002–2017) of permafrost, active-layer, and meteorological conditions at the Samoylov Island Arctic permafrost research site, Lena River delta, northern Siberia: an opportunity to validate remote-sensing data and land surface, snow, and permafrost models, Earth Syst. Sci. Data, 11, 261–299, https://doi.org/10.5194/essd-11-261-2019, 2019a. a, b
Boike, J., Nitzbon, J., Anders, K., Grigoriev, M. N., Bolshiyanov, D. Y., Langer, M., Lange, S., Bornemann, N., Morgenstern, A., Schreiber, P., Wille, C., Chadburn, S., Gouttevin, I., and Kutzbach, L.: Measurements in soil and air at Samoylov Station (2002–2018), version 201908. Alfred Wegener Institute – Research Unit Potsdam, PANGAEA, https://doi.org/10.1594/PANGAEA.905236, 2019b. a
Boone, A. A. and Etchevers, P.: An intercomparison of three snow schemes of varying complexity coupled to the same land surface model: Local-scale evaluation at an alpine site, J. Hydrometeorol., 2, 374–394, https://doi.org/10.1175/1525-7541(2001)002<0374:AIOTSS>2.0.CO;2, 2001. a
Boussetta, S., Balsamo, G., Beljaars, A., Panareda, A. A., Calvet, J. C., Jacobs, C., Van Den Hurk, B., Viterbo, P., Lafont, S., Dutra, E., Jarlan, L., Balzarolo, M., Papale, D., and Van Der Werf, G.: Natural land carbon dioxide exchanges in the ECMWF integrated forecasting system: Implementation and offline validation, J. Geophys. Res.-Atmos., 118, 5923–5946, https://doi.org/10.1002/jgrd.50488, 2013. a
Brown, J., Ferrians, O., Heginbottom, J., and Melnikov, E.: Circum-Arctic map of permafrost and ground-ice conditions, Circum-pacific map series CP-45, scale 1 : 10,000,000, Tech. rep., U.S. Geological Survey in Cooperation with the Circum-Pacific Council for Energy and Mineral Resources, Washington, DC, 1997. a, b
Cao, B., Gruber, S., Zhang, T., Li, L., Peng, X., Wang, K., Zheng, L., Shao, W., and Guo, H.: Spatial variability of active layer thickness detected by ground-penetrating radar in the Qilian Mountains, Western China, J. Geophys. Res.-Earth, 122, 574–591, https://doi.org/10.1002/2016JF004018, 2017. a
Cao, B., Quan, X., Brown, N., Stewart-Jones, E., and Gruber, S.: GlobSim (v1.0): deriving meteorological time series for point locations from multiple global reanalyses, Geosci. Model Dev., 12, 4661–4679, https://doi.org/10.5194/gmd-12-4661-2019, 2019a. a, b, c, d
Cao, B., Zhang, T., Wu, Q., Sheng, Y., Zhao, L., and Zou, D.: Permafrost zonation index map and statistics over the Qinghai-Tibet Plateau based on field evidence, Permafrost Periglac., 30, 178–194, https://doi.org/10.1002/ppp.2006, 2019b. a
Chadburn, S. E., Burke, E. J., Essery, R. L. H., Boike, J., Langer, M., Heikenfeld, M., Cox, P. M., and Friedlingstein, P.: Impact of model developments on present and future simulations of permafrost in a global land-surface model, The Cryosphere, 9, 1505–1521, https://doi.org/10.5194/tc-9-1505-2015, 2015. a, b
Che, T., Li, X., Liu, S., Li, H., Xu, Z., Tan, J., Zhang, Y., Ren, Z., Xiao, L., Deng, J., Ma, M., Wang, J., and Yang, X.: Integrated hydrometeorological – snow – frozen ground observations in the alpine region of the Heihe River Basin, China, National Tibetan Plateau Data Center, https://doi.org/10.3972/hiwater.001.2019.db, 2018. a
Che, T., Li, X., Liu, S., Li, H., Xu, Z., Tan, J., Zhang, Y., Ren, Z., Xiao, L., Deng, J., Jin, R., Ma, M., Wang, J., and Yang, X.: Integrated hydrometeorological, snow and frozen-ground observations in the alpine region of the Heihe River Basin, China, Earth Syst. Sci. Data, 11, 1483–1499, https://doi.org/10.5194/essd-11-1483-2019, 2019. a, b
Cheng, G. and Wu, T.: Responses of permafrost to climate change and their environmental significance, Qinghai-Tibet Plateau, J. Geophys. Res.-Earth, 112, 1–10, https://doi.org/10.1029/2006JF000631, 2007. a
Data Store: Welcome to the Data Store, available at: https://irma.nps.gov/DataStore/, last access: 4 August 2020. a
Domine, F., Picard, G., Morin, S., Barrere, M., Madore, J.-B., and Langlois, A.: Major Issues in Simulating Some Arctic Snowpack Properties Using Current Detailed Snow Physics Models: Consequences for the Thermal Regime and Water Budget of Permafrost, J. Adv. Model. Earth Sy., 11, 34–44, https://doi.org/10.1029/2018MS001445, 2019. a
Douville, H., Royer, J. F., and Mahfouf, J. F.: A new snow parameterization for the Météo-France climate model: Part I: validation in stand-alone experiments, Clim. Dynam., 12, 21–35, https://doi.org/10.1007/BF00208760, 1995. a
Dutra, E., Balsamo, G., Viterbo, P., Miranda, P. M., Beljaars, A., Schar, C., and Elder, K.: An improved snow scheme for the ECMWF land surface model: Description and offline validation, J. Hydrometeorol., 11, 899–916, https://doi.org/10.1175/2010JHM1249.1, 2010. a, b, c
Endrizzi, S., Gruber, S., Dall'Amico, M., and Rigon, R.: GEOtop 2.0: simulating the combined energy and water balance at and below the land surface accounting for soil freezing, snow cover and terrain effects, Geosci. Model Dev., 7, 2831–2857, https://doi.org/10.5194/gmd-7-2831-2014, 2014. a, b
European Centre for Medium-Range Weather Forecasts: Part IV: Physical processes, in: IFS Documentation CY45R1, no. 4 in IFS Documentation, ECMWF, Shinfield Park, Reading, RG2 9AX, England, 2018. a
Fiddes, J., Endrizzi, S., and Gruber, S.: Large-area land surface simulations in heterogeneous terrain driven by global data sets: application to mountain permafrost, The Cryosphere, 9, 411–426, https://doi.org/10.5194/tc-9-411-2015, 2015. a, b
Graham, R. M., Hudson, S. R., and Maturilli, M.: Improved Performance of ERA5 in Arctic Gateway Relative to Four Global Atmospheric Reanalyses, Geophys. Res. Lett., 46, 6138–6147, https://doi.org/10.1029/2019GL082781, 2019. a
Gruber, S.: Derivation and analysis of a high-resolution estimate of global permafrost zonation, The Cryosphere, 6, 221–233, https://doi.org/10.5194/tc-6-221-2012, 2012. a, b, c, d
Gruber, S.: Specification of a permafrost reference product in succession of the IPA Map (Action Group Report), Tech. rep., International Permafrost Association, available at: https://ipa.arcticportal.org/activities/action-groups (last access: 7 August 2020), 2016. a
Gruber, S., Brown, N., Stewart-Jones, E., Karunaratne, K., Riddick, J., Peart, C., Subedi, R., and Kokelj, S.: Ground temperature and site characterization data from the Canadian Shield tundra near Lac de Gras, N.W.T., Canada, Nordicana D, https://doi.org/10.5885/45561XD-2C7AB3DCF3D24AD8, 2018. a
GTN-P: GTN-P database, available at: https://gtnp.arcticportal.org/, last access: 4 August 2020. a
Gubler, S., Fiddes, J., Keller, M., and Gruber, S.: Scale-dependent measurement and analysis of ground surface temperature variability in alpine terrain, The Cryosphere, 5, 431–443, https://doi.org/10.5194/tc-5-431-2011, 2011. a
Guo, D. and Wang, H.: Simulated Historical (1901–2010) Changes in the Permafrost Extent and Active Layer Thickness in the Northern Hemisphere, J. Geophys. Res.-Atmos., 122, 285–.12, https://doi.org/10.1002/2017JD027691, 2017. a
Gupta, H. V., Beven, K. J., and Wagener, T.: Model Calibration and Uncertainty Estimation, in: Encyclopedia of Hydrological Sciences, chap. 131, American Cancer Society, John Wiley, https://doi.org/10.1002/0470848944.hsa138, 2006. a
Hersbach, H., Bell, B., Berrisford, P., Hirahara, S., Horányi, A., Muñoz‐Sabater, J., Nicolas, J., Peubey, C., Radu, R., Schepers, D., Simmons, A., Soci, C., Abdalla, S., Abellan, X., Balsamo, G., Bechtold, P., Biavati, G., Bidlot, J., Bonavita, M., Chiara, G., Dahlgren, P., Dee, D., Diamantakis, M., Dragani, R., Flemming, J., Forbes, R., Fuentes, M., Geer, A., Haimberger, L., Healy, S., Hogan, R. J., Hólm, E., Janisková, M., Keeley, S., Laloyaux, P., Lopez, P., Lupu, C., Radnoti, G., Rosnay, P., Rozum, I., Vamborg, F., Villaume, S., and Thépaut, J.-N.: The ERA5 Global Reanalysis, Q. J. Roy. Meteor. Soc., https://doi.org/10.1002/qj.3803, online first, 2020. a, b
Hu, G., Zhao, L., Li, R., Wu, X., Wu, T., Xie, C., Zhu, X., and Su, Y.: Variations in soil temperature from 1980 to 2015 in permafrost regions on the Qinghai-Tibetan Plateau based on observed and reanalysis products, Geoderma, 337, 893–905, https://doi.org/10.1016/j.geoderma.2018.10.044, 2019. a
Jordan, R. E., Andreas, E. L., and Makshtas, A. P.: Heat budget of snow-covered sea ice at North Pole 4, J. Geophys. Res.-Oceans, 104, 7785–7806, https://doi.org/10.1029/1999JC900011, 1999. a
Karjalainen, O., Aalto, J., Luoto, M., Westermann, S., Romanovsky, V. E., Nelson, F. E., Etzelmüller, B., and Hjort, J.: Data descriptor: Circumpolar permafrost maps and geohazard indices for near-future infrastructure risk assessments, Scientific Data, 6, 1–16, https://doi.org/10.1038/sdata.2019.37, 2019a. a, b, c
Karjalainen, O., Luoto, M., Aalto, J., and Hjort, J.: New insights into the environmental factors controlling the ground thermal regime across the Northern Hemisphere: a comparison between permafrost and non-permafrost areas, The Cryosphere, 13, 693–707, https://doi.org/10.5194/tc-13-693-2019, 2019b. a, b, c
Koven, C. D., Riley, W. J., and Stern, A.: Analysis of permafrost thermal dynamics and response to climate change in the CMIP5 earth system models, J. Climate, 26, 1877–1900, https://doi.org/10.1175/JCLI-D-12-00228.1, 2013. a
Koven, C. D., Lawrence, D. M., and Riley, W. J.: Permafrost carbon−climate feedback is sensitive to deep soil carbon decomposability but not deep soil nitrogen dynamics, P. Natl. Acad. Sci. USA, 112, 201415123, https://doi.org/10.1073/pnas.1415123112, 2015. a
Lawrence, D. M., Slater, A. G., Romanovsky, V. E., and Nicolsky, D. J.: Sensitivity of a model projection of near-surface permafrost degradation to soil column depth and representation of soil organic matter, J. Geophys. Res.-Earth, 113, 1–14, https://doi.org/10.1029/2007JF000883, 2008. a
Luo, D., Liu, L., Jin, H., Wang, X., and Chen, F.: Characteristics of ground surface temperature at Chalaping in the Source Area of the Yellow River, northeastern Tibetan Plateau, Agr. Forest Meteorol., 281, 107819, https://doi.org/10.1016/j.agrformet.2019.107819, 2020. a
Lynch-Stieglitz, M.: The Development and Validation of a Simple Snow Model for the GISS GCM, J. Climate, 7, 1842–1855, https://doi.org/10.1175/1520-0442(1994)007<1842:TDAVOA>2.0.CO;2, 1994. a, b
Melton, J. R., Verseghy, D. L., Sospedra-Alfonso, R., and Gruber, S.: Improving permafrost physics in the coupled Canadian Land Surface Scheme (v.3.6.2) and Canadian Terrestrial Ecosystem Model (v.2.1) (CLASS-CTEM), Geosci. Model Dev., 12, 4443–4467, https://doi.org/10.5194/gmd-12-4443-2019, 2019. a, b, c, d
Noël, B., van Kampenhout, L., van de Berg, W. J., Lenaerts, J. T. M., Wouters, B., and van den Broeke, M. R.: Brief communication: CESM2 climate forcing (1950–2014) yields realistic Greenland ice sheet surface mass balance, The Cryosphere, 14, 1425–1435, https://doi.org/10.5194/tc-14-1425-2020, 2020. a
Nordicana D: Mission, available at: http://www.cen.ulaval.ca/nordicanad/en_index.aspx, last access: 4 August 2020. a
Obu, J., Westermann, S., Bartsch, A., Berdnikov, N., Christiansen, H. H., Dashtseren, A., Delaloye, R., Elberling, B., Etzelmüller, B., Kholodov, A., Khomutov, A., Kääb, A., Leibman, M. O., Lewkowicz, A. G., Panda, S. K., Romanovsky, V., Way, R. G., Westergaard-Nielsen, A., Wu, T., Yamkhin, J., and Zou, D.: Northern Hemisphere permafrost map based on TTOP modelling for 2000–2016 at 1 km2 scale, Earth-Sci. Rev., 193, 299–316, https://doi.org/10.1016/j.earscirev.2019.04.023, 2019. a, b, c, d, e
Orsolini, Y., Wegmann, M., Dutra, E., Liu, B., Balsamo, G., Yang, K., de Rosnay, P., Zhu, C., Wang, W., Senan, R., and Arduini, G.: Evaluation of snow depth and snow cover over the Tibetan Plateau in global reanalyses using in situ and satellite remote sensing observations, The Cryosphere, 13, 2221–2239, https://doi.org/10.5194/tc-13-2221-2019, 2019. a
Peng, X., Zhang, T., Frauenfeld, O. W., Wang, K., Luo, D., Cao, B., Su, H., Jin, H., and Wu, Q.: Spatiotemporal Changes in Active Layer Thickness under Contemporary and Projected Climate in the Northern Hemisphere, J. Climate, 31, 251–266, https://doi.org/10.1175/JCLI-D-16-0721.1, 2018. a, b
Permafrost Laboratory: Data and Maps, available at: https://permafrost.gi.alaska.edu/content/data-and-maps, last access: 4 August 2020. a
Peters-Lidard, C. D., Blackburn, E., Liang, X., and Wood, E. F.: The effect of soil thermal conductivity parameterization on surface energy fluxes and temperatures, J. Atmos. Sci., 55, 1209–1224, https://doi.org/10.1175/1520-0469(1998)055<1209:TEOSTC>2.0.CO;2, 1998. a
Pomeroy, J. W., Gray, D. M., and Landine, P. G.: The Prairie Blowing Snow Model: characteristics, validation, operation, J. Hydrol., 144, 165–192, https://doi.org/10.1016/0022-1694(93)90171-5, 1993. a, b
Qin, Y., Wu, T., Zhao, L., Wu, X., Li, R., Xie, C., Pang, Q., Hu, G., Qiao, Y., Zhao, G., Liu, G., Zhu, X., and Hao, J.: Numerical Modeling of the Active Layer Thickness and Permafrost Thermal State Across Qinghai-Tibetan Plateau, J. Geophys. Res.-Atmos., 122, 604–11, https://doi.org/10.1002/2017JD026858, 2017. a
Ran, Y., Li, X., and Cheng, G.: Climate warming over the past half century has led to thermal degradation of permafrost on the Qinghai–Tibet Plateau, The Cryosphere, 12, 595–608, https://doi.org/10.5194/tc-12-595-2018, 2018. a
Rouse, W. R.: Microclimate of Arctic Tree Line 2. Soil Microclimate of Tundra and Forest, Water Resour. Res., 20, 67–73, https://doi.org/10.1029/WR020i001p00067, 1984. a
Schuur, E. A. G., McGuire, A. D., Schädel, C., Grosse, G., Harden, J. W., Hayes, D. J., Hugelius, G., Koven, C. D., Kuhry, P., Lawrence, D. M., Natali, S. M., Olefeldt, D., Romanovsky, V. E., Schaefer, K., Turetsky, M. R., Treat, C. C., and Vonk, J. E.: Climate change and the permafrost carbon feedback, Nature, 520, 171–179, https://doi.org/10.1038/nature14338, 2015. a
Slater, A. G. and Lawrence, D. M.: Diagnosing Present and Future Permafrost from Climate Models, J. Climate, 26, 5608–5623, https://doi.org/10.1175/JCLI-D-12-00341.1, 2013. a, b
Smith, M. W. and Riseborough, D. W.: Climate and the limits of permafrost: A zonal analysis, Permafrost Periglac., 13, 1–15, https://doi.org/10.1002/ppp.410, 2002. a
Su, B. and Yang, K.: Time-lapse observation dataset of soil temperature and humidity on the Tibetan Plateau (2008–2016), National Tibetan Plateau Data Center, https://doi.org/10.11888/Soil.tpdc.270110, 2019. a
Su, Z., Wen, J., Dente, L., van der Velde, R., Wang, L., Ma, Y., Yang, K., and Hu, Z.: The Tibetan Plateau observatory of plateau scale soil moisture and soil temperature (Tibet-Obs) for quantifying uncertainties in coarse resolution satellite and model products, Hydrol. Earth Syst. Sci., 15, 2303–2316, https://doi.org/10.5194/hess-15-2303-2011, 2011. a, b
Tao, J., Koster, R. D., Reichle, R. H., Forman, B. A., Xue, Y., Chen, R. H., and Moghaddam, M.: Permafrost variability over the Northern Hemisphere based on the MERRA-2 reanalysis, The Cryosphere, 13, 2087–2110, https://doi.org/10.5194/tc-13-2087-2019, 2019. a
Urban, F. E. and Clow, G. D.: DOI/GTN-P Climate and Active-Layer Data Acquired in the National Petroleum Reserve – Alaska and the Arctic National Wildlife Refuge, 1998–2015, USGS Data Series, 1021, 546 pp., https://doi.org/10.3133/ds1021, 2017. a, b
Walvoord, M. A. and Kurylyk, B. L.: Hydrologic Impacts of Thawing Permafrost – A Review, Vadose Zone J., 15, 1–20, https://doi.org/10.2136/vzj2016.01.0010, 2016. a
Wang, K., Zhang, T., and Zhong, X.: Changes in the timing and duration of the near-surface soil freeze/thaw status from 1956 to 2006 across China, The Cryosphere, 9, 1321–1331, https://doi.org/10.5194/tc-9-1321-2015, 2015. a, b
Wang, K., Jafarov, E., Overeem, I., Romanovsky, V., Schaefer, K., Clow, G., Urban, F., Cable, W., Piper, M., Schwalm, C., Zhang, T., Kholodov, A., Sousanes, P., Loso, M., and Hill, K.: A synthesis dataset of permafrost-affected soil thermal conditions for Alaska, USA, Earth Syst. Sci. Data, 10, 2311–2328, https://doi.org/10.5194/essd-10-2311-2018, 2018. a, b, c, d
WDC: World Data Centers (WDC) in Russia and Ukraine, available at: http://www.wdcb.ru/, last access: 4 August 2020. a
Westermann, S., Lüers, J., Langer, M., Piel, K., and Boike, J.: The annual surface energy budget of a high-arctic permafrost site on Svalbard, Norway, The Cryosphere, 3, 245–263, https://doi.org/10.5194/tc-3-245-2009, 2009. a
Yang, K. and Zhang, J.: Evaluation of reanalysis datasets against observational soil temperature data over China, Clim. Dynam., 50, 317–337, https://doi.org/10.1007/s00382-017-3610-4, 2018. a
Yang, K., Qin, J., Zhao, L., Chen, Y., Tang, W., Han, M., Lazhu, Chen, Z., Lv, N., Ding, B., Wu, H., and Lin, C.: A Multiscale Soil Moisture and Freeze–Thaw Monitoring Network on the Third Pole, B. Am. Meteorol. Soc., 94, 1907–1916, https://doi.org/10.1175/BAMS-D-12-00203.1, 2013. a, b
Zhao, L., Wu, Q., Marchenko, S., and Sharkhuu, N.: Thermal state of permafrost and active layer in Central Asia during the international polar year, Permafrost Periglac., 21, 198–207, https://doi.org/10.1002/ppp.688, 2010. a