the Creative Commons Attribution 4.0 License.
the Creative Commons Attribution 4.0 License.
 | 04 Dec 2019
Where are the avalanches? Rapid SPOT6 satellite data acquisition to map an extreme avalanche period over the Swiss Alps
Elisabeth D. Hafner
Benjamin Zweifel
Mathias Zesiger
Holger Heisig
Accurate and timely information on avalanche occurrence is key for avalanche warning, crisis management and avalanche documentation. Today such information is mainly available at isolated locations provided by observers in the field. The achieved reliability, considering accuracy, completeness and reliability of the reported avalanche events, is limited. In this study we present the spatially continuous mapping of a large avalanche period in January 2018 covering the majority of the Swiss Alps (12 500 km2).
We tested different satellite sensors available for rapid mapping during the first avalanche period. Based on these experiences, we tasked SPOT6 and SPOT7 for data acquisition to cover the second, much larger avalanche period. We manually mapped the outlines of 18 737 individual avalanche events, applying image enhancement techniques to analyze regions in the shade as well as in brightly illuminated ones. The resulting dataset of mapped avalanche outlines, having unique completeness and reliability, is evaluated to produce maps of avalanche occurrence and avalanche size. We validated the mapping of the avalanche outlines using photographs acquired from helicopters just after the avalanche period.
This study demonstrates the applicability of optical, very high spatial resolution satellite data to map an exceptional avalanche period with very high completeness, accuracy and reliability over a large region. The generated avalanche data are of great value in validating avalanche bulletins, in completing existing avalanche databases and for research applications by enabling meaningful statistics on important avalanche parameters.
- Article
(11773 KB) - Full-text XML
- BibTeX
- EndNote


Information on the occurrence and runout of snow avalanches is a key parameter for the development of effective hazard mitigation approaches for settlements and traffic infrastructure (Rudolf-Miklau et al., 2014; Bühler et al., 2018). Evidence of the locations and dimensions of avalanches is applied in hazard zone mapping for the evaluation of protection measures and for the validation and further development of numerical avalanche simulation software such as SAMOS (Sampl and Zwinger, 2004) or RAMMS (Christen et al., 2010). Therefore, the number, size and release depth of avalanches with accurate location information are most important. For avalanche warning, comprehensive information on avalanche activity is important for the evaluation of the avalanche bulletin, the European avalanche danger scale (Meister, 1994) and further developments of avalanche danger assessment tools such as the matrix of the European Avalanche Warning Services (EAWS; Müller et al., 2016) or the conceptual model of avalanche hazard (Statham et al., 2017). Even though such information is of very high value for different applications, it is not available today with satisfactory completeness and quality.
Currently, avalanche occurrences are usually only reported if they cause obstructions to public infrastructure, damage to personal property or are witnessed by local observers. In Switzerland all avalanches reported to the WSL Institute for Snow and Avalanche Research SLF that involve people or caused damage to property are stored in a database (Techel et al., 2015). Avalanches artificially released in ski resorts are often well documented, mainly for avalanche danger estimation, with nearest-neighbor models (Gassner et al., 2000) and for legal reasons. The existing avalanche inventories tend therefore to be biased toward damaging events or those reported from accessible terrain, whereas avalanches remain notoriously under-reported over larger regions. Since the Alps in Switzerland are quite densely populated, regions without reported avalanches are smaller than, for example, in Norway, but they do exist. Consequently, even under weather conditions with good visibility, only a fraction of all avalanches are captured. All the avalanches reported to the SLF from avalanche observers, ski resorts, rescue organizations or other individuals are weighted by size, number and release type and then added up in the dimensionless avalanche activity index (Schweizer et al., 2003). This index enables the comparison of avalanche activity per day throughout the winter and between years.
Avalanche detection systems based on time-lapse photography (Helbig et al., 2015), infrasound (Thüring et al., 2015), seismic signals (van Herwijnen et al., 2016; Heck et al., 2019), or radars and optical cameras (Meier et al., 2018) provide information on a local scale. Avalanche radar systems are already operationally applied to automatically close roads and railways in Switzerland. Depending on the system setup, an indication of avalanche size could be derived as well but is not standard information.
Remote sensing can provide spatially continuous information on avalanche occurrences over large regions, including areas where no observers can acquire data. Optical data from airplanes and satellites with very high spatial resolution (0.1–0.5 m) were successfully applied to automatically map avalanche debris under cloud-free conditions (Bühler et al., 2009; Lato et al., 2012; Eckerstorfer et al., 2016; Korzeniowska et al., 2017). But these datasets are only available for selected regions and are hard to get on short notice. Recently, unmanned aerial systems (UASs) have been successfully applied to document single avalanche events, but they are not able to cover large regions mainly due to legal restrictions (Bühler et al., 2017; Eckerstorfer et al., 2016). Radar satellites have the advantage of acquiring data despite clouds and without daylight. Therefore, radar data have also been applied to generate avalanche maps (Eckerstorfer and Malnes, 2015; Vickers et al., 2016; Eckerstorfer et al., 2017; Wesselink et al., 2017) and were recently also used for a large avalanche period in Greenland (Abermann et al., 2019). Due to the coarser spatial resolution (3–30 m) and limitations by the observation geometries (radar shadow and layover), considerable parts of mountain regions cannot be covered. Furthermore, the reliability of detecting medium- to small-sized avalanches and in particular dry snow avalanches is not yet satisfactory. But this reliability to detect a large part of all occurring avalanches is key for the statistical analysis of an avalanche period.
The aim of this investigation is to generate a record of avalanche occurrences for an avalanche period over a large region (12 500 km2) with very high reliability. This dataset can then be used for a meaningful statistical analysis of the avalanche period and to produce a nearly complete database of avalanche runouts that can be applied to validate the avalanche bulletin and hazard maps. Such a dataset did not yet exist.
2.1 Avalanche periods 2018
The year 2018 started off as being snow-rich in Switzerland. From 8 to 10 January a large snowfall event (period I) was responsible for up to 2 m of new snow in southwestern Switzerland. In combination with a previous snowfall event, which ended on 5 January, the avalanche danger scale rose to being very high (level 5) in these regions. This was the first use of danger level 5 in Switzerland since 2008, where it was not confirmed in retrospect. Therefore, this was the first time level 5 had been reached in reality since February 1999, a 19-year period. Between 15 and 19 January, it snowed again – 30 to 100 cm, locally up to 160 cm. The biggest amount of new snow was measured at the northern flank of the Swiss Alps. The snowfall was accompanied by strong winds mainly from western directions, causing big amounts of snow to drift over large distances. As a result, massive accumulations of windblown snow formed, in particular on slopes facing east.
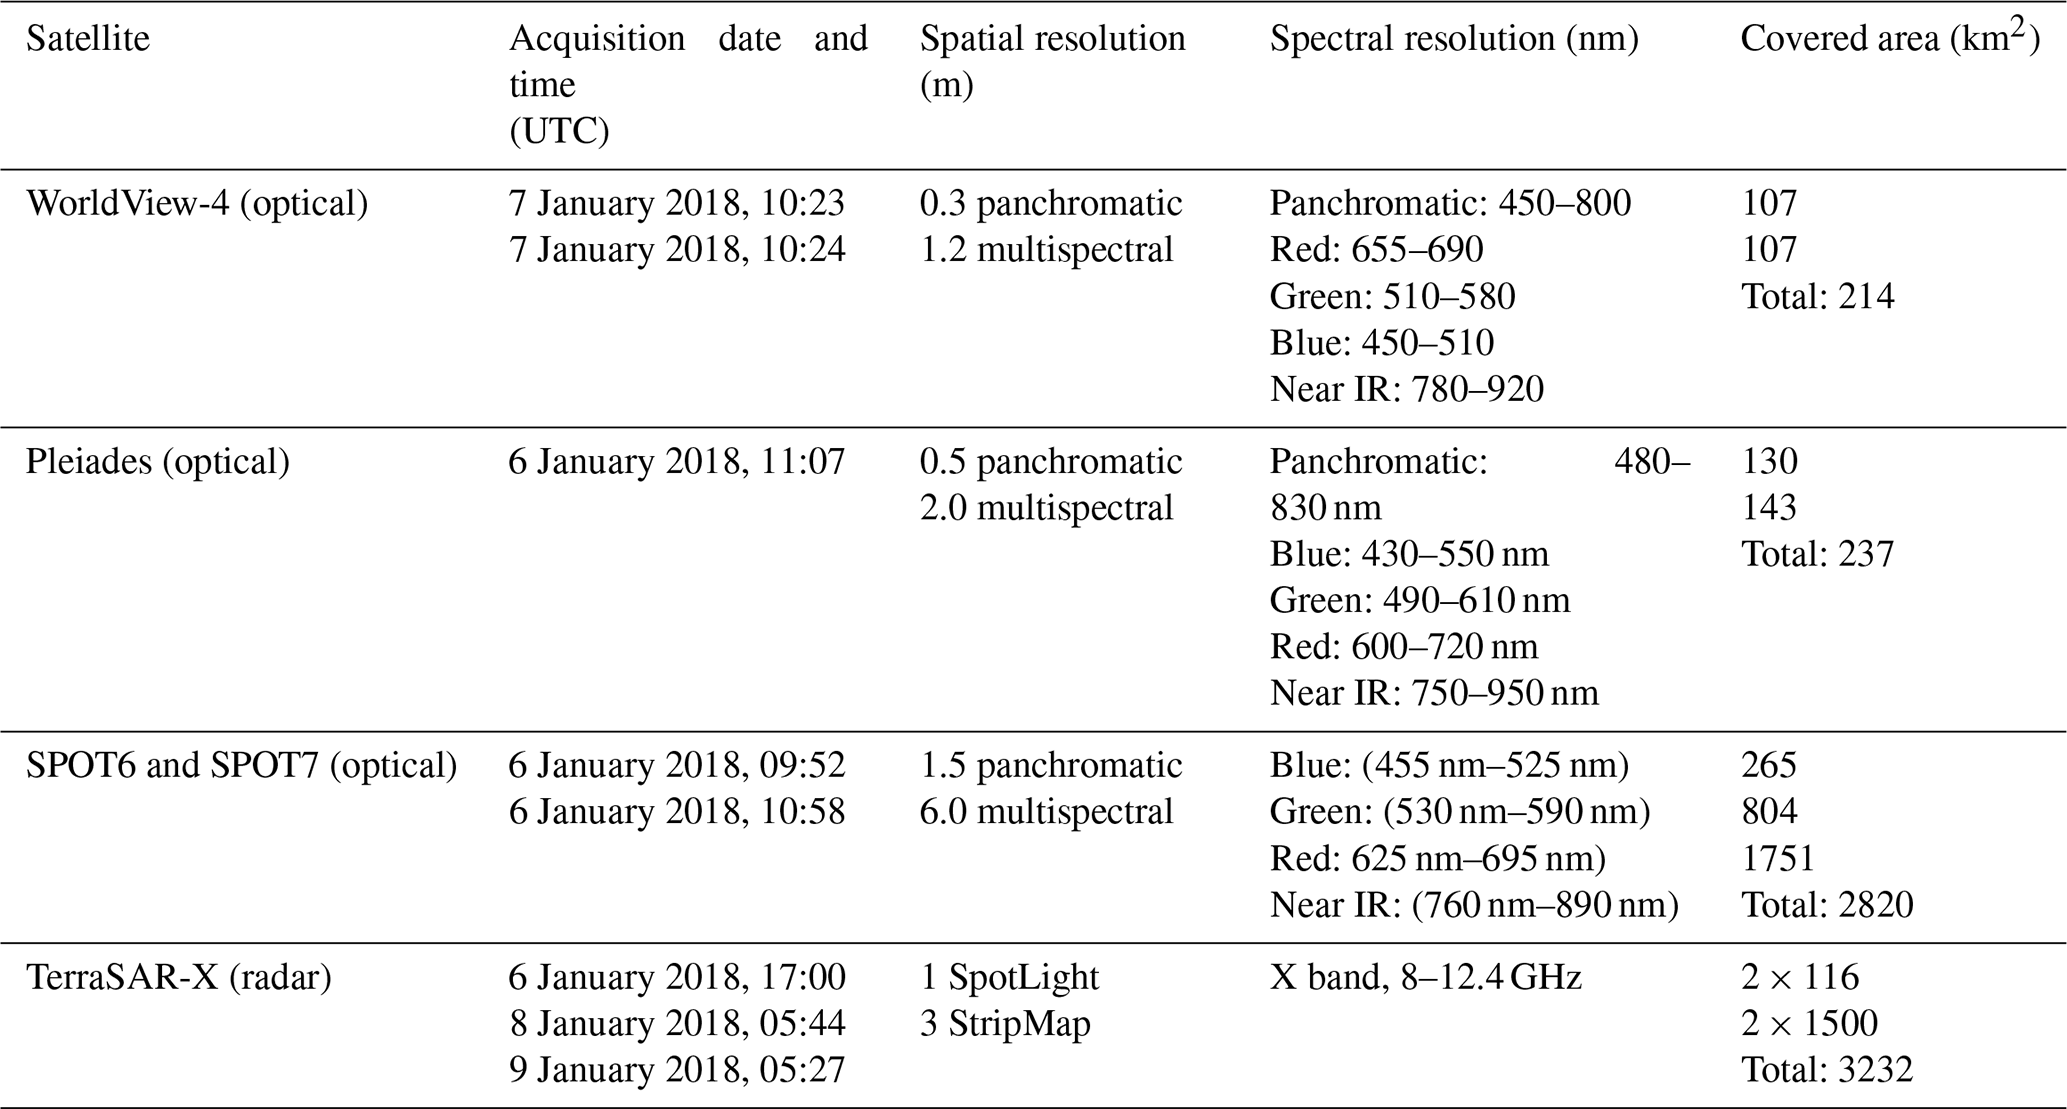
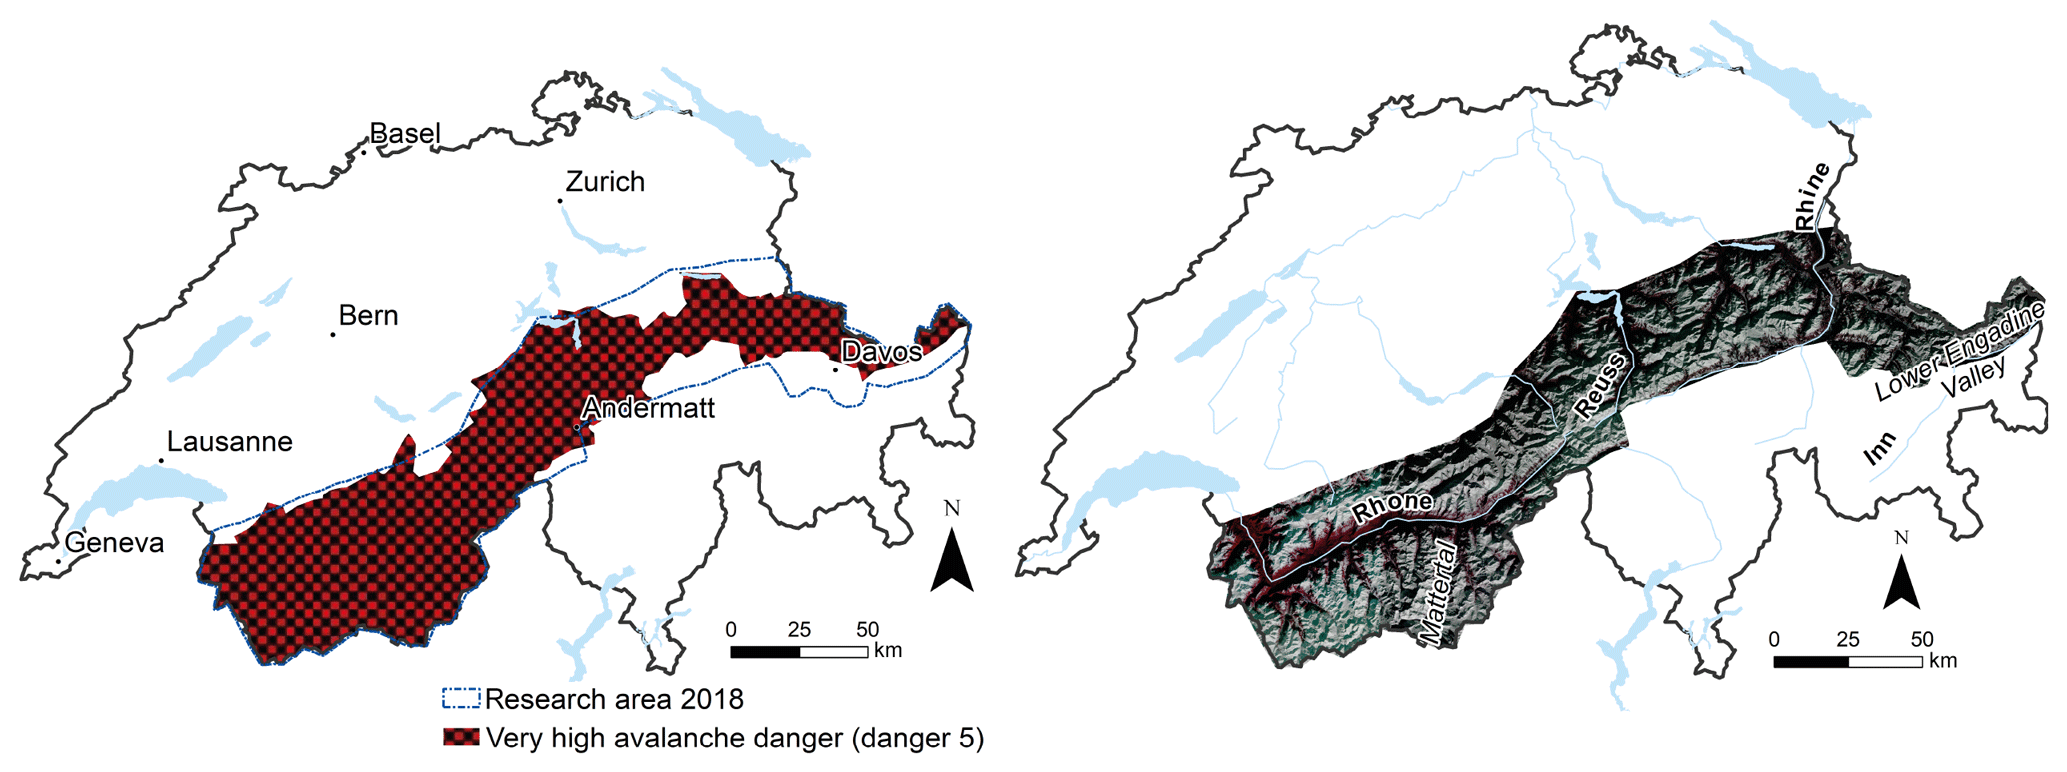
Figure 1Study area and forecasted very high avalanche danger and overview of the acquired SPOT6 dataset (SPOT6 data ©Airbus DS 2018) acquired for period II.
The period from 21 to 23 January (period II) marked the largest 3 d avalanche period in Switzerland since the avalanche winter of 1999 (SLF, 2000). All mentioned events caused the total snow depths to reach new records for that time of the year at different long-term measurement stations with measurement periods of up to 80 years (https://www.slf.ch/en/avalanche-bulletin-and-snow-situation/measured-values/description-of-automated-stations.html, last access: 25 November 2019). The night before 21 January marked the beginning of the second series of snowfall events that caused 80 cm of new snow to fall in 24 h in some areas. During the event the snow line rose up to 2000 m and dropped again quickly. Just like during the first period, snowfall was accompanied by strong winds, blowing from north to west. Hence, the accumulations that formed prior to this event continued to grow. During the second period, 60 to 150 cm of new snow fell above 2200 m. Altogether the series of snowfall events accounted for 2–3 m of new snow in southwestern Switzerland, at the northern flank of the Alps and in southeastern Switzerland, and even more fell in some locations in the central Swiss Alps. The remaining areas received between 1 and 2 m of new snow, with less snow towards the south. These amounts of snow were unusual and appear with an frequency of 15 to 30 years, depending on the region.
The snowfall combined with strong winds and the rise in snow line caused the SLF to forecast very high avalanche danger (level 5) over a large part of Switzerland during the second period (Fig. 1). During three avalanche bulletins the SLF forecasted very high avalanche danger (level 5). Many very large (size 4) and in parts extremely large avalanches (size 5) were released, causing damage to forest, landscape or infrastructure but fortunately no loss of life.
2.2 Rapid satellite data acquisition period I (8–10 January 2018)
During the first week of January, the SLF decided at an internal exceptional avalanche phase meeting that large-scale spatial information on avalanche occurrence would be very helpful. Therefore, the SLF asked the Swiss Federal Office for the Environment (FOEN) to trigger the Swiss rapid mapping chain, which is funded by the FOEN. They requested the Federal Office for Topography swisstopo to order high and very high spatial resolution satellite data over the area where danger level 5 was predicted by the SLF. The decision on what data to acquire and over which specific locations was made in close collaboration with the SLF. As it was largely unknown which sensors work best for rapid avalanche mapping, a large range of satellites were tasked for different regions (Table 1).
The time between the decision to task the satellites and acquiring the data was around 16 h. It took another 12 h until SLF had the data on their screens. For the acquisition of the optical satellite data it was crucial that a cloud-free window appeared shortly after the avalanche period. This was the case from 6 to 7 January 2018. The products were ordered with orthorectification performed by the data provider. The motivation was having fast access to products that are directly applicable for avalanche warning and avalanche documentation.
2.3 Experience gained by analyzing the data from period I (8–10 January 2018)
The first optical datasets (Pleiades, WorldView-4 and SPOT 7) were available on SLF screens less than 24 h after the satellite tasking. This is very promising and demonstrates that the rapid mapping chain works well. The first radar datasets were also available after less than 24 h after tasking. However, TerraSAR-X and can only acquire one dataset per overflight, limiting the area that can be covered within a short time period, in particular for SpotLight-mode acquisitions. Therefore, the next TerraSAR-X datasets were acquired on 8 and 9 January. As snow avalanche deposits and in particular release zones can degrade quickly after avalanche release due to wind, new snow and melting, this is a drawback.
The optical datasets acquired over western Switzerland were nearly cloud-free; the imagery acquired over central and eastern Switzerland had cloud cover from 70 % to 95 %. The georeferencing performed by the data provider of the very high resolution imagery (Pleiades and WorldView-4) was clearly insufficient. Also, the orthorectification of the SPOT7 imagery was insufficient for avalanche documentation, having large shifts and distortions. A main conclusion is that the orthorectification has to be performed manually with an accurate digital elevation model (DEM). The Shuttle Radar Topography Mission (SRTM) applied by the data providers is insufficient in complex alpine topography. Consequently the datasets were oriented using bundle block adjustment and orthorectified by swisstopo based on its high-quality DEM swissALTI3D with a spatial resolution of 2 m, which is available for the entire country of Switzerland (swisstopo, 2018). The results of this orthorectification were substantially better, achieving a localization accuracy of more than 2 m in X and Y. Even though the spatial resolution of the SPOT6 (1.5 m) is coarser than the resolution of Pleiades and WorldView (0.5 m) the avalanche deposits and release zones are very visible. Due to the 12 bit radiometric resolution, also areas in the shade can be evaluated. A strong advantage of SPOT6 and SPOT7 is that very large areas can be covered during one overpass of the satellite. Therefore SPOT6 and SPOT7 is the platform of choice for future data acquisitions if a cloud-free weather window is available close to the occurrence of the avalanche period. However, if a distinct and spatially limited hotspot (∼ 250 km2) of avalanche activity can be identified in advance, very high spatial resolution sensors such as Pleiades and WorldView could provide even more detailed information on avalanche release and deposit.
By analyzing the value of the TerraSAR-X data for rapid avalanche mapping, it was concluded that the interpretation of the data is too demanding in the short term, and avalanche events are not clearly visible without advanced data preprocessing. More research is needed to evaluate possible filtering and imagery enhancements for these data. Furthermore, large regions within the steep avalanche terrain are not analyzable due to radar shadow and layover. Based on these findings TerraSAR-X data will not be ordered even though high spatial resolution radar data would be the only option for time periods where no cloud-free weather window appears. However, the potential of radar data will be further investigated and compared to the results from Sentinel-1 data published by Eckerstorfer et al. (2017, 2016), Vickers et al. (2016) and Wesselink et al. (2017).
2.4 Rapid satellite data acquisition period II (21–23 January 2018)
Based on the conclusions drawn in Sect. 2.3, it was decided to only acquire SPOT6 and SPOT7 data for avalanche period II, as a cloud-free weather period was predicted for 24 January 2018 over the entire country of Switzerland. swisstopo ordered a tasking of SPOT6 for 24 January 2018 on 23 January 16:35 (local time). The data were then acquired on 24 January 2018 at 11:04 (local time) over an area of approximately 12 500 km2 across Switzerland and a part of Liechtenstein, with a maximum extension of 300 km from the west to the east (Fig. 1).
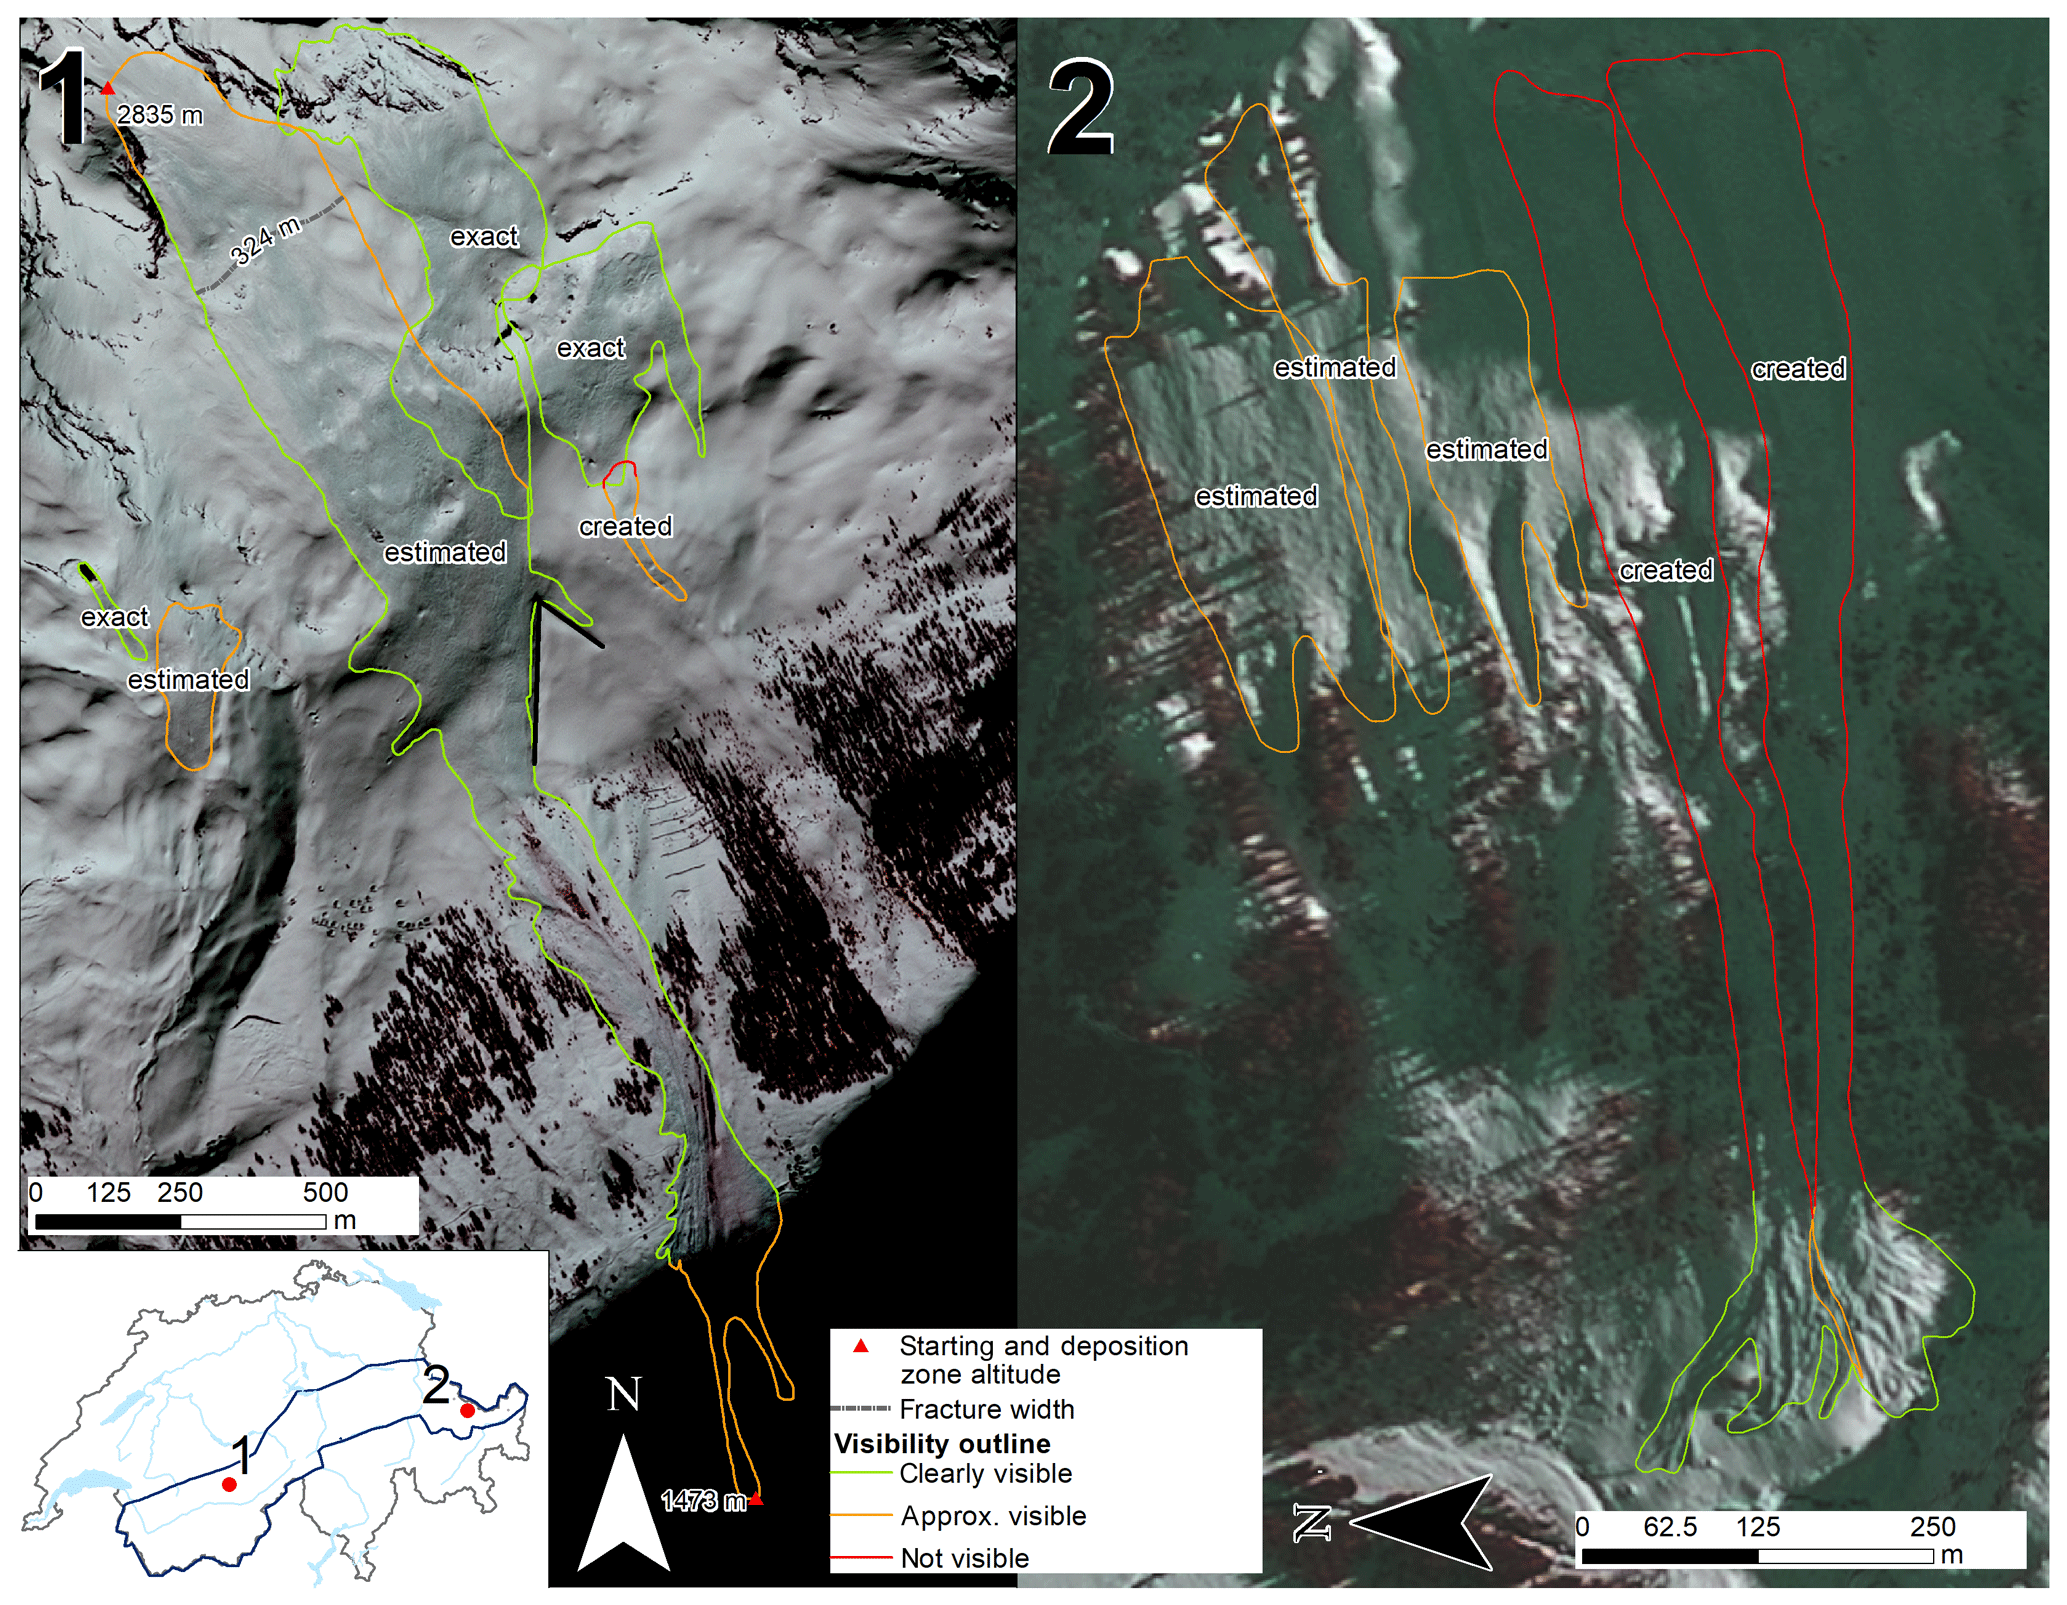
Figure 2Examples of mapped avalanches in imagery optimized for brightly illuminated areas (1) and for regions with shaded areas (2). The colors of the outline indicate the visibility of different sections and the resulting attribute “quality outline” for each avalanche. The visibility tends to be poorer for areas in the shade. For the largest avalanche in (1), the “position of measurement” of the height of start and deposition altitude are shown as well as the origin and length of fracture width (see Table 2 for definition of those attributes). A deflection dam that worked well by changing the flow path of the avalanche is marked as a black line in (1). Overlapping avalanche area, as in (1), is determined by interpretation of the flow direction from the topographic map and by differences in contrast between different depositions. (SPOT6 data © Airbus DS 2018).
Based on the former experiences, orthorectification should be done manually, for example, by swisstopo. The product to be delivered by the data provider therefore had to be of the “Primary” type, with full radiometric resolution (12 bit) having already been pan sharpened. The data were oriented using bundle block adjustment within a photogrammetric block file. Besides automated tie-point extraction, a number of 11 ground control points (GCPs) were digitized manually. The achieved accuracy (RMSE) of the GCPs was of 1.23 m in X, 0.83 m in Y and 0.16 m in Z.
The data were then delivered to SLF on 6 February in the early morning. SLF started the satellite data interpretation immediately. At the end of the avalanche period there was additional snowfall of about 0.3 m and strong winds that made avalanche detection in the optical imagery more difficult.
We used visual interpretation to identify and digitize avalanches as polygons over the whole study area. To improve visibility in both illuminated and shaded areas, we modified contrast and brightness and used image stretching and gamma optimization. Since the optimal brightness and contrast vary for different types of illumination, we digitized the outlines in the sun and the shaded areas separately (Fig. 2). Due to the lower reflectance of snow in the near-infrared spectrum (Warren, 1982), the false color band combination NIR (green, red and near-infrared bands) provides a clearly better visibility of the avalanches then the normal red–green–blue (RGB) band combination. Additionally, the vegetation in forested areas and at the bottom of avalanche release zones is also more visible in the NIR combination than in RGB. Therefore, we only used NIR band combination for the mapping.
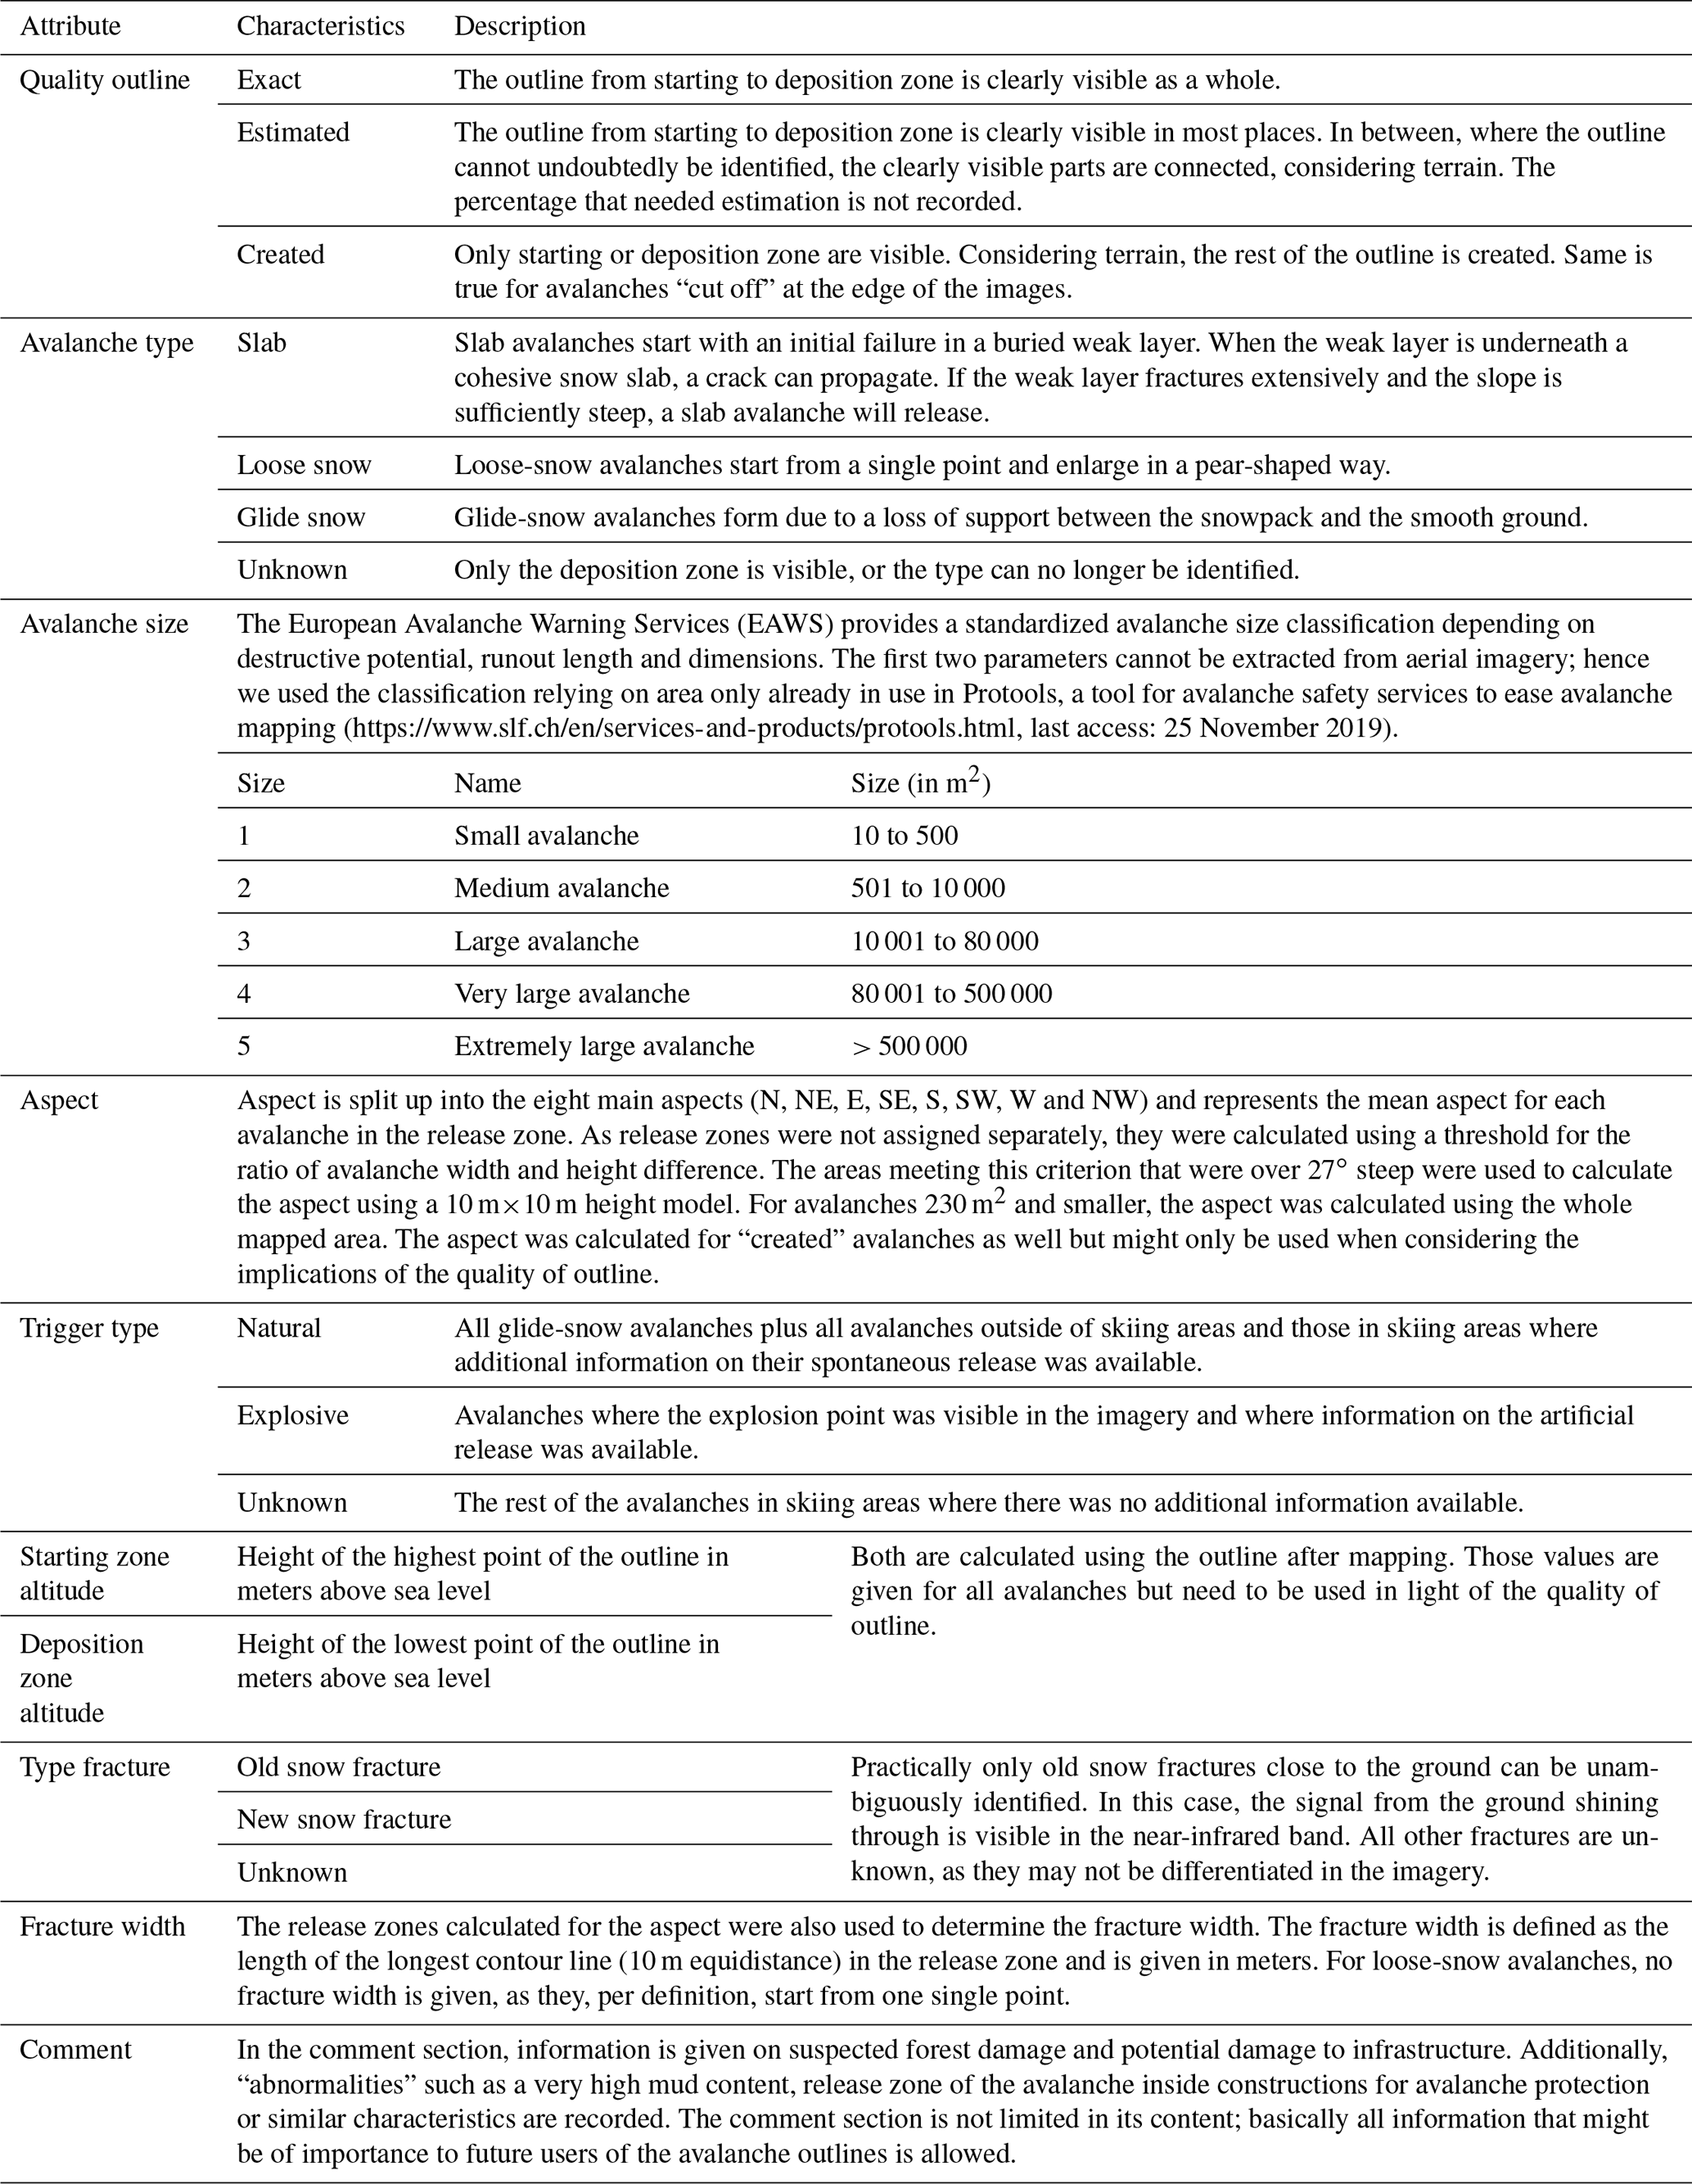
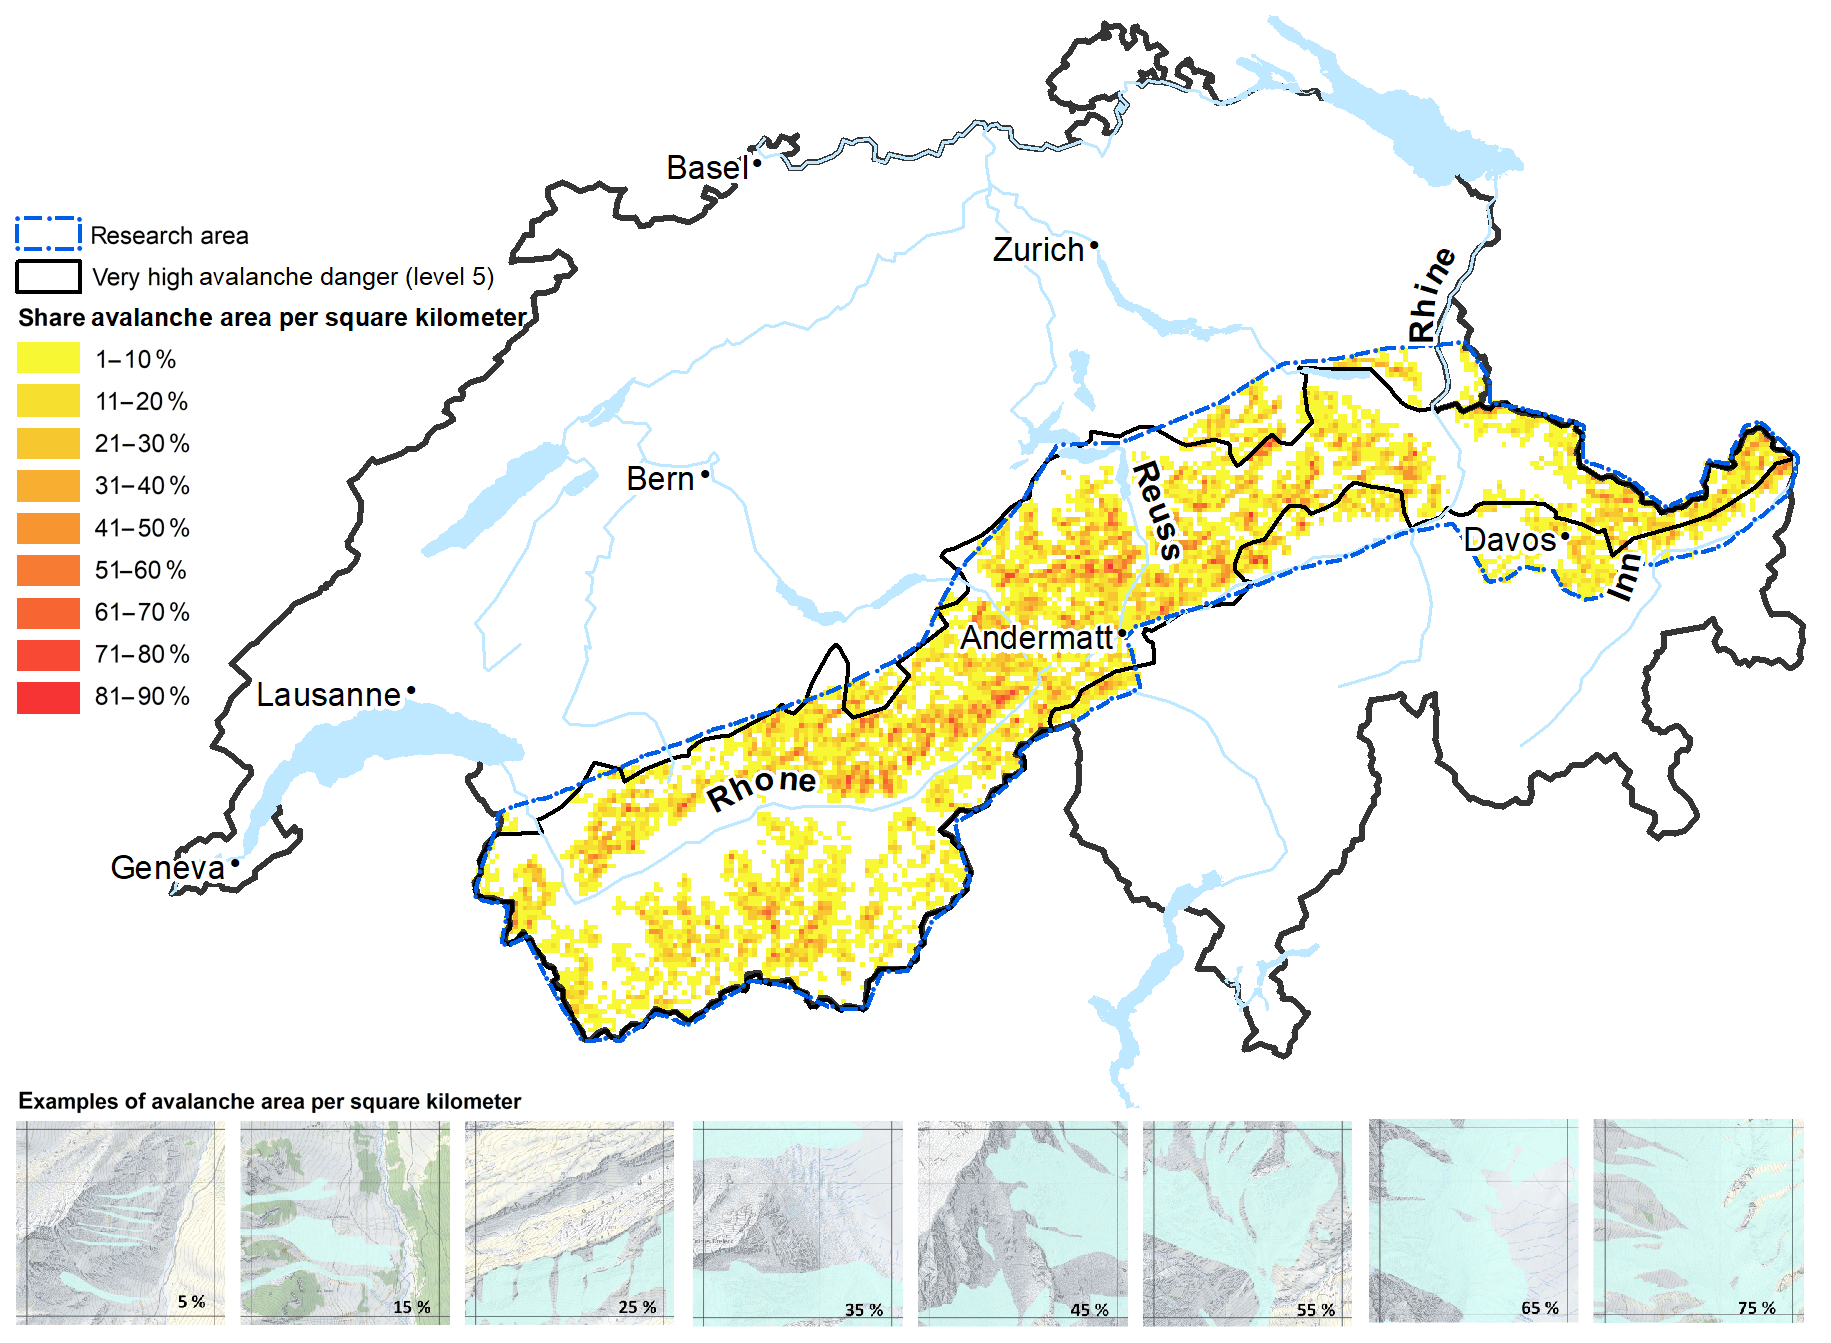
Figure 3Avalanche density per square kilometer. Pixmap © 2019 swisstopo (5 704 000 000), reproduced by permission of swisstopo (JA100118).
To perform a systematic mapping, the images were overlaid with a grid of 1.3 km×1.3 km. As additional information during interpretation, we used the 1 : 25 000 Swiss Map Raster 25, the summer orthophoto mosaic SWISSIMAGE 25 cm as well as the layer “Slope over 30 degrees” (all from swisstopo). The mapping itself was conducted manually by one person using a scale of 1 : 5000. Additional data were blended in and out or swiped. After the initial mapping, the outlines were checked twice, first using the 1 : 25 000 map to visually check flow direction and then using the satellite imagery for rechecking the outlines and their completeness with different display parameters optimized once for areas in the shade and once brightly illuminated regions.
In order to keep all information that can be extracted from the images besides the outlines, we previously defined an example key. It serves as a guide on how to record the metadata for each avalanche outline mapped with the presented method. In addition to a verbal description it includes illustrated examples wherever possible. Part of the attributes like the quality of outline or avalanche type need to be identified by the interpreter, whereas avalanche size can be calculated later from the mapped polygons. The defined attributes are listed in Table 2. The mapping itself was conducted in ArcGIS using “streaming” to map the outlines more easily, as it allows tracing an outline without clicking every single vertex with the mouse. To remove the trembling effects of moving the mouse, a smoothing algorithm was applied in the end. To simplify the assignment of the attributes we build a geodatabase and implemented the characteristics as coded values.
In total we mapped 18 737 individual avalanche outlines with an area of 936 km2 (Hafner and Bühler, 2019). This accounts for 7.5 % of the total study area covered by satellite imagery. A selection of examples showing different illumination conditions and the attached attributes are depicted in Fig. 2.
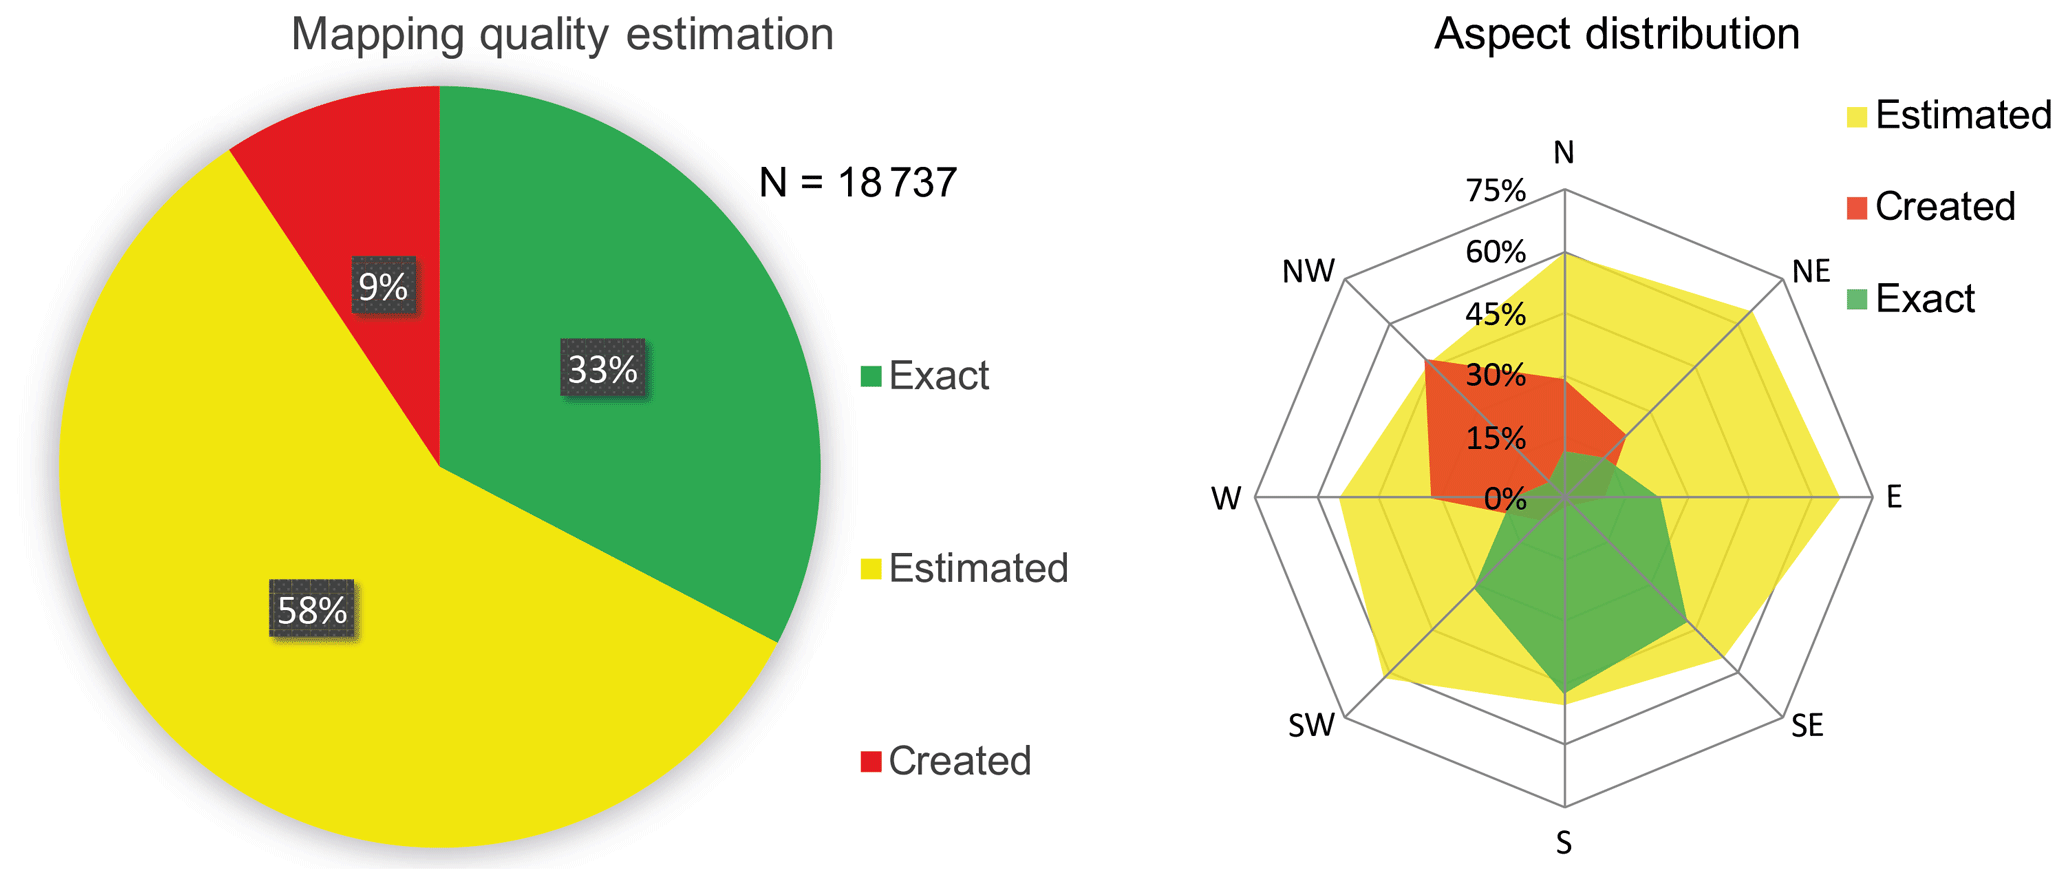
Figure 4Mapping quality estimation and its aspect based on the classes described in Table 2.
The 18 737 avalanches are not equally distributed over the whole study area. Visualizing the avalanche area as shares of 1 km×1 km grid cells reveals where a high density of avalanche activity is present (Fig. 3). In some regions, the high density had been suspected, as observers had reported at least a fraction of the avalanches. In other regions there is hardly any human activity in January, and therefore no avalanche activity information was available. Clearly visible in the map are also the effects of the high snow line (partly up to 2000 m) – in the Rhône, the Alpine Rhine Valley and parts of the Reuss Valley where there were no avalanches close to the valley bottom.
Out of the avalanches, 33 % could be mapped with exact outlines, 58 % could be mapped with partially estimated outlines and for 9 % we had to create parts of the outline (Fig. 4) by expert interpretation. The number of created outlines is highest in the aspects from north to west (Fig. 4). In the opposite aspects we mapped the highest percentage of exact outlines. With an approximate sun altitude of 15∘ and an azimuth of 141∘ (see http://suncalc.org, last access: 25 November 2019, for 24 January, 10:00 LT, Andermatt) during data acquisition, most shaded areas in the satellite images are expected to be opposite of the sun. These shaded areas coincide with the largest share of created avalanches (Fig. 4), caused by poorer visibility in the shaded areas and clearly better visibility in illuminated areas. The estimated outlines do not show a strong variation with aspect, indicating the lack of such a correlation. The avalanches we could map with an exact quality outline tend to be smaller than the ones that were estimated or created. Estimated and created outlines occur for avalanches of all sizes but more frequently within avalanches of bigger size.
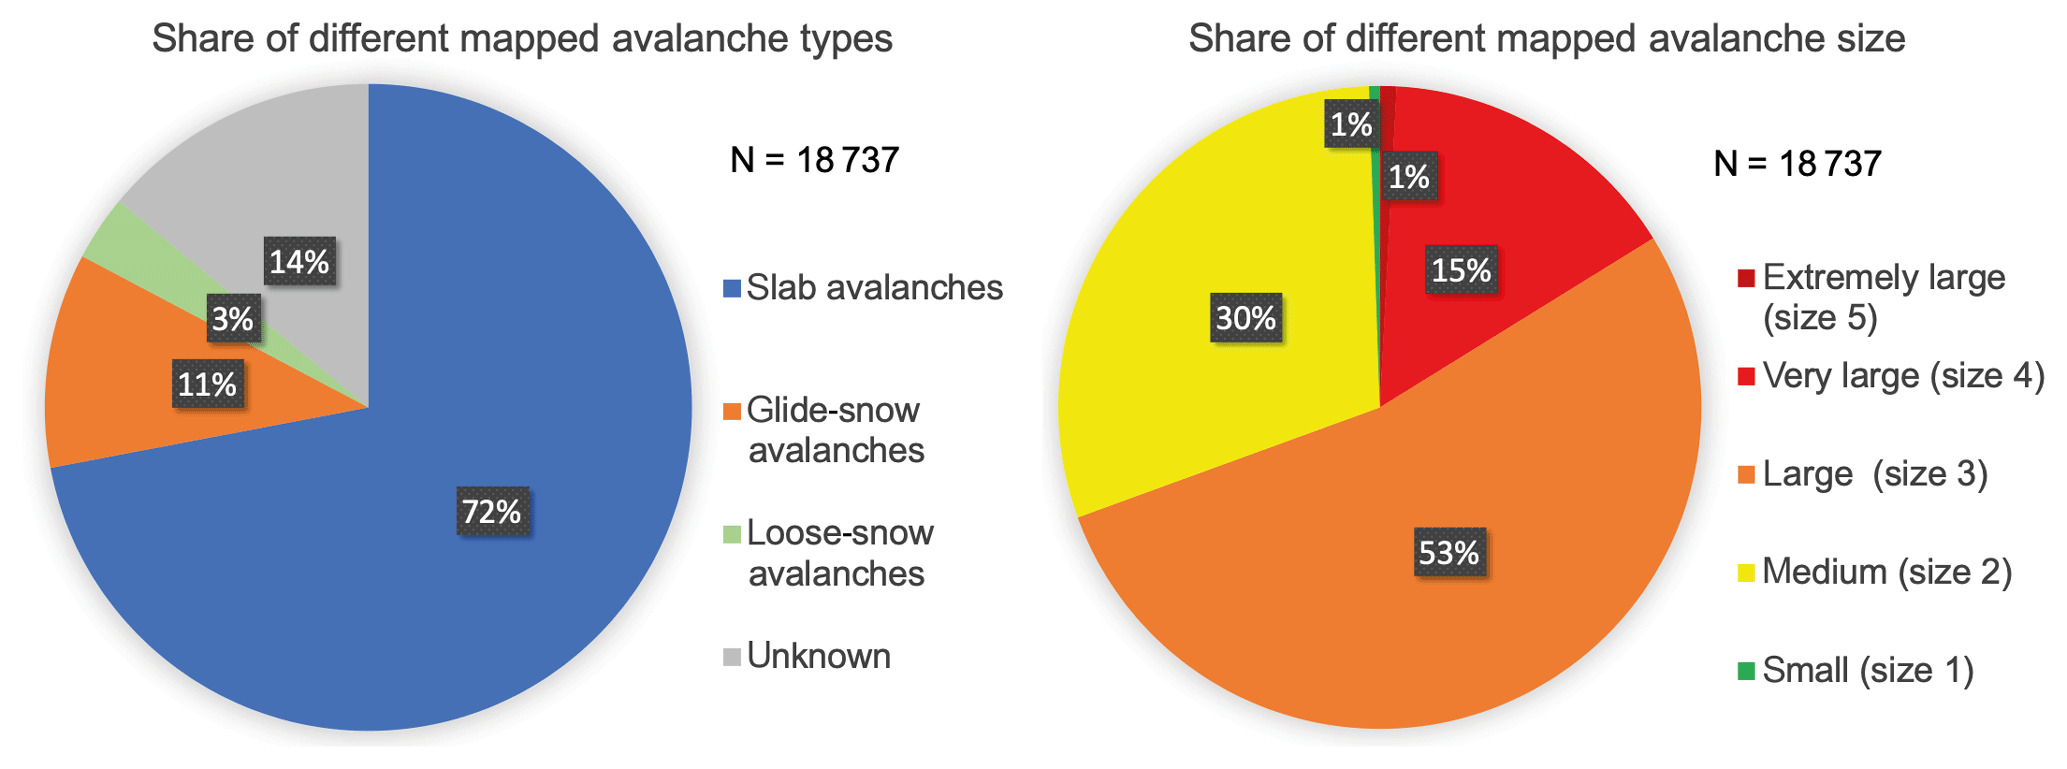
With 72 %, the majority of avalanches mapped were slab avalanches (Fig. 4). The share of glide-snow and loose-snow avalanches is 11 % and 3 % respectively. For the rest of the avalanches, the type could not be identified either because the outline had to be created in the starting zone or because wind, snowfall and melting between avalanche release and data acquisition had made the identification of avalanche type impossible.
Avalanche size is one of the attributes that can be calculated after mapping (Table 2). The biggest amount of avalanches by far are large-sized avalanches (size 3), followed by medium-sized avalanches (size 2; Fig. 5). This is expected for very high avalanche danger levels. Additionally, multiple very large and extremely large avalanches (size 4 and 5) occurred.
Ninety-one percent of size 1 (small) avalanches are glide-snow avalanches, which are very visible in satellite imagery because of the contrast between the exposed ground and the surrounding snow, in particular within the near infrared band. The smallest slab avalanche we could identify had an area of 415 m2 and is therefore a rather large size 1 (small) avalanche (Table 2). The spatial resolution of 1.5 m is at the limit of identifying smaller (size 1) avalanches. Since the size 1 avalanches are of least interest in a large avalanche period, this limitation is of minor importance.
4.1 Age of the mapped avalanches
While mapping, we found several avalanches that were already released prior to the second avalanche period. In order to understand the dimensions of this problem and to estimate how many avalanches are old ones, we used the SPOT6 and SPOT7 images taken for testing purposes after avalanche period I (Sect. 2.2). We chose two test areas – the Mattertal and part of the Lower Engadine valley – making up 5 % of the total study area.
In those test areas we investigated how long the avalanches remain visible. For the Mattertal, we used images from 6, 12 and 24 January 2018, and in the Lower Engadine valley, we used images from 8 and 24 January 2018. For each point in time we classified the avalanches mapped from 24 January imagery in terms of whether they had been released before avalanche period II, as shown in Table 3. In total, we classified the visibility of 550 different avalanches for all images taken before 24 January.
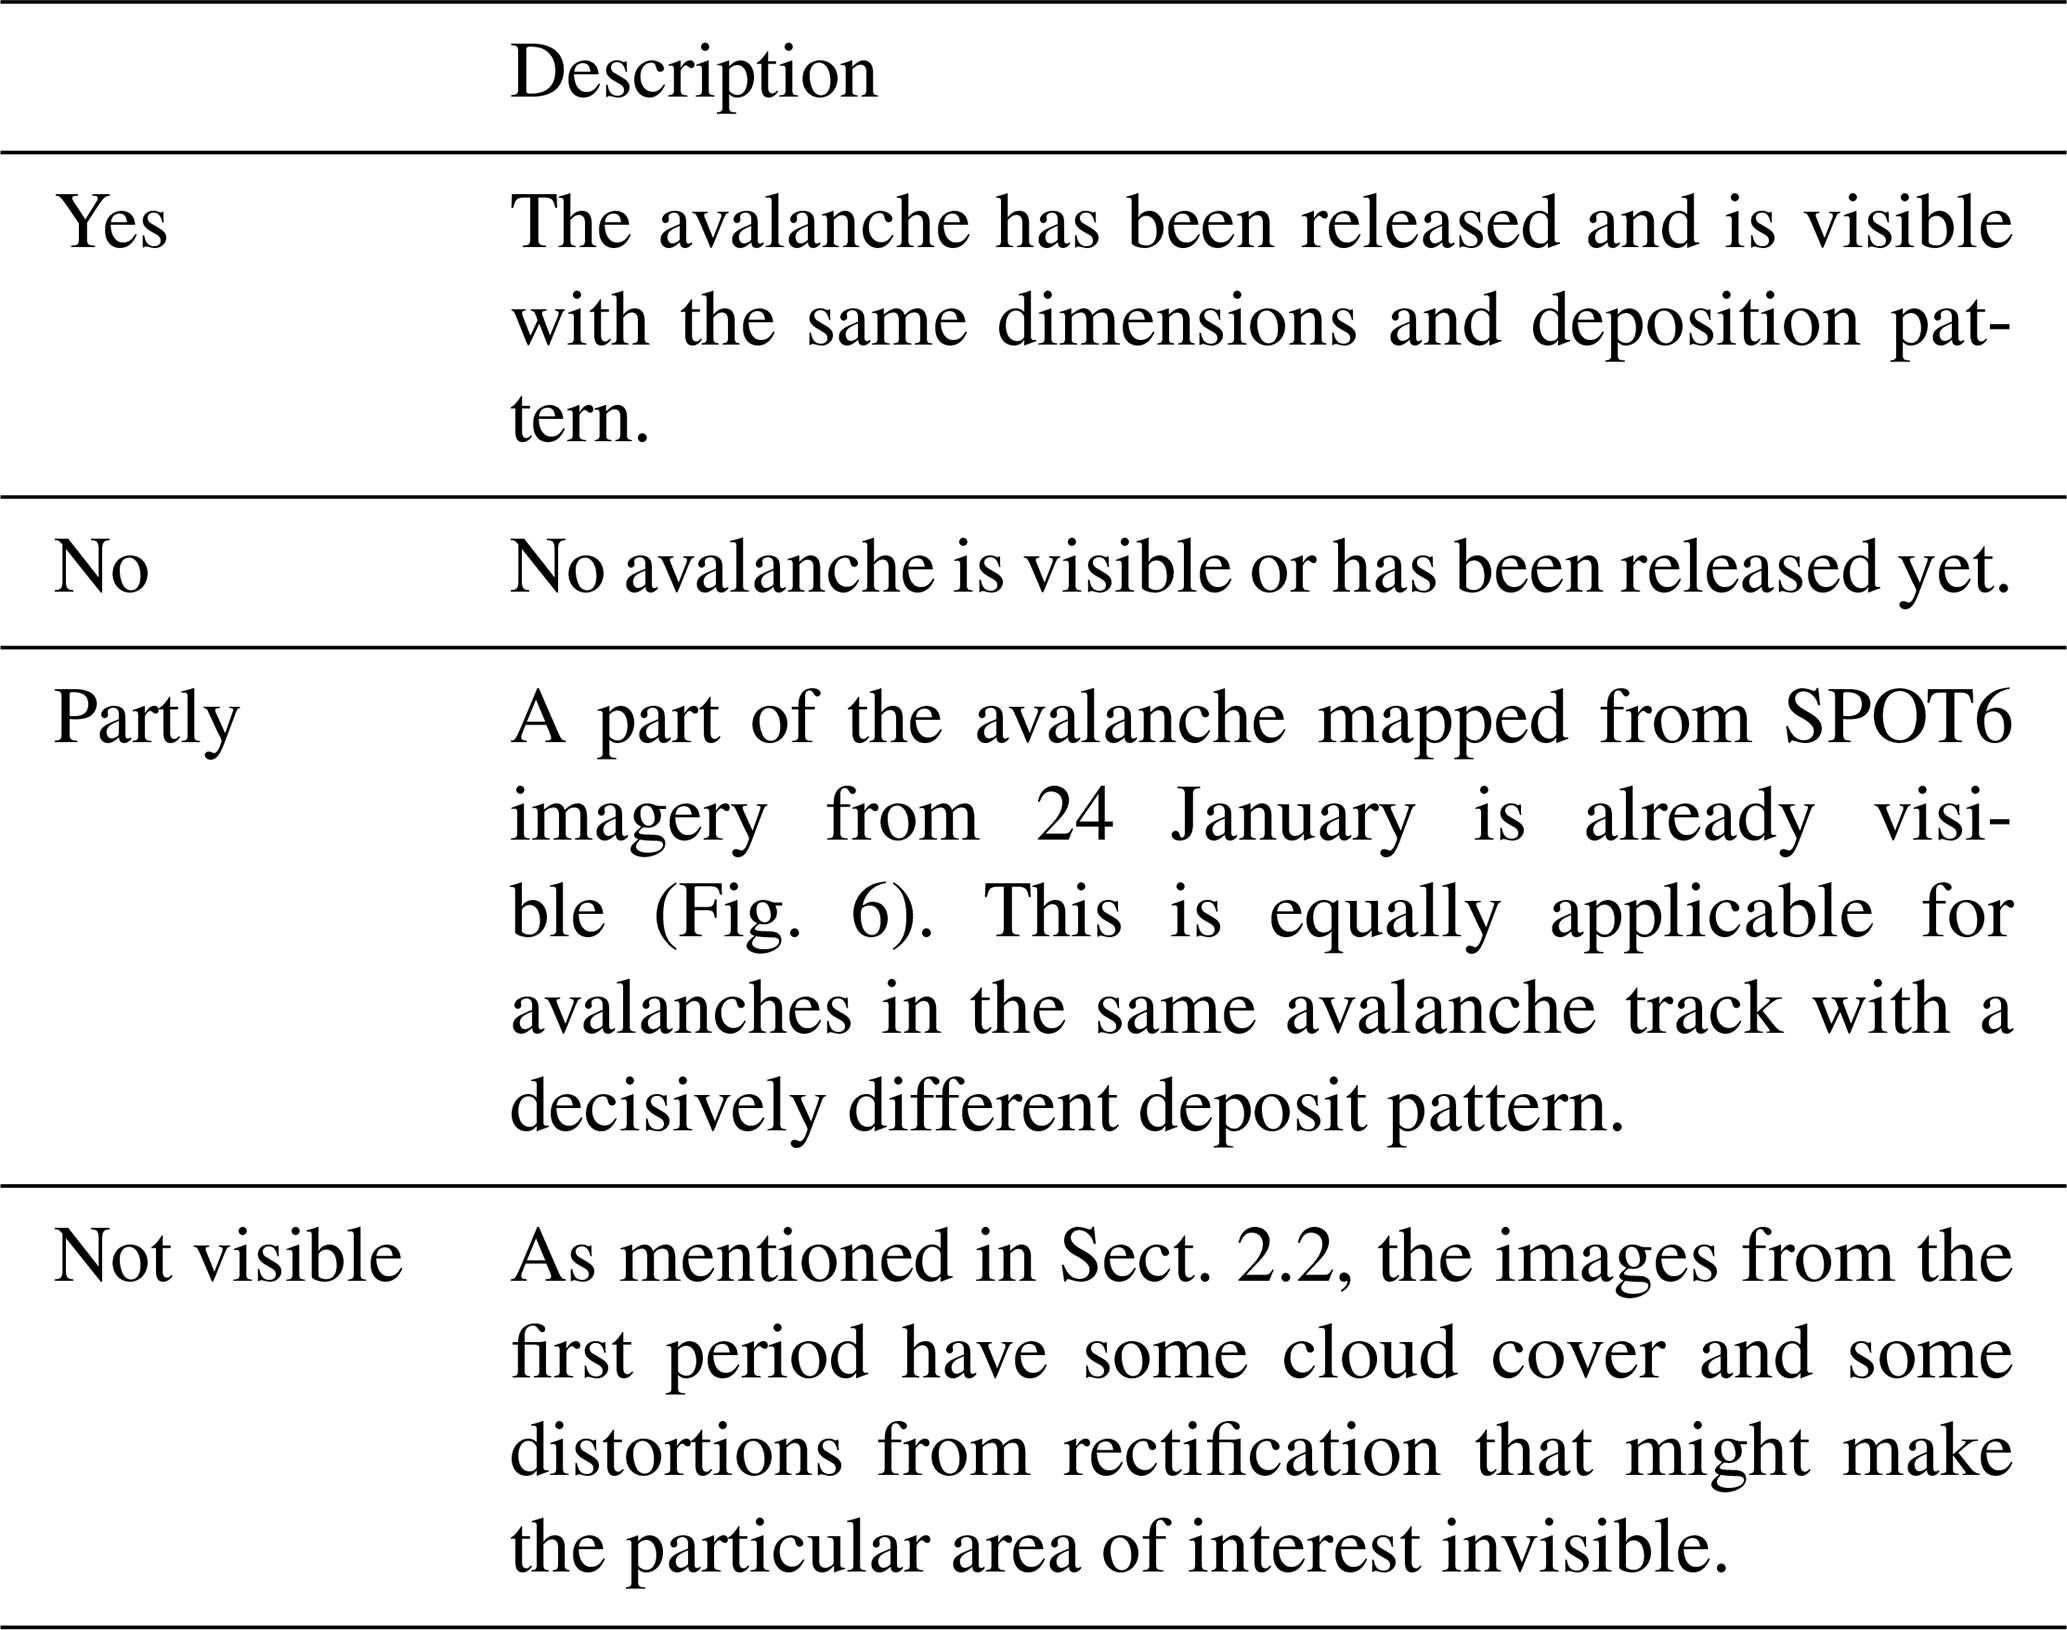
In the Mattertal we found that 22 % of the mapped avalanches had already been released completely before 12 January (Yes) and that 12 % were even visible in the images from 6 January (Yes again). In the Lower Engadine valley we identified 20 % of the avalanches already in the image from 8 January (Yes). Additionally, between 16 % (Lower Engadine valley) and 25 % (Mattertal) of the avalanches were partly released before the second avalanche period (Partly).
These numbers may not be transferred directly to the whole dataset, since both test sites had very strong avalanche activity during the first period. This was not the case for the majority of the study area. Therefore, 25 % of old avalanches can be taken as an upper-limit value. For the whole dataset, we estimate 10 %–20 % of the avalanches mapped to have originated before avalanche period II (21–23 January). Additionally, we found that large avalanches remain visible longer. The oldest avalanches (released on 6 January or earlier) show the highest percentage of avalanches with an area larger than 10 000 m2 (92 %). This number is decreasing to 78 % for the more recent avalanches from avalanche period II. This is expected for larger deposits, as it takes more time for them to melt and more snow to cover their rough surface structure until they are invisible.
We conclude that avalanches seem to be visible for a longer period of time on satellite imagery than we expected (especially after heavy snowfall like in our case). This is an important finding for future avalanche-mapping campaigns. Firstly, this is because the fear of “missing” very large and extremely large avalanches from the beginning of an avalanche period that is several days long seems to be unfounded. Secondly, especially later in winter, the high percentage of older avalanches visible might make it hard to differentiate different avalanche periods. In those cases, it would be valuable to have additional pre-event satellite data that may exist in satellite databases. In any case it makes sense to check pre-event imagery from continuously operating satellites such as Sentinel-2 or Landsat. Even though their spatial resolutions are coarser (10–30 m), very large and extremely large avalanches could be identified.
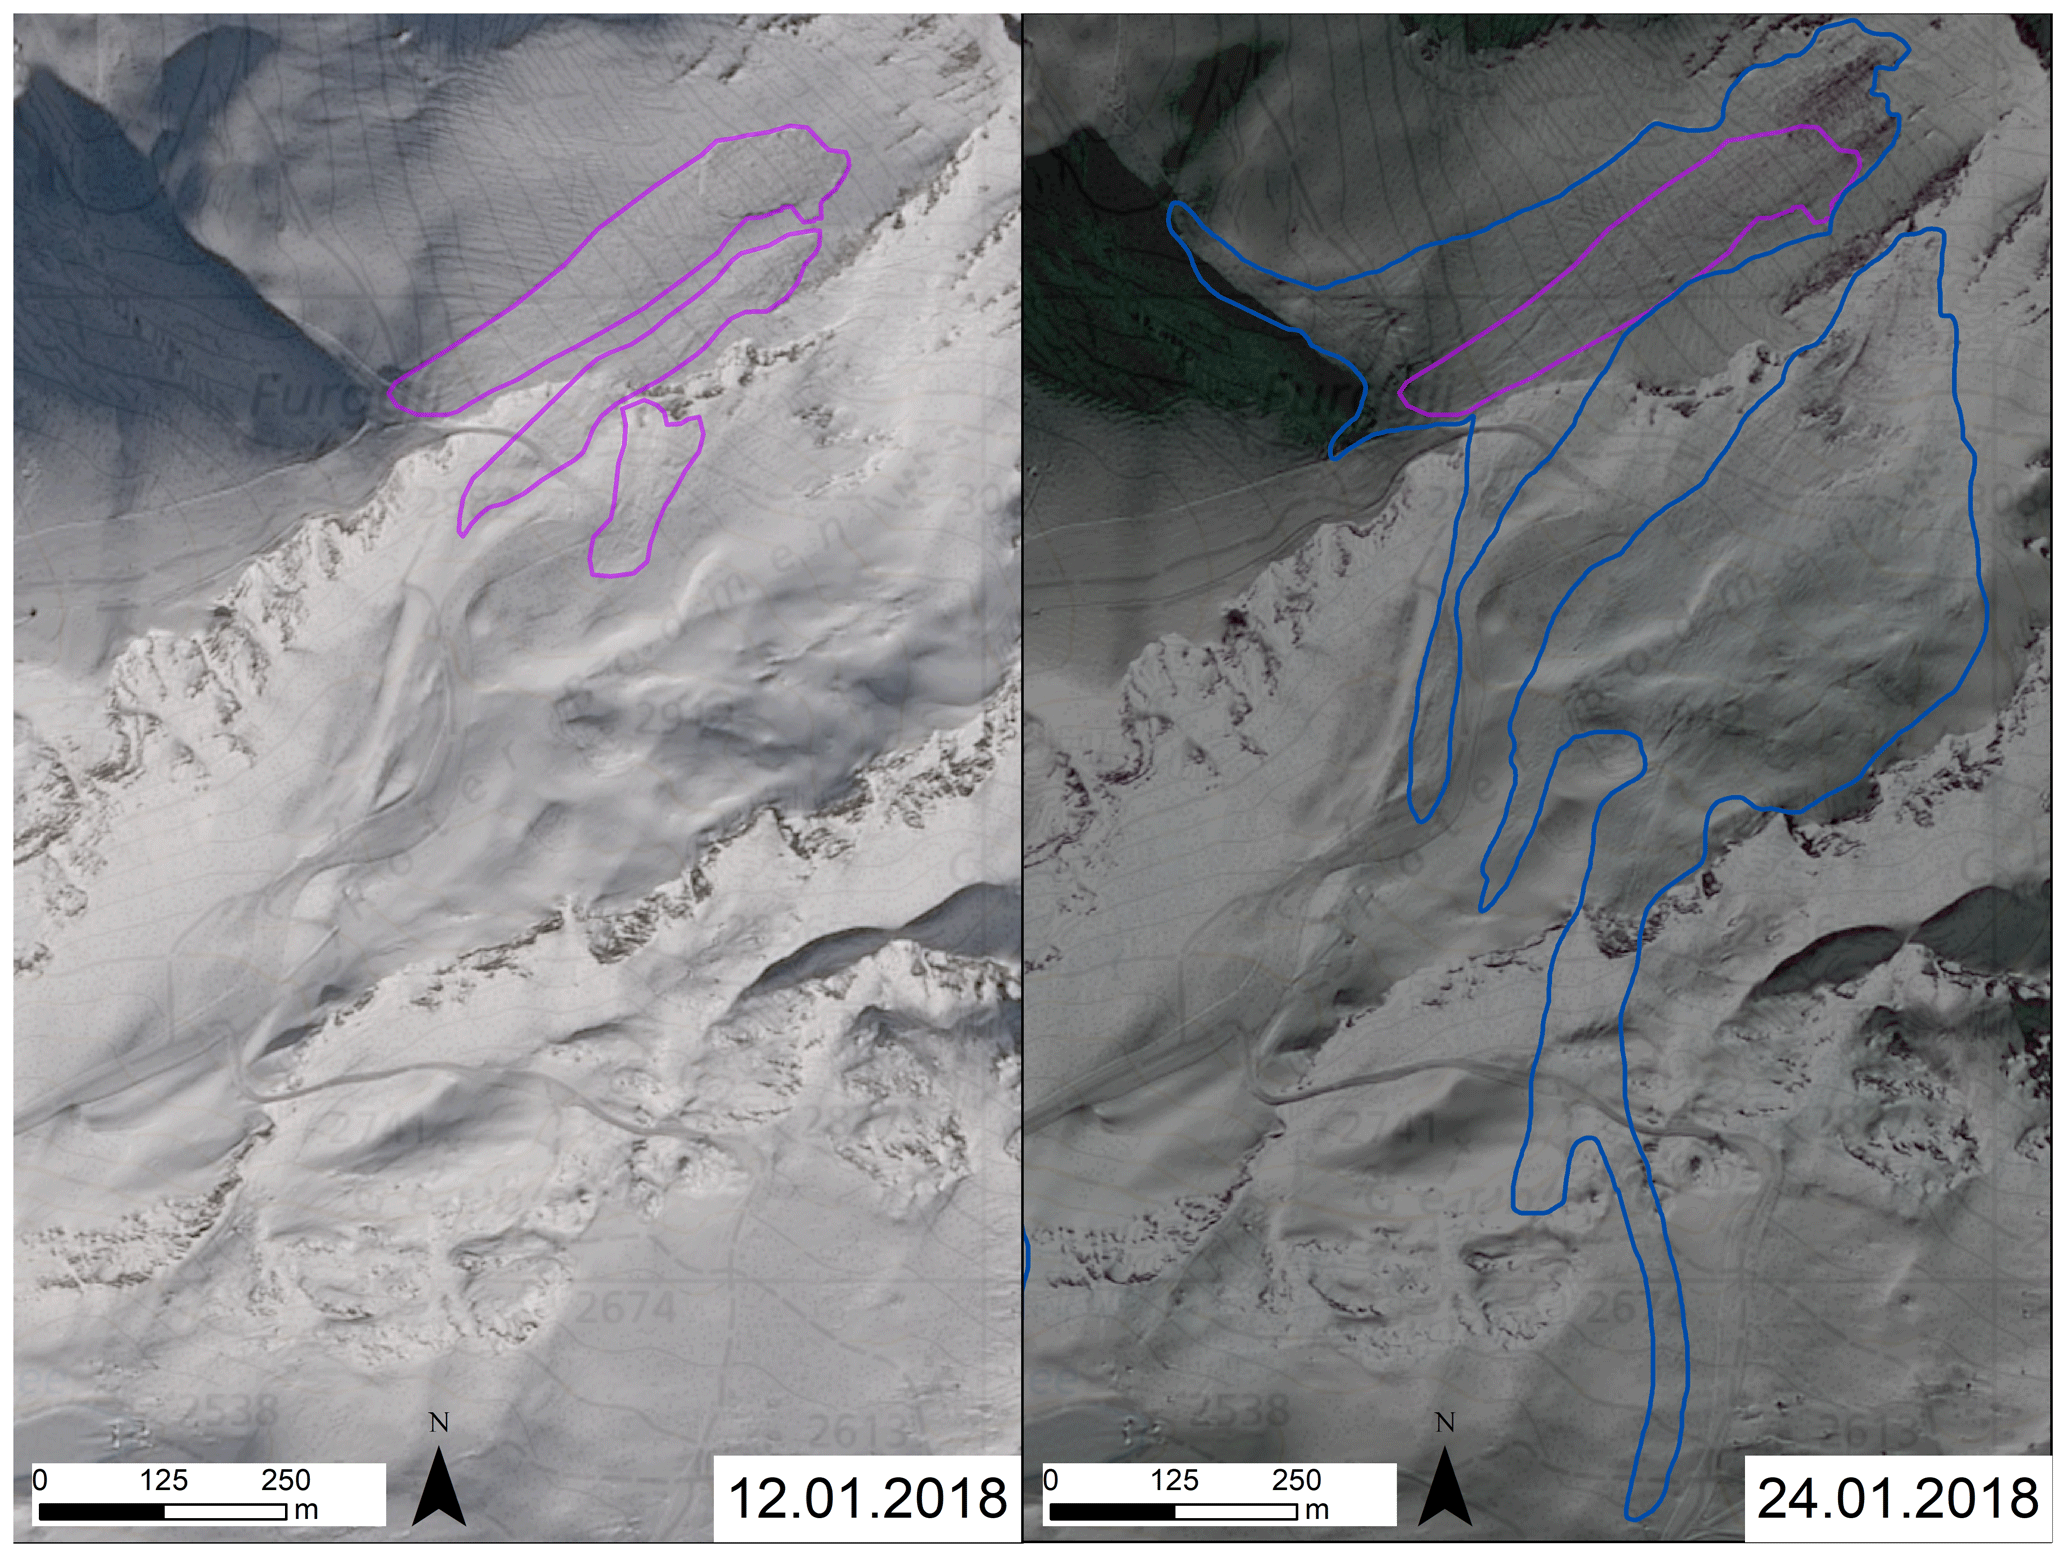
Figure 6SPOT6 images from 12 and 24 January from close to Oberrothorn, VS (SPOT6 data © Airbus DS 2018). The purple avalanche outlines are those visible in the imagery acquired first (left). One of these avalanche outlines is still visible after the second avalanche period 12 d later (right). The blue outlines were released during the second avalanche period. Pixmap © 2019 swisstopo (5 704 000 000), reproduced with permission of swisstopo (JA100118).
4.2 Validation approaches
For validation we were confronted with the difficulty of finding a meaningful dataset for such an extensive mapping campaign. At the SLF, avalanches in the region of Davos are mapped systematically over the whole winter from photographs taken in the field. Unfortunately, the quality of outlines generated with this technique only allows for a comparison of methods and not for a real validation. A first comparison, using clearly visible avalanches from SPOT6 imagery, indicates that the satellite-based mapping approach identified many more avalanches than the manual mapping approach. Therefore, a meaningful quantitative assessment based on this reference data is not possible.
Therefore, we decided to use the WSL monoplotting tool (Bozzini et al., 2013, 2012) to digitize validation imagery acquired from helicopters on 24 January 2018. This tool allows for georeferencing and orthorectifying of photographs in order to produce georeferenced vector data by drawing directly on the pictures and exporting the vector data for use in GIS systems. In order to georeference photographs with the monoplotting tool, control points (CPs) and a DEM are needed. We applied the 2 m resolution swissALTI3D from swisstopo, which has a nominal accuracy of 0.5 m below the treeline (∼ 2100 m a.s.l.) and 1–3 m above the treeline (swisstopo, 2018). Due to the lack of clearly identifiable features within avalanche terrain, we often had to use trees and rocks as CPs. This reduces the accuracy of rectification, as they are hard to identify exactly in orthoimagery. Hence, we specified that the maximum error had to be under 5 m and the mean error under 3 m for each picture we used for validation in order to keep the distortion through validation data as small as possible. Applying this restriction, 13 avalanches were mapped in full or in part from suitable helicopter images. By overlaying these outlines with those mapped from the satellite images (outline quality exact or estimated only), we were able to calculate a trend in accuracy for the mapped avalanche area (Fig. 7).
The overall accuracy for the mapped area is 73 %, with an omission and commission error of 16 % and 11 % respectively (Table 4). In illuminated terrain, we achieved a decisively better overall accuracy (80 %) than in shaded areas (64 %). The omission error, i.e., the avalanche area we missed, is especially higher in shaded areas (25 %). This confirms our impression that the correct identification of avalanche outlines in shaded terrain is more difficult than in illuminated areas. This approach can only validate the mapping accuracy for the avalanche surface area and not the number of avalanches we missed or we falsely mapped. No reliable ground truth dataset exists for such a validation.
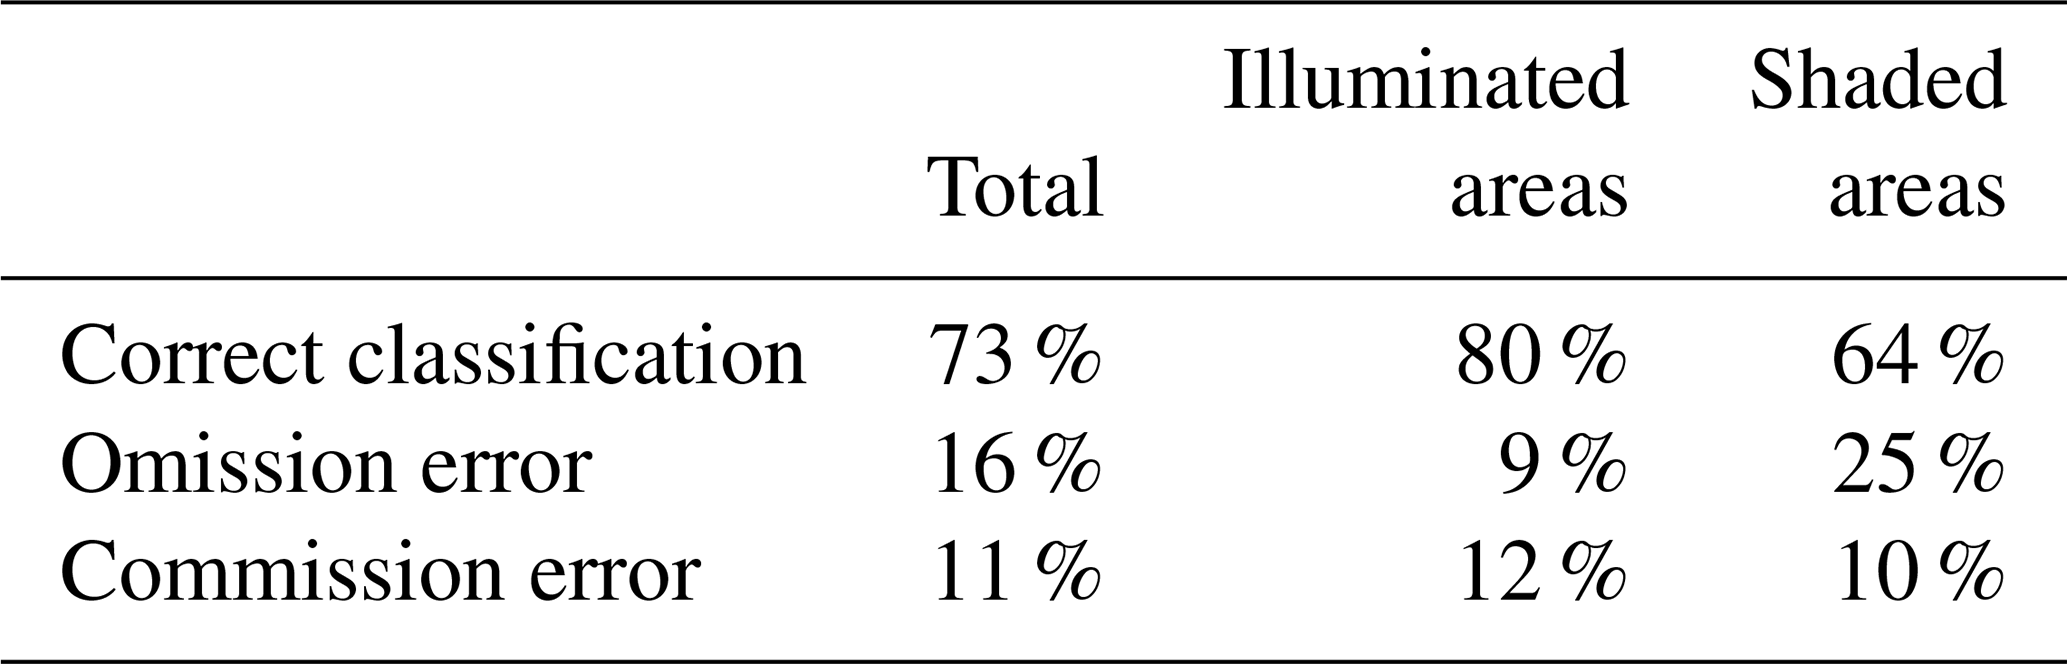
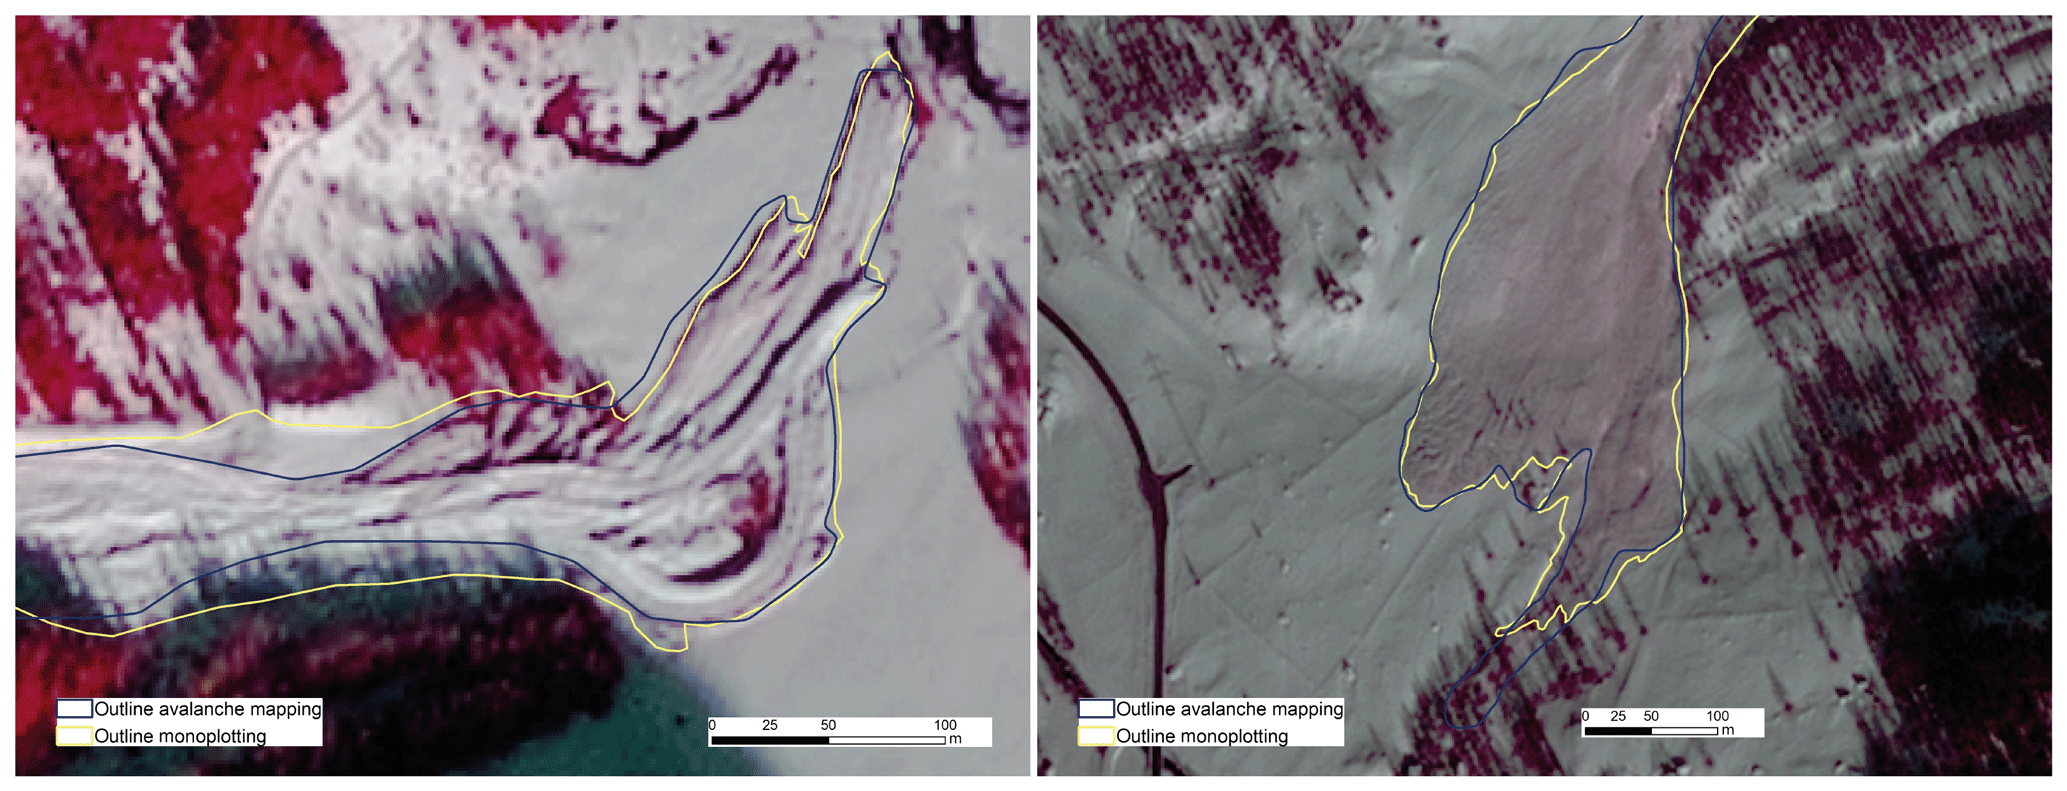
Figure 7Comparison of mapped outlines (blue) with those from the monoplotting tool (yellow) for two different avalanches. The left avalanche is located in Trient, VS, and the one to the right is located in Simplon, VS. Especially in the shade, under trees and with thin deposits, there are considerable differences. In both images the background is SPOT6 imagery from 24 January (SPOT6 data © Airbus DS 2018).
The following list of important problems and uncertainties were discovered during the mapping and validation process:
-
Older and new avalanches in the same avalanche track are mapped as one single avalanche.
-
Avalanches flowing through forest and over rock walls are hard to identify.
-
Some avalanches which are completely in shaded areas might be “invisible” and can therefore not be mapped.
-
Avalanches which are covered by new snow or have snow deposited on them are poorly visible.
-
High surface roughness caused by wind may lead to wrong identification of avalanches.
-
Cornices with snow that has rolled down beneath may be incorrectly classified as a slab avalanche.
4.3 Potential improvements and follow up analysis
The manual mapping method we applied is very time-consuming. Mapping the 18 737 avalanches over the entire 12 500 km2 took approximately 600 h: 300 h for the initial mapping and 300 h for checking and corrections. Therefore it would save a lot of time and cost if the data could be analyzed automatically by, for example, machine learning (Zhang et al., 2016), which was already successfully applied to detect landslides. An overview on potential algorithms and workflows is given by Ghorbanzadeh et al. (2019). Another efficient option to automatically map avalanches is the object-based approach that was already successfully tested with higher spatial resolution optical data (Bühler et al., 2009; Lato et al., 2012; Korzeniowska et al., 2017). We did not yet start to follow these tracks, but we estimate a big potential for successfully detecting the 6117 avalanches mapped with exact boundaries (33 %). For the remaining 12 620 avalanches (67 %), however, we estimate a low success rate, as it requires a lot of background knowledge and interpretation to map those avalanches as a whole outline (see Sect. 3).
The mapped avalanches described in this paper are a unique training and validation dataset, as the dataset contains a large number of individual avalanches in differing topography and illumination conditions over a very large region. The same applies for the validation of existing mapping products from radar satellite data (Eckerstorfer et al., 2017; Vickers et al., 2016; Wesselink et al., 2017).
To further improve the speed of the manual mapping, we plan to confine the area that could theoretically be covered by avalanches. Bühler et al. (2018) developed an algorithm for large-scale hazard indication mapping combining automated release area delineation with numerical avalanche dynamic simulations with RAMMS (Christen et al., 2010). Such a mask could limit the area of investigation, considerably saving time and cost. Conversely the generated avalanche dataset is a very good validation dataset for the newly developed large-scale hazard indication mapping processing chain (Bühler et al., 2018, 2013).
Another important application is the documentation of forest damage. In comparison with pre-event satellite data, forest destruction can be mapped with the same methodology as for the avalanches. Such information is crucial for a fast and target-oriented management of protected forests (Bebi et al., 2009) and the initiation of necessary development of protection infrastructure (Miklau et al., 2014). This is particularly useful in remote regions that are hardly accessible in winter.
4.4 Validation approaches for avalanche bulletins
The avalanches mapped with the method described in this paper might be used for a validation of the avalanche bulletin. The European avalanche danger scale shows that with very high avalanche danger (level 5), “numerous very large and often extremely large natural avalanches can be expected” (https://www.avalanches.org/standards/avalanche-danger-scale/, last access: 25 November 2019). Additional definitions of the terms “numerous” and “often” and the time period or area this would apply to are not given. By defining those two terms, we can check the density for the very large (size 4) and extremely large avalanches (size 5) for each avalanche warning region in the study area for the time period mapped. With the two calculated densities, we will be able to determine where the danger level forecasted in the bulletin was correct, too high or too low. This kind of evaluation is only applicable for high or very high avalanche danger (level 4 and 5) because for lower danger levels, the occurrence of larger avalanches is not a key parameter and therefore only partially defined in the definition of the EAWS danger scale. Of course, the uncertainties and limitations mentioned in other sections of this paper need to be considered in that case. Additionally, the mapped avalanches allow for a verification of the forecasted release heights and aspects. With this information we can provide invaluable feedback to the avalanche warning service and help them improve their validation and forecast in future situations.
4.5 Future application in other regions
The methodology presented in this investigation can be applied for all mountain ranges that receive enough solar illumination in winter. High-latitude regions with polar nights cannot be covered. Regions with short days and low solar illumination angles such as northern Scandinavia can be covered, but we expect the results to be less reliable, as more area is in the shade. As a cloud-free weather window is a prerequisite for optical data acquisition, the methodology is less promising in regions with frequent cloud cover such as the Southern Alps. Upcoming satellite constellations with high spatial resolution and high revisit rates raise the chance of acquiring feasible optical datasets. However, the high costs associated with the data purchase from commercial satellite constellations is the main drawback of the presented approach. The cost for the SPOT6 data applied in this study was approximately EUR 80 000.
Based on the experience gained with satellite data acquired with different sensors in a first rapid mapping study in January 2018, we documented the following large avalanche period based on 1.5 m resolution multispectral SPOT6 satellite imagery. Over an area of 12 500 km2 we manually mapped the outlines of 18 737 individual avalanches in Switzerland. This number is surprisingly high and is, to our knowledge, the largest, most complete and most reliable documentation of a large avalanche period. Avalanches in shadows are mostly visible but harder to map exactly than avalanches in well illuminated areas.
Using parts of the imagery from the first rapid mapping study, we found some avalanches to be visible even 18 d after they were first captured in an image. This was a surprising finding and is important, as it proves that the largest and therefore most interesting avalanches are visible for quite a long time, though with decreasing accuracy of the outline.
By using orthorectified photographs taken from helicopters 1 d after the acquisition of the SPOT6 satellite data, we can estimate the mapping accuracies of the mapped avalanche areas. We achieve an overall accuracy of 73 %, with a clearly higher chance of missing avalanche parts in shaded areas (error of omission of 25 %). As we lack an accurate and complete ground truth, we are not able to meaningfully validate the completeness of the mapping.
The applied data and methodology prove to be applicable to the documentation of large avalanche periods over very large regions, such as entire countries, with high reliability and completeness. Such data are valuable for various applications such as the validation of the avalanche bulletin, the validation of hazard mapping, updating avalanche cadasters and the validation of other avalanche-mapping products. We plan to include the mapped avalanche outlines into the Swiss avalanche databases.
Based on the findings of this study, SPOT6 and SPOT7 data were requested again for an area of 9500 km2 in eastern Switzerland on 16 January 2019 following an avalanche period with very high avalanche danger (level 5). The acquired data were once more cloud-free, allowing for a mapping of avalanches. To better estimate the mapping quality, we acquired UAS photogrammetric data over four large avalanches in the region of Davos. This will allow us to make further remarks on the quality of mapping. During this avalanche period in 2019, the snow line was much lower than in 2018, producing many large dry snow powder avalanches and causing significant forest destruction. As we now have SPOT6 and SPOT7 data from January 2018 and 2019, the potential to accurately document this forest damage is high. The mapping 2019 and the follow-up studies will provide refined information on the potential of optical satellite data for large-scale avalanche studies.
The produced avalanche outlines described in this paper, including a description of the attributes, are available on EnviDat (https://doi.org/10.16904/envidat.77; Hafner and Bühler, 2019).
YB initiated and coordinated the study and wrote the paper with EH and the other co-authors. EH performed the manual mapping, analyzed the generated dataset and co-wrote the paper. BZ delivered the necessary input from the SLF avalanche warning team, critically reviewing the results. MZ and HH tasked the satellites and performed the orthorectification of the satellite data.
The authors declare that they have no conflict of interest.
The authors thank the Federal Office for the Environment FOEN and the canton Valais for partially funding the satellite data. We also thank the cantons Valais, Graubünden, Bern, Obwalden and Uri as well as Liechtenstein for partially funding the data analysis. We thank the Swiss Air Force for providing helicopters to acquire reference imagery and Claudio Bozzini for support with the monoplotting tool. We thank the SLF avalanche warning service for valuable feedback and support.
This paper was edited by Guillaume Chambon and reviewed by Markus Eckerstorfer and one anonymous referee.
Abermann, J., Eckerstorfer, M., Malnes, E., and Hansen, B. U.: A large wet snow avalanche cycle in West Greenland quantified using remote sensing and in situ observations, Nat. Hazards, 97, 517–534, https://doi.org/10.1007/s11069-019-03655-8, 2019.
Bebi, P., Kulakowski, D., and Rixen, C.: Snow avalanche disturbances in forest ecosystems – State of research and implications for management, Forest Ecol. Manag., 257, 1883–1892, https://doi.org/10.1016/j.foreco.2009.01.050, 2009.
Bozzini, C., Conedera, M., and Krebs, P.: A New Monoplotting Tool to Extract Georeferenced Vector Data and Orthorectified Raster Data from Oblique Non-Metric Photographs, Int. J. Herit. Digital Era, 1, 499–518, https://doi.org/10.1260/2047-4970.1.3.499, 2012.
Bozzini, C., Conedera, M., and Krebs, P.: A NEW TOOL FOR FACILITATING THE RETRIEVAL AND RECORDING OF THE PLACE NAME CULTURAL HERITAGE, Int. Arch. Photogramm. Remote Sens. Spatial Inf. Sci., XL-5/W2, 115–118, https://doi.org/10.5194/isprsarchives-XL-5-W2-115-2013, 2013.
Bühler, Y., Hüni, A., Christen, M., Meister, R., and Kellenberger, T.: Automated detection and mapping of avalanche deposits using airborne optical remote sensing data, Cold Reg. Sci. Technol., 57, 99–106, https://doi.org/10.1016/j.coldregions.2009.02.007, 2009.
Bühler, Y., Kumar, S., Veitinger, J., Christen, M., Stoffel, A., and Snehmani: Automated identification of potential snow avalanche release areas based on digital elevation models, Nat. Hazards Earth Syst. Sci., 13, 1321–1335, https://doi.org/10.5194/nhess-13-1321-2013, 2013.
Bühler, Y., Adams, M. S., Stoffel, A., and Boesch, R.: Photogrammetric reconstruction of homogenous snow surfaces in alpine terrain applying near-infrared UAS imagery, Int. J. Remote Sens., 38, 3135–3158, https://doi.org/10.1080/01431161.2016.1275060, 2017.
Bühler, Y., von Rickenbach, D., Stoffel, A., Margreth, S., Stoffel, L., and Christen, M.: Automated snow avalanche release area delineation – validation of existing algorithms and proposition of a new object-based approach for large-scale hazard indication mapping, Nat. Hazards Earth Syst. Sci., 18, 3235–3251, https://doi.org/10.5194/nhess-18-3235-2018, 2018.
Christen, M., Kowalski, J., and Bartelt, P.: RAMMS: Numerical simulation of dense snow avalanches in three-dimensional terrain, Cold Reg. Sci. Technol., 63, 1–14, https://doi.org/10.1016/j.coldregions.2010.04.005, 2010.
Eckerstorfer, M. and Malnes, E.: Manual detection of snow avalanche debris using high-resolution Radarsat-2 SAR images, Cold Reg. Sci. Technol., 120, 205–218, https://doi.org/10.1016/j.coldregions.2015.08.016, 2015.
Eckerstorfer, M., Buhler, Y., Frauenfelder, R., and Malnes, E.: Remote sensing of snow avalanches: Recent advances, potential, and limitations, Cold Reg. Sci. Technol., 121, 126–140, https://doi.org/10.1016/j.coldregions.2015.11.001, 2016.
Eckerstorfer, M., Malnes, E., and Müller, K.: A complete snow avalanche activity record from a Norwegian forecasting region using Sentinel-1 satellite-radar data, Cold Reg. Sci. Technol., 144, 39–51, https://doi.org/10.1016/j.coldregions.2017.08.004, 2017.
Gassner, M., Etter, H. J., Birkland, K., and Leonard, T.: An Improved Avalanche Forecasting Program Based on the Nearest Neighbour Method, International Snow Science Workshop ISSW, Big Sky, MT, USA, 2000.
Ghorbanzadeh, O., Blaschke, T., Gholamnia, K., Meena, S., Tiede, D., and Aryal, J.: Evaluation of Different Machine Learning Methods and Deep-Learning Convolutional Neural Networks for Landslide Detection, Remote Sensing, 11, 196, https://doi.org/10.3390/rs11020196, 2019.
Hafner, E. and Bühler, Y.: SPOT6 Avalanche outlines 24 January 2018, SLF, EnviDat, https://doi.org/10.16904/envidat.77, 2019.
Heck, M., Hobiger, M., van Herwijnen, A., Schweizer, J., and Fäh, D.: Localization of seismic events produced by avalanches using multiple signal classification, Geophys. J. Int., 216, 201–217, https://doi.org/10.1093/gji/ggy394, 2019.
Helbig, N., van Herwijnen, A., and Jonas, T.: Forecasting wet-snow avalanche probability in mountainous terrain, Cold Reg. Sci. Technol., 120, 219–226, https://doi.org/10.1016/j.coldregions.2015.07.001, 2015.
Korzeniowska, K., Bühler, Y., Marty, M., and Korup, O.: Regional snow-avalanche detection using object-based image analysis of near-infrared aerial imagery, Nat. Hazards Earth Syst. Sci., 17, 1823–1836, https://doi.org/10.5194/nhess-17-1823-2017, 2017.
Lato, M. J., Frauenfelder, R., and Bühler, Y.: Automated detection of snow avalanche deposits: segmentation and classification of optical remote sensing imagery, Nat. Hazards Earth Syst. Sci., 12, 2893–2906, https://doi.org/10.5194/nhess-12-2893-2012, 2012.
Meier, L., Jacquemart, M., Steinacher, R., Funk, M., Burkard, A., Mutter, E. Z., Proksch, M., Carlen, N., and Stoebener, P.: An automated alarm and warning system for the bis glacier icefall, Switzerland, using a 5 km radar and high-resolution deformation cameras, International Snow Science Workshop ISSW, Innsbruck, Austria, 7–12 October 2018, 589–593, 2018.
Meister, R.: Country-wide Avalanche Warning in Switzerland, ISSW International Snow Science Workshop, Snowbird, Utha, USA, 30 October–3 November 1994, 58–71, 1994.
Müller, K., Stucki, T., Mitterer, C., Nairz, P., Konetschny, H., Feistl, T., Coleou, C., Berbenni, F., and Chiambretti, I.: Towards an improved European auxiliary matrix for assessing avalanche danger levels, International Snow Science Workshop ISSW, Beckenridge, CO, USA, 2016.
Rudolf-Miklau, F., Sauermoser, S., and Mears, A.: The Technical Avalanche Protection Handbook, Wiley-VCH, Berlin, Germany, 2014.
Sampl, P. and Zwinger, T.: Avalanche simulation with SAMOS, Ann. Glaciol., 38, 393–398, 2004.
Schweizer, J., Kronholm, K., and Wiesinger, T.: Verification of regional snowpack stability and avalanche danger, Cold Reg. Sci. Technol., 37, 277–288, 2003.
SLF: Der Lawinenwinter 1999, Eidgenössisches Institut für Schnee- und Lawinenforschung, Davos, 2000.
Statham, G., Haegeli, P., Greene, E., Birkeland, K., Israelson, C., Tremper, B., Stethem, C., McMahon, B., White, B., and Kelly, J.: A conceptual model of avalanche hazard, Nat. Hazards, 90, 663–691, https://doi.org/10.1007/s11069-017-3070-5, 2017.
swisstopo: swissALTI3D – Das hoch aufgelöste Terrainmodell der Schweiz, Swiss Federal Office of Topography swisstopo, Berne, Switzerland, 27 pp., 2018.
Techel, F., Zweifel, B., and Winkler, K.: Analysis of avalanche risk factors in backcountry terrain based on usage frequency and accident data in Switzerland, Nat. Hazards Earth Syst. Sci., 15, 1985–1997, https://doi.org/10.5194/nhess-15-1985-2015, 2015.
Thüring, T., Schoch, M., van Herwijnen, A., and Schweizer, J.: Robust snow avalanche detection using supervised machine learning with infrasonic sensor arrays, Cold Reg. Sci. Technol., 111, 60–66, https://doi.org/10.1016/j.coldregions.2014.12.014, 2015.
van Herwijnen, A., Heck, M., and Schweizer, J.: Forecasting snow avalanches using avalanche activity data obtained through seismic monitoring, Cold Reg. Sci. Technol., 132, 68–80, https://doi.org/10.1016/j.coldregions.2016.09.014, 2016.
Vickers, H., Eckerstorfer, M., Malnes, E., Larsen, Y., and Hindberg, H.: A method for automated snow avalanche debris detection through use of synthetic aperture radar (SAR) imaging, Earth Space Sci., 3, 446–462, https://doi.org/10.1002/2016ea000168, 2016.
Warren, S.: Optical Properties of Snow, Rev. Geophys. Space Ge., 20, 67–89, 1982.
Wesselink, D. S., Malnes, E., Eckerstorfer, M., and Lindenbergh, R. C.: Automatic detection of snow avalanche debris in central Svalbard using C-band SAR data, Polar Research, 36, 1333236, https://doi.org/10.1080/17518369.2017.1333236, 2017.
Zhang, L., Zhang, L., and Du, B.: Deep Learning for Remote Sensing Data: A Technical Tutorial on the State of the Art, IEEE Geosci. Remote Sens. Magazine, 4, 22–40, https://doi.org/10.1109/MGRS.2016.2540798, 2016.