the Creative Commons Attribution 4.0 License.
the Creative Commons Attribution 4.0 License.
Quantifying the light absorption and source attribution of insoluble light-absorbing particles on Tibetan Plateau glaciers between 2013 and 2015
Hailun Wei
Jun Liu
Baiqing Xu
Mo Wang
Mingxia Ji
Hongchun Jin
The deposition of insoluble light-absorbing particles (ILAPs) on snow and ice surfaces can significantly reduce albedo, thereby accelerating the melting process. In this study, 67 ice samples were collected from seven glaciers located on the Tibetan Plateau (TP) between May 2013 and October 2015. The mixing ratios of black carbon (BC), organic carbon (OC), and mineral dust (MD) were measured with an integrating sphere/integrating sandwich spectrophotometer (ISSW) system, which assumes that the light absorption of MD is due to iron oxide (Fe). Our results indicate that the mass-mixing ratios of BC, OC, and Fe exhibit considerable variability (BC: 10–3100 ng g−1; OC: 10–17 000 ng g−1; Fe: 10–3500 ng g−1) with respective mean values of 220±400 ng g−1, 1360±2420 ng g−1, and 240±450 ng g−1 over the course of the field campaign. We observed that for wavelengths of 450–600 nm, the measured light absorption can be largely attributed to the average light absorption of BC (50.7 %) and OC (33.2 %). Chemical elements and selected carbonaceous particles were also analyzed for source attributions of particulate light absorption based on a positive matrix factorization (PMF) receptor model. Our findings indicate that on average, industrial pollution (33.1 %), biomass or biofuel burning (29.4 %), and MD (37.5 %) constitute the principal sources of ILAPs deposited on TP glaciers.
- Article
(5641 KB) - Full-text XML
-
Supplement
(5090 KB) - BibTeX
- EndNote
The specific light absorption of black carbon (BC) is higher in snow than in the atmosphere because of the higher degree of sunlight scattering in the former (Chylek et al., 1984), and a wealth of evidence confirms that the snow albedo is dominated by BC at visible wavelengths (Warren and Wiscombe, 1980, 1985; Brandt et al., 2011; Hadley and Kirchstetter, 2012). For instance, a mixing ratio of 10 ng g−1 of BC in snow can reduce albedo by 1 %, an amount equivalent to the impact of 500 ng g−1 of dust at 500 nm (Warren and Wiscombe, 1980; Warren, 1982; Wang et al., 2017), and Conway et al. (1996) reported a reduction in snow albedo of 0.21 and concomitant 50 % increase in ablation due to 500 ng g−1 of BC contamination. Similarly, in their experiments using a geometric-optics surface-wave approach, Liou et al. (2011) described an albedo reduction of as much as 5 %–10 % caused by small amounts of BC mixed internally with snow grains. Overall, BC accounts for 85 % of the total absorption by insoluble light-absorbing impurities (ILAPs) in snow at wavelengths of 400–700 nm (Bond et al., 2013). Furthermore, the efficacy of this BC forcing is twice as effective as that of CO2 due to snow albedo change and may have contributed to the large-scale warming of the Northern Hemisphere over the last century (Hansen and Nazarenko, 2004).
The Tibetan Plateau (TP) and neighboring uplands both contain the largest area of snow and ice outside the polar regions (Qin et al., 2006). However, over the last decade, ∼82 % of TP glaciers have retreated, and 10 % of the permafrost area has been lost as a result of climate warming (Qiu, 2008; Yao et al., 2012). Xu et al. (2009a, b) reported that the deposition of BC on snow and ice surfaces has potentially led to an earlier onset of the melting season, whereas the consequential loss of ice is projected to impact atmospheric circulation and ecosystem viability at regional and global scales and in multiple ways (Qian et al., 2011; Skiles et al., 2012; Sand et al., 2013). Therefore, BC is considered to be a significant factor in the recent shrinkage of TP glaciers (Xu et al., 2006, 2009a; Qian et al., 2015; Li et al., 2016).
In addition to BC, organic carbon (OC) and mineral dust (MD) have also been identified as ILAPs contributing to springtime snowmelt and surface warming through snow-darkening effects (Painter et al., 2010, 2012; Huang et al., 2011; Kaspari et al., 2014; Wang et al., 2013, 2014; Yasunari et al., 2015). However, the optical properties of OC in snow are still largely unknown because of limited field data and technical limitations. For instance, preindustrial OC concentrations derived from sites in Antarctica are unexpectedly high (80–360 ng g−1) relative to those reported from Greenland (10–40 ng g−1) and alpine sites (45–98 ng g−1) (Federer et al., 2008; Preunkert et al., 2011). Furthermore, there remain significant uncertainties in estimating the light-absorption capacities of different types of OC from the chemical and optical analysis of new snow samples in western North America (Dang and Hegg, 2014). Although the contribution of OC to climate warming is generally lower than that of BC, the impact of OC is nonetheless significant, particularly over southeastern Siberia, northeastern East Asia, and western Canada (Yasunari et al., 2015). As summarized by Flanner et al. (2009) in relation to modeling the future climate, consideration of the OC content of snow is key to better estimating the impact of ILAPs' absorption of solar radiation from the ultraviolet to visible wavelengths.
It is well established that the light-absorption capacity of MD is linked to the iron oxides (hereafter referred to as Fe) (Alfaro et al., 2004; Lafon and Lee, 2006; Lafon et al., 2004; Moosmuller et al., 2012). The yellow-red color of Fe (primarily hematite and goethite) affects the ability of MD to absorb sunlight at short wavelengths and alters its radiative properties, potentially influencing climate (Takahashi et al., 2011; Jeong et al., 2012; Zhou et al., 2017). For example, Painter et al. (2007) concluded that the duration of seasonal snow cover in alpine regions is shortened by 18–35 days owing to the redeposition of disturbed desert dust. On the TP, goethite constitutes the dominant form of Fe (81 %–98 % mass) deposited on glacier surfaces (Cong et al., 2018). Over the grasslands of Inner Mongolia and northern China, light absorption is dominated by OC, whereas the snow-particulate light absorption is provided primarily by local soil and desert dust derived from the northern TP (Wang et al., 2013).
To date, numerous surveys have sought to evaluate the light-absorption capacity of ILAPs (Xu et al., 2009a, b; Doherty et al., 2010; Huang et al., 2011; Wang et al., 2013; Dang et al., 2014) and their potential source attribution in snow and ice (Hegg et al., 2010; Zhang et al., 2013a; Doherty et al., 2014; Jenkins et al., 2016; Li et al., 2016; Pu et al., 2017). In their 2009 study, Hegg et al. (2010) used a positive matrix factorization (PMF) receptor model to establish that ILAPs deposited in Arctic snow originate predominantly from biomass burning, pollution, and marine sources. Similarly, Doherty et al. (2014) assessed chemical and optical data from 67 North American sites and concluded that the source attribution of particulate light absorption in seasonal snow is dominated by biomass or biofuel burning, soil dust, and fossil fuel pollution.
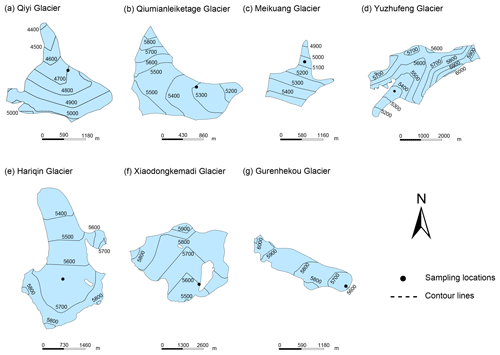
Figure 1Geographical locations of (a) Qiyi Glacier (39.24∘ N, 97.76∘ E), (b) Qiumianleiketage Glacier (36.70∘ N, 90.73∘ E), (c) Meikuang Glacier (35.67∘ N, 94.19∘ E), (d) Yuzhufeng Glacier (35.65∘ N, 94.23∘ E), (e) Hariqin Glacier (33.14∘ N, 92.09∘ E), (f) Xiaodongkemadi Glacier (33.07∘ N, 92.07∘ E), and (g) Gurenhekou Glacier (30.19∘ N, 90.46∘ E). The black dots indicate sampling locations.
Until now, ILAP light absorption and emission sources for the TP have been poorly understood. Increasing the in situ measurements of ILAPs in snow and ice is therefore crucial to assess the factors driving ongoing glacier retreat. Between 2013 and 2015, we collected ice samples from seven TP glaciers during both the wet and dry seasons. By using an integrating sphere/integrating sandwich spectrophotometer (ISSW) system coupled with chemical analysis, we evaluated the particulate light absorption of BC, OC, and MD before exploring the relative contributions of their respective emission sources via a PMF receptor model.
2.1 Site description and sample collection
Figure 1 depicts the topography and sampling locations of each glacier included in our study (Liu et al., 2014), arranged along a roughly north–south transect, and Fig. S1 in the Supplement provides photographs of each sampling site. To minimize potential ILAP contamination from local sources, sampling sites were located at least 50 km from the main road and adjacent city areas. During our 2013–2015 field seasons, we collected a total of 67 columnar ice samples from the seven glacier surfaces. Owing to their broad geographic distribution, our glacial data set represents climatic and land-surface conditions ranging from semiarid in the northern TP to humid in the southern.
Samples 1–19 were collected from the center of Qiyi (QY) Glacier (39∘14′ N, 97∘45′ E) (Fig. 1a) during the 2013–2015 wet seasons. QY Glacier is a small valley glacier (area 2.98 km2, length 3.8 km) located in the Qilian Mountains on the northern TP and is classified as a typical wet island in an otherwise arid region on account of its multiple land-cover types (e.g., forests, bush or scrub, steppes, and meadows).
Further south, samples 20–22 were collected from the southeastern Qiumianleiketage (QM) Glacier (36∘70′ N, 90∘73′ E) during the dry season. Located in the Kunlun Mountains of the TP (Fig. 1b), QM Glacier has a length of 2.6 km and an area of 1.73 km2.
Samples 23–32 were collected from the northern part of Meikuang (MK) Glacier (35∘42′ N, 94∘12′ E), located in the eastern Kunlun Mountains, during both the wet and the dry seasons. This region is characterized by alluvial deposits and sand dunes. MK Glacier is 1.8 km long and 1.1 km2 in area (Fig. 1c).
Immediately east of MK Glacier, samples 33–44 were collected from the southwestern reaches of Yuzhufeng (YZF) Glacier (35∘38′ N, 94∘13′ E), located on the highest peak (6178 m) of the eastern Kunlun Mountains. This high-altitude region is characterized by a cold, arid climate and by fern, forest, and scrubby vegetation.
Samples 45–49 were obtained from the center of Hariqin (HRQ) Glacier (33∘14′ N, 92∘09′ E), a north-facing system located on the northern flank of the Tanggula Mountains, central TP (Fig. 1e). HRQ Glacier drops from an elevation of 5820 m above sea level (a.s.l.) to its terminus at 5400 m, where it forms the headwaters of the Dongkemadi River.
To the southwest of HRQ Glacier, the 2.8 km long Xiaodongkemadi (XD) Glacier (33∘04′ N, 92∘04′ E) covers an area of 1.77 km2 and descends from 5900 m elevation to its terminus at 5500 m (Fig. 1f). The surrounding landscape is predominantly cold steppe and tundra. Samples 50–60 were collected from the southern reaches of XD glacier.
Gurenhekou (GR) Glacier (30∘19′ N, 90∘46′ E) is a relatively small (area: 1.4 km2; length: 2.5 km; width: 0.6 km) cold-based alpine glacier located approximately 90 km north of Lhasa in southern Tibet (Fig. 1g). The glacier ranges in elevation from 6000 m to its terminus at 5600 m. Both Kang et al. (2009) and Bolch et al. (2010) suggested that GR is influenced by both the continental climate of central Asia and the Indian monsoon system. Samples 61–67 were collected from the eastern part of the glacier.
According to Wang et al. (2015), the mean annual accumulation of snow and ice at our TP drilling sites is approximately 2 m. Therefore, for each glacier sampled between 2013 and 2015, we used a 1.2 m long vertical tube lined with a clean, 20 cm diameter plastic bag to collect ice deposited via both wet and dry deposition (Fig. 2). Owing to their relatively high altitude, wet deposition over these glaciers is dominated by fresh snowfall, with considerably less derived from rainfall. Nonetheless, the majority of samples consist of ice rather than snow, reflecting the prevalence of multiple melting processes. Following collection, ice samples were maintained at a temperature of −20 ∘C during transportation to the State Key Laboratory of Cryospheric Sciences, Cold and Arid Regions Environmental and Engineering Research Institute in Lanzhou, China.
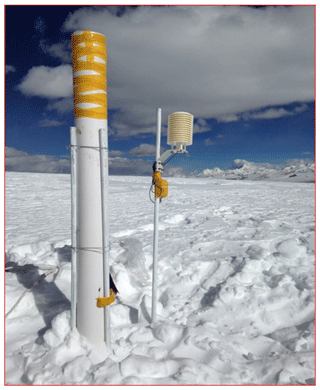
Figure 2The equipment for collecting new snow samples from the surfaces of the seven studied TP glaciers.
In the laboratory, samples were cut vertically into four pieces following established clean sampling protocols (Fig. S2), after which one of the four pieces was cut at 10 cm resolution. Where multiple melting events have produced a nonuniform surface layer (e.g., sites 13 and 26), we cut samples to be longer or shorter than the average. Any dirty layers were cut and analyzed separately. A total of 189 samples were used in this study. To minimize the loss of ILAPs to the container walls, each sample was placed in a clean glass beaker and melted quickly in a microwave oven, immediately after which the water was filtered through polycarbonate filters (Whatman Nuclepore™ track-etched membrane, pore size 0.2 µm) following the procedure reported in Doherty et al. (2010). Further details of the filtration process are given in Wang et al. (2013) and Doherty et al. (2014).
2.2 Optical analysis
To calculate the mass mixing ratio of BC in our samples, we employed an updated ISSW. Although this instrument is similar to that developed by Grenfell et al. (2011), a chief difference is that we used two integrating spheres to reduce diffuse radiation during measurement instead of the integrating sandwich diffuser employed by those authors. The ISSW spectrophotometer measures the light-attenuation spectrum from 400 to 700 nm, with the total light-attenuation spectrum being extended by linear extrapolation to cover the full spectral range (300–750 nm). Nominally, light attenuation is sensitive solely to ILAPs trapped on the filter as a result of the diffuse radiation field and the sandwich structure of the two integrated spheres in the ISSW (Doherty et al., 2014). Specifically, the system detects the light transmitted by an ice sample, S(λ), and compares this value to that transmitted by a blank filter, S0(λ). The relative attenuation (Atn) is then expressed as
The mass absorption efficiency (MAE) and absorption Ångström exponents (Å) employed here for BC, OC, and Fe are described in detail by Wang et al. (2013). Using this technique, we are able to estimate the following parameters: equivalent BC (), maximum BC (, estimated BC (, the fraction of light absorption by non-BC ILAPs (), the absorption Ångström exponent of non-BC ILAPs (Ånon-BC), and the total absorption Ångström exponent (Åtot). These parameters are defined as follows.
-
(ng g−1): equivalent BC is the amount of BC that would be needed to produce light absorption by all insoluble particles in snow for wavelengths of 300–750 nm.
-
(ng g−1): maximum BC is the maximum possible BC mixing ratio in snow, assuming that all light absorption is due to BC at wavelengths of 650–700 nm.
-
(ng g−1): estimated BC is the estimated true mass of BC in snow derived by separating the spectrally resolved total light absorption and non-BC fractions.
-
(%): the fraction of light absorption by non-BC light-absorbing particles is the integrated absorption due to non-BC light-absorbing particles. This value is weighted by the down-welling solar flux at wavelengths of 300–750 nm.
-
Ånon-BC: non-BC absorption Ångström exponent is derived from the light absorption by non-BC components for wavelengths of 450–600 nm.
-
Åtot: absorption Ångström exponent is calculated for all insoluble particles deposited on the filter between 450 and 600 nm.
Both the composition and the size distribution of aerosols are well-known parameters influencing the absorption Ångström exponent. Doherty et al. (2010) reported that the absorption Ångström exponent of OC is close to 5, consistent with the previously reported range of 4–6 (Kirchstetter et al., 2004), and several studies have included absorption Ångström exponents of 2–5 for MD (Fialho et al., 2005; Lafon and Lee, 2006; Zhou et al., 2017; Cong et al., 2018). Typical absorption Ångström exponents for urban and industrial fossil fuel emissions fall within the range 1.0–1.5 (Millikan, 1961; Bergstrom, 2007), which is slightly lower than that of biomass-burning aerosols (1.5–2.5) (Kirchstetter et al., 2004; Bergstrom, 2007). In this study, we note that the absorption Ångström exponent (Åtot) comprises both BC and non-BC impurities trapped on the filters. Calculations of Åtot and of Ånon-BC are described by Doherty et al. (2014). Specifically, Ånon-BC is calculated as a linear combination of the contributions to light absorption made by OC and Fe:
2.3 Chemical analysis
Major metallic elements (Al, Cr, Mn, Fe, Ni, Cu, Zn, Cd, and Pb) were analyzed on an inductively coupled plasma mass spectrometer (ICP-MS, X-7; Thermo Elemental, USA) at the Institute of Tibetan Plateau Research, Beijing, China. The detection limits are 0.238 ng mL−1 for Al, 0.075 ng mL−1 for Cr, 0.006 ng mL−1 for Mn, 4.146 ng mL−1 for Fe, 0.049 ng mL−1 for Ni, 0.054 ng mL−1 for Cu, 0.049 ng mL−1 for Zn, 0.002 ng mL−1 for Cd, and 0.002 ng mL−1 for Pb. Prior to measurement, melted samples were acidified (pH < 2) with ultra-pure HNO3 and left to settle for 48 h. The relative deviation between most of the measured values and the standard reference values is within 10 %. Details of these procedures are given in Li et al. (2009) and Cong et al. (2010).
We used a Dionex 320 ion chromatograph to measure major anions (Cl−, , and ) and cations (Na+, , K+, Mg2+ and Ca2+) in filtrated water samples. The apparatus, which is housed at the Institute of Tibetan Plateau Research in Beijing, is equipped with a CS12 column for cations and an AS11 column for anions and has a detection limit for all measured ions of 1 µg L−1. We also measured concentrations of sea salt, MD, and biosmoke K (KBiosmoke) to assess the mass contributions of the major components in our ice samples. Specifically, sea salt was estimated according to the protocol described by Pio et al. (2007):
where and represents the Na∕Al ratio in the dust material (Wedepohl, 1995).
The MD content is calculated assuming an Al concentration for dust of 7 % (Zhang et al., 2013b):
We determined KBiosmoke according to the following equations (Pu et al., 2017):
where (K∕Al)Crust is 0.37, representing the K∕Al ratio of the dust material (Wedepohl, 1995), and is estimated using Eq. (4).
2.4 Enrichment factor
To evaluate the relative contributions of trace elements from natural (e.g., mineral and soil dust) versus anthropogenic sources (e.g., fossil fuels and vehicle exhaust), we conducted an inter-annual comparison of enrichment factor (EF) values, which represent the enrichment of a given element relative to its concentration in Earth's crust. The primary uncertainty in these calculations originates from differences in chemical composition between snow and the reference crustal material. The EF is defined as the concentration ratio of a given metal to that of Al, which is a reliable measure of crustal dust, normalized to the same concentration ratio characteristic of the upper continental crust (Wedepohl, 1995). EF is calculated by the equation:
2.5 Source apportionment
PMF 5.0 is a receptor model used to determine ILAP source apportionment when source emission profiles are unavailable (Paatero and Tapper, 1994). We employed a PMF procedure similar to that described by Hegg et al. (2009, 2010), in which mass concentrations and chemical species uncertainties are provided as the input. Our final data set contained 189 samples with 18 elements; only those elements with high recovery were used for PMF analysis. For each sample, uncertainty values (Unc) for individual variables were estimated from an empirical equation expressed as
where σ is the standard deviation, c represents the mass concentrations of the relative species, and the MDL depicts the method detection limited.
Although we ran the PMF model for between three and six factors, including six random seeds, we found that the most meaningful results for our TP sites were generated by a three-factor solution. Indeed, Q values (modified values) for this three-factor solution (both robust and true) are closest to the theoretical values of any factor number for which the model was run.
3.1 Aerosol optical depth
Aerosol optical depth (AOD) represents both the transport pathways and deposition of dry aerosols, which in turn provide vital information on potential ILAP sources. As shown in Fig. 3, QY, QM, MK, and YZF glaciers are located on the northern TP, whereas XD, HRQ, and GR glaciers are located in the plateau's southern regions. Therefore, to elaborate on the sources of ILAPs for each TP study site, we assess the spatial distribution of averaged 500 nm AOD, derived from Aqua MODIS between 2013 and 2015. According to Ramanathan et al. (2007), anthropogenic AOD – also referred to as atmospheric brown cloud (ABC) – on the southern side of the Himalayas is greater than 0.3. Consequently, AOD (500 nm) values of >0.3 and <0.1 are considered representative of anthropogenic haze and background conditions, respectively.
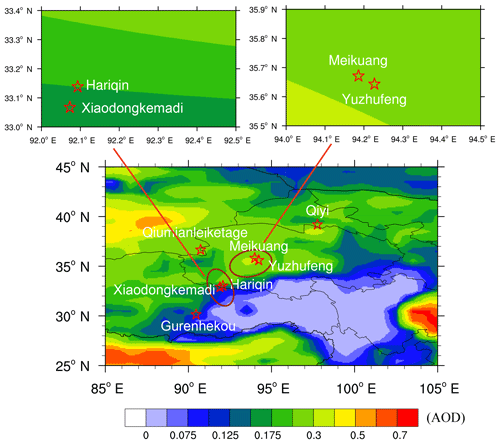
Figure 3Spatial distribution of the averaged AOD over the TP between 2013 and 2015, retrieved from Aqua MODIS at 500 nm. The red stars represent sampling locations (see also Table 1).
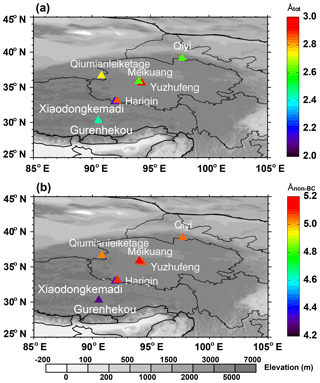
Figure 4Spatial distribution of the median absorption Ångström exponent for (a) total particulate constituents (Åtot) and (b) non-BC particulate constituents (Ånon-BC) for each glacier.
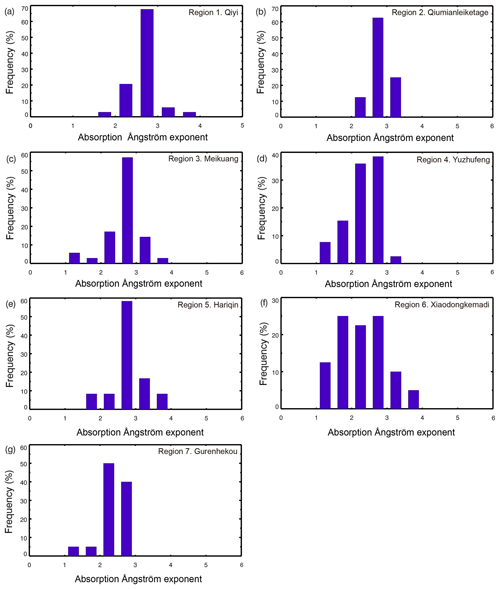
Figure 5Histograms of the frequency of Åtot (450–600 nm) in ice from each glacier. Samples from all vertical profiles are included.
Table 1Statistics of the ILAPs in each glacier measured using an ISSW spectrophotometer associated with the chemical analysis.
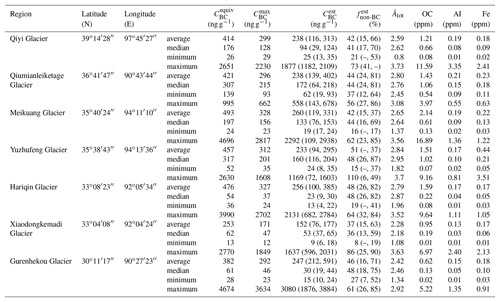
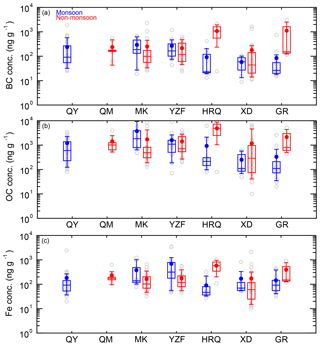
Figure 6Box plots depicting the regional variability in (a) BC concentration, (b) ISOC concentration, and (c) Fe concentration on the seven glaciers. The solid dots represent the average ILAP concentrations for each glacier, and the bars represent the 10th, 25th, median, 75th, and 90th percentiles of the data.
We observe considerably higher AOD over the western TP than over the central TP. For example, values for QY, QM, MK, and YZF glaciers range from 0.25 to 0.3, suggestive of anthropogenic influence, whereas values for HRQ, XD, and GR glaciers are considerably lower (<0.125). Although the elevated AOD over the western TP might serve to enhance glacial retreat there (Engling and Gelencser, 2010), we note that AOD over the TP in general is significantly lower than in southern Asia, particularly over the Indo-Gangetic Plain during the cold season. This pattern aligns closely with previous measurements (Cong et al., 2009; Ming et al., 2010; Yang et al., 2012; Lüthi et al., 2015).
3.2 Regional averages of optical parameters
Table 1 compiles the ice , , , , Åtot, and Ånon-BC data for each glacier. The lowest median (23–26 ng g−1) is observed on HRQ and GR glaciers, southern TP, during the wet season, whereas the highest values (187–165 ng g−1) occur on MK and YZF glaciers on the central TP. Relative to the wet season, the measured concentrations of are markedly higher during the dry season for all seven glaciers. The lowest overall BC concentration is recorded on XD Glacier ( ng g−1), whereas the maximum values of (3100 ng g−1), (3600 ng g−1), and (4700 ng g−1) all corresponded to GR Glacier. Median Åtot typically exceeds 1.0 at all seven sites (Fig. 4, Table 1).
The ice samples exhibit Åtot and Ånon-BC values of 1.4–3.7 and 1.9–5.8, respectively (Table S1 in the Supplement). As shown in Fig. 4a, the median values of Åtot for QY, MK, XD, and GR glaciers are 2.62, 2.64, 2.18, and 2.46, respectively, and the estimated contributions of non-BC ILAPs to absorption are approximately 41 %, 44 %, 36 %, and 48 %, respectively. Relatively high values are observed in samples from QM (2.76), YZF (2.95), and HRQ (2.87) glaciers. Accordingly, the estimated values for those regions are 44 %, 48 %, and 48 %, respectively. With the exception of HRQ Glacier, our data set exhibits a clear south-to-north increase in Ånon-BC over the TP (Fig. 4b). Histograms depicting Åtot by region are shown in Fig. 5.
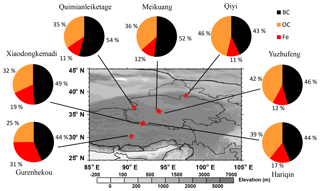
XD Glacier shows the greatest degree of Åtot variability, not only in the higher values (∼2–4), but also at the lower end of the range (<2). This broad distribution is indicative of the complicated sources of particulate light absorption. For instance, Wang et al. (2013) report that higher Åtot values (approximately 3.5–4.5) are strongly correlated with local soils, whereas fossil fuel combustion has an absorption Ångström exponent of <2 (Millikan, 1961; Fialho et al., 2005). A significant fraction of the total absorption on XD Glacier, therefore, is attributed not only to BC (49 %; Fig. 7), but also to non-BC absorbers (51 %) linked to OC and MD. In contrast, Åtot values for all other sites typically ranged from 2 to 3. The values of Ånon-BC and Åtot for each site are also given in Fig. S3.
Figure 6 shows the regional variability in BC, OC, and Fe concentrations during the wet and dry seasons. Although we observe clear differences in median and average ILAP concentrations among the seven glaciers, we also note that overall, ILAPs of BC, OC, and MD exhibit a similar pattern of variability throughout our study area. With the exception of QY and QM glaciers, we collect ice samples during both the wet and the dry seasons. On average, BC and OC concentrations at HRQ, XD, and GR glaciers are several orders of magnitude higher during the dry season than during the wet season. This pattern is consistent with the findings from the Middle Himalayas of Cong et al. (2015), who reported that the dry season is characterized by a distinctly higher carbonaceous aerosol level than that of the wet season, despite similar air mass pathways.
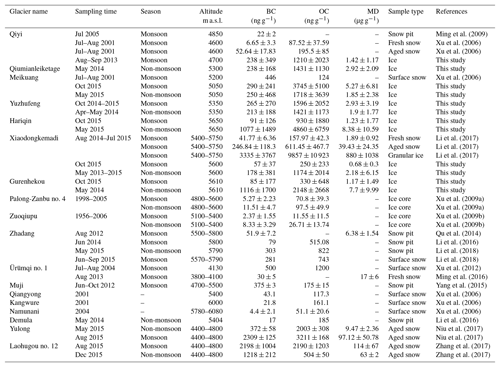
Table 2Statistics of the ILAPs in snow and ice in the studied TP glaciers and other related glaciers.
Lüthi et al. (2015) demonstrated that the atmospheric brown cloud over southern Asia can cross the Himalayas, transporting polluted air masses to the TP and potentially impacting regional glacier mass balance. In our data set, however, there is no apparent difference in ILAP mixing ratios between the wet and dry seasons for two adjacent (MK and YZF) glaciers. We attribute this pattern to the fact that with the exception of long-range pathways, local air pollutants can also impact ILAP availability on the central TP. For instance, although the prevailing air masses over the MK and YZF glaciers originate from the arid western TP and Taklimakan Desert regions, Huang et al. (2018) concluded that the concentration of trace elements at YZF Glacier is closer to those of the dust sources and thus that YZF Glacier is less influenced by human activity. In close agreement with Ming et al. (2013), our median values of and COC (referred to as the mass concentration of OC) exhibit a gradually decreasing trend from north to south, and the mass concentrations of BC are higher for northern TP glaciers than for their southern counterparts.
To help quantify the regional ILAP status of each glacier, Table 2 contains statistics on snow and ice samples collected both during our present investigation and during previous studies of TP glaciers. During our visit to YZF Glacier, we collect twelve ice samples from depths between 15 and 45 cm (Table S1). As shown in Fig. S4, values for this region typically range from ∼100 to 1000 ng g−1, with several values of <100 ng g−1. A striking feature of this data set is the relatively high (1600 ng g−1) and COC (9160 ng g−1) in the surface layer at site 41. Judging by the high value of (0.56) for this site, we suggest that these data indicate that light absorption at this site is influenced not only by BC but also potentially by OC and MD.
For YZF Glacier, Åtot typically varied between ∼2 and 3.7, and the average is close to 50 %, which both suggest that ILAPs at this site are heavily influenced by anthropogenic air pollution. We also observe large variations in COC, with values ranging from ∼10 to 17 000 ng g−1. With the exception of site 23, values for MK Glacier are considerably lower than those of YZF Glacier (range 20–670 ng g−1; median 130 ng g−1; Fig. S5). MK Glacier gives a median COC of ∼600 ng g−1, whereas the fraction of total particulate light absorption attributable to non-BC constituents is typically ∼16 %–62 %. Ånon-BC (5.12) at this site is very similar to that of YZF Glacier (5.06).
values for QY Glacier (Fig. S6) are similar to those of MK Glacier, ranging from ∼20 to 720 ng g−1 (excluding the highest value of 1900 ng g−1 at site 13). The fraction of total particulate light absorption due to the non-BC constituent is typically ∼20 %–70 %, with a median value of 41 %. Together with the lower Åtot (2.6), this information indicates that BC plays a dominant role in influencing light absorption in this region. Compared with the other TP glaciers, we note that the vertical ILAP profiles on QY Glacier are collected during the 2014 and 2015 wet seasons (Table S1). The mixing ratios of OC and Fe are 80–10 100 and 20–340 ng g−1, respectively. Figure S7 shows that the vertical profiles of the mass-mixing ratios of BC, OC, and Fe are more variable for XD Glacier than for the other six glaciers. With the exception of the surface layer at sites 53 and 54, typically ranges from 10 to 280 ng g−1, indicating that XD Glacier is the cleanest site in our study. At sites 56–58, is less than 38 %, and Åtot ranges from 1 to 2.5, consistent with the combustion of fossil fuels due to industrial activity.
3.3 Scavenging and washing efficiencies
Previous studies have demonstrated how ILAPs become trapped and integrated into the snowpack as a result of melting and sublimation, thereby enriching surface concentrations of these particles (Conway et al., 1996; Painter et al., 2012; Doherty et al., 2013). For instance, Doherty et al. (2013) reported that ILAP scavenging by snow meltwater leads to elevated concentrations of BC in the surface layer. Similarly, Flanner et al. (2007, 2009) concluded that amplified ablation due to the concentration of BC in melting snow serves to further reduce the snow albedo, thus providing a positive feedback to radiative forcing. However, the impact of multiple melting processes on ILAPs located at greater depths in the glacier surface remains unclear.
On QY Glacier, we observe a marked increase in ILAP mixing ratios with depth. Although this result may appear inconsistent with those of Doherty et al. (2013), we note that Xu et al. (2012) observed high concentrations of BC at the snow surface and at depth, which those authors attributed to meltwater percolation and the deposition of superimposed ice in the snowpack. A further prominent feature in our data set is the elevated surface mixing ratio of at sites 52–54 on XD Glacier, relative to deeper layers, which we attribute to the dry and wet deposition of BC on the surface samples. We propose that the clear difference in vertical profiles between QY and XD glaciers is a function of ILAP deposition. Specifically, QY Glacier is sampled during the wet season, when higher temperatures and stronger melting potentially serve to concentrate ILAPs in the basal layers. In contrast, because we sample XD Glacier during both the wet and dry seasons, ILAP concentrations decrease with depth during the dry season as a function of scavenging (Fig. S7a–g) but increase during the wet season because of the concentration effect (Fig. S7h–j). The vertical profiles of for QM, HRQ, and GR glaciers are plotted in Fig. S8. With the exception of those sites included in Fig. S8d–e, i, and h, the sampled glaciers exhibit the trapping and scavenging effects of a higher surface-layer BC content resulting from melting processes.
3.4 ILAP contributions to particulate light absorption
The fractional contributions of BC, OC, and Fe (presumably in the form of goethite) to total absorption (450 nm) are depicted for each glacier in Fig. 7, with further details of BC, OC, and Fe concentrations given in Table S1. BC plays a dominant role in particulate light absorption, with average values ranging from ∼44 % to 54 % across all seven glacier sites. Although OC represents the second highest absorber, we noted significant variability (between 25 % and 46 % on average) in its contribution to total light absorption during the 2013–2015 field campaign. For those glaciers located on the eastern TP (QY, YZF, and HRQ glaciers), the relative contributions of BC and OC to total absorption are broadly similar. The highest fraction of BC (54 %) is measured on QM Glacier, on the western TP.
Complementing the BC and OC contributions, light absorption on TP glaciers is also influenced by Fe. According to our data, the average fraction of total light absorbed by Fe ranges from approximately 11 % to 31 % across all seven glaciers, with the highest values recorded on GR Glacier. This finding indicates that MD plays a key role in the spectral absorption properties of ILAPs on TP glaciers. The relative contributions of BC, OC, and Fe to total light absorption for all surface-ice samples are presented in Fig. S9 and Table 1.
3.5 Enrichment factor
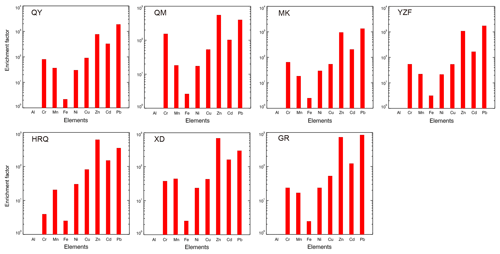
EF values ranging from 0.1 to 10 represent significant input from crustal sources, whereas values of >10 indicate major contributions from anthropogenic activity. According to our EF analysis (Fig. 8), mean values for Fe are less than 5 for all seven glaciers, suggesting a primarily crustal origin. This result supports the findings of previous studies in northern China (Wang et al., 2013) and North America (Doherty et al., 2014), which indicate that light-absorbing particles in snow are dominated by local soil dust. Similar to Fe, other trace metals with mean EF values of ≥5.0 are moderately-to-highly enriched because of anthropogenic emissions (Hsu et al., 2010). For example, Pacyna and Pacyna (2001) reported that Cr is derived chiefly from the combustion of fossil fuels, which is also a primary source of Cu. Pb and Zn, however, are linked to traffic-related combustion and coal burning (Christian et al., 2010; Contini et al., 2014). In summary, the high EF values for Cu, Zn, and Cd in our ice samples provide clear evidence that TP glaciers are being affected by anthropogenic pollution.
3.6 Source apportionment
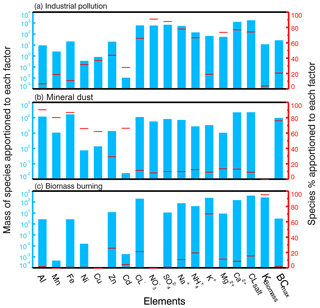
We employed mass concentrations of principal elements and ILAPs, together with their respective uncertainties, to populate the PMF 5.0 model, the details of which are described by Hegg et al. (2009, 2010) and Pu et al. (2017). Model-derived factor loadings (defined as the apportionment of species mass to individual factors) for the three-factor solution of each source profile are shown in Fig. 9, both as measured mass concentrations and the percent total mass allocated to each factor. The first factor (top panel) exhibits relatively high loadings of Cl−, sea salt, , and , which are well-known markers for urban and/or local industrial pollution (Alexander and Mickley, 2015). Although Cl− and Na+ are usually considered potential products of sea salt, high loadings of Cl− relative to sea salt reflect a further source, such as industrial emissions or coal combustion (Kulkarni, 2009). High concentrations of are also linked to coal combustion (Pang et al., 2007).
Compared with the first factor, Al (90.3 %) and Fe (87.3 %) are generally regarded as chief indicators of urban and/or regional MD (Pu et al., 2017), and the second factor can therefore be readily interpreted as a natural MD source. We note that exhibits a high mass loading on this factor. Since both K+ and KBiosmoke are primary indicators of biomass burning (Zhang et al., 2013a), we attribute the highest loadings of K+ and KBiosmoke to this source (Fig. 9c). Nonetheless, the lowest mass loading of in this factor is unexpected, as is related not only to biomass burning but also to local MD associated with industrial activity (Bond and Bergstrom, 2006). Consequently, we interpret the third factor as representing primarily the burning of biomass.
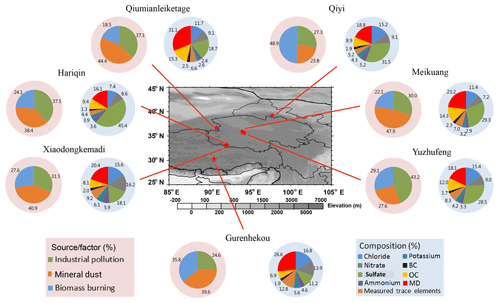
Figure 10 illustrates the chemical composition and mean ILAP source apportionment for the seven TP glaciers. We reiterate that the apportionment refers to the amount of light absorbed by insoluble particles on the glacier surface. On average, the observed source apportionment by MD is close to 37.5 %, with industrial emissions and biomass burning contributing 33.1 % and 29.4 %, respectively. Specifically, the largest biomass contribution to light absorption is found on QY Glacier, which is located close to centers of human land use (Guan et al., 2009; Li et al., 2016). For MK, QM, GR, and XD glaciers, the MD contribution is significantly larger (>47.9 %) than those of industrial pollution and biomass burning, particularly in the case of MK Glacier. In these regions, the percentage of light absorption due to soil dust ranges from 20.4 % to 31.1 %, whereas light absorption due to biomass burning is 18.5 % to 35.8 %.
Industrial pollution is a major component of apportionment for both YZF and MK glaciers, where the attribution of total anions by chloride, nitrate, and sulfate is significantly higher than that of other chemical species. On HRQ Glacier, the largest contribution of sulfate is 45.4 %. As depicted in Fig. 10, the primary sources of light absorption by insoluble surficial particles are MD and industrial pollution. The sole exception is YZF Glacier, which exhibits a relatively large contribution from the burning of biomass. Together, these results are highly consistent with those of previous studies (Wang et al., 2013; Li et al., 2016), which reported that BC deposited on TP glaciers is derived overwhelmingly from the combustion of coal.
We employ the ISSW technique, coupled with chemical analysis, to assess ILAPs at seven glacier sites on the Tibetan Plateau. Specifically, we analyze 67 vertical profiles in ice samples collected during both the wet and dry seasons between 2013 and 2015. Our findings from HRQ, XD, and GR glaciers show that on average, BC and OC concentrations are several orders of magnitude higher during the dry season than during the wet season. However, it remains unclear that whether the ILAPs in the MK and YZF glaciers are comparable during the monsoon and non-monsoon seasons, and thus we suggest this as a suitable focus for future research. The lowest concentrations of BC in our data set originate from XD, HRQ, and GR glaciers, which give median concentrations of 33, 24, and 28 ng g−1, respectively. Moreover, we observe a pronounced decline in ILAP concentration with depth on XD Glacier, which we attribute to scavenging during the wet season. An opposite trend, driven by meltwater washing effects, characterizes the warmer wet season. Both BC and OC play central roles in particulate light absorption on TP glaciers, with average values of ∼44 %–54 % and ∼25 %–46 %, respectively.
By using a PMF receptor model, we ascertain that the ILAP budget of northern TP glaciers reflects a significant portion of anthropogenic pollutants. The largest contributors of light-absorbing insoluble particles for TP glaciers, however, include local MD and industrial pollution sources, followed by the burning of biomass. In summary, both natural MD and anthropogenic emissions constitute non-negligible sources of ILAPs for TP glaciers.
All data sets and codes used in this study can be obtained by contacting Xin Wang (wxin@lzu.edu.cn).
The supplement related to this article is available online at: https://doi.org/10.5194/tc-13-309-2019-supplement.
BX and MW designed the experiments. XW prepared the manuscript with contributions from all co-authors.
The authors declare that they have no conflict of interest.
This research was supported by the National Key Research and Development
Program on Monitoring, Early Warning and Prevention of Major Natural Disaster
(2018YFC1506005), the National Natural Science Foundation of China (grants
41775144, 41522505, 41771091, 41675065, and 41875091), and the Fundamental
Research Funds for the Central Universities
(lzujbky-2018-k02).
Edited by: Mark
Flanner
Reviewed by: two anonymous referees
Alexander, B. and Mickley, L. J.: Paleo-perspectives on potential future changes in the oxidative capacity of the atmosphere due to climate change and anthropogenic emissions, Current Pollution Reports, 1, 57–69, 2015.
Alfaro, S. C., Lafon, S., Rajot, J. L., Formenti, P., Gaudichet, A., and Maille, M.: Iron oxides and light absorption by pure desert dust: An experimental study, J. Geophys. Res.-Atmos., 109, D08208, https://doi.org/10.1029/2003jd004374, 2004.
Bergstrom, C.: Measuring the value and prestige of scholarly journals, College and Research Libraries News, 68, 314–316, 2007.
Bolch, T., Yao, T., Kang, S., Buchroithner, M. F., Scherer, D., Maussion, F., Huintjes, E., and Schneider, C.: A glacier inventory for the western Nyainqentanglha Range and the Nam Co Basin, Tibet, and glacier changes 1976–2009, The Cryosphere, 4, 419–433, https://doi.org/10.5194/tc-4-419-2010, 2010.
Bond, T. C. and Bergstrom, R. W.: Light absorption by carbonaceous particles: An investigative review, Aerosol Sci. Tech., 40, 27–67, 2006.
Bond, T. C., Doherty, S. J., Fahey, D. W., Forster, P. M., Berntsen, T., DeAngelo, B. J., Flanner, M. G., Ghan, S., Karcher, B., Koch, D., Kinne, S., Kondo, Y., Quinn, P. K., Sarofim, M. C., Schultz, M. G., Schulz, M., Venkataraman, C., Zhang, H., Zhang, S., Bellouin, N., Guttikunda, S. K., Hopke, P. K., Jacobson, M. Z., Kaiser, J. W., Klimont, Z., Lohmann, U., Schwarz, J. P., Shindell, D., Storelvmo, T., Warren, S. G., and Zender, C. S.: Bounding the role of black carbon in the climate system: A scientific assessment, J. Geophys. Res.-Atmos., 118, 5380–5552, 2013.
Brandt, R. E., Warren, S. G., and Clarke, A. D.: A controlled snowmaking experiment testing the relation between black carbon content and reduction of snow albedo, J. Geophys. Res.-Atmos., 116, D08109, https://doi.org/10.1029/2010jd015330, 2011.
Christian, T. J., Yokelson, R. J., Cárdenas, B., Molina, L. T., Engling, G., and Hsu, S.-C.: Trace gas and particle emissions from domestic and industrial biofuel use and garbage burning in central Mexico, Atmos. Chem. Phys., 10, 565–584, https://doi.org/10.5194/acp-10-565-2010, 2010.
Chylek, P., Ramaswamy, V., and Srivastava, V.: Graphitic carbon content ofaerosols, clouds and snow, and its climatic implications, Sci. Total Environ., 36, 117–120, 1984.
Cong, Z., Kang, S., Kawamura, K., Liu, B., Wan, X., Wang, Z., Gao, S., and Fu, P.: Carbonaceous aerosols on the south edge of the Tibetan Plateau: concentrations, seasonality and sources, Atmos. Chem. Phys., 15, 1573–1584, https://doi.org/10.5194/acp-15-1573-2015, 2015.
Cong, Z., Gao, S., Zhao, W., Wang, X., Wu, G., Zhang, Y., Kang, S., Liu, Y., and Ji, J.: Iron oxides in the cryoconite of glaciers on the Tibetan Plateau: abundance, speciation and implications, The Cryosphere, 12, 3177–3186, https://doi.org/10.5194/tc-12-3177-2018, 2018.
Cong, Z. Y., Kang, S. C., Smirnov, A., and Holben, B.: Aerosol optical properties at Nam Co, a remote site in central Tibetan Plateau, Atmos. Res., 92, 42–48, https://doi.org/10.1016/J.Atmosres.2008.08.005, 2009.
Cong, Z. Y., Kang, S. C., Zhang, Y. L., and Li, X. D.: Atmospheric wet deposition of trace elements to central Tibetan Plateau, Appl. Geochem., 25, 1415–1421, 2010.
Contini, D., Cesari, D., Genga, A., Siciliano, M., Ielpo, P., and Guascito, M. R.: Source apportionment of size-segregated atmospheric particles based on the major water-soluble components in Lecce (Italy), Sci. Total Environ., 472, 248–261, 2014.
Conway, H., Gades, A., and Raymond, C. F.: Albedo of dirty snow during conditions of melt, Water Resour. Res., 32, 1713–1718, https://doi.org/10.1029/96wr00712, 1996.
Dang, C. and Hegg, D. A.: Quantifying light absorption by organic carbon in Western North American snow by serial chemical extractions, J. Geophys. Res.-Atmos., 119, 10247–10261, https://doi.org/10.1002/2014jd022156, 2014.
Doherty, S. J., Warren, S. G., Grenfell, T. C., Clarke, A. D., and Brandt, R. E.: Light-absorbing impurities in Arctic snow, Atmos. Chem. Phys., 10, 11647–11680, https://doi.org/10.5194/acp-10-11647-2010, 2010.
Doherty, S. J., Grenfell, T. C., Forsström, S., Hegg, D. L., Brandt, R. E., and Warren, S. G.: Observed vertical redistribution of black carbon and other insoluble light-absorbing particles in melting snow, J. Geophys. Res.-Atmos., 118, 5553–5569, 2013.
Doherty, S. J., Dang, C., Hegg, D. A., Zhang, R. D., and Warren, S. G.: Black carbon and other light-absorbing particles in snow of central North America, J. Geophys. Res.-Atmos., 119, 12807–12831, 2014.
Engling, G. and Gelencser, A.: Atmospheric Brown Clouds: From Local Air Pollution to Climate Change, Elements, 6, 223–228, 2010.
Federer, U., Kaufmann, P. R., Hutterli, M., Schüpbach, S., and Stocker, T. F.: Continuous flow analysis of total organic carbon in polar ice cores, Environ. Sci. Technol., 42, 8039–8043, 2008.
Fialho, P., Hansen, A. D. A., and Honrath, R. E.: Absorption coefficients by aerosols in remote areas: a new approach to decouple dust and black carbon absorption coefficients using seven-wavelength Aethalometer data, J. Aerosol Sci., 36, 267–282, 2005.
Flanner, M. G., Zender, C. S., Randerson, J. T., and Rasch, P. J.: Present-day climate forcing and response from black carbon in snow, J. Geophys. Res.-Atmos., 112, D11202, https://doi.org/10.1029/2006jd008003, 2007.
Flanner, M. G., Zender, C. S., Hess, P. G., Mahowald, N. M., Painter, T. H., Ramanathan, V., and Rasch, P. J.: Springtime warming and reduced snow cover from carbonaceous particles, Atmos. Chem. Phys., 9, 2481–2497, https://doi.org/10.5194/acp-9-2481-2009, 2009.
Grenfell, T. C., Doherty, S. J., Clarke, A. D., and Warren, S. G.: Light absorption from particulate impurities in snow and ice determined by spectrophotometric analysis of filters, Appl. Optics, 50, 2037—2048, 2011.
Guan, X., Huang, J., Guo, N., Bi, J., and Wang, G.: Variability of soil moisture and its relationship with surface albedo and soil thermal parameters over the Loess Plateau, Adv. Atmos. Sci., 26, 692–700, 2009.
Hadley, O. L. and Kirchstetter, T. W.: Black-carbon reduction of snow albedo, Nat. Clim. Change, 2, 437–440, 2012.
Hansen, J. and Nazarenko, L.: Soot climate forcing via snow and ice albedos, P. Natl. Acad. Sci. USA, 101, 423–428, 2004.
Hegg, D. A., Warren, S. G., and Grenfell, T. C.: Source attribution of black carbon in Arctic snow, Environ. Sci. Technol., 43, 4016–4021, 2009.
Hegg, D. A., Warren, S. G., Grenfell, T. C., Sarah J Doherty, and Clarke, A. D.: Sources of light-absorbing aerosol in arctic snow and their seasonal variation, Atmos. Chem. Phys., 10, 10923–10938, https://doi.org/10.5194/acp-10-10923-2010, 2010.
Hsu, S. C., Liu, S. C., Arimoto, R., Shiah, F. K., Gong, G. C., Huang, Y. T., Kao, S. J., Chen, J. P., Lin, F. J., Lin, C. Y., Huang, J. C., Tsai, F. J., and Lung, S. C. C.: Effects of acidic processing, transport history, and dust and sea salt loadings on the dissolution of iron from Asian dust, J. Geophys. Res.-Atmos., 115, D19313, https://doi.org/10.1029/2009JD013442, 2010.
Huang, J., Li, Y. F., Li, Z., and Xiong, L. F.: Spatial variations and sources of trace elements in recent snow from glaciers at the Tibetan Plateau, Environ. Sci. Pollut. R., 25, 7875–7883, 2018.
Huang, J. P., Fu, Q., Zhang, W., Wang, X., Zhang, R. D., Ye, H., and Warren, S. G.: Dust and Black Carbon in Seasonal Snow across Northern China, B. Am. Meteorol. Soc., 92, 175–181, 2011.
Jenkins, M., Kaspari, S., Kang, S. C., Grigholm, B., and Mayewski, P. A.: Tibetan plateau geladaindong black carbon ice core record (1843–1982): recent increases due to higher emissions and lower snow accumulation, Advances in Climate Change Research, 7, 132–138, 2016.
Jeong, D., Kim, K., and Choi, W.: Accelerated dissolution of iron oxides in ice, Atmos. Chem. Phys., 12, 11125–11133, https://doi.org/10.5194/acp-12-11125-2012, 2012.
Kang, S., Chen, F., Gao, T., Zhang, Y., Yang, W., Yu, W., and Yao, T.: Early onset of rainy season suppresses glacier melt: a case study on Zhadang glacier, Tibetan Plateau, J. Glaciol., 55, 755–758, 2009.
Kaspari, S., Painter, T. H., Gysel, M., Skiles, S. M., and Schwikowski, M.: Seasonal and elevational variations of black carbon and dust in snow and ice in the Solu-Khumbu, Nepal and estimated radiative forcings, Atmos. Chem. Phys., 14, 8089–8103, https://doi.org/10.5194/acp-14-8089-2014, 2014.
Kirchstetter, T. W., Novakov, T., and Hobbs, P. V.: Evidence that the spectral dependence of light absorption by aerosols is affected by organic carbon, J. Geophys. Res.-Atmos., 109, D21208, https://doi.org/10.1029/2004JD004999, 2004.
Kulkarni, S.: Assessment of source-receptor relationships of aerosols: an integrated forward and backward modeling approach, Dissertations and Theses-Gradworks, https://doi.org/10.17077/etd.bxnc1m5k, 2009.
Lafon, S. and Lee, A. B.: Diffusion maps and coarse-graining: a unified framework for dimensionality reduction, graph partitioning and data set parameterization, IEEE T. Pattern Anal., 28, 1393–1403, 2006.
Lafon, S., Rajot, J. L., Alfaro, S. C., and Gaudichet, A.: Quantification of iron oxides in desert aerosol, Atmos. Environ., 38, 1211–1218, https://doi.org/10.1016/J.Atmosenv.2003.11.006, 2004.
Li, C. L., Kang, S. C., and Zhang, Q.: Elemental composition of Tibetan Plateau top soils and its effect on evaluating atmospheric pollution transport, Environ. Pollut., 157, 8–9, 2009.
Li, C. L., Bosch, C., Kang, S. C., Andersson, A., Chen, P. F., Zhang, Q. G., Cong, Z. Y., Chen, B., Qin, D. H., and Gustafsson, O.: Sources of black carbon to the Himalayan-Tibetan Plateau glaciers, Nat. Commun., 7, 12574, https://doi.org/10.1038/ncomms12574, 2016.
Li, X. F., Kang, S. C., He, X. B., Qu, B., Tripathee, L., Jing, Z. F., Paudyal, R., Li, Y., Zhang, Y. L., Yan, F. P., Li, G., and Li, C. L.: Light-absorbing impurities accelerate glacier melt in the Central Tibetan Plateau, Sci. Total Environ., 587, 482–490, 2017.
Li, X. F., Kang, S. C., Zhang, G. S., Qu, B., Tripathee, L., Paudyal, R., Jing, Z. F., Zhang, Y. L., Yan, F. P., Li, G., Cui, X. Q., Xu, R., Hu, Z. F., and Li, C. L.: Light-absorbing impurities in a southern Tibetan Plateau glacier: Variations and potential impact on snow albedo and radiative forcing, Atmos. Res., 200, 77–87, 2018.
Liou, K. N., Takano, Y., and Yang, P.: Light absorption and scattering by aggregates: Application to black carbon and snow grains, J. Quant. Spectrosc. Ra., 112, 1581–1594, https://doi.org/10.1016/J.Jqsrt.2011.03.007, 2011.
Liu, S. Y., Guo, W. Q., Xu, J. L., Shangguan D. H., Wu, L. Z., Yao, X. J., Zhao, J. D., Liu, Q., Jiang, Z. L., Li, P., Wei, J. F., Bao, W, J., Yu, P. C., Ding, L. F., Li, G., Ge, C. M., and Wang, Y.: The Second Glacier Inventory Dataset of China (Version 1.0), Cold and Arid Regions Science Data Center at Lanzhou, https://doi.org/10.3972/glacier.001.2013.db, 2014.
Lüthi, Z. L., Škerlak, B., Kim, S.-W., Lauer, A., Mues, A., Rupakheti, M., and Kang, S.: Atmospheric brown clouds reach the Tibetan Plateau by crossing the Himalayas, Atmos. Chem. Phys., 15, 6007–6021, https://doi.org/10.5194/acp-15-6007-2015, 2015.
Millikan, R. C.: Optical properties of soot, J. Opt. Soc. Am., 51, 698–699, 1961.
Ming, J., Xiao, C. D., Cachier, H., Qin, D. H., Qin, X., Li, Z. Q., and Pu, J. C.: Black Carbon (BC) in the snow of glaciers in west China and its potential effects on albedos, Atmos. Res., 92, 114–123, 2009.
Ming, J., Xiao, C. D., Sun, J. Y., Kang, S. C., and Bonasoni, P.: Carbonaceous particles in the atmosphere and precipitation of the Nam Co region, central Tibet, J. Environ. Sci., 22, 1748–1756, https://doi.org/10.1016/S1001-0742(09)60315-6, 2010.
Ming, J., Xiao, C. D., Du, Z. C., and Yang, X. G.: An overview of black carbon deposition in High Asia glaciers and its impacts on radiation balance, Adv. Water Resour., 55, 80–87, 2013.
Ming, J., Xiao, C. D., Wang, F. T., Li, Z. Q., and Li, Y. M.: Grey Tienshan Urumqi Glacier No.1 and light-absorbing impurities, Environ. Sci. Pollut. Res., 23, 9549–9558, 2016.
Moosmuller, H., Engelbrecht, J. P., Skiba, M., Frey, G., Chakrabarty, R. K., and Arnott, W. P.: Single scattering albedo of fine mineral dust aerosols controlled by iron concentration, J. Geophys. Res.-Atmos., 117, D11210, https://doi.org/10.1029/2011jd016909, 2012.
Niu, H. W., Kang, S. C., Zhang, Y. L., Shi, X. Y., Shi, X. F., Wang, S. J., Li, G., Yan, X. G., Pu, T., and He, Y. Q.: Distribution of light-absorbing impurities in snow of glacier on Mt. Yulong, southeastern Tibetan Plateau, Atmos. Res., 197, 474–484, 2017.
Paatero, P. and Tapper, U.: Positive matrix factorization: a non-negative factor model with optimal utilization of error estimates of data values, Environmetrics, 5, 111–126, 1994.
Pacyna, J. M. and Pacyna, E. G.: An assessment of global and regional emissions of trace metals to the atmosphere from anthropogenic sources worldwide, Environ. Rev., 9, 269–298, 2001.
Painter, T. H., Barrett, A. P., Landry, C. C., Neff, J. C., Cassidy, M. P., Lawrence, C. R., McBride, K. E., and Farmer, G. L.: Impact of disturbed desert soils on duration of mountain snow cover, Geophys. Res. Lett., 34, L12502, https://doi.org/10.1029/2007gl030284, 2007.
Painter, T. H., Deems, J. S., Belnap, J., Hamlet, A. F., Landry, C. C., and Udall, B.: Response of Colorado River runoff to dust radiative forcing in snow, P. Natl. Acad. Sci. USA, 107, 17125–17130, 2010.
Painter, T. H., Bryant, A. C., and Skiles, S. M.: Radiative forcing by light absorbing impurities in snow from MODIS surface reflectance data, Geophys. Res. Lett., 39, L17502, https://doi.org/10.1029/2012gl052457, 2012.
Pang, H., He, Y., Theakstone, W. H., and Zhang, D. D.: Soluble ionic and oxygen isotopic compositions of a shallow firn profile, Baishui glacier No. 1, southeastern Tibetan Plateau, Ann. Glaciol., 46, 325–330, 2007.
Pio, C. A., Legrand, M., Oliveira, T., Afonso, J., Santos, C., Caseiro, A., Fialho, P., Barata, F., Puxbaum, H., Sanchez-Ochoa, A., Kasper-Giebl, A., Gelencser, A., Preunkert, S., and Schock, M.: Climatology of aerosol composition (organic versus inorganic) at nonurban sites on a west-east transect across Europe, J. Geophys. Res., 112, D23S02, https://doi.org/10.1029/2006JD008038, 2007.
Preunkert, S., Legrand, M., Stricker, P., Bulat, S., Alekhina, I., Petit, J. R., Hoffmann, H., May, B., and Jourdain B.: Quantification of Dissolved Organic Carbon at very low levels in natural ice samples by a UV induced oxidation method, Environ. Sci. Technol., 45, 673–678, 2011.
Pu, W., Wang, X., Wei, H., Zhou, Y., Shi, J., Hu, Z., Jin, H., and Chen, Q.: Properties of black carbon and other insoluble light-absorbing particles in seasonal snow of northwestern China, The Cryosphere, 11, 1213–1233, https://doi.org/10.5194/tc-11-1213-2017, 2017.
Qian, Y., Flanner, M. G., Leung, L. R., and Wang, W.: Sensitivity studies on the impacts of Tibetan Plateau snowpack pollution on the Asian hydrological cycle and monsoon climate, Atmos. Chem. Phys., 11, 1929–1948, https://doi.org/10.5194/acp-11-1929-2011, 2011.
Qian, Y., Yasunari, T. J., Doherty, S. J., Flanner, M. G., Lau, W. K. M., and Jing, M.: Light-absorbing particles in snow and ice: measurement and modeling of climatic and hydrological impact, Adv. Atmos. Sci., 32, 64–91, 2015.
Qin, D. H., Liu, S. Y., and Li, P. J.: Snow cover distribution, variability, and response to climate change in western China, J. Climate, 19, 1820–1833, 2006.
Qiu, J.: The third pole, Nature, 454, 393–396, https://doi.org/10.1038/454393a, 2008.
Qu, B., Ming, J., Kang, S.-C., Zhang, G.-S., Li, Y.-W., Li, C.-D., Zhao, S.-Y., Ji, Z.-M., and Cao, J.-J.: The decreasing albedo of the Zhadang glacier on western Nyainqentanglha and the role of light-absorbing impurities, Atmos. Chem. Phys., 14, 11117–11128, https://doi.org/10.5194/acp-14-11117-2014, 2014.
Ramanathan, V., Li, F., Ramana, M. V., Praveen, P. S., Kim, D., Corrigan, C. E., Nguyen, H., Stone, E. A., Schauer, J. J., Carmichael, G. R., Adhikary, B., and Yoon, S. C.: Atmospheric brown clouds: Hemispherical and regional variations in long-range transport, absorption, and radiative forcing, J. Geophys. Res., 112, D22S21, https://doi.org/10.1029/2006JD008124, 2007.
Sand, M., Berntsen, T. K., Seland, O., and Kristjansson, J. E.: Arctic surface temperature change to emissions of black carbon within Arctic or midlatitudes, J. Geophys. Res.-Atmos., 118, 7788–7798, https://doi.org/10.1002/Jgrd.50613, 2013.
Skiles, S. M., Painter, T. H., Deems, J. S., Bryant, A. C., and Landry, C. C.: Dust radiative forcing in snow of the Upper Colorado River Basin: 2. Interannual variability in radiative forcing and snowmelt rates, Water Resour. Res., 48, W07522, https://doi.org/10.1029/2012wr011986, 2012.
Takahashi, Y., Higashi, M., Furukawa, T., and Mitsunobu, S.: Change of iron species and iron solubility in Asian dust during the long-range transport from western China to Japan, Atmos. Chem. Phys., 11, 11237–11252, https://doi.org/10.5194/acp-11-11237-2011, 2011.
Wang, M., Xu, B., Cao, J., Tie, X., Wang, H., Zhang, R., Qian, Y., Rasch, P. J., Zhao, S., Wu, G., Zhao, H., Joswiak, D. R., Li, J., and Xie, Y.: Carbonaceous aerosols recorded in a southeastern Tibetan glacier: analysis of temporal variations and model estimates of sources and radiative forcing, Atmos. Chem. Phys., 15, 1191–1204, https://doi.org/10.5194/acp-15-1191-2015, 2015.
Wang, X., Doherty, S. J., and Huang, J. P.: Black carbon and other light-absorbing impurities in snow across Northern China, J. Geophys. Res.-Atmos., 118, 1471–1492, 2013.
Wang, X., Xu, B. Q., and Ming, J.: An overview of the studies on Black Carbon and Mineral Dust deposition in Snow and Ice Cores in East Asia, J. Meteorol. Res., 28, 354–370, 2014.
Wang, X., Pu, W., Ren, Y., Zhang, X., Zhang, X., Shi, J., Jin, H., Dai, M., and Chen, Q.: Observations and model simulations of snow albedo reduction in seasonal snow due to insoluble light-absorbing particles during 2014 Chinese survey, Atmos. Chem. Phys., 17, 2279–2296, https://doi.org/10.5194/acp-17-2279-2017, 2017.
Warren, S. G.: Optical-Properties of Snow, Rev. Geophys., 20, 67–89, 1982.
Warren, S. G. and Wiscombe, W. J.: A Model for the Spectral Albedo of Snow. II: Snow Containing Atmospheric Aerosols, J. Atmos. Sci., 37, 2734–2745, 1980.
Warren, S. G. and Wiscombe, W. J.: Dirty Snow after Nuclear-War, Nature, 313, 467–470, https://doi.org/10.1038/313467a0, 1985.
Wedepohl, K. H.: The Composition of the Continental-Crust, Geochim. Cosmochim. Ac., 59, 1217–1232, 1995.
Xu, B. Q., Yao, T. D., Liu, X. Q., and Wang, N. L.: Elemental and organic carbon measurements with a two-step heating-gas chromatography system in snow samples from the Tibetan Plateau, Ann. Glaciol., 43, 257–262, 2006.
Xu, B. Q., Cao, J. J., Hansen, J., Yao, T. D., Joswia, D. R., Wang, N. L., Wu, G. J., Wang, M., Zhao, H. B., Yang, W., Liu, X. Q., and He, J. Q.: Black soot and the survival of Tibetan glaciers, P. Natl. Acad. Sci. USA, 106, 22114–22118, 2009a.
Xu, B. Q., Wang, M., Joswiak, D. R., Cao, J. J., Yao, T. D., Wu, G. J., Yang, W., and Zhao, H. B.: Deposition of anthropogenic aerosols in a southeastern Tibetan glacier, J. Geophys. Res.-Atmos., 114, D17209, https://doi.org/10.1029/2008jd011510, 2009b.
Xu, B. Q., Cao, J. J., Joswiak, D. R., Liu, X. Q., Zhao, H. B., and He, J. Q.: Post-depositional enrichment of black soot in snow-pack and accelerated melting of Tibetan glaciers, Environ. Res. Lett., 7, 014022, https://doi.org/10.1088/1748-9326/7/1/014022, 2012.
Yang, S., Xu, B. Q., Cao, J. J., Zender, C. S., and Wang, M.: Climate effect of black carbon aerosol in a Tibetan Plateau glacier, Atmos. Environ., 111, 71–78, 2015.
Yang, K., Ding, B., Qin, J., Tang, W., Lu, N., and Lin, C.: Can aerosol loading explain the solar dimming over the Tibetan Plateau?, Geophys. Res. Lett., 39, L20710, https://doi.org/10.1029/2012GL053733, 2012.
Yao, T. D., Thompson, L., Yang, W., Yu, W. S., Gao, Y., Guo, X. J., Yang, X. X., Duan, K. Q., Zhao, H. B., Xu, B. Q., Pu, J. C., Lu, A. X., Xiang, Y., Kattel, D. B., and Joswiak, D.: Different glacier status with atmospheric circulations in Tibetan Plateau and surroundings, Nat. Clim. Change, 2, 663–667, 2012.
Yasunari, T. J., Koster, R. D., Lau, W. K. M., and Kim, K. M.: Impact of snow darkening via dust, black carbon, and organic carbon on boreal spring climate in the Earth system, J. Geophys. Res.-Atmos., 120, 5485–5503, 2015.
Zhang, R., Hegg, D. A., Huang, J., and Fu, Q.: Source attribution of insoluble light-absorbing particles in seasonal snow across northern China, Atmos. Chem. Phys., 13, 6091–6099, https://doi.org/10.5194/acp-13-6091-2013, 2013a.
Zhang, R., Jing, J., Tao, J., Hsu, S.-C., Wang, G., Cao, J., Lee, C. S. L., Zhu, L., Chen, Z., Zhao, Y., and Shen, Z.: Chemical characterization and source apportionment of PM2.5 in Beijing: seasonal perspective, Atmos. Chem. Phys., 13, 7053–7074, https://doi.org/10.5194/acp-13-7053-2013, 2013b.
Zhang, Y. L., Kang, S. C., Li, C. L., Gao, T. G., Cong, Z. Y., Sprenger, M., Liu, Y. J., Li, X. F., Guo, J. M., Sillanpaa, M., Wang, K., Chen, J. Z., Li, Y., and Sun, S. W.: Characteristics of black carbon in snow from Laohugou No. 12 glacier on the northern Tibetan Plateau, Sci. Total Environ., 607, 1237–1249, 2017.
Zhou, Y., Wang, X., Wu, X., Cong, Z., Wu, G., and Ji, M.: Quantifying light absorption of iron oxides and carbonaceous aerosol in seasonal snow across northern China, Atmosphere, 8, 63, https://doi.org/10.3390/atmos8040063, 2017.


