the Creative Commons Attribution 4.0 License.
the Creative Commons Attribution 4.0 License.
 | 07 Oct 2019
The surface albedo of the Greenland Ice Sheet between 1982 and 2015 from the CLARA-A2 dataset and its relationship to the ice sheet's surface mass balance
Michalea D. King
Kati Anttila
The Greenland Ice Sheet is losing mass at a significant rate, driven in part by increasing surface-melt-induced runoff. Because the ice sheet's surface melt is closely connected to changes in the surface albedo, studying multidecadal changes in the ice sheet's albedo offers insight into surface melt and associated changes in its surface mass balance. Here, we first analyse the CM SAF Cloud, Albedo and Surface Radiation dataset from AVHRR data second edition (CLARA-A2) Surface Albedo (SAL), covering 1982–2015, to obtain decadal albedo trends for each summer month. We also examine the rates of albedo change during the early summer, supported with atmospheric reanalysis data from MERRA-2 (Modern-Era Retrospective analysis for Research and Applications, version 2), to discern changes in the intensity of early summer melt, and their likely drivers. We find that rates of albedo decrease during summer melt have accelerated during the 2000s relative to the early 1980s and that the surface albedos now often decrease to values typical of bare ice at elevations 50–100 m higher on the ice sheet. The southern margins exhibit the opposite behaviour, though, and we suggest this is due to increasing snowfall over the area.
We then subtract ice discharge from the mass balance estimates observed by the Gravity Recovery and Climate Experiment (GRACE) satellite mission to estimate surface mass balance. The CLARA-A2 albedo changes are regressed with these data to obtain a summer-aggregated proxy surface mass balance time series for the summer periods 1982–2015. This proxy time series is compared with latest regional climate model estimates from the MAR model to perform an observation-based test on the dominance of surface runoff in the magnitude and variability of the summer surface mass balance. We show that the proxy time series agrees with MAR through the analysed period within the associated uncertainties of the data and methods, demonstrating and confirming that surface runoff has dominated the rapid surface mass loss period between the 1990s and 2010s.
Finally, we extend the analysis to the drainage basin scale to examine discharge–albedo relationships. We find little evidence of surface-melt-induced ice flow acceleration at annual timescales.
- Article
(7550 KB) - Full-text XML
-
Supplement
(5265 KB) - BibTeX
- EndNote


The surface albedo of the Greenland Ice Sheet's ablation area has been shown to play a crucial role in determining melt variability through the snow/ice albedo feedback effect (Box et al., 2012). The study of these albedo changes over the last decade and a half from modern satellite sensors such as MODIS has drawn considerable research attention (Tedesco et al., 2011; Stroeve et al., 2013; Alexander et al., 2014; Tedstone et al., 2017). The observed albedo decreases are closely tied to the increasing mass loss of the ice sheet through the enhancement of its surface melt (Enderlin et al., 2014; van den Broeke et al., 2016). The ice sheet also loses mass through the ice calving at outlet glaciers, or discharge, the magnitude of which has recently been shown to demonstrate significant spatial and seasonal variability (King et al., 2018). The mass loss of the Greenland Ice Sheet has been shown to currently be among the leading contributors to sea level rise (Box et al., 2017a).
Legacy satellite sensors such as the Advanced Very High Resolution Radiometer (AVHRR) offer us the possibility to study the Greenland Ice Sheet's albedo changes of over a period of more than 3 decades, doubling the temporal coverage of MODIS. The drawback is lower spectral precision and coverage. Yet, considerable efforts have recently been paid to the intercalibration of the AVHRR sensor family (Heidinger et al., 2010), greatly improving the sensors' capabilities to detect long-term trends in surface albedo. Here, we use the sensor-intercalibrated 34-year (1982–2015) surface albedo data record from the CLARA-A2 dataset family (Karlsson et al., 2017a) to study the albedo changes of the ice sheet at decadal scales.
Our analyses focus on the summer months between May and August (MJJA), comprising four topics. First, we calculate and present the trends in surface albedo (defined here as the directional–hemispherical reflectance of the surface, i.e. black-sky albedo or “inherent” albedo) over the ice sheet for each respective month. In addition to the trends for the full 1982–2015 period, we present temporally subsetted trends consistent with the MODIS observation era (2000–2015) and the pre-MODIS era (1982–1999), in part to compare our results with the trends identified from the latest editions of MODIS data (Casey et al., 2017) and also to offer a rare, if somewhat more uncertain, look into the ice sheet's surface changes in the 1980s and 1990s. Treating each month individually additionally allows us to delineate between albedo changes in the early and late melting season.
Second, we examine changes in melt intensity and speed through changes in the rate of albedo decrease and in the spatial distribution of albedo values indicative of bare ice and wet snow as the summer melt progresses. At this stage we also analyse atmospheric reanalysis data to discern if the observed changes may be explained by precipitation or air temperature anomalies.
Third, we conduct an observation-driven test for the dominance of surface runoff in the interannual variability of May–August surface mass balance (SMB) of the ice sheet. We calibrate discharge-corrected, gravimetrically observed SMB with the CLARA surface albedo to form a summer-aggregated proxy SMB. When compared against the SMB from a state-of-the-art regional climate model for the ice sheet (MAR, Fettweis et al., 2017), we expect to find good covariability only if surface runoff dominates SMB variability, as that is the sole term which can be considered well-correlated with albedo changes.
Finally, we downscale the analysis to six major drainage basins of the ice sheet. Again assuming that surface albedo changes are an acceptable proxy for surface runoff production, we examine the albedo–discharge relationships to ascertain from an observational basis if inferred surface melt anomalies correlate with the interannual variability in ice discharge.
2.1 CLARA-A2 SAL surface albedo dataset
The satellite-based surface albedo dataset used here is the Satellite Application Facility on Climate Monitoring (CM SAF) Cloud, Albedo and Surface Radiation data record CLARA-A2 SAL, funded by the European Organization for the Exploitation of Meteorological Satellites (EUMETSAT). It covers the years 1982–2015 and is based on intercalibrated AVHRR data. The retrieved albedo is defined as directional–hemispherical albedo for the wavelength range 0.25–2.5 µm (for snow and ice), and the observations are provided in a 0.25∘ latitude–longitude or a 25 km EASE grid for the polar regions. The algorithm accounts for topography corrections over mountainous regions as well as dynamic aerosol depth (Jääskeläinen et al., 2017). However, over the Arctic where dynamic aerosol loading is difficult to estimate and typically exhibits a limited variability, a constant value of 0.1 at 550 nm is used. We do not consider September in this analysis, as worsening illumination conditions make retrievals more uncertain and prevent full coverage over the ice sheet.
The albedo of snow- and ice-covered areas is derived by averaging the broadband bidirectional reflectance values of the AVHRR overpasses into 5 d or monthly means, relying on wide AVHRR swaths and temporal aggregation to provide dense sampling of the viewing hemisphere, which forms the albedo estimate (Riihelä et al., 2013). The sampling rate has been further improved by the expansion of the AVHRR constellation from the mid-1990s onward. The CLARA dataset uses data from NOAA-7 to NOAA-19, as well as MetOp-A and B (Karlsson et al., 2017a). A critical feature of the CLARA dataset family is that it is based on an intercalibrated Fundamental Climate Data Record (FCDR) of observed AVHRR radiances, where the calibration differences between satellites have been removed by use of a variety of techniques (Heidinger et al., 2010).
The data record has been validated against in situ data (Anttila et al., 2016) and compared to the MODIS black-sky albedo product MCD43 (Schaaf et al., 2002). Comparisons between CLARA-A2 SAL and in situ measurements on the ice sheet have yielded RMSE between 0.04 and 0.07 over the more stable accumulation zone with no obvious systematic over- or underestimation tendencies and a RMSE of ∼0.11 over a site (JAR2) in the ablation zone. It should be noted that it has recently been shown that point-to-pixel evaluation of surface albedo retrievals over the heterogeneous surfaces of the ablation zone, particularly in the southwest, cannot be expected to yield true estimates of retrieval quality when the spatial resolution of the estimate is in the kilometre range (Moustafa et al., 2017), as is certainly the case for CLARA-A2 SAL.
A critical attribute for the surface albedo time series from the viewpoint of trend determination is its stability. Here, we demonstrate the stability of CLARA-A2 SAL by examining the monthly mean albedo over a small region in the central part of the ice sheet between 73 and 75∘ N latitude, and 38 and 42∘ W longitude. The ice sheet's uppermost parts have a naturally stable surface albedo, and therefore variations in the albedo estimates may be considered to primarily result from algorithm uncertainty. The mean surface albedo for this area is shown as a time series in Fig. 1 for the months between May and August (MJJA). As can be seen, the variability about the 34-year interannual mean largely falls within the reported 5 % (relative) accuracy, although individual grid-cell-scale albedo retrievals may display larger uncertainty as a function of cloud masking efficiency, surface sampling rate, and uncertainty in the atmospheric correction of the satellite imagery. Still, we observe no obvious trends in the albedo of this region. The widespread surface melt of 2012 was relatively short-lived over this area (Bennartz et al., 2013) and thus did not appreciably impact the albedo, as also shown from MODIS data (Box et al., 2017b).
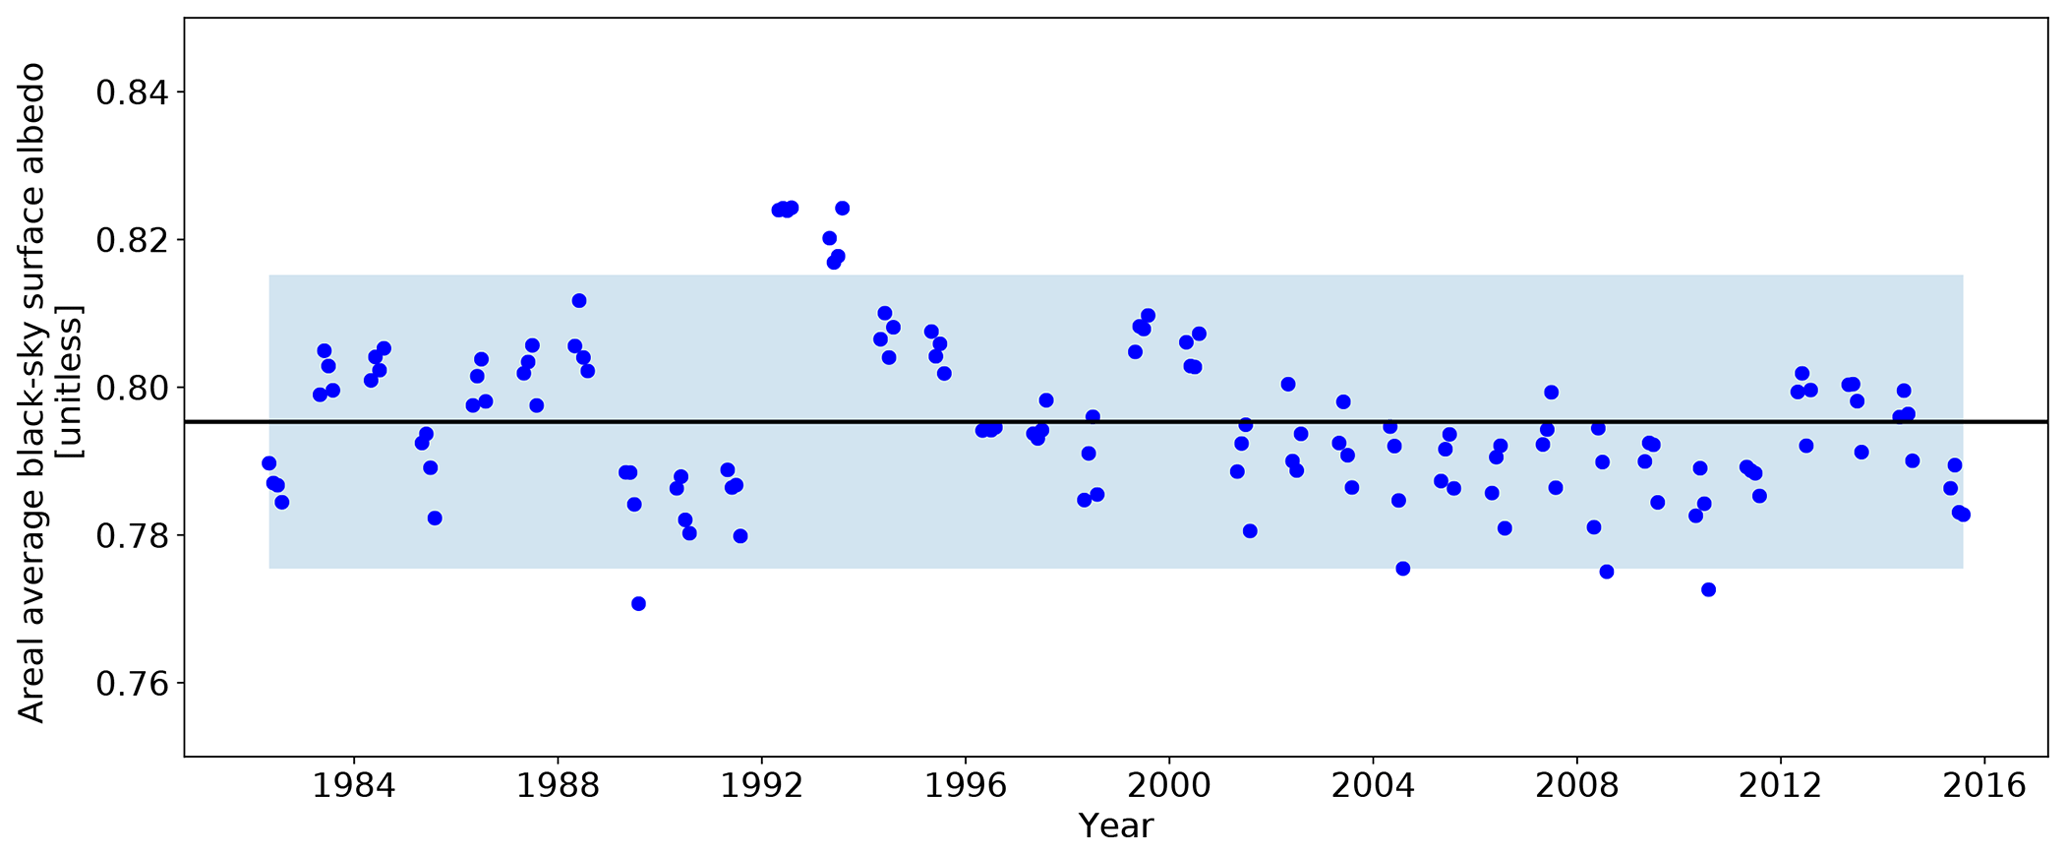
Figure 1Stability of CLARA-A2 SAL over 73–75∘ N, 38–42∘ W, on the central part of the Greenland Ice Sheet. Spatially averaged monthly mean albedo retrievals between May and August shown. The black line shows the 34-year mean albedo of the area. Light blue shading shows ±0.02 albedo variability about the interannual mean, corresponding to the reported upper accuracy estimate of 5 % relative for CLARA-A2 SAL over snow and ice.
A notable deviation from the interannual mean albedo occurs over the years 1992 and 1993. The cause of this is known. The eruption of Mt Pinatubo, on 15 June 1991, injected vast quantities of aerosols and dust into the atmosphere. This altered the atmospheric composition on a global scale for the next 2–3 years. Stroeve (2001) attributed a concurrent increase in observed Greenland Ice Sheet albedo to the cooling effect of the additional stratospheric aerosols. While we see a similar effect in the CLARA data, it should be noted that the atmospheric correction necessary to derive surface reflectances from AVHRR observations in CLARA depends on the aerosol loading being correct. Larger aerosol loading conditions over bright snow are challenging for the atmospheric correction algorithms. It is difficult to deconvolve cooling-induced albedo increase from potential artefacts resulting from an incomplete characterization of the atmosphere. We therefore exclude these years from the analysis but otherwise conclude that the time series appears stable enough for trend analysis. The observed variability envelope shall form the first, but not only, boundary condition for evaluating the significance for any obtained trends, as explained in detail in Sect. 2.7.2.
To exclude the non-glaciated surfaces of Greenland from the analysis, the PROMICE ice mask (Citterio and Ahlstrøm, 2013) was resampled into the CLARA grid and all grid cells with a fractional ice cover of less than 50 % were discarded. We also attached surface elevation data into the CLARA dataset from CLARA grid-resampled digital elevation model by Helm et al. (2014).
2.2 MAR regional climate model
The regional climate model data comes from the Modèle Atmosphérique Régional (MAR) model (version 3.5.2) (Fettweis et al., 2017). Here, we use the model run data forced with the ERA-Interim atmospheric reanalysis for the period 1979–2014. To obtain the MJJA surface mass balance from MAR, we first extract the monthly surface mass balance fields, correct for the variation in grid cell areas in the model domain, mask out all grid cells with fractional ice cover less than 50 % for consistency with the CLARA data, and sum the MJJA output.
2.3 Ice discharge estimates
Here we use continuous estimates of ice discharge from all large Greenland outlet glaciers over the 2000–2015 period, taken from King et al. (2018). These glacier-scale time series are derived by incorporating changes in glacier velocity, from both radar and optical imagery, and changes in glacier thickness calculated from time-varying surface elevation data. With high temporal and spatial resolution, these records allow for ice-sheet-wide and basin-scale sub-monthly changes in ice discharge, hereafter referred to as D, to be compared with albedo-based meltwater proxies.
2.4 MERRA-2 atmospheric reanalysis and the Greenland Blocking Index (GBI)
The Modern-Era Retrospective analysis for Research and Applications, version 2 (MERRA-2), is a global atmospheric reanalysis of the modern satellite era, covering the period from 1980 to the present day (Gelaro et al., 2017). Operating at 72 atmospheric levels with a spatial resolution of 0.5 by 0.625∘, MERRA-2 ingests a wide variety of satellite observations and features for example observation-based corrections of the model precipitation field and a sophisticated treatment for atmospheric aerosols.
The representation of glaciated surfaces has also received substantial attention in the development of MERRA-2 (Cullather et al., 2014). It was also recently shown that the surface air temperatures (SATs) in MERRA-2 are well aligned with station observations across the ice sheet (Reeves Eyre and Zeng, 2017). For these reasons, we selected MERRA-2 to provide (winter) precipitation and SAT data for our analysis.
The Greenland Blocking Index (GBI) used here is defined as the weighted mean 500 hPa geopotential height over a region bounded by 60–80∘ N and 20–80∘ W. The dataset is obtained from the NOAA Earth System Research Laboratory (ESRL) and based on Hanna et al. (2013).
2.5 Mass balance estimates from GRACE satellite observations
The gravimetric mass balance data used here are from the Greenland Ice Sheet Climate Change Initiative (CCI) project, based on Gravity Recovery and Climate Experiment (GRACE) satellite pair measurements and the GRACE ITSG-Grace2016 gravity field model (Mayer-Gürr et al., 2016). The data cover 2003–2015, as prepared by the Technical University of Dresden (Groh and Horwath, 2016).
The CCI mass balance estimates are based on a point mass inversion method following Forsberg and Reeh (2006), Sørensen and Forsberg (2010), and Barletta et al. (2013). A notable feature in the use of GRACE for the mass loss estimation is that the gravimetric signals from outer ice caps and small glaciers are not distinguishable from the ice sheet gravity changes. However, on the scale of the whole ice sheet, the optimal mass balance solution needs to contain this contribution. As the ice sheet extent defined for CLARA also contains any outer glacier or ice cap grid cells if their ice coverage is sufficiently large, there is no major discrepancy in the combined use of GRACE and CLARA data.
2.6 Surface albedo dataset from MODIS (MOD10A1)
We obtained the latest (Collection 6) MODIS-based ice sheet surface albedo data from the MOD10A1 time series (Hall et al., 1995) for comparison with the CLARA-A2 SAL. These data are provided in 5 km spatial resolution as daily means between 2000 and 2017, as well as feature denoising, gap filling, and bias correction procedures as described in Box et al. (2017b). For the comparison, these data are reprojected to the 25 km CLARA grid with radial weight resampling, and grid cells with ice cover less than 50 % were discarded.
2.7 Methods
2.7.1 Study area definitions
As mentioned, here we define the ice sheet extent through the use of the PROMICE ice mask (Citterio and Ahlstrøm, 2013) using a threshold of 50 % for fractional ice cover as the inclusion condition. Basin-scale analyses were done using the six basin boundaries based on Sasgen et al. (2012), with the modification that we combine their basins D and E into our basin 4. The basin delineation and ice sheet extent are illustrated in Fig. 2.
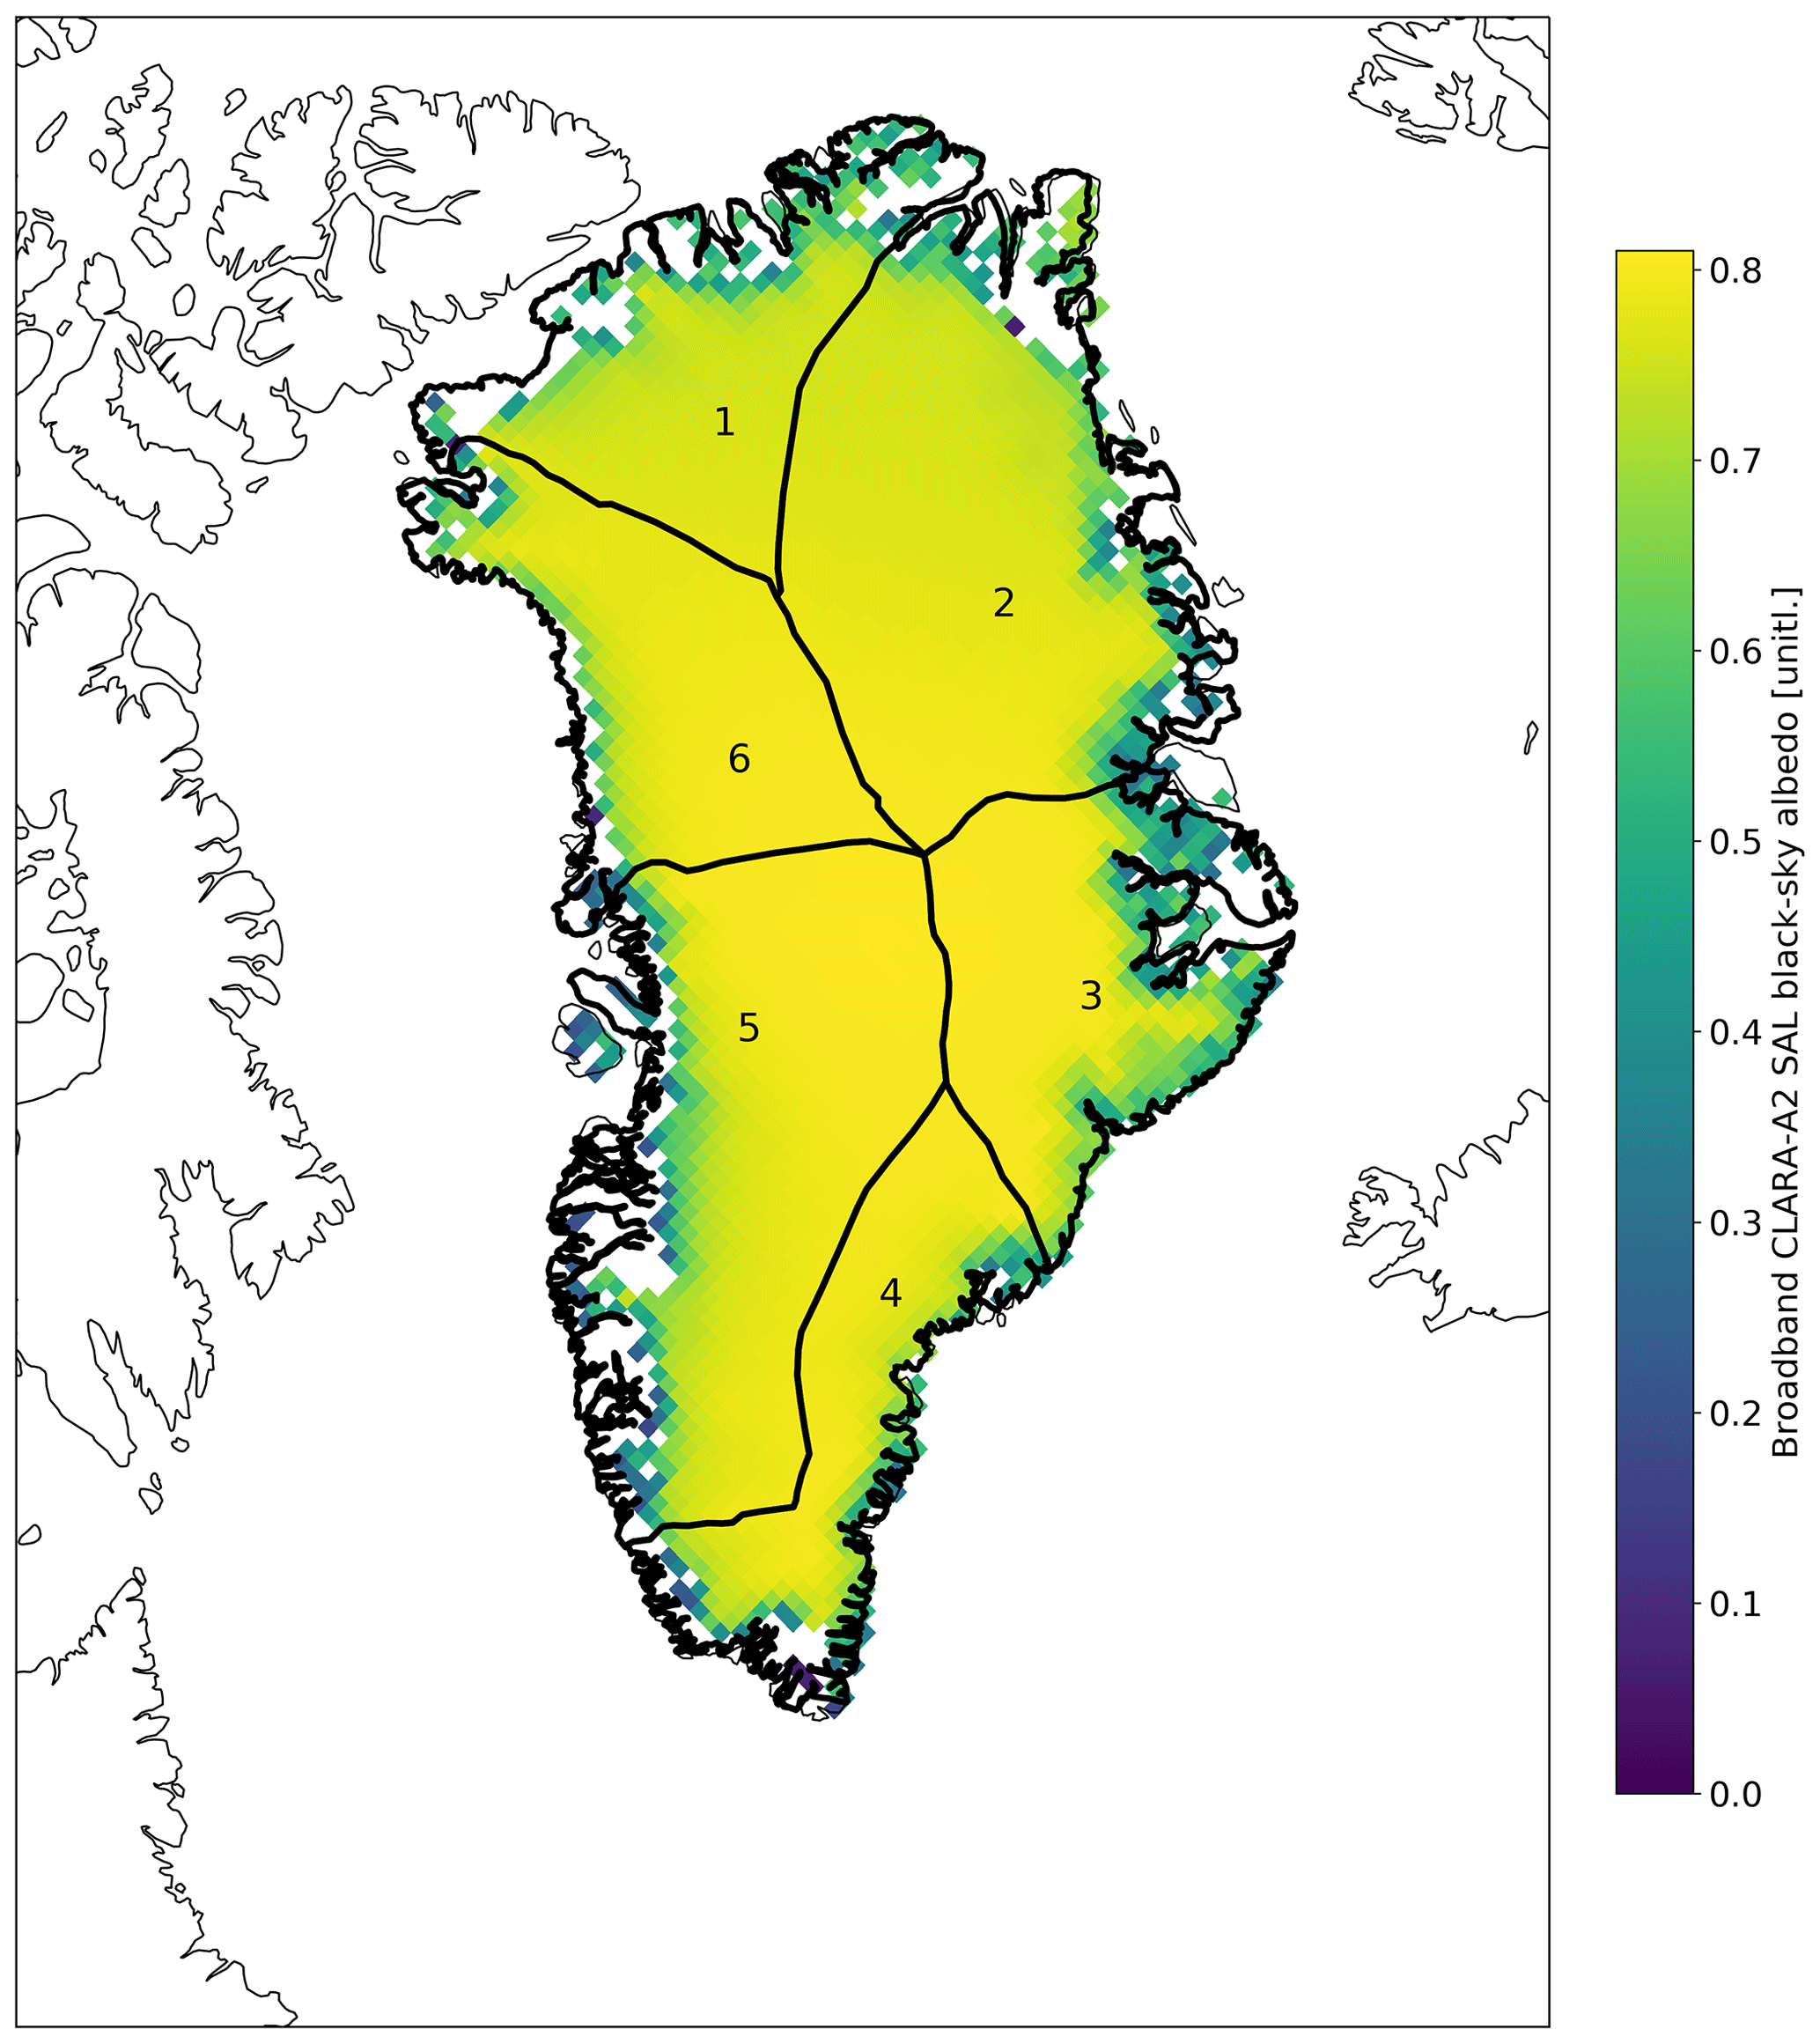
Figure 2Ice sheet drainage basins as used in this study. Basin boundaries overlaid on an example of CLARA-A2 SAL monthly mean surface albedo from June 2010.
2.7.2 Trend assessment
All trends shown here have been calculated as Theil–Sen estimators, i.e. as the median of all possible slopes between data pairs in the examined dataset (Theil, 1950; Sen, 1968). The Theil–Sen estimator is robust against outlier influence compared to ordinary least squares regression. This feature is highly useful in trend analysis of CLARA-A2 SAL data over the ice sheet, where misclassified clouds may contribute noise into the clear-sky surface albedo estimates (Karlsson et al., 2017a).
The trends in surface albedo were deemed significant only if both of the following conditions were met. First, the observed trend slopes were non-zero at the 95 % confidence interval. Second, the decadal albedo trends were larger than 0.015 per decade. The latter condition largely follows the analysis by Casey et al. (2017) for the MODIS Collection 6 surface albedo, who considered a decadal trend of 0.01 as the limit of MODIS observability. We have tightened that limit to 0.015 for CLARA to account for the less precise radiometric accuracy of AVHRR, which remains even after the considerable intercalibration work done on the CLARA input radiances (Heidinger et al., 2010). We finally note that while the observed trend magnitudes were largely insensitive to the choice of CLARA input data (5 d or monthly means), monthly means are used for the decadal trend calculations when shown here.
2.7.3 Melt rate and ice exposure calculations
In order to examine changes in the intensity of melt across the ice sheet margins during our 1982–2015 study period, it is necessary to estimate two parameters: the melt rate, expressed as albedo decrease per day during the melting season; and a yes/no condition for determining if a particular area of the ice sheet melted substantially enough to be composed primarily of bare ice and wet snow. The detection of melt onset is challenging, as reductions in albedo typically begin gradually and sporadic snowfall events may reset the albedo to the pre-melt range. We tested the use of a sophisticated Gaussian process (GP)-based change point detection algorithm implemented following Fearnhead (2006) and Xuan and Murphy (2007), but the gradual impact of melt onset in the albedo data proved too difficult to capture with such a probability-based change point detection method.
We then implemented a simpler scheme, in which the 5 d albedo record between May and August for each grid cell and year is first smoothed with a GP regressor algorithm with a Mátern kernel to contain 120 data points, corresponding to a temporal resolution of ∼1 d. The smoothed data series is evaluated to find the first sample after early May for which the albedo value deviates more than 2 standard deviations from the preceding early summer albedo mean. The melt rate estimate is then taken to be the albedo difference between that value and the summer minimum albedo, divided by the time between the two events. As this method may be expected to provide reasonable melt rate estimates only for the ice sheet margins where significant seasonal albedo dynamic exists, we present the melt rates only for areas where the surface elevation is less than 2200 m a.s.l.
For the detection of bare ice and wet snow surfaces, we first note that melting bare ice surfaces around the ice sheet margins generally have surface albedos in the range of 0.5 to 0.65 (Bøggild et al., 2010), although significant amounts of impurities at the ice surface may of course further reduce the albedo. This albedo range is also applicable for wet snow areas with significant melt ponding. We therefore selected an empirically suitable threshold albedo of 0.58 and observed the CLARA grid cells in which the surface albedo reaches this value for each year in the study period. Changes in the melt rate and distribution of bare ice/wet snow areas were studied by comparing 3-year means at the beginning and end of the full study period (1982–2015), as well as the MODIS (2000–2015) and pre-MODIS (1982–1999) eras. For the continuous melt rate estimates, trends for these time periods were further determined using the Theil–Sen estimator as described in Sect. 2.7.2.
2.7.4 Forming a surface mass balance proxy from surface albedo observations to test surface runoff dominance in summer-aggregated SMB
The mass balance of the ice sheet may be expressed as (e.g. van den Broeke et al., 2017)
where SMB is the ice sheet's surface mass balance, and D represents the summed solid ice discharge from all large marine-terminating outlet glaciers. Furthermore, the surface mass balance may be expressed as (e.g. van den Broeke et al., 2017)
where Ptot is the sum total of snowfall and rainfall, SUtot represents the total sublimation, ERds represents surface snow mass lost via wind-driven erosion, and RU represents meltwater runoff.
An earlier study by Colgan et al. (2014) presented the idea that, because of the very strong impact of surface melt on the ice sheet's surface mass balance (e.g. van den Broeke et al., 2016), the ice sheet average surface albedo could serve as a meaningful and stationary proxy for the melt season mass balance (MB) dynamic when calibrated against gravimetric mass balance observations from the Gravity Recovery and Climate Experiment (GRACE) satellite pair. However, the full mass balance of the ice sheet includes dynamic ice losses from glacier discharge, to which surface albedo is insensitive. Expanding on the original idea, we correlated CLARA-observed surface albedo and GRACE-based SMB changes in order to infer a proxy SMB time series from the CLARA surface albedo dataset.
To obtain the proxy, we first add the monthly MB change record from GRACE data and the state-of-the-art discharge (D) estimates from recent work by King et al. (2018) to obtain a GRACE-based SMB estimate. Then, a linear regression is sought between the new GRACE SMB estimate and CLARA monthly mean ice sheet albedo for all MJJA months in the overlap period 2003–2015 for which valid GRACE data exist (N=45). The regression period thus contains data from the period of rapid ice sheet mass loss in the 2000s, as well as from the years 2013–2015 when the mass loss had somewhat decelerated. The regression parameters are used to create summed MJJA surface mass balance proxy data from CLARA/GRACE for 1982–2015 for comparison with corresponding MAR SMB. The variability range observed for the central ice sheet albedo in CLARA (0.02) is taken to be the uncertainty range of the proxy SMB. For comparison, we also calculate and present the proxy SMB from the most recent MOD10A1 data as described earlier, using the same methods as for CLARA.
While surface albedo is correlated with surface runoff at the summer-aggregated scale, the relationship with the other SMB terms in Eq. (2) is less certain. Albedo initially increases with snowfall, but saturates at fresh snow albedo levels (> 0.8) once the fresh snow layer is optically semi-infinite, regardless of how much additional snowfall occurs after that. Rainfall produces the opposite effect, increasing mass but decreasing albedo, although at the summer-aggregated scale some of the rainfall near the ice sheet margins may be quickly lost as runoff, depending on the firn retention properties. The modelling-based finding that surface runoff dominates the MJJA surface mass loss (e.g. van den Broeke et al., 2017, and references therein) is therefore confirmed in this test only if the SMB proxy exhibits a strong degree of covariability with the MAR SMB.
It should be noted that use of this regression method is not suited for deriving a proxy SMB for a specific month or location on the ice sheet. This is particularly the case for the early summer (May), where surface melt is less important than precipitation for SMB changes. In terms of the MJJA aggregate, however, the early summer SMB variability is small compared to the total, thus incurring no greater uncertainty in the proxy than that already propagated from the albedo retrieval uncertainty itself.
3.1 Greenland surface albedo trends, 1982–2015
The Theil–Sen decadal albedo trend estimates are shown in Fig. 3. Here, we omit the years 1992 and 1993 from analysis as their albedo estimates are likely both externally forced and less reliable. Over the full CLARA period, we note that ice sheet albedo has largely remained stable during the early summer months of May and June, though some of the outermost ice sheet margins in the north and east show statistically significant albedo decrease in June. However, in July and August, we observe significant and negative albedo trends along most of the ice sheet margins. Analysing the CLARA subperiods corresponding the pre-MODIS and MODIS eras (Fig. 3, centre and bottom rows), we find that the majority of the albedo decrease signal originates after 2000, with a strong albedo decrease (up to −0.05 per decade as an area average, individual grid cells may reach −0.1 per decade) along the Kangerlussuaq sector on the west margin. The MODIS era trends are consistent in magnitude and pattern with those presented by Casey et al. (2017) from the latest MOD10A1/MYD10A1 time series (see also Supplement).
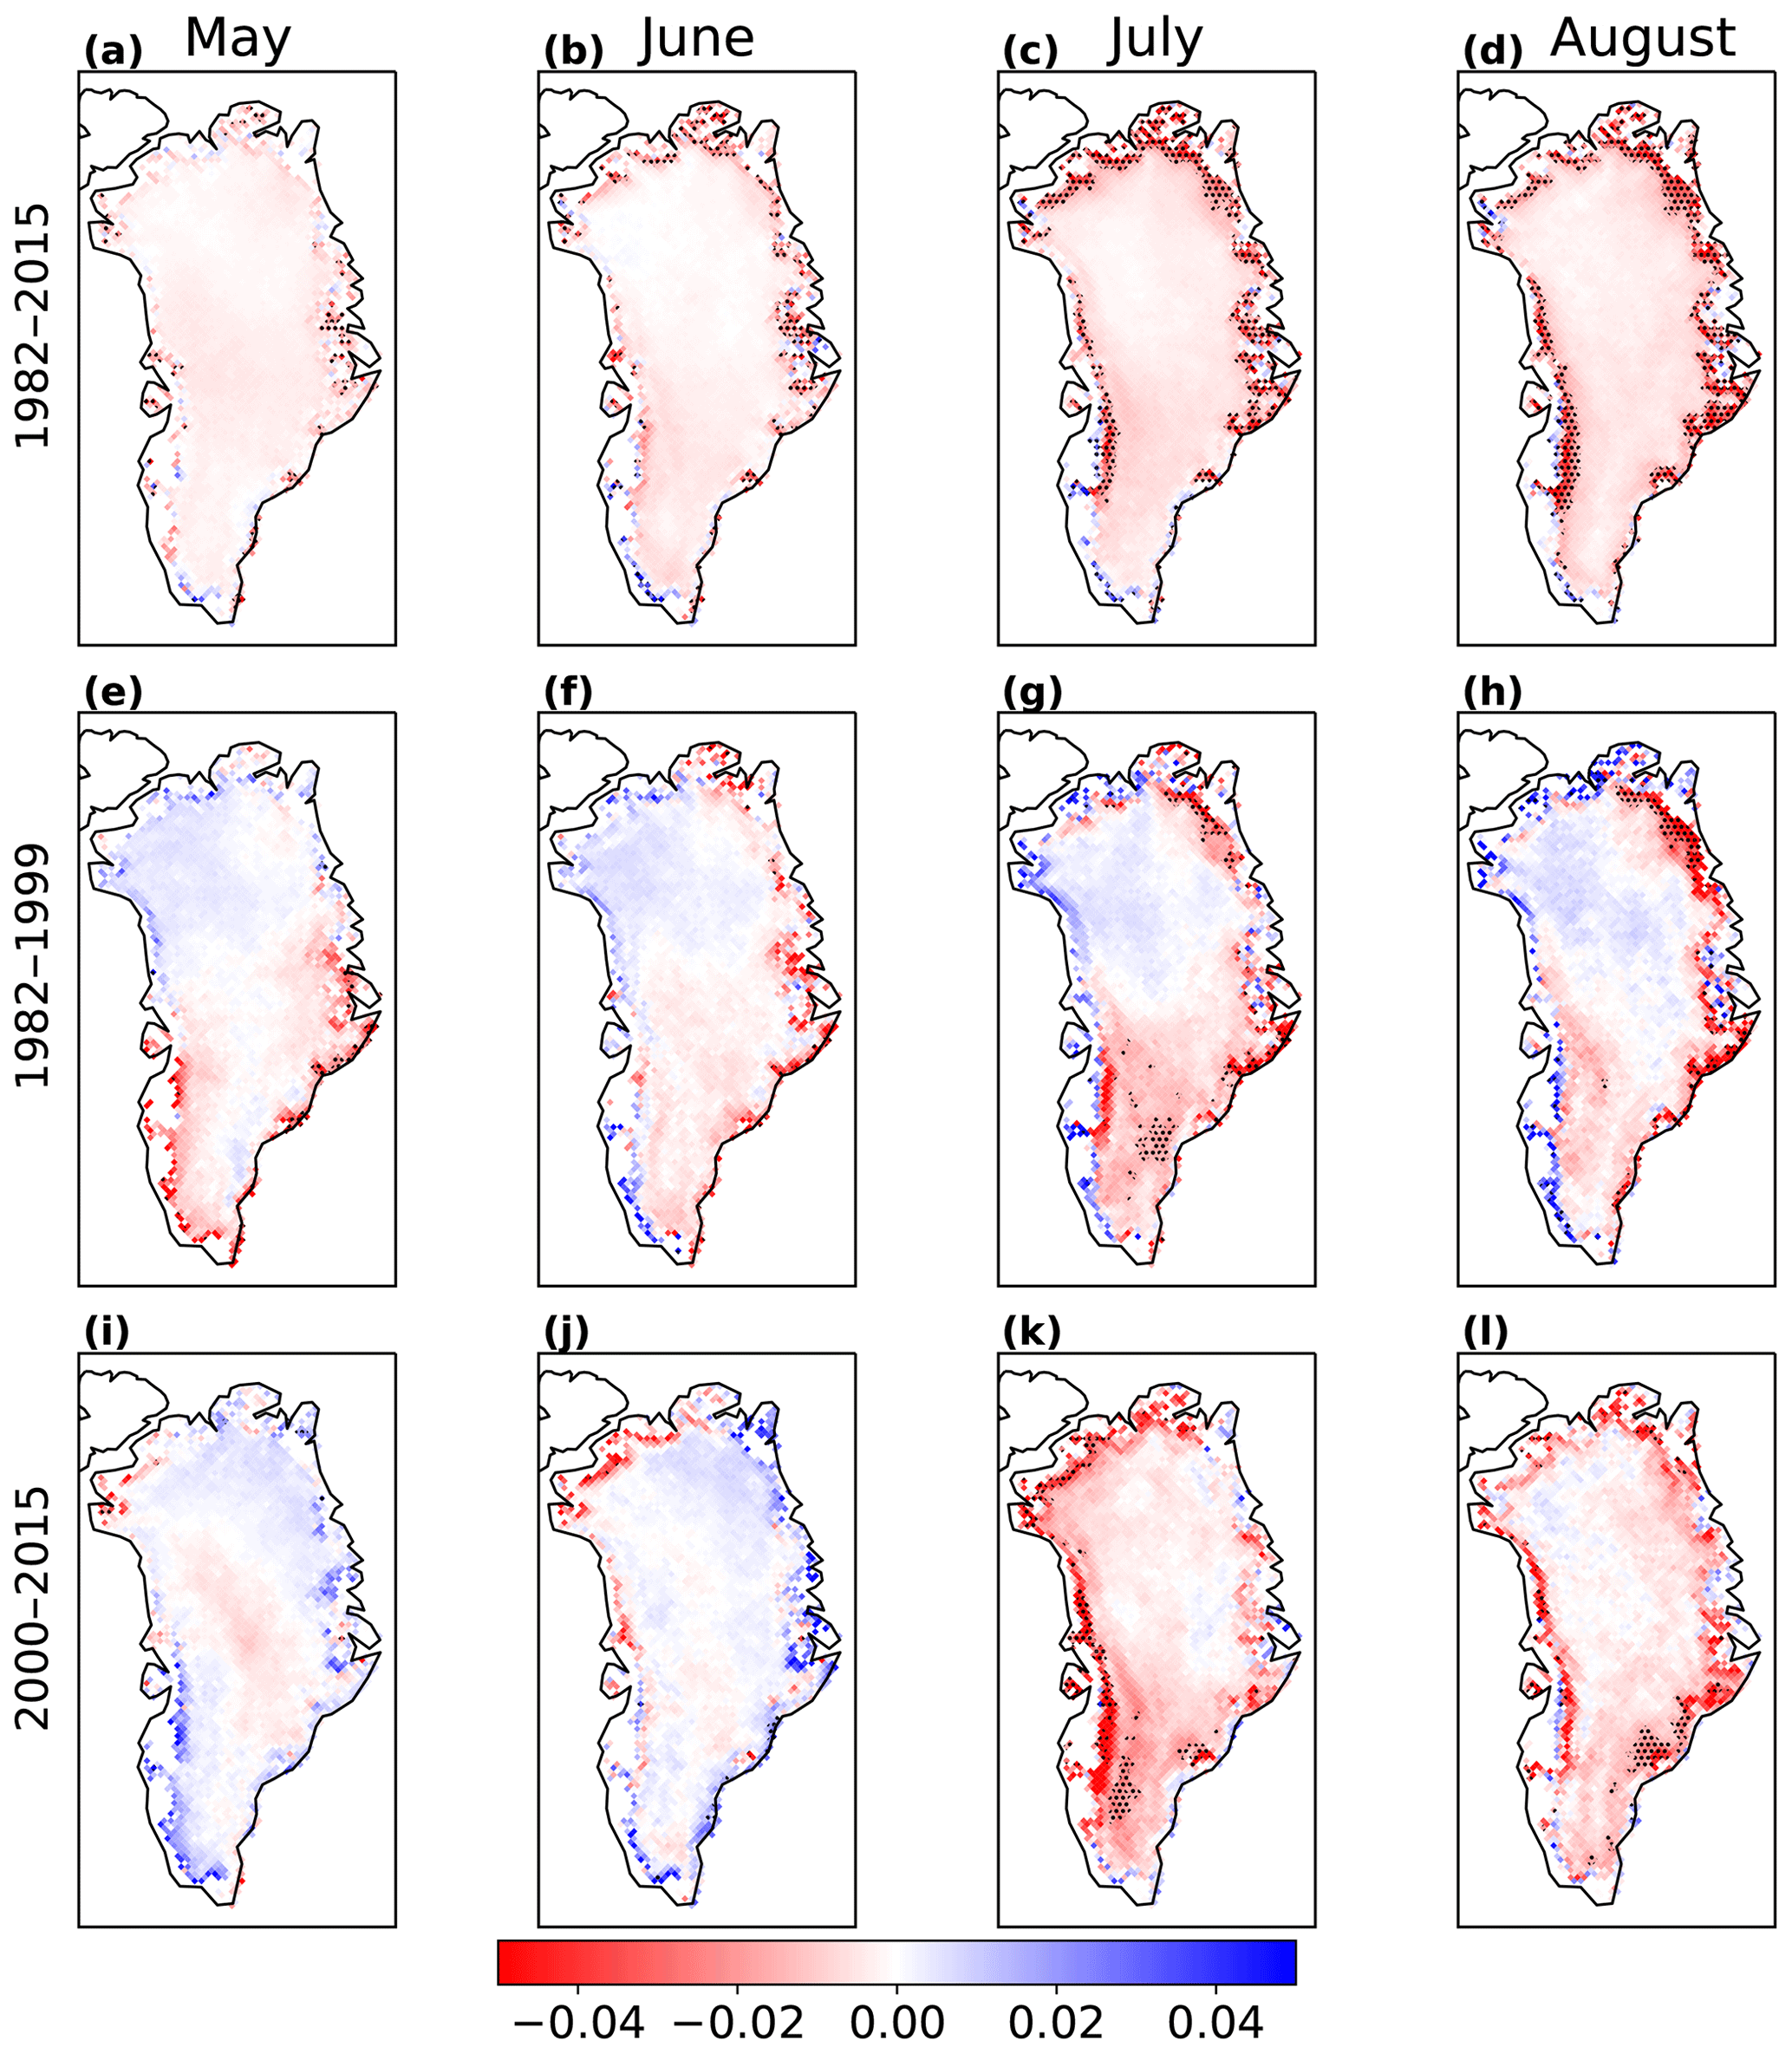
Figure 3Theil–Sen decadal albedo trends over the ice sheet from CLARA-A2 SAL during 1982–2015 (a–d), 1982–1999 (e–h), and 2000–2015 (i–l). Columns correspond to the summer months May–August from left to right. The hatched regions in the trend figures indicate areas over which the trend is significant (i.e. non-zero slope) at the 95 % confidence level, and its magnitude exceeds the uncertainty limit of 0.015 per decade. Years 1992 and 1993 are excluded. Colour bar is limited to highlight majority values.
For the pre-MODIS era of 1982–1999, we note that while the ice sheet's albedo was mostly stable according to CLARA, significant negative decadal trends in late-summer albedo (Fig. 3g and h) manifest over the northeast ice sheet. The cause of this albedo decrease remains unclear at present. Based on in situ energy balance measurements over this area during summer of 1994, Konzelmann and Braithwaite (1995) argued that surface melt in the region was primarily driven by net radiative fluxes during a relatively cloudless summer. They also note that the relatively high downslope wind speeds increase the importance of turbulent fluxes, possibly making the area more sensitive to near-surface air temperature anomalies. Mouginot et al. (2015) also reported an increase in modelled runoff in this area from the late 1980s onward, which is consistent with the negative albedo trend seen here. Some significant negative albedo trends are also apparent on the eastern margin, particularly along the Blosseville Coast. Box et al. (2006) noted similar trends (in blue-sky albedo) based on an early version of the Polar Pathfinder extended (APP-x) dataset in the same area for the 1988–1999 period for the region. In contrast, though, they found no negative albedo trends in the northeast.
Because the Theil–Sen trend estimator is defined as the median of all possible slopes between data points in a time series, the subperiod trends shown in Fig. 3 do not necessarily sum up to the trends over the full 1982–2015 period. However, because the albedo trends from MODIS time series data have been extensively studied, we felt that presentation of the subperiod trends is important to compare results.
The subperiod division used here is also useful in that the clear change in late-summer albedo trends between 1982–1999 and 2000–2015 is fully consistent with a documented change in atmospheric regime over the ice sheet which began to favour high-pressure blocking patterns, as well as northward transport of warm and moist air, increasing near-surface air temperatures and enhancing downward longwave energy fluxes, all of which are features which promote surface melt (e.g. Box et al., 2012; Hanna et al., 2013; Mioduszewski et al., 2016; Välisuo et al., 2018). Some of the other potential causes of the recent darkening of the western margin include increasing biological activity (algae growth; Ryan et al., 2018) and previously deposited impurities emerging from the ice with each melting season, although recent field measurements have not detected evidence of this (Polashenski et al., 2015).
Stroeve (2001) analysed the Pathfinder surface albedo record, also from AVHRR observations, obtaining negative blue-sky albedo trends over a set of in situ measurement sites across the ice sheet during 1981–1998. The study noted, however, that the trends were not statistically significant and were largely driven by the anomalously low albedos observed during the summer of 1998, a feature present in CLARA as well. Yet our 1982–1999 subperiod sees few substantial albedo decreases apart from the northeastern and eastern margins. The difference to the earlier study is likely attributable to three factors. First, the CLARA record is based on a more sophisticated AVHRR intercalibration and comprises of more satellites carrying the instrument relative to Pathfinder. Second, the Theil–Sen trend estimator used here is resistant against outlier influence in trends, such as that from the low-albedo summer of 1998. And, thirdly, the Pathfinder albedo record quantified the blue-sky albedo of the ice sheet, thus containing an influence of variable cloud cover, whereas the CLARA record describes the black-sky albedo, which is an inherent property of the surface itself under unidirectional illumination.
We finally observe that some of the outermost grid cells of for example the western edge of the ice sheet display very small negative or even positive trends for all studied months. This finding, while somewhat surprising, is consistent with earlier field observations stating that the outermost zone of the ice sheet margin consists of clean ice, effectively drained of meltwater by ubiquitous crevasses and moulins (Knap and Oerlemans, 1996) and containing fewer biotic or abiotic impurities, and thus resistant to albedo decreases caused by enhanced melting. However, we note that with the relatively coarse spatial resolution of CLARA, the outermost grid cells are mixed pixels even after the exclusion of grid cells with < 50 % ice cover. The albedo of these pixels includes relatively constant values of the bare soil surrounding the ice, which could also explain the observed stability. In any event, the impact of these areas on the overall ice sheet albedo trends is negligible.
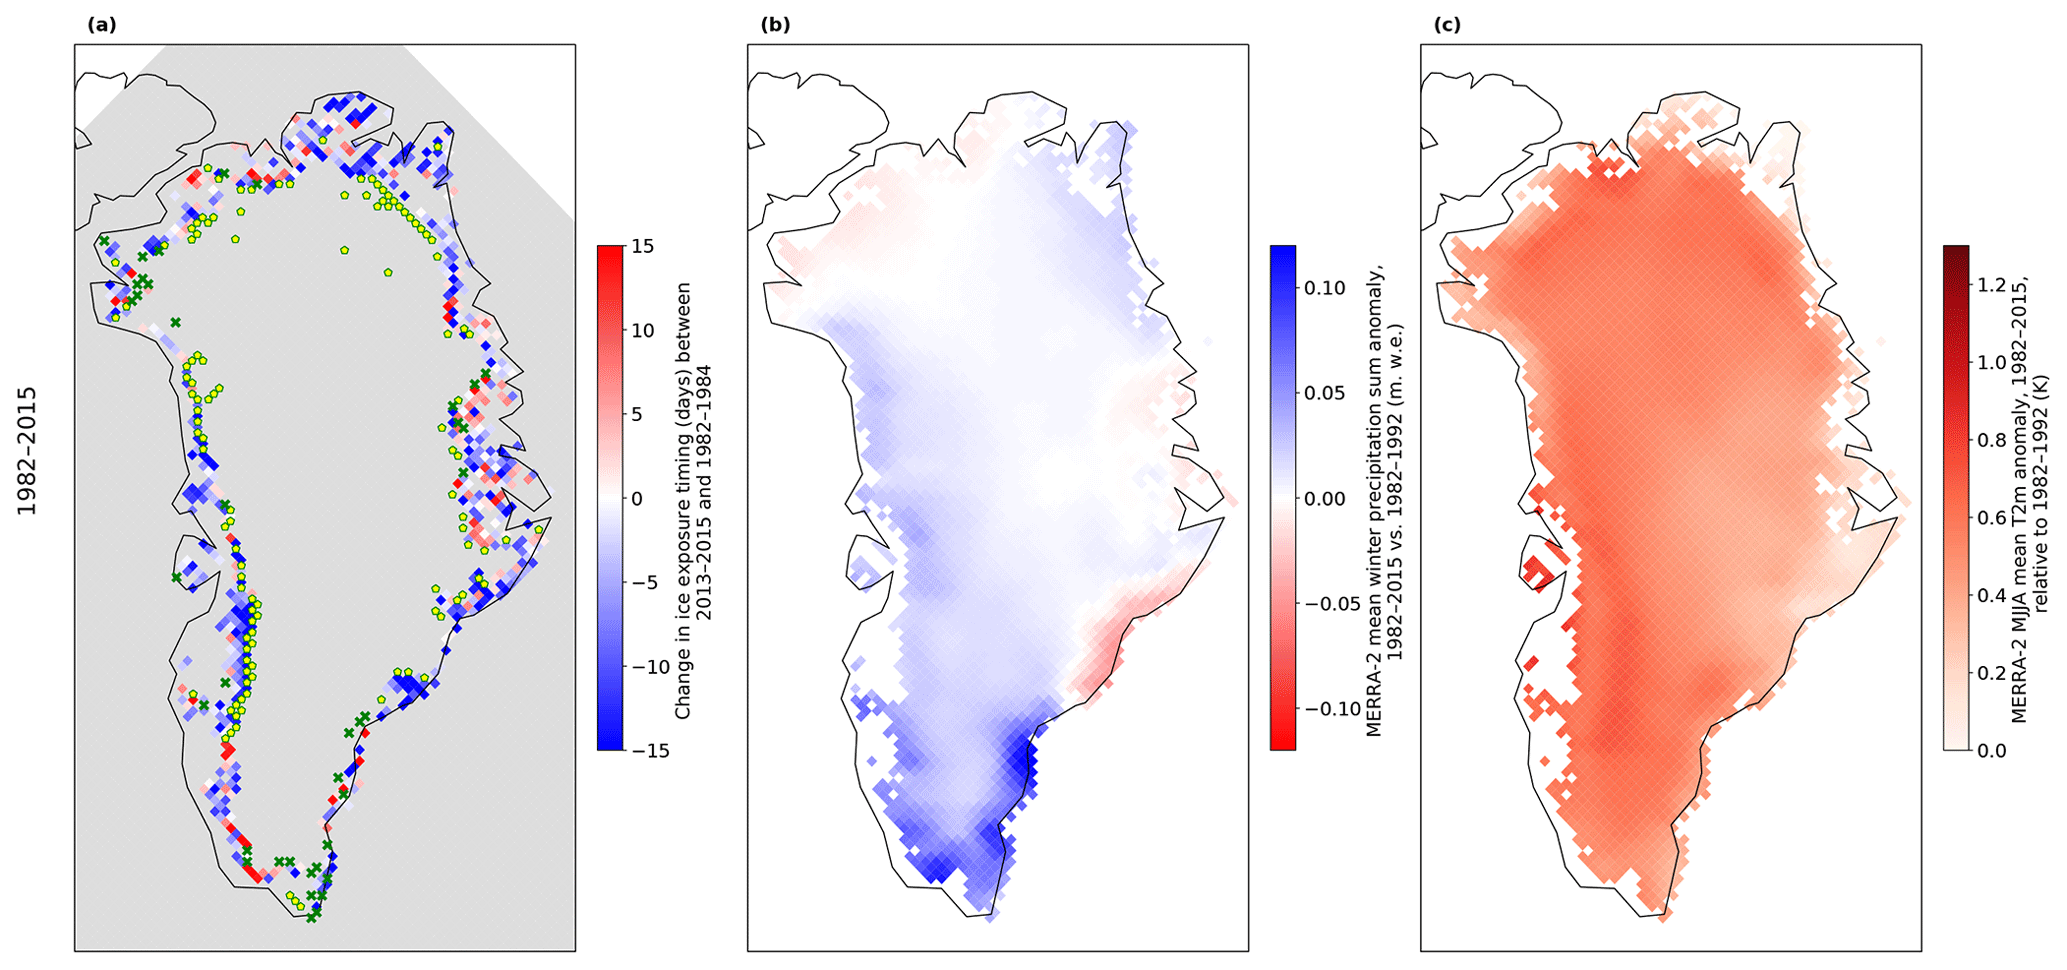
Figure 4(a) Changes in time required (days) to reach bare-ice-typical albedos between averaged periods 2013–2015 and 1982–1984. Green-yellow pentagons indicate areas where bare ice albedo is reached during the last but not the first years of the period. Crosses indicate areas where bare ice albedo is reached during the first but not the last years of the period. (b) MERRA-2 mean winter precipitation anomaly (m w.e.) of 1982–2015 vs. 1982–1992 mean. (c) MERRA-2 mean May–August SAT anomaly of 1982–2015 vs. 1982–1992 mean.
3.2 Melt intensity and bare ice exposure
Figures 4a, 5a, and 6a show the change in the time required from early May for the grid cell to reach an albedo typical of bare ice, taken as a proxy for melt season intensity, between the last and first 3 years of each period. Here, the decrease rates are shown only for elevations below 2200 m a.s.l., where the trend signal originates. The overlaid pentagons (and crosses) indicate areas where albedos typical of bare ice and wet snow have been reached at the end but not the beginning of each period (and vice versa). The patterns correlate well spatially, as expected. We see increases in melt intensity along the western margin (basin 5) for the full CLARA period and both subperiods. The MODIS era has seen systematically more bare ice exposure also over basin 6, which is further north. To assess the consistency and robustness of the changes in melt intensity, we also calculated the Theil–Sen decadal trend estimates for the melt rates during each period, shown in Fig. 7. The acceleration in melt rate between 1982 and 2015 is significant over large areas in the western, northern, and northeastern margins, largely as a consequence of changes seen during 2000–2012.
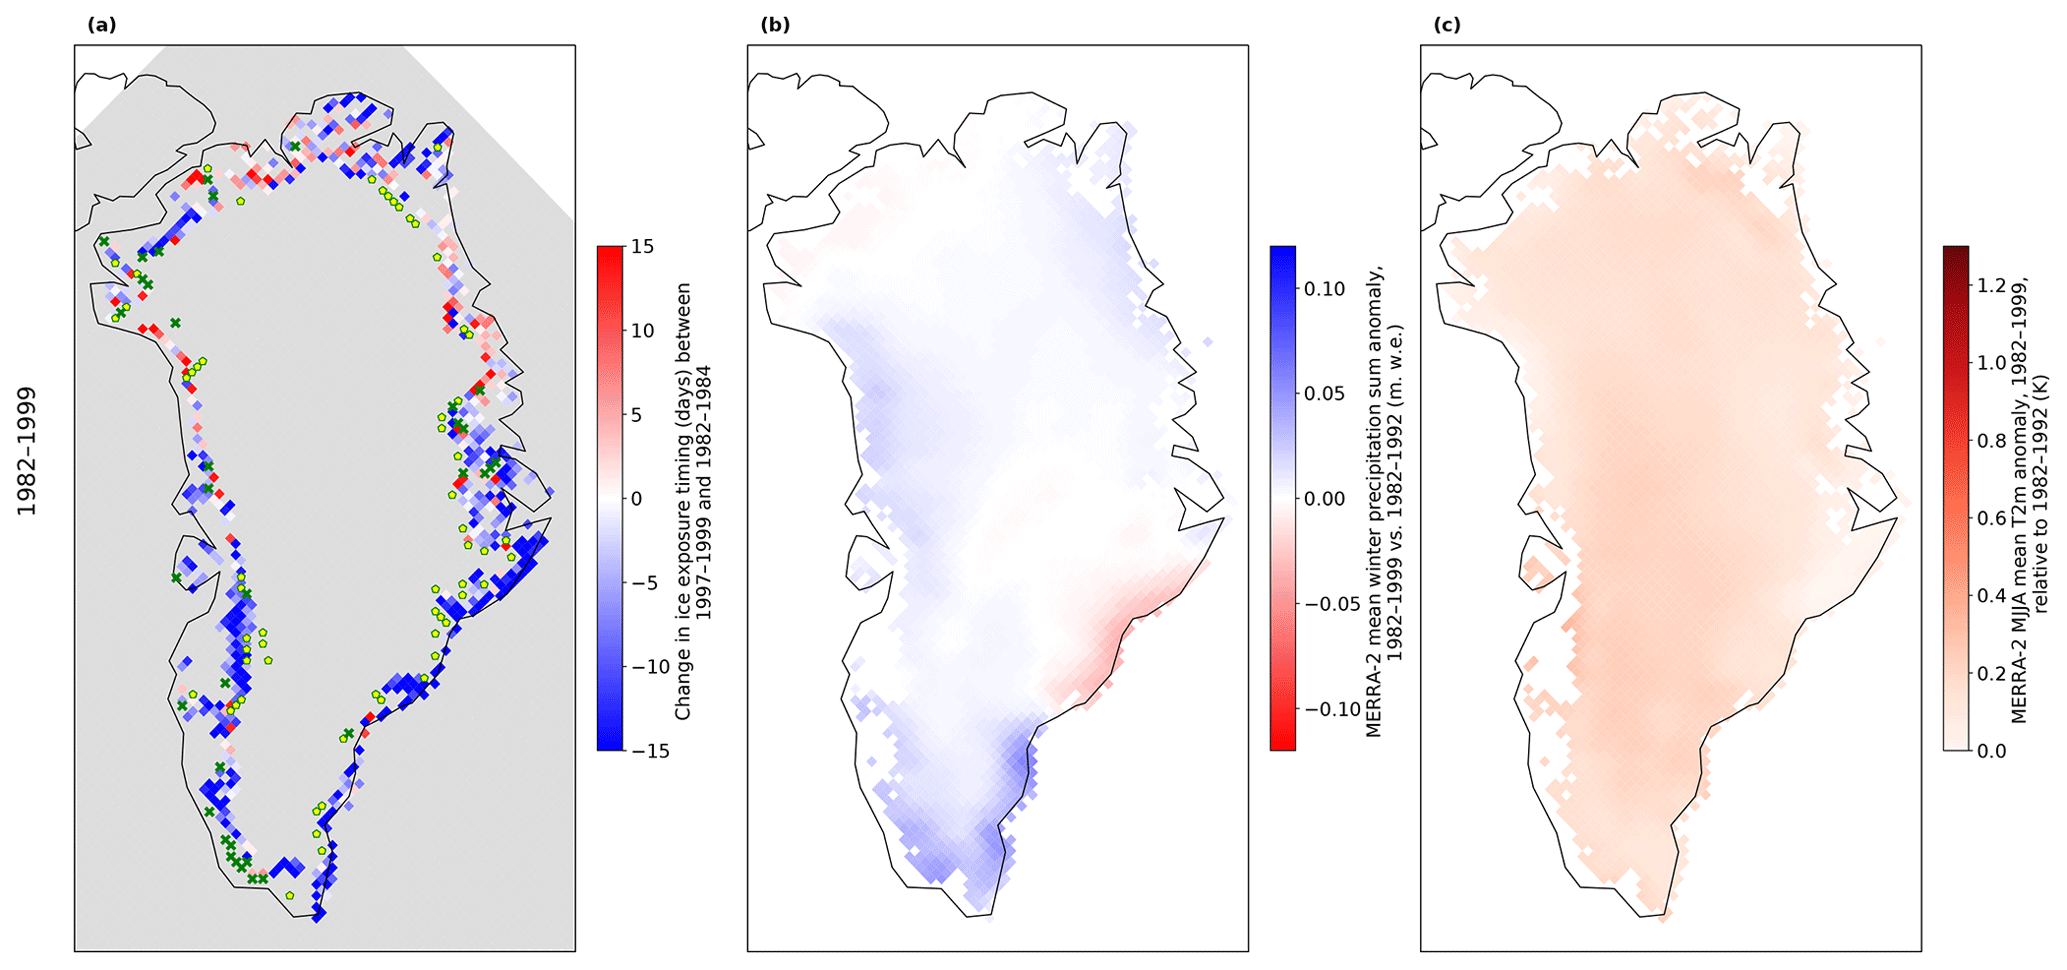
Figure 5(a) Changes in time required (days) to reach bare-ice-typical albedos between averaged periods 1997–1999 and 1982–1984. Green-yellow pentagons indicate areas where bare ice albedo is reached during the last but not the first years of the period. Crosses indicate areas where bare ice albedo is reached during the first but not the last years of the period. (b) MERRA-2 mean winter precipitation anomaly (m w.e.) of 1982–1999 vs. 1982–1992 mean. (c) MERRA-2 mean May–August SAT anomaly of 1982–1999 vs. 1982–1992 mean.
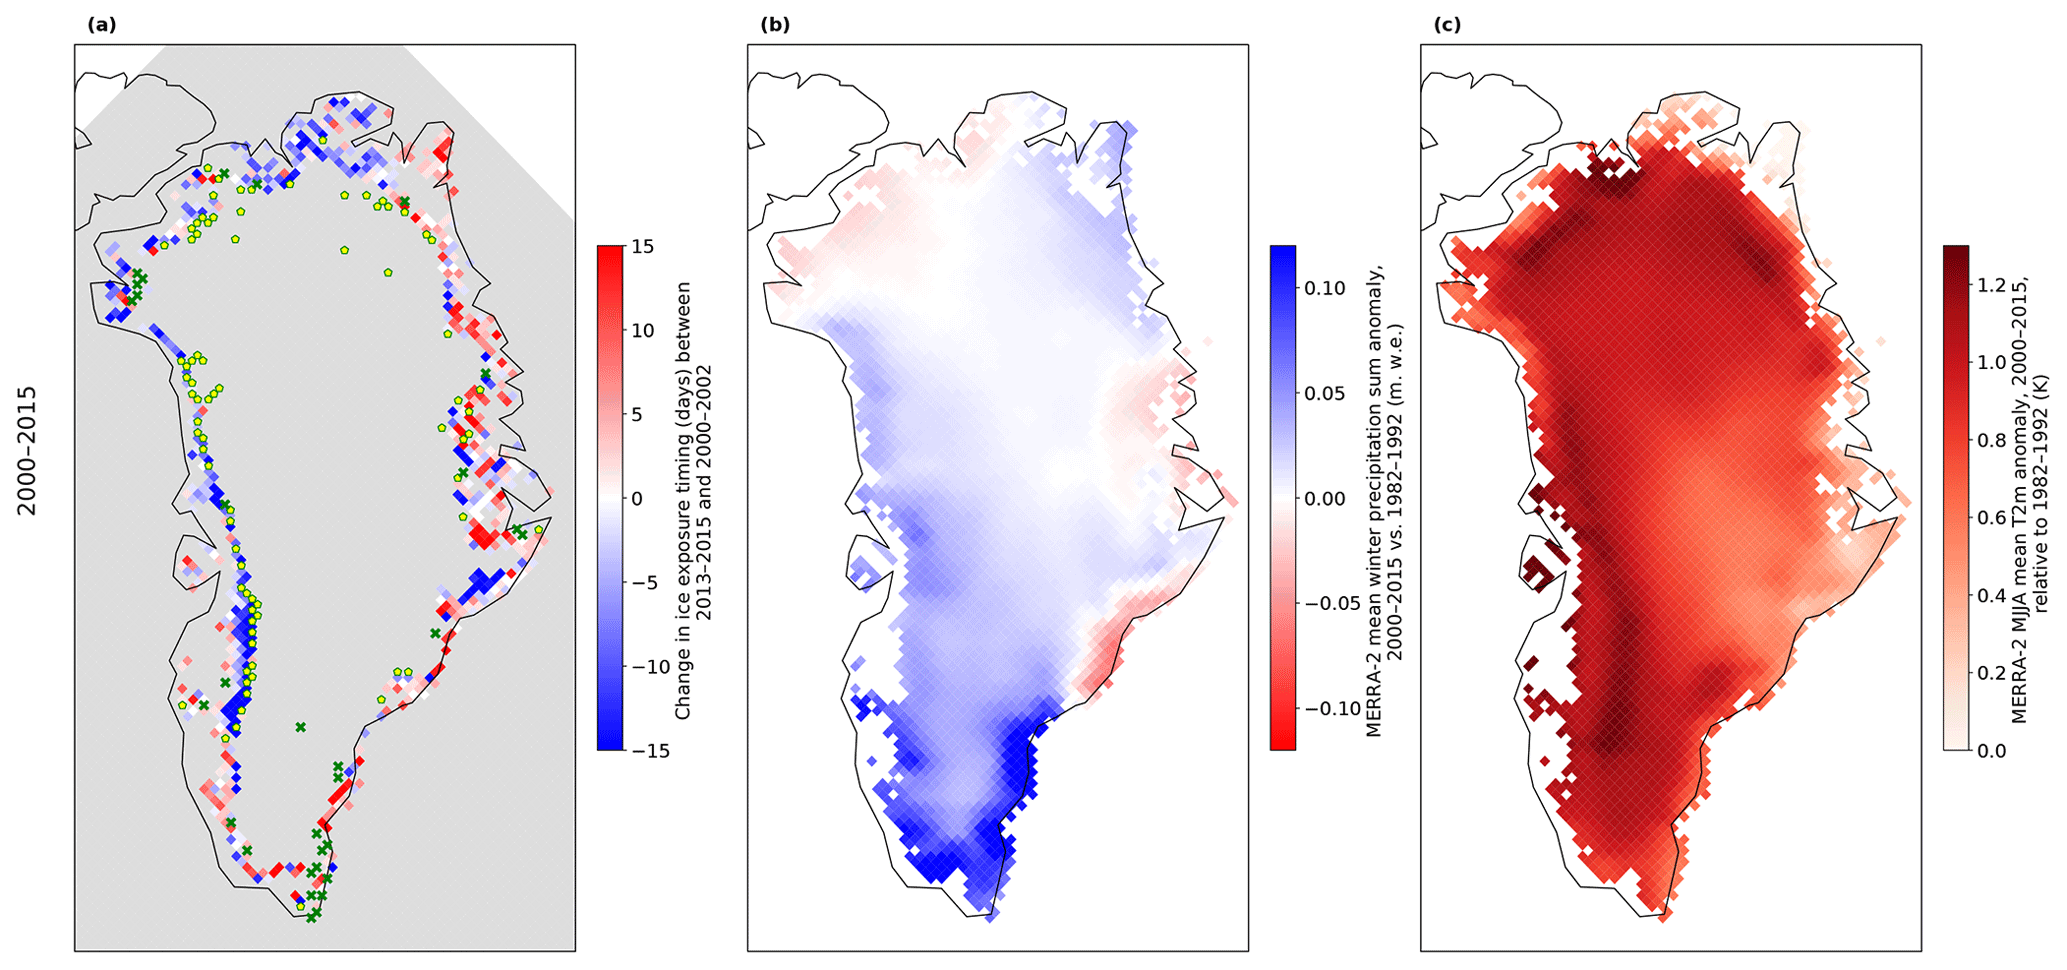
Figure 6(a) Changes in time required (days) to reach bare-ice-typical albedos between averaged periods 2013–2015 and 2000–2002. Green-yellow pentagons indicate areas where bare ice albedo is reached during the last but not the first years of the period. Crosses indicate areas where bare ice albedo is reached during the first but not the last years of the period. (b) MERRA-2 mean winter precipitation anomaly (m w.e.) of 2000–2015 vs. 1982–1992 mean. (c) MERRA-2 mean May–August SAT anomaly of 2000–2015 vs. 1982–1992 mean.
Also, while some areas saw new bare ice exposure in the late 1990s (relative to the early 1980s), there has been a widespread increase in areas experiencing bare ice exposure (or very wet snow cover) during the 2000s, so that these areas now routinely reach elevations 50–100 m higher up the ice sheet compared to 1982–1984 (Fig. 8). These changes are consistent with corresponding positive anomalies in MERRA-2 mean SAT during the summer months, as shown in Figs. 4c, 5c, and 6c.
A notable and interesting deviation from this trend towards faster melt and expanding bare ice/very wet snow cover has occurred along the southeastern margin, roughly between Tasiilaq and Paamiut (basin 4). Here, we observe no increase in melt rate during the MODIS era, and areas which reached bare ice albedos during the melting season at the turn of the century no longer do so in 2013–2015. We suggest that both of these effects are explained by substantial increases in winter snowfall over this region, as shown by the MERRA-2 winter precipitation anomalies (Fig. 6b). The increasing snow deposition, also reported by Box (2013), creates a buffer against melt rate acceleration, inhibiting bare ice exposure at the same time. The summer SAT anomalies during the MODIS era over this region are also less significant than those over the western margin, consistent with prior analysis suggesting that the presently dominant atmospheric circulation patterns particularly favour northward warm air transport along the western margin of the ice sheet (Fettweis et al., 2013), likely enhanced at times by atmospheric river events (Neff et al., 2014; Mattingly et al., 2018).

Figure 7Theil–Sen decadal trend estimates in albedo decrease rate (units per 30 d) serving as a proxy for melt intensity. Hatched pattern indicates areas where the trend is statistically significant (non-zero slope) at the 95 % confidence level. Estimates shown only for elevations lower than 2200 m a.s.l.
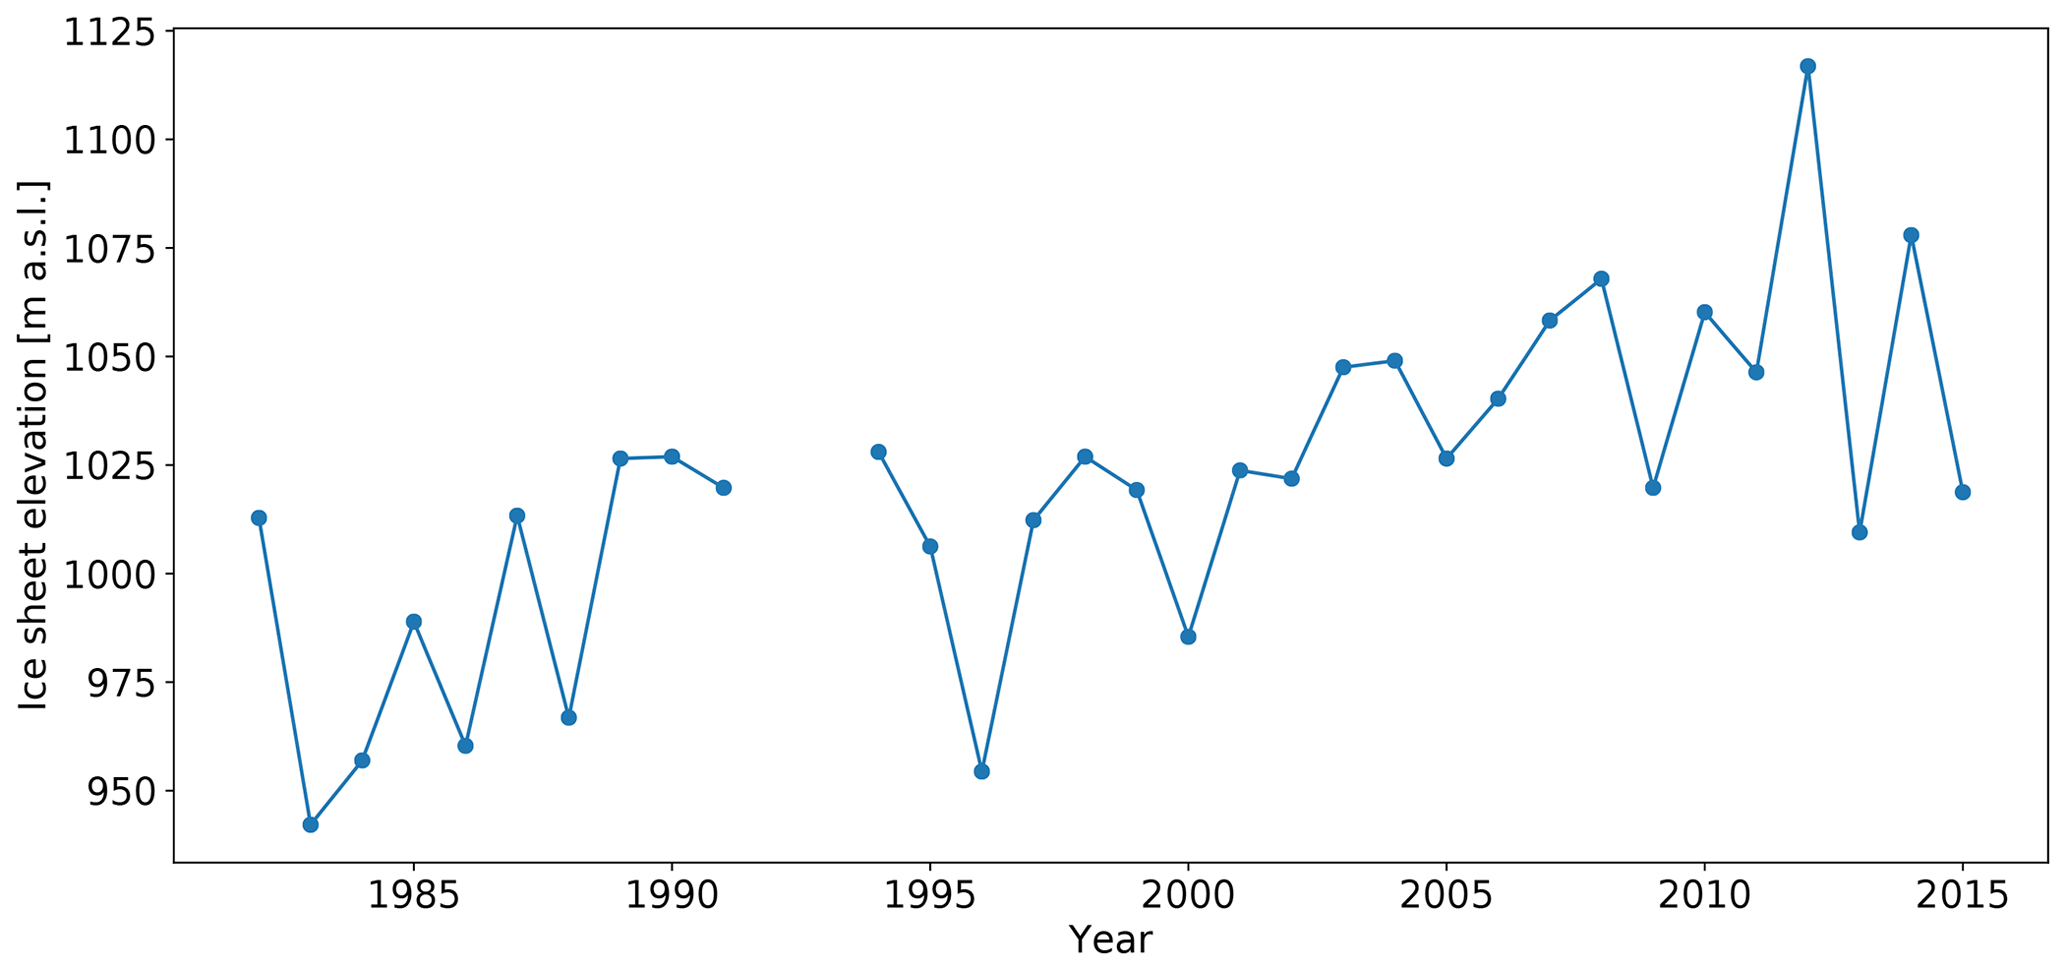
Figure 8Change in the median elevation (a.s.l.) of the parts of the ice sheet reaching albedo typical of bare ice between 1982 and 2015. Years 1992 and 1993 are excluded from analysis.
3.3 Runoff contribution in the variability of the ice sheet's surface mass balance (SMB) in summer during 1982–2015
Figure 9a shows the Theil–Sen regression fit between the monthly means of the CLARA albedo time series and the ice sheet SMB, obtained by correcting the GRACE mass balance observations with the state-of-the-art monthly ice discharge estimates (King et al., 2018) following Eq. (1). The obtained fit shows no temporal dependency (years marked by colours) and is fairly robust (r2∼0.77). For completeness, the regression parameters for both CLARA and MOD10A1 are provided in the Supplement and discuss considerations and limitations to their use in Sect. 2.7.4.
We then calculate the summer-summed proxy SMB for both CLARA and MOD10A1, shown in Fig. 9b. The original GRACE SMB estimates and MAR SMB are shown for comparison. Both proxy SMB time series overestimate MAR SMB, largely because the original GRACE SMB estimates do so as well. However, it is notable that the GRACE proxy SMB largely does agree with MAR SMB between 1982 and 2014 within its uncertainty envelope, apart from the a priori known period of 1992–1993 and 1999–2000 to a smaller extent. The 1999–2000 disagreement may be traceable to a change in the NOAA AVHRR constellation which occurred at the time. Both CLARA and MOD10A1 proxy SMB exhibit a significant Pearson correlation coefficient against MAR (CLARA: 0.79, MOD10A1: 0.95), confirming, on an observational basis, the modelling-based finding that surface melt and subsequent runoff dominate the interannual summer SMB variability of the ice sheet.

Figure 9(a) Linear regression fit between CLARA-A2 SAL monthly mean ice sheet surface albedo (x axis) and the TU Dresden GRACE RL06 monthly SMB, obtained by correcting the GRACE mass balance data with ice discharge estimates by King et al. (2018). (b) May–August (MJJA) surface mass balance sums between 1982 and 2017. Blue line and markers show the CLARA-proxy SMB as calibrated against GRACE observations, with an uncertainty envelope (blue shading) based on the best estimate for the mean snow/ice albedo stability of 0.02 in CLARA. Green line shows the corresponding SMB estimates from the MAR regional climate model. The magenta line and markers show the discharge-corrected GRACE SMB estimate, shown only for years with full GRACE MJJA availability. The red dashed line and markers show the MOD10A1-based SMB estimate for comparison.
A notable divergence between the proxies and MAR in the MODIS era occurs in 2012, when evidently the summer mass loss clearly outpaced any albedo reductions seen by either MODIS or AVHRR. A potential explanation is that albedo decreases are physically bounded in a way that the surface-melt-induced mass loss is not. The albedo of the ice sheet margin, where the changes are concentrated, could be considered to have physically based local effective minima, corresponding to conditions where the ice sheet surface is consistently melting and saturated with melt ponds and melt rivers up to the local effective maximum coverage. In this logic, beyond this point the mean surface albedo of the area would have almost nowhere to go in terms of further decreases, barring the introduction of large concentrations of light-absorbing impurities or biomass.
3.4 On the basin-scale relationships between surface albedo as a runoff proxy and ice discharge
A comparison between detrended, normalized basin-scale D anomalies and surface albedo (serving as a proxy for runoff) between 2000 and 2015 yielded no statistically significant relationships for any examined summer month at the 95 % confidence level. This negative finding implies that surface runoff anomalies do not significantly alter the solid ice discharge rates through the outlet glaciers at the annual level. This is in line with previous modelling work (Schoof, 2010; Tedstone et al., 2015) which has suggested a complex relationship between meltwater availability and glacier flow rate, where large amounts of meltwater may serve to decelerate rather than accelerate glacier basal flow. Also, King et al. (2018) note that the annual variability in the ice discharge is mostly connected to cumulative changes in the calving front positions of its outlet glaciers.
The CLARA-A2 SAL surface albedo estimates represent the per-grid-cell mean solar illumination conditions of each 5 d or monthly time period and are not normalized to any particular solar zenith angle (SZA). We choose to use a non-normalized SZA because various in situ measurements have shown the symmetrical u-shape diurnal cycle assumed in common normalization algorithms (Briegleb et al., 1986; Gardner and Sharp, 2010) is not valid for snow during the melting period, when the u shape is often noon-asymmetrical (Dirmhirn and Eaton, 1975; Jonsell et al., 2003; Pirazzini et al., 2006; Meinander et al., 2013). We find, however, that albedo trends are not highly sensitive to the selection or exclusion of SZA normalization. Figure S1 in the Supplement reproduces Fig. 3 with the application of the SZA normalization proposed by Gardner and Sharp (2010) with a target SZA of 60∘, yielding consistent trends. Also, the separate treatment for each summer month and the use of a conservative SZA cutoff (of 70∘) in the albedo estimation will further ameliorate any impacts of excluding a normalization procedure.
We find very similar spatio-temporal distributions of albedo trends and overall magnitude to those in Tedesco et al. (2016b), who performed an analysis of Greenland surface albedo changes during the summer JJA season from the GLASS dataset, based on coherently and consecutively processed AVHRR and MODIS observations. The JJA albedo trend for the whole ice sheet during 1996–2012 in CLARA-A2 is −0.020 per decade (p < 0.01), matching the result from GLASS (based on MODIS Terra and Aqua from 2000/2002 onward). They attribute the decreasing trend to increasing air temperatures and enhanced melting but also to exposure of older impurities resulting from increasing snow and ice melt. While our present analysis does not attempt to attribute changes to impurity deposition or exposure, we note that the melting seasons 2013–2015 brought about a clear amelioration in the overall albedo decrease. The JJA decadal albedo trend in CLARA-A2 for 1996–2015 is −0.01 (p < 0.05). This suggests that, if progressing impurity exposure indeed plays a role in the large-scale darkening of the ice sheet margins, cloudiness and circulation changes alongside regional precipitation increases are still the more powerful drivers.
We suggest that the recent inhibition of surface melt along the SE margin of the ice sheet is due to increased winter precipitation, but there are somewhat conflicting views in recent literature. Berdahl et al. (2018) examined observation precipitation records at Tasiilaq station, taken to be representative of the surrounding parts of the SE ice sheet, and found no significant December–February precipitation increases in the satellite era up to 2012. We note, however, that Tasiilaq station appears to lie at the no-change zone between the MERRA-2 bimodal peaks, where MERRA-2 winter precipitation anomalies during 2000–2015 increase in the southernmost parts of the SE margins but are reduced further east. While further analysis on this bimodal feature in precipitation anomalies is beyond the scope of this study, we suggest it might serve to explain the lack of observed precipitation increases by Berdahl et al. (2018). However, Koyama and Stroeve (2018) evaluated the Arctic System Reanalysis precipitation against in situ observation along the ice sheet margins, finding in situ observations indicating increasing precipitation during the 2010–2015 period near the southern tip of Greenland. These increases agree with the increasing winter precipitation signal we observe in MERRA-2 and are consistent with the lack of new albedo reductions or bare ice exposure in CLARA (Fig. 6). The suggested link between melt inhibition and increasing precipitation depends fully on the phase of the precipitation; recent evidence demonstrates that the proportion of rainfall to total precipitation is increasing, suggesting that our finding may be transient in nature (Oltmanns et al., 2019).
Wong et al. (2015) also reported consistent although regionally variable temperature and precipitation responses along the Greenland coastal regions to prevailing atmospheric circulation patterns, in particular to the warm and moist southerly airflows associated with a negative North Atlantic Oscillation (NAO) index. Their finding of increasing winter precipitation in the NW region of the ice sheet during 1990–2010 is consistent with the localized lack of systematic melt acceleration seen in CLARA over the same region (Fig. 4), even though the increasing precipitation is not seen by MERRA-2. However, the reversal of bare ice exposure in the NW when comparing 2013–2015 to 2000–2002 (Fig. 6) may also be related to more frequent cold northerly airflows post-2012 (Tedesco et al., 2014).
While our observation-based test confirms the dominance of surface melt in the surface mass loss of the ice sheet, the general agreement between modelled and proxy SMB shown here contains substantial (though mutually cancelling) disagreements at the monthly level. Most notably, the ERA-Interim-forced MAR v.3.5.2 SMB generally sees the largest annual mass loss occurring in July, whereas the corresponding GRACE SMB estimates assign the largest mass loss to the month of August. Such differences have emerged in prior studies (Alexander et al., 2016), although based on different GRACE mass balance solutions and a MAR version of different forcing and spatial resolution, invalidating direct comparisons between results. The reasonably good covariability between MAR SMB and albedo-based proxy SMB is likely due, in part, to the improved agreement between GRACE and MAR mass balance at elevations below 2000 m a.s.l. (Alexander et al., 2016), where most of the ice sheet albedo changes occur. Also, in principle snowfall acts to increase both SMB and albedo, although the correlation is short-lived, diminishing once the fresh snow layer becomes optically semi-infinite.
The ESA Greenland Ice Sheet CCI distributes mass balance solutions from two algorithms (TU Dresden and DTU). For completeness, we repeated the SMB analysis also for the DTU GRACE data. The results (Fig. S2) show a less favourable fit between CLARA and discharge-corrected GRACE SMB with a larger slope, leading to generally much less negative surface mass balance in the CLARA–GRACE proxy relative to MAR. The MOD10A1 is similarly affected but to a lesser degree. It is notable that both discharge-corrected GRACE SMB time series from ESA Greenland Ice Sheet CCI produce systematically less negative SMB during the summers 2004–2010 relative to MAR.
Geolocation errors have been reported as a source of difference between the MODIS and AVHRR albedo estimates by Box et al. (2006). To further investigate the chance that geolocation and cloud masking uncertainties have a substantial impact on the obtained results, we compared the CLARA record to the latest MOD10A1 (Box et al., 2017b) in terms of decadal albedo trends and grid-cell-specific mean differences per summer month during 2000–2015 (Fig. S3). The CLARA-MOD10A1 mean differences display a substantial latitudinal dependency in May and August, in line with results shown by Alexander et al. (2014). However, the decadal trends agree very well between the datasets, thus reinforcing the robustness of the observed trends in CLARA albedo. Discerning the cause of the differences would require a rigorous study accounting for differences in spatial resolution, diurnal sampling, and geolocation uncertainties and is as such beyond the scope of the present work.
A variety of drivers of the post-2000 increases in the ice sheet's surface melt (and thus decreases in surface albedo) have been proposed. First, atmospheric circulation pattern changes (ridging over Greenland) have led to warm and moist air advection over the ice sheet (e.g. Fettweis et al., 2013; Mioduszewski et al., 2016), leading to both increases in SAT (Reeves Eyre and Zeng, 2018) and increases in clear-sky downwelling longwave radiation (Mioduszewski et al., 2016; Välisuo et al., 2018). Changes in the surface radiative energy budget caused by cloud coverage and composition have also been proposed as a primary driver. Hofer et al. (2017) argued, using the CLARA-A1 dataset, the predecessor of CLARA-A2 used here, that decreasing cloudiness over the ablation zone in the 2000s, which increases both downwelling shortwave and clear-sky downwelling longwave radiation in the presence of advected warm air masses, has caused a significant increase in insolation and surface melt. Bennartz et al. (2013) provided a different mechanism for increased melt, arguing that, over the high-elevation centre of the ice sheet, intrusions of optically thin, low-level, and liquid-bearing clouds enhance the downward longwave flux while still allowing shortwave flux penetration to the surface, promoting extensive surface melt.
Here, we have focused on analysing the surface albedo changes using reanalysis SAT and winter precipitation as supporting evidence. We calculated the mean MJJA cloud fractional coverage over the ice sheet from CLARA-A2 (1982–2015) for comparison against the corresponding MAR cloud cover field. Figure 10 shows a recovery of cloud cover after 2007 in CLARA, from updated algorithms and AVHRR radiance calibration. MAR cloud cover, however, continued to decline until 2011. This highlights the uncertainties in cloud observations from legacy AVHRR data, even though the detection performance is improved in CLARA-A2 (Karlsson et al., 2017a). A limited study over the central part of the accumulation zone during 2010 showed good agreement between CLARA and MODIS cloud cover (Riihelä et al., 2017), implying that the latest years of CLARA with the highest number of concurrently serving AVHRR instruments should be the most reliable.
While the overall cloudiness decline from the mid-1990s to 2007 is still in line with the melt mechanisms proposed by Hofer et al. (2017), the post-2007 cloudiness recovery in CLARA-A2 is then inconsistent with the continuing large mass loss from the CLARA and MOD10A1 proxy SMB time series, as well as MAR, up till 2012. Alongside the comparison to the results from Tedesco et al. (2016b), this suggests that the relationship between cloudiness, atmospheric circulation patterns, and surface melt may be still more complicated than has been shown to date. Further, cloud radiative properties can also significantly impact bright snow surface radiative budgets, but these parameters (e.g. cloud optical thickness (COT) and effective particle radius, or liquid/ice water path (LWP/IWP)) are challenging to retrieve from AVHRR (Riihelä et al., 2017).
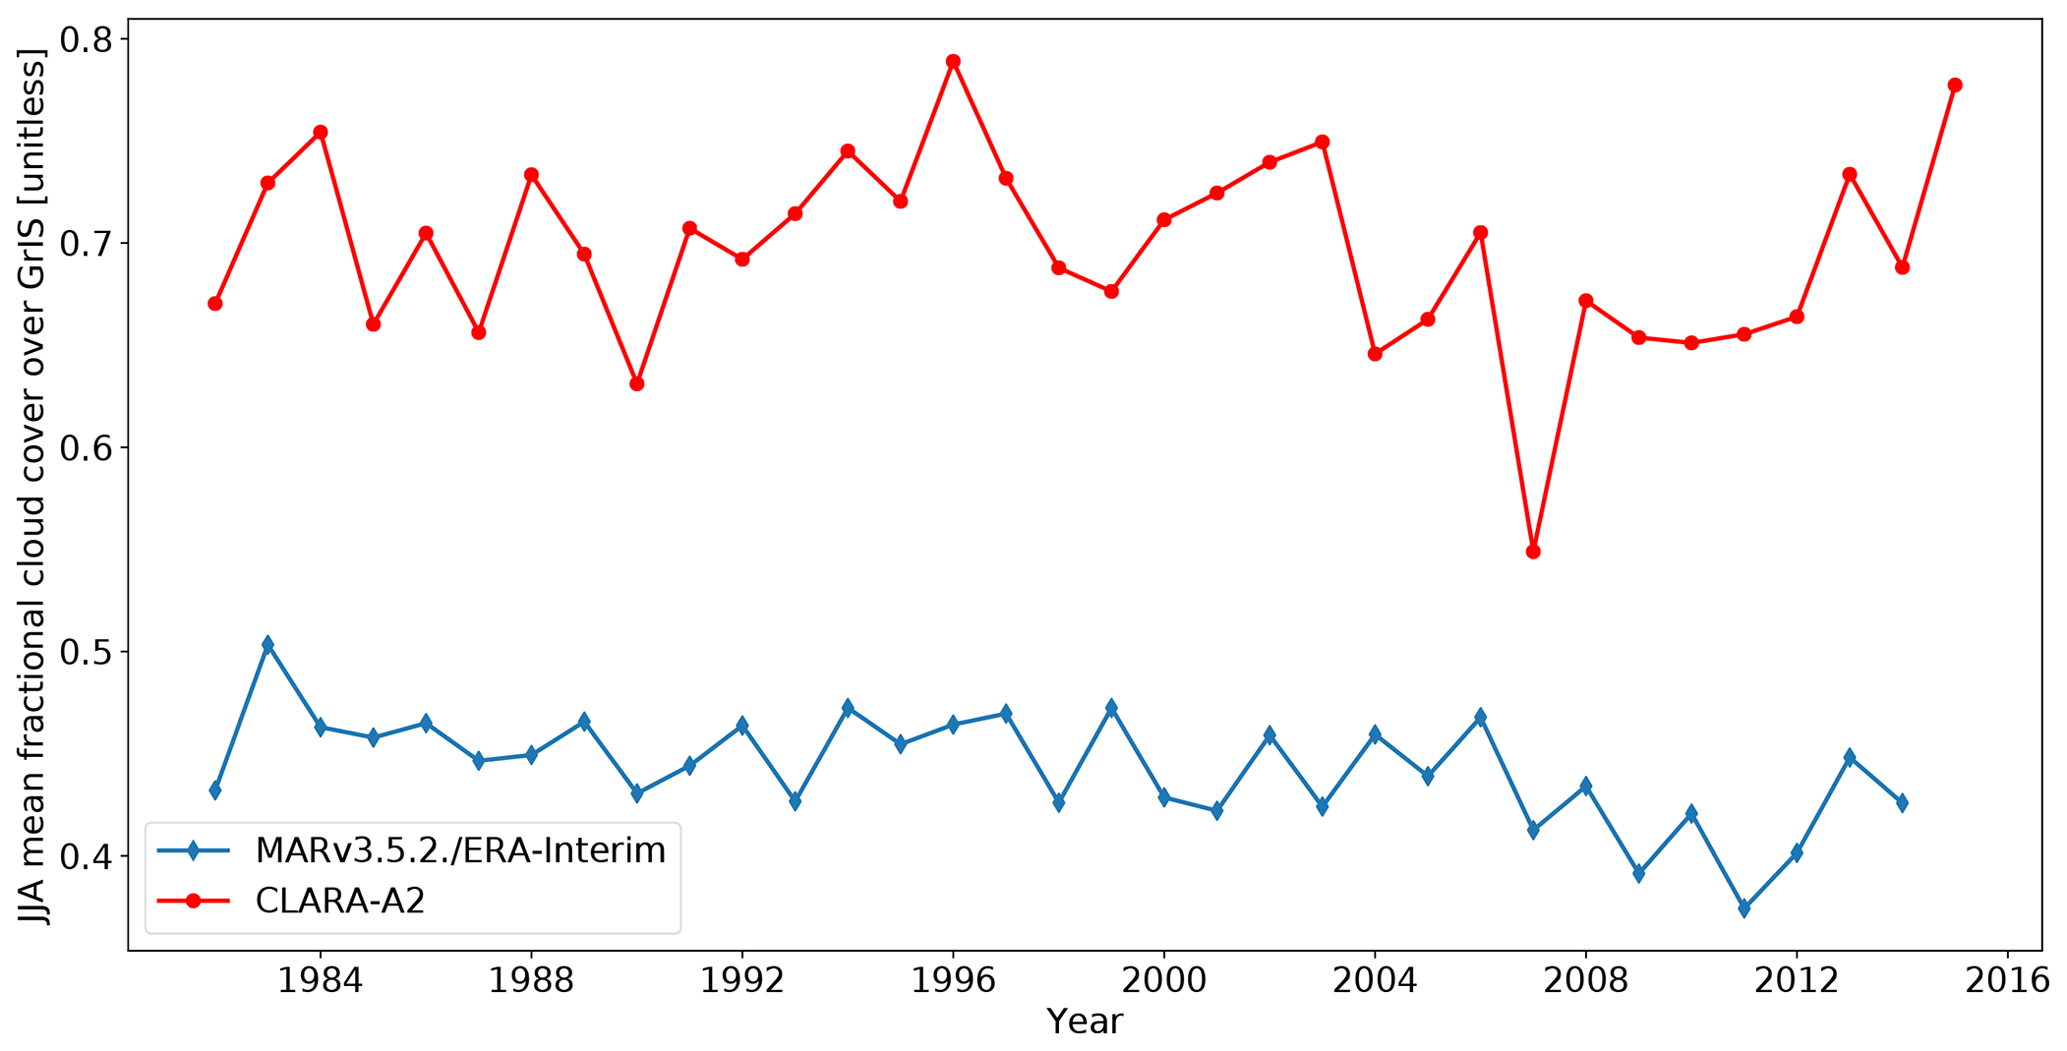
Figure 10Mean JJA fractional cloud cover over the ice sheet from CLARA-A2 and MAR v3.5.2 with ERA-Interim forcing.
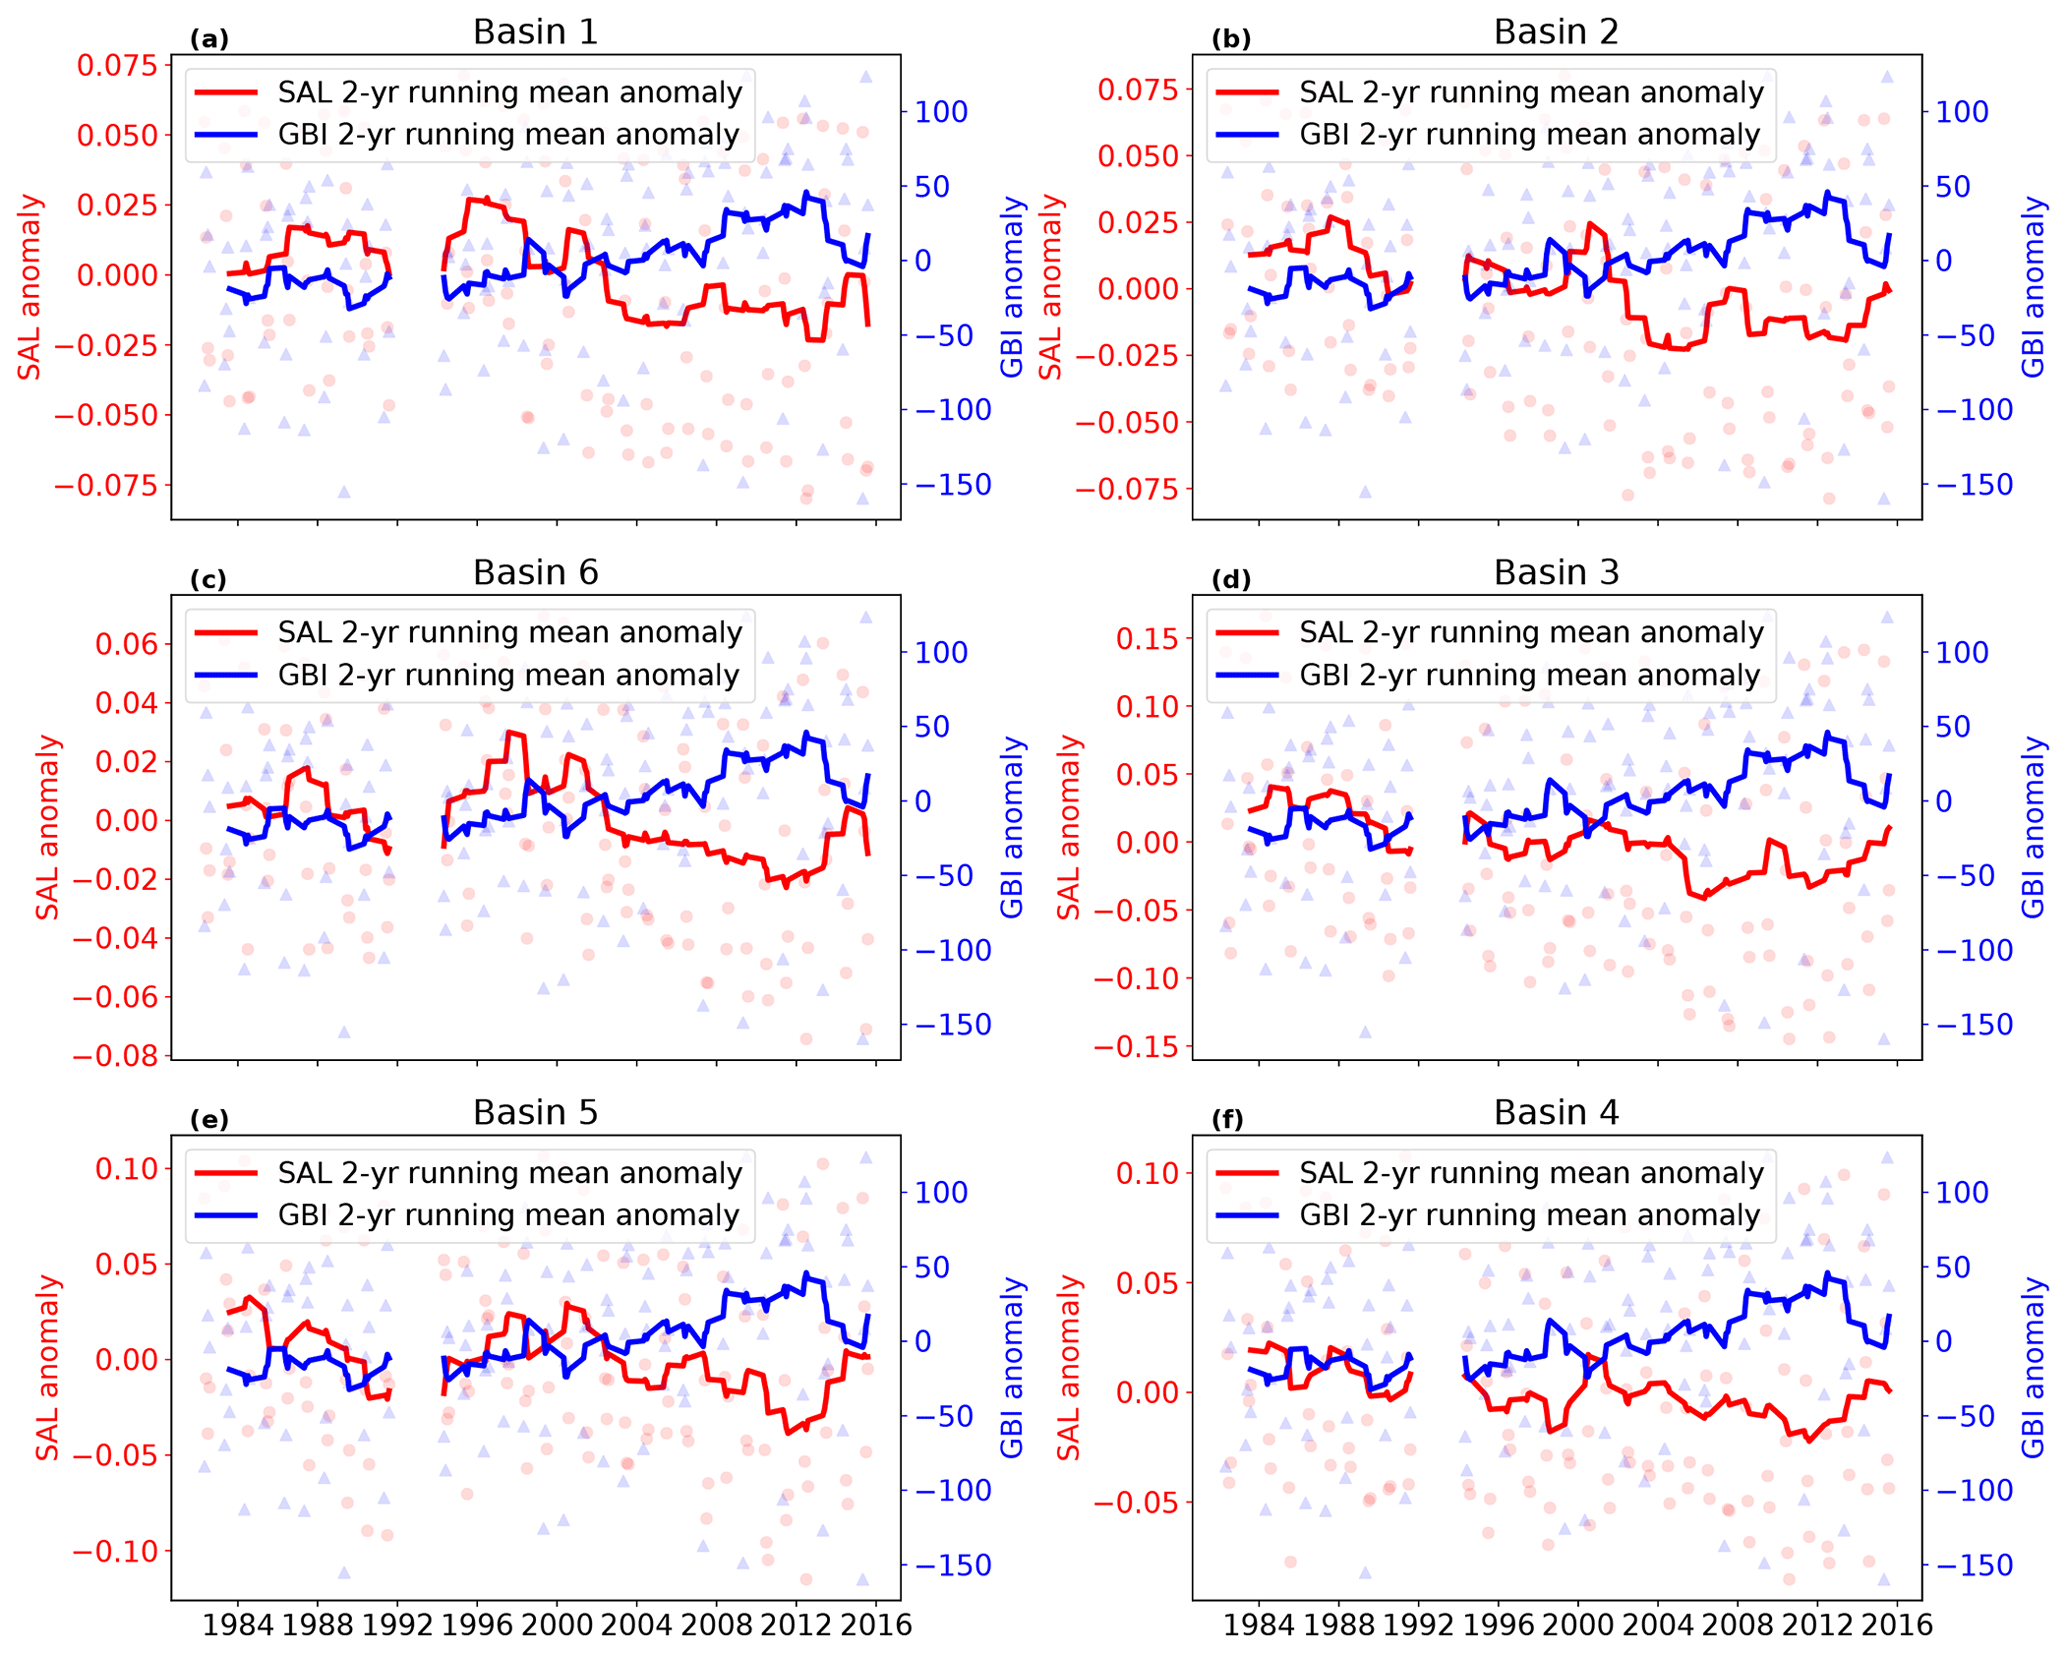
Figure 11Comparison of monthly basin-scale CLARA-A2 SAL anomalies (red circle) against Greenland Blocking Index (GBI) anomalies (blue triangle). All anomalies are calculated with respect to the 1982–2015 mean albedo or GBI. Red and blue lines show 2-year running means of the respective anomalies. Basins are ordered as in Fig. 2. Years 1992 and 1993 are excluded from the analysis.
Another means of linking large-scale atmospheric circulation to the surface albedo changes is via the Greenland Blocking Index (GBI; Hanna et al., 2013, 2016). Positive anomalies in GBI represent atmospheric conditions which block northerly zonal airflow over the ice sheet, allow for warm southerly airflow particularly across the west margin, and promote clear-sky conditions over the ice sheet, enhancing surface melt (Hanna et al., 2014). The basin-scale comparisons between surface albedo anomalies and GBI anomalies (both calculated with respect to the 1982–2015 mean) are shown as time series in Fig. 11. Generally, there is a negative correlation between GBI and albedo (see Fig. S4), although with variability between basins. For example, in agreement with Tedesco et al. (2016a), the 2015 positive GBI anomaly was linked to an atmospheric ridge which enhanced melt in northern Greenland (basins 1 and 6) while preventing it in the south, a feature reproduced in the corresponding albedo anomalies. Along with the concurrent recovery in ice sheet mean cloudiness (Fig. 10), the significant covariability between GBI and albedo implies that the apparent post-2012 slowing in further albedo decreases is linked to a shift in large-scale atmospheric circulation, allowing for more cold northerly airflow (Tedesco et al., 2014) and increasing cloudiness (during summers; Fig. 10).
McLeod and Mote (2016) also connect increasing surface melt since the early 1990s with the increasing frequency, and partly duration, of very large GBI (Greenland blocking episodes, GBEs), in line with results from our observation-driven analysis. Rajewicz and Marshall (2014) report that a substantial part of summer melt variability is directly explainable by increasing anticyclonic circulation over Greenland, isolating that signal from the overall near-surface air temperature increases and contesting that any abrupt change in atmospheric regime is behind the change. They also note that the anticyclonic circulation began to impact South Greenland during the 1990s, with the effect spreading to other parts of the ice sheet after 2001. Further, they note that while the NAO index is often used to explain melt anomalies, NAO is not a causal mechanism for the melt but is simply covariant with melt-inducing ridging conditions over the ice sheet. This reasoning is consistent with the gradually decreasing albedo seen in CLARA during the pre-MODIS era on the western margin but does not explain the substantial late-summer albedo decrease in the northeast in the same era. They are also consistent with a stronger overall correlation between CLARA JJA albedo and GBI () than between JJA albedo and NAO (r=0.47) using data from Hurrell and Deser (2009).
The influence of oceanic heat advection is another possible cause for some of the observed albedo decreases. Both CLARA and MOD10A1 detect localized negative albedo trends around Helheim and Kangerdlussuaq glaciers in the southeast margin. Straneo et al. (2011) documented the presence of warm subtropical waters in the Helheim Glacier fjord, Häkkinen and Rhines (2009) showed that such waters have begun to penetrate the seas around SE Greenland with increasing intensity, and Christoffersen et al. (2011) connected an increase in oceanic heat fluxes with subsequent Kangerdlussuaq Glacier retreat. It could thus be postulated that the release of heat from these warmer waters could act as a localized additional source of energy for the surface snow and ice in the area surrounding these two glaciers served by relatively large fjords. However, outlet glacier thinning accelerated by oceanic heat (Murray et al., 2010) and exposure of impurities from the ice with increasing melt (Tedesco et al., 2016b) could also produce this effect.
Finally, we note that while the CLARA proxy does provide observation-based confirmation on the dominance of surface melt in the variability of the summed MJJA surface mass balance, the results show clear physical constraints on the validity of mechanisms linking enhanced albedo reductions as a proxy for SMB decreases. The question of increasing biological activity as a driver of albedo reduction along the ice sheet margins remains open for want of long-term records to compare with the present albedo estimates from CLARA. A large-scale spread of algae colonies on the ice surface would certainly provide a mechanism for albedo decrease unaccounted for in present models and satellite-based retrieval algorithms.
We have investigated the decadal trends in the surface albedo of the Greenland Ice Sheet between 1982 and 2015 and their connection to melt rate, bare ice exposure, and surface mass balance and ice discharge rate. The main results of this study may be summarized as follows.
Over the 34-year investigation period, the late-summer surface albedo of the ice sheet margins shows a statistically significant decrease at the 95 % confidence level. The 1982–2015 decadal albedo trends reach a maximum of approximately −0.05 over the ablation region in the Kangerlussuaq sector in July, although some grid cells in the area display decadal trends twice as large during 2000–2015. The trends are consistent with MODIS data for the overlap period.
The albedo decrease along the west coast mainly occurred between 2000 and 2012, concurrently and consistently with a previously reported change in atmospheric circulation favouring the advection of warm and moist southerly air masses along the west coast. The albedo decrease of the northeastern and eastern margins was initiated during the 1982–1999 period. While the darkening there is statistically significant, we cannot at present identify a clear driver for it.
The melt seasons along the western and northern ice sheet margins intensified primarily after 2000, as seen by an acceleration of the albedo decrease rate during the melting season. Also, regions where surface melt causes the albedo to drop to values typical of bare ice were much more widespread in 2012–2015 than in the early 1980s and expand to elevations 50–100 m higher on the ice sheet.
A notable exception to the widespread albedo decrease was observed along the southern margins, consistently and concurrently with increased winter snowfall in the MERRA-2 reanalysis. The future persistence of this effect will undoubtedly depend on the future magnitude and phase of precipitation along the ice sheet's southern margin.
When calibrated against surface mass balance estimates based on GRACE gravimetric measurements and ice discharge estimates, the CLARA surface albedo estimates form a proxy for summer-aggregated SMB reaching back to 1982. This proxy shows reasonably good agreement and a high degree of covariability with MAR regional climate model (v3.5.2) estimates for the full investigation period. This confirms the dominant role of surface runoff in the ice sheet's SMB variability during the satellite era.
We find no observational evidence for a connection between annual surface albedo changes (as a proxy for runoff production anomalies) and anomalies in annual rates of ice discharge at drainage basin scales.
Our 3-decade analysis of homogenized AVHRR imagery places the ice sheet's significant albedo changes after the turn of the millennium in a broader context. Most changes are clearly attributable to concurrently prevailing patterns in atmospheric circulation and precipitation. The robustness of the first half of the AVHRR record may only be assessed indirectly for want of reliable reference data. However, we see no significant instability in time in the CLARA surface albedo record prior to 2000. During the same period, the reasonably good covariability between MAR and the CLARA-derived proxy provides further reinforcement to the plausibility of the early satellite record. Our results are consistent with a broad range of prior studies on the changing surface state of the ice sheet.
The CLARA-A2 surface albedo data record is available from https://doi.org/10.5676/EUM_SAF_CM/CLARA_AVHRR/V002 (Karlsson et al., 2017b). The MAR climate model data were obtained from ftp://ftp.climato.be/fettweis/MARv3.5/Greenland (last access: 26 October 2018). The Greenland Ice Sheet CCI GRACE data were obtained from http://products.esa-icesheets-cci.org/products/downloadlist/GMB/ (Barletta et al., 2013; Groh and Horvath, 2016). The Greenland Blocking Index was obtained from https://www.esrl.noaa.gov/psd/data/timeseries/daily/GBI/ (Hanna et al., 2013). The MOD10A1 albedo estimates were obtained from http://promice.dk/DownloadAlbedodata.html (Box et al., 2017b).
The supplement related to this article is available online at: https://doi.org/10.5194/tc-13-2597-2019-supplement.
AR planned the study and performed the analyses. MK was in charge of the discharge estimate data and contributed to the manuscript text. KA was the responsible scientist for the creation of the CLARA-A2 SAL dataset and contributed to the manuscript text. AR prepared the manuscript with contributions from all co-authors.
The authors declare that they have no conflict of interest.
The CLARA-A2 SAL data record was created by the Satellite Application Facility on Climate Monitoring (CM SAF), a project of EUMETSAT. Colleagues in the CM SAF project are thanked for their support in the creation of the CLARA-A2 SAL dataset. Figures S1–S4 are available in the Supplement of this paper.
The authors would like to thank the editor, an anonymous reviewer, and Jason Box for their insight and comments that helped improve the manuscript.
This research has been supported by the Academy of Finland, Luonnontieteiden ja Tekniikan Tutkimuksen Toimikunta (grant no. 287399), and the National Aeronautics and Space Administration (grant nos. 80NSSC18K1027 and NN13AI21A).
This paper was edited by Mark Flanner and reviewed by Jason Box and one anonymous referee.
Alexander, P. M., Tedesco, M., Fettweis, X., van de Wal, R. S. W., Smeets, C. J. P. P., and van den Broeke, M. R.: Assessing spatio-temporal variability and trends in modelled and measured Greenland Ice Sheet albedo (2000–2013), The Cryosphere, 8, 2293–2312, https://doi.org/10.5194/tc-8-2293-2014, 2014.
Alexander, P. M., Tedesco, M., Schlegel, N.-J., Luthcke, S. B., Fettweis, X., and Larour, E.: Greenland Ice Sheet seasonal and spatial mass variability from model simulations and GRACE (2003–2012), The Cryosphere, 10, 1259–1277, https://doi.org/10.5194/tc-10-1259-2016, 2016.
Anttila, K., Manninen, T., Jääskeläinen, E., and Riihelä, A.: Validation Report for CM SAF Cloud, Albedo, Radiation data record, AVHRR-based, Edition 2 (CLARA-A2) Surface Albedo, https://doi.org/10.5676/EUM_SAF_CM/CLARA_AVHRR/V002, 2016.
Barletta, V. R., Sørensen, L. S., and Forsberg, R.: Scatter of mass changes estimates at basin scale for Greenland and Antarctica, The Cryosphere, 7, 1411–1432, https://doi.org/10.5194/tc-7-1411-2013, 2013 (data available at: http://products.esa-icesheets-cci.org/products/downloadlist/GMB/, last access: 26 October 2018).
Bennartz, R., Shupe, M. D., Turner, D. D., Walden, V. P., Steffen, K., Cox, C. J., Kulie, M., Miller, B., and Pettersen, C.: July 2012 Greenland melt extent enhanced by low-level liquid clouds, Nature, 496, 83–86, https://doi.org/10.1038/nature12002, 2013.
Berdahl, M., Rennermalm, A., Hammann, A., Mioduszweski, J., Hameed, S., Tedesco, M., Stroeve, J., Mote, T., Koyama, T., and McConnell, J. R.: Southeast Greenland Winter Precipitation Strongly Linked to the Icelandic Low Position, J. Climate, 31, 4483–4500, 2018.
Bøggild, C. E., Brandt, R. E., Brown, K. J., and Warren, S. G.: The ablation zone in northeast Greenland: ice types, albedos and impurities, J. Glaciol., 56, 101–113, 2010.
Box, J. E.: Greenland ice sheet mass balance reconstruction. Part II: Surface mass balance (1840–2010), J. Climate, 26, 6974–6989, 2013.
Box, J. E., Bromwich, D. H., Veenhuis, B. A., Bai, L. S., Stroeve, J. C., Rogers, J. C., Steffen, K., Haran, T., and Wang, S. H.: Greenland ice sheet surface mass balance variability (1988–2004) from calibrated polar MM5 output, J. Climate, 19, 2783–2800, 2006.
Box, J. E., Fettweis, X., Stroeve, J. C., Tedesco, M., Hall, D. K., and Steffen, K.: Greenland ice sheet albedo feedback: thermodynamics and atmospheric drivers, The Cryosphere, 6, 821–839, https://doi.org/10.5194/tc-6-821-2012, 2012.
Box, J. E., Sharp, M., Aðalgeirsdóttir, G., Ananicheva, M., Andersen, M. L., Carr, R., Clason, C., Colgan, W., Copland, L., Glazovsky, A., Hubbard, A., Kjeldsen, K., Mernild, S., Moholdt, G., Moon, T., Wagner, T., Wouters, B., and Van Wychen, W.: Changes to Arctic land ice, in: Snow, Water, Ice and Permafrost in the Arctic (SWIPA) 2017, Oslo, Arctic Monitoring and Assessment Programme (AMAP), 137–168, 2017a.
Box, J. E., van As, D., and Steffen, K.: Greenland, Canadian and Icelandic land ice albedo grids (2000–2016), Geol. Surv. Den. Greenla., 38, 53–56, 2017b (data available at: http://promice.dk/DownloadAlbedodata.html, last access: 5 July 2019).
Briegleb, B. P., Minnis, P., Ramanathan, V., and Harrison, E.: Comparison of regional clear sky albedos inferred from satellite observations and model calculations, J. Clim. Appl. Meteorol., 25, 214–226, 1986.
Casey, K. A., Polashenski, C. M., Chen, J., and Tedesco, M.: Impact of MODIS sensor calibration updates on Greenland Ice Sheet surface reflectance and albedo trends, The Cryosphere, 11, 1781–1795, https://doi.org/10.5194/tc-11-1781-2017, 2017.
Christoffersen, P., Mugford, R. I., Heywood, K. J., Joughin, I., Dowdeswell, J. A., Syvitski, J. P. M., Luckman, A., and Benham, T. J.: Warming of waters in an East Greenland fjord prior to glacier retreat: mechanisms and connection to large-scale atmospheric conditions, The Cryosphere, 5, 701–714, https://doi.org/10.5194/tc-5-701-2011, 2011.
Citterio, M. and Ahlstrøm, A. P.: Brief communication “The aerophotogrammetric map of Greenland ice masses”, The Cryosphere, 7, 445–449, https://doi.org/10.5194/tc-7-445-2013, 2013.
Colgan, W., Box, J. E., Fausto, R. S., van As, D., Barletta, V. R., and Forsberg, R.: Surface albedo as a proxy for the mass balance of Greenland's terrestrial ice, Geol. Surv. Den. Greenl., 31, 91–94, 2014.
Cullather, R. I., Nowicki, S. M., Zhao, B., and Suarez, M. J.: Evaluation of the surface representation of the Greenland Ice Sheet in a general circulation model, J. Climate, 27, 4835–4856, 2014.
Dirmhirn, I. and Eaton, F. D.: Some characteristics of the albedo of snow, J. Appl. Meteorol., 14, 375–379, 1975.
Enderlin, E. M., Howat, I. M., Jeong, S., Noh, M. J., van Angelen, J. H., and van den Broeke, M. R.: An improved mass budget for the Greenland ice sheet, Geophys. Res. Lett., 41, 866–872, 2014.
Fearnhead, P.: Exact and efficient Bayesian inference for multiple changepoint problems, Stat. Comput., 16, 203–213, 2006.
Fettweis, X., Hanna, E., Lang, C., Belleflamme, A., Erpicum, M., and Gallée, H.: Brief communication “Important role of the mid-tropospheric atmospheric circulation in the recent surface melt increase over the Greenland ice sheet”, The Cryosphere, 7, 241–248, https://doi.org/10.5194/tc-7-241-2013, 2013.
Fettweis, X., Box, J. E., Agosta, C., Amory, C., Kittel, C., Lang, C., van As, D., Machguth, H., and Gallée, H.: Reconstructions of the 1900–2015 Greenland ice sheet surface mass balance using the regional climate MAR model, The Cryosphere, 11, 1015–1033, https://doi.org/10.5194/tc-11-1015-2017, 2017.
Forsberg, R. and Reeh, N.: Mass change of the Greenland Ice Sheet from GRACE. Gravity Field of the Earth – 1st meeting of the International Gravity Field Service, Springer Verlag, 2006.
Gardner, A. S. and Sharp, M. J.: A review of snow and ice albedo and the development of a new physically based broadband albedo parameterization. J. Geophys. Res.-Earth, 115, F01009, https://doi.org/10.1029/2009JF001444, 2010.
Gelaro, R., McCarty, W., Suárez, M. J., Todling, R., Molod, A., Takacs, L., Randles, C., Darmenov, A., Bosilovich, M., Reichle, R., Wargan, K., Coy, L., Cullather, R., Draper, C., Akalla, S., Buchard, V., Conaty, A., da Silva, A., Gu, W., Kim, G.-K., Koster, R., Lucchesi, R., Merkova, D., Nielsen, J., Partyka, G., Pawson, S., Putman, W., Rienecker, M., Schubert, S., Sienkiewitz, M., and Zhao, B.: The modern-era retrospective analysis for research and applications, version 2 (MERRA-2), J. Climate, 30, 5419–5454, 2017.
Groh, A. and Horwath, M.: The method of tailored sensitivity kernels for GRACE mass change estimates, Geophysical Research Abstracts, 18, EGU2016-12065, 2016 (data available at: http://products.esa-icesheets-cci.org/products/downloadlist/GMB/, last access: 26 October 2018).
Heidinger, A. K., Straka III, W. C., Molling, C. C., Sullivan, J. T., and Wu, X.: Deriving an inter-sensor consistent calibration for the AVHRR solar reflectance data record, Int. J. Remote, 31, 6493–6517, 2010.
Hall, D. K., Riggs, G. A., and Salomonson, V. V.: Development of methods for mapping global snow cover using moderate resolution imaging spectroradiometer data, Remote Sens. Environ., 54, 127–140, 1995.
Hanna, E., Jones, J. M., Cappelen, J., Mernild, S. H., Wood, L., Steffen, K., and Huybrechts, P.: The influence of North Atlantic atmospheric and oceanic forcing effects on 1900–2010 Greenland summer climate and ice melt/runoff, Int. J. Climatol., 33, 862–880, 2013 (data available at: https://www.esrl.noaa.gov/psd/data/timeseries/daily/GBI/, last access: 5 July 2019).
Hanna, E., Fettweis, X., Mernild, S. H., Cappelen, J., Ribergaard, M. H., Shuman, C. A., Steffen, K., Wood, L., and Mote, T. L.: Atmospheric and oceanic climate forcing of the exceptional Greenland ice sheet surface melt in summer 2012, Int. J. Climatol., 34, 1022–1037, 2014.
Hanna, E., Cropper, T. E., Hall, R. J., and Cappelen, J.: Greenland Blocking Index 1851–2015: a regional climate change signal, Int. J. Climatol., 36, 4847–4861, 2016.
Helm, V., Humbert, A., and Miller, H.: Elevation and elevation change of Greenland and Antarctica derived from CryoSat-2, The Cryosphere, 8, 1539–1559, https://doi.org/10.5194/tc-8-1539-2014, 2014.
Hofer, S., Tedstone, A. J., Fettweis, X., and Bamber, J. L.: Decreasing cloud cover drives the recent mass loss on the Greenland Ice Sheet, Sci. Adv., 3, e1700584, https://doi.org/10.1126/sciadv.1700584, 2017.
Hakkinen, S. and Rhines, P. B.: Shifting surface currents in the northern North Atlantic Ocean, J. Geophys. Res.-Oceans, 114, C04005, https://doi.org/10.1029/2008JC004883, 2009.
Hurrell, J. W. and Deser, C.: North Atlantic climate variability: the role of the North Atlantic Oscillation, J. Marine Syst., 79, 231–244, 2009.
Jonsell, U., Hock, R., and Holmgren, B.: Spatial and temporal variations in albedo on Storglaciären, Sweden, J. Glaciol., 49, 59–68, 2003.
Jääskeläinen, E., Manninen, T., Tamminen, J., and Laine, M.: The Aerosol Index and Land Cover Class Based Atmospheric Correction Aerosol Optical Depth Time Series 1982–2014 for the SMAC Algorithm, Remote Sensing, 9, 1095, https://doi.org/10.3390/rs9111095, 2017.
Karlsson, K.-G., Anttila, K., Trentmann, J., Stengel, M., Fokke Meirink, J., Devasthale, A., Hanschmann, T., Kothe, S., Jääskeläinen, E., Sedlar, J., Benas, N., van Zadelhoff, G.-J., Schlundt, C., Stein, D., Finkensieper, S., Håkansson, N., and Hollmann, R.: CLARA-A2: the second edition of the CM SAF cloud and radiation data record from 34 years of global AVHRR data, Atmos. Chem. Phys., 17, 5809–5828, https://doi.org/10.5194/acp-17-5809-2017, 2017a.
Karlsson, K.-G., Anttila, K., Trentmann, J., Stengel, M., Meirink, J. F., Devasthale, A., Hanschmann, T., Kothe, S., Jääskeläinen, E., Sedlar, J., Benas, N., van Zadelhoff, G.-J., Schlundt, C., Stein, D., Finkensieper, S., Håkansson, N., Hollmann, R., Fuchs, P., and Werscheck, M.: CLARA-A2: CM SAF cLoud, Albedo and surface RAdiation dataset from AVHRR data – Edition 2, Satellite Application Facility on Climate Monitoring, https://doi.org/10.5676/EUM_SAF_CM/CLARA_AVHRR/V002, 2017b.
King, M. D., Howat, I. M., Jeong, S., Noh, M. J., Wouters, B., Noël, B., and van den Broeke, M. R.: Seasonal to decadal variability in ice discharge from the Greenland Ice Sheet, The Cryosphere, 12, 3813–3825, https://doi.org/10.5194/tc-12-3813-2018, 2018.
Knap, W. H. and Oerlemans, J.: The surface albedo of the Greenland ice sheet: satellite-derived and in situ measurements in the Søndre Strømfjord area during the 1991 melt season, J. Glaciol., 42, 364–374, 1996.
Konzelmann, T. and Braithwaite, R. J.: Variations of ablation, albedo and energy balance at the margin of the Greenland ice sheet, Kronprins Christian Land, eastern north Greenland, J. Glaciol., 41, 174–182, 1995.
Koyama, T. and Stroeve, J.: Greenland monthly precipitation analysis from the Arctic System Reanalysis (ASR): 2000–2012, Polar Science, 2018.
Mattingly, K. S., Mote, T. L., and Fettweis, X.: Atmospheric river impacts on Greenland Ice Sheet surface mass balance, J. Geophys. Res.-Atmos., 123, 8538–8560, 2018.
Mayer-Gürr, T., Behzadpour, S., Ellmer, M., Kvas, A., Klinger, B., and Zehentner, N.: ITSG-Grace2016 – Monthly and Daily Gravity Field Solutions from GRACE, GFZ Data Services, https://doi.org/10.5880/icgem.2016.007, 2016.
McLeod, J. T. and Mote, T. L.: Linking interannual variability in extreme Greenland blocking episodes to the recent increase in summer melting across the Greenland ice sheet, Int. J. Climatol., 36, 1484–1499, 2016.
Meinander, O., Kazadzis, S., Arola, A., Riihelä, A., Räisänen, P., Kivi, R., Kontu, A., Kouznetsov, R., Sofiev, M., Svensson, J., Suokanerva, H., Aaltonen, V., Manninen, T., Roujean, J.-L., and Hautecoeur, O.: Spectral albedo of seasonal snow during intensive melt period at Sodankylä, beyond the Arctic Circle, Atmos. Chem. Phys., 13, 3793–3810, https://doi.org/10.5194/acp-13-3793-2013, 2013.
Mioduszewski, J. R., Rennermalm, A. K., Hammann, A., Tedesco, M., Noble, E. U., Stroeve, J. C., and Mote, T. L.: Atmospheric drivers of Greenland surface melt revealed by self-organizing maps, J. Geophys. Res.-Atmos., 121, 5095–5114, 2016.
Mouginot, J., Rignot, E., Scheuchl, B., Fenty, I., Khazendar, A., Morlighem, M., Buzzi, A., and Paden, J.: Fast retreat of Zachariæ Isstrøm, northeast Greenland, Science, 350, 1357–1361, 2015.
Moustafa, S. E., Rennermalm, A. K., Román, M. O., Wang, Z., Schaaf, C. B., Smith, L. C., Koenig, L., and Erb, A.: Evaluation of satellite remote sensing albedo retrievals over the ablation area of the southwestern Greenland ice sheet, Remote Sens. Environ., 198, 115–125, 2017.
Murray, T., Scharrer, K., James, T. D., Dye, S. R., Hanna, E., Booth, A. D., Selmes, N., Luckman, A., Hughes, A. L. C., Cook, S., and Huybrechts, P.: Ocean regulation hypothesis for glacier dynamics in southeast Greenland and implications for ice sheet mass changes, J. Geophys. Res.-Earth, 115, F03026, https://doi.org/10.1029/2009JF001522, 2010.
Neff, W., Compo, G. P., Martin Ralph, F., and Shupe, M. D.: Continental heat anomalies and the extreme melting of the Greenland ice surface in 2012 and 1889, J. Geophys. Res.-Atmos., 119, 6520–6536, 2014.
Oltmanns, M., Straneo, F., and Tedesco, M.: Increased Greenland melt triggered by large-scale, year-round cyclonic moisture intrusions, The Cryosphere, 13, 815–825, https://doi.org/10.5194/tc-13-815-2019, 2019.
Pirazzini, R., Vihma, T., Granskog, M. A., and Cheng, B.: Surface albedo measurements over sea ice in the Baltic Sea during the spring snowmelt period, Ann. Glaciol., 44, 7–14, https://doi.org/10.3189/172756406781811565, 2006.
Polashenski, C. M., Dibb, J. E., Flanner, M. G., Chen, J. Y., Courville, Z. R., Lai, A. M., Schauer, J., Shafer, M., and Bergin, M.: Neither dust nor black carbon causing apparent albedo decline in Greenland's dry snow zone: Implications for MODIS C5 surface reflectance, Geophys. Res. Lett., 42, 9319–9327, 2015.
Rajewicz, J. and Marshall, S. J.: Variability and trends in anticyclonic circulation over the Greenland ice sheet, 1948–2013, Geophys. Res. Lett., 41, 2842–2850, 2014.
Reeves Eyre, J. E. J. and Zeng, X.: Evaluation of Greenland near surface air temperature datasets, The Cryosphere, 11, 1591–1605, https://doi.org/10.5194/tc-11-1591-2017, 2017.
Riihelä, A., Manninen, T., Laine, V., Andersson, K., and Kaspar, F.: CLARA-SAL: a global 28 yr timeseries of Earth's black-sky surface albedo, Atmos. Chem. Phys., 13, 3743–3762, https://doi.org/10.5194/acp-13-3743-2013, 2013.
Riihelä, A., Key, J. R., Meirink, J. F., Kuipers Munneke, P., Palo, T., and Karlsson, K. G.: An intercomparison and validation of satellite-based surface radiative energy flux estimates over the Arctic, J. Geophys. Res.-Atmos., 122, 4829–4848, 2017.
Ryan, J. C., Hubbard, A., Stibal, M., Irvine-Fynn, T. D., Cook, J., Smith, L. C., Cameron, K., and Box, J.: Dark zone of the Greenland Ice Sheet controlled by distributed biologically-active impurities, Nat. Commun., 9, 1065, https://doi.org/10.1038/s41467-018-03353-2, 2018.
Sasgen, I., van den Broeke, M., Bamber, J. L., Rignot, E., Sørensen, L. S., Wouters, B., Martinec, Z., Velicogna, I., and Simonsen, S. B.: Timing and origin of recent regional ice-mass loss in Greenland, Earth Planet. Sc. Lett., 333, 293–303, 2012.
Schaaf, C. B., Gao, F., Strahler, A. H., Lucht, W., Li, X., Tsang, T., Strugnell, N., Zhang, X., Jin, Y., Muller, J-P., Lewis, P., Barnsley, M., Hobson, P., Disney, M., Roberts, G., Dunderdale, M., Doll, C., d'Entremont, R., Hu, B., Liang, S., Privette, J., and Roy, D.: First operational BRDF, albedo nadir reflectance products from MODIS, Remote Sens. Environ., 83, 135–148, 2002.
Schoof, C.: Ice-sheet acceleration driven by melt supply variability. Nature, 468, 803–806, https://doi.org/10.1038/nature09618, 2010.
Sen, P. K.: Estimates of the Regression Coefficient Based on Kendall's Tau, J. Am. Stat. Assoc., 63, 1379–1389, 1968.
Sørensen, L. S. and Forsberg, R.: Greenland ice sheet mass loss from GRACE monthly models, gravity, Geoid Earth Obs., 135, 527–532, https://doi.org/10.1007/978-3-642-10634-7_70, 2010.
Stearns, L. A. and van der Veen, C. J.: Friction at the bed does not control fast glacier flow, Science, 361, 273–277, 2018.
Straneo, F., Curry, R. G., Sutherland, D. A., Hamilton, G. S., Cenedese, C., Våge, K., and Stearns, L. A.: Impact of fjord dynamics and glacial runoff on the circulation near Helheim Glacier, Nat. Geosci., 4, 322–327, https://doi.org/10.1038/ngeo1109, 2011.
Stroeve, J.: Assessment of Greenland albedo variability from the advanced very high resolution radiometer Polar Pathfinder data set, J. Geophys. Res.-Atmos., 106, 33989–34006, https://doi.org/10.1029/2001JD900072, 2001.
Stroeve, J., Box, J. E., Wang, Z., Schaaf, C., and Barrett, A.: Re-evaluation of MODIS MCD43 Greenland albedo accuracy and trends, Remote Sens. Environ., 138, 199–214, 2013.
Tedesco, M., Fettweis, X., Van den Broeke, M. R., Van de Wal, R. S. W., Smeets, C. J. P. P., van de Berg, W. J., Serreze, M., and Box, J. E.: The role of albedo and accumulation in the 2010 melting record in Greenland, Environ. Res. Lett., 6, 014005, https://doi.org/10.1088/1748-9326/6/1/014005, 2011.
Tedesco, M., Box, J. E., Cappelen, J., Fettweis, X., Jensen, T. S., Mote, T., Rennermalm, A. K., Smith, L. C., van de Wal, R. S. W., and Wahr, J.: Greenland Ice Sheet in: State of the Climate in 2013, B. Am. Meteorol. Soc., 95, S5–49, 2014.
Tedesco, M., Mote, T., Fettweis, X., Hanna, E., Jeyaratnam, J., Booth, J. F., Datta, R., and Briggs, K.: Arctic cut-off high drives the poleward shift of a new Greenland melting record, Nat. Commun., 7, 11723, https://doi.org/10.1038/ncomms11723, 2016a.
Tedesco, M., Doherty, S., Fettweis, X., Alexander, P., Jeyaratnam, J., and Stroeve, J.: The darkening of the Greenland ice sheet: trends, drivers, and projections (1981–2100), The Cryosphere, 10, 477–496, https://doi.org/10.5194/tc-10-477-2016, 2016b.
Tedstone, A. J., Nienow, P. W., Gourmelen, N., Dehecq, A., Goldberg, D., and Hanna, E.: Decadal slowdown of a land-terminating sector of the Greenland Ice Sheet despite warming, Nature, 526, 692–695, https://doi.org/10.1038/nature15722, 2015.
Tedstone, A. J., Bamber, J. L., Cook, J. M., Williamson, C. J., Fettweis, X., Hodson, A. J., and Tranter, M.: Dark ice dynamics of the south-west Greenland Ice Sheet, The Cryosphere, 11, 2491–2506, https://doi.org/10.5194/tc-11-2491-2017, 2017.
Theil, H.: A rank-invariant method of linear and polynominal regression analysis (Parts 1–3) in: Ned. Akad. Wetensch. Proc. Ser. A, 53, 1397–1412, 1950.
van den Broeke, M., Box, J., Fettweis, X., Hanna, E., Noël, B., Tedesco, M., van As, D., van de Berg, W., and van Kampenhout, L.: Greenland ice sheet surface mass Loss: recent developments in observation and modeling, Current Climate Change Reports, 3, 345–356, 2017.
van den Broeke, M. R., Enderlin, E. M., Howat, I. M., Kuipers Munneke, P., Noël, B. P. Y., van de Berg, W. J., van Meijgaard, E., and Wouters, B.: On the recent contribution of the Greenland ice sheet to sea level change, The Cryosphere, 10, 1933–1946, https://doi.org/10.5194/tc-10-1933-2016, 2016.
Välisuo, I., Vihma, T., Pirazzini, R., and Schäfer, M.: Interannual Variability of Atmospheric Conditions and Surface Melt in Greenland in 2000–2014, J. Geophys. Res.-Atmos., 123, 10–443, 2018.
Wong, G. J., Osterberg, E. C., Hawley, R. L., Courville, Z. R., Ferris, D. G., and Howley, J. A.: Coast-to-interior gradient in recent northwest Greenland precipitation trends (1952–2012), Environ. Res. Lett., 10, 114008, https://doi.org/10.1088/1748-9326/10/11/114008, 2015.
Xuan, X. and Murphy, K.: Modeling changing dependency structure in multivariate time series, in: Proceedings of the 24th international conference on Machine learning, ACM, 1055–1062, 2007.