the Creative Commons Attribution 4.0 License.
the Creative Commons Attribution 4.0 License.
 | 24 Jan 2019
Characterizing the behaviour of surge- and non-surge-type glaciers in the Kingata Mountains, eastern Pamir, from 1999 to 2016
Mingyang Lv
Huadong Guo
Xiancai Lu
Guang Liu
Shiyong Yan
Zhixing Ruan
Yixing Ding
Duncan J. Quincey
Glaciers in the Pamir Mountains are generally acknowledged to be in a stable state and show the least glacial retreat in high-mountain Asia; however, they are also some of the most dynamic glaciers in the region and their behaviour has been spatially variable in recent decades. Few data exist for these glaciers, in particular relating to how they are responding to recent climatic changes. Here, we utilize Landsat 7 (ETM+), Landsat 8 (OLI), ASTER, and Google Earth optical images acquired between 1999 and 2016 to characterize the dynamics of the glaciers in the Kingata Mountains, located in the eastern Pamir Mountains. We quantify the velocity, areal, and frontal changes of these glaciers, which provide us with valuable data on their recent dynamic evolution and an indication of how they may evolve in future years. We highlight 28 glaciers among which 17 have changed markedly over the study period. We identify four advancing glaciers and 13 surge-type glaciers. The dynamic evolution of the glacier surges shows some similarity with those of the nearby Karakoram, suggesting that both hydrological and thermal controls are important for surge initiation and recession. Topography seems to be a dominant control on non-surge glacier behaviour in the Kingata Mountains, with the north side of the divide characterized by steep, avalanche-fed basins and glacier tongues now approaching recession in contrast to those on the south side of the divide that capture the majority of precipitation and have much broader plateau-like accumulation zones. This study is the first synthesis of glacial motion across this region and provides a baseline with which to compare future changes.
- Article
(16217 KB) - Full-text XML
-
Supplement
(15162 KB) - BibTeX
- EndNote


Changes in mountain glaciers represent a key indicator of climate variability, as well as contributing to sea-level-rise and at times being the source of flood hazards (Oerlemans, 1994; Meier et al., 2007; Burgess et al., 2013; Gardner et al., 2013). High-mountain Asia (HMA), extending from the Hindu Kush and Tien Shan in the west to the glaciers and snowfields of Yunnan, China, in the east, contains the greatest mass of ice outside the Earth's polar regions. Since the 1990s, the glaciers in HMA have broadly been in recession, and the glacier mass balance has been negative (Yao et al., 2004; Tian et al., 2006). Rates of recession generally decrease towards the western part of the region (Yao et al., 2012). Indeed, in the far west, the eastern Pamir Mountains are characterized by relatively stable glaciers and, although there remains debate within the literature regarding the details (Khromova et al., 2006; Bolch et al., 2012; Kääb et al., 2012; Farinotti et al., 2015), recent research has revealed that Pamir, along with the nearby Karakoram, is the region of transition from positive to negative mass balance, with the eastern Pamir Mountains experiencing a slight positive mass balance in the early twenty-first century (Gardelle et al., 2012, 2013; Gardner et al., 2013; Osmonov et al., 2013; Holzer et al., 2015; Kääb et al., 2015; Brun et al., 2017).
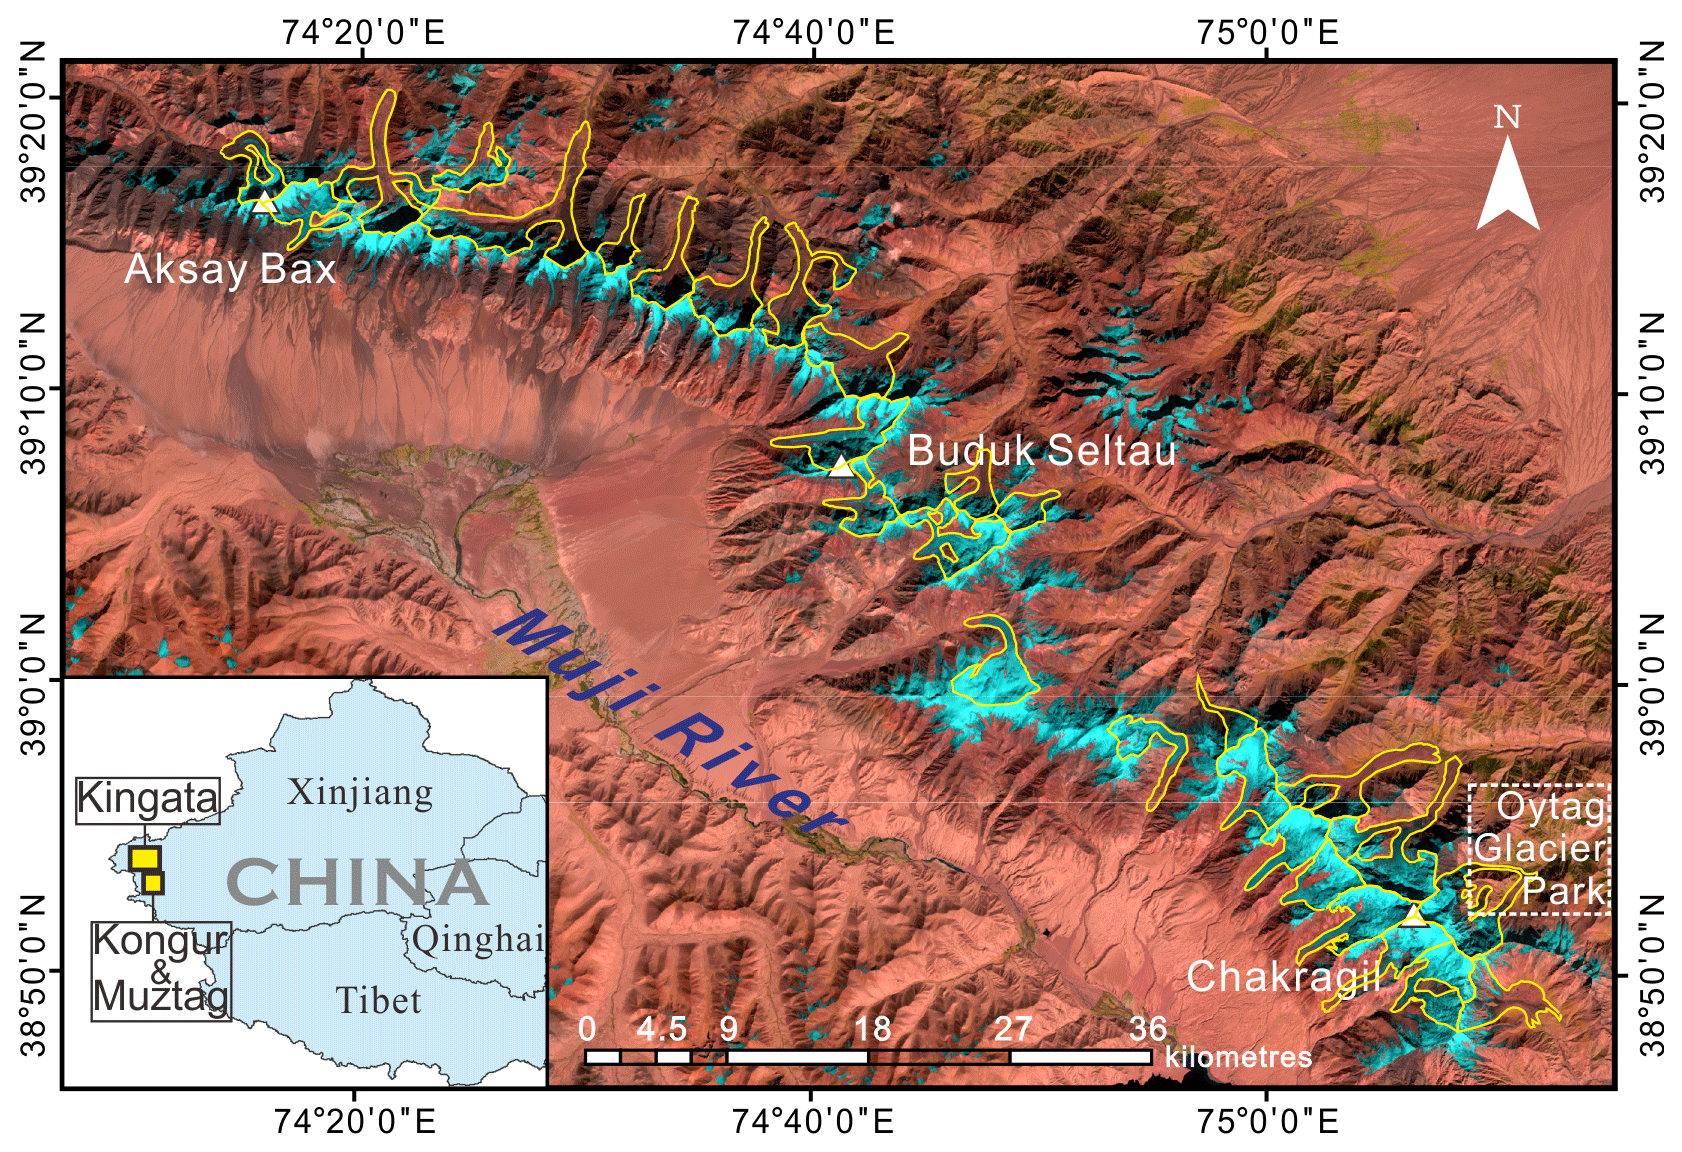
Figure 1Landsat OLI image (bands 6, 5, and 4) of the Kingata Mountains acquired on 3 October 2014. Light blue areas represent bare ice, red-brown areas represent bare soil and rocks, and green areas represent grass or other vegetation. Glaciers with areas greater than 5 km2 are highlighted by yellow lines.
Within the eastern Pamir Mountains lie the Kingata Mountains (KM) (Fig. 1). Due to their remoteness and harsh environment, few ground-based glaciological studies have been carried out (Thompson et al., 1995; Ono et al., 1997; Shangguan et al., 2016). Remote-sensing studies have provided most of the available data for this region, using both optical and radar imagery to evaluate the temporal changes in glacier extent and flow (Kääb, 2002; Luckman et al., 2007; Yang et al., 2013; Yasuda and Furuya, 2015). Three approaches have generally been employed to derive displacements of the glacier surface: offset tracking based on intensity using both optical and synthetic aperture radar (SAR) imagery (Copland et al., 2009; Quincey et al., 2011, 2015; Burgess et al., 2013), interferometric SAR (InSAR) (Goldstein et al., 1993; Kenyi and Kaufmann, 2003; Gourmelen et al., 2011), and a combination of these two methods (Yan et al., 2016). Images acquired by optical sensors are often limited by cloud and snow cover as well as coarse spatial resolutions, but the existing global archive offers many possibilities to match features across image pairs over annual to multi-annual timescales. Cross-correlation provides a quick and efficient way of measuring glacier surface displacement and is routinely applied to images acquired by the Advanced Spaceborne Thermal Emission and Reflection Radiometer (ASTER) and Landsat sensors (Luckman et al., 2007; Scherler et al., 2008; Quincey et al., 2015).
Glacier surges represent an endmember of glacier flow and remain relatively poorly understood despite an increase in related studies in recent years (Gladstone et al., 2014; Quincey et al., 2015; Sevestre and Benn, 2015; Yasuda and Furuya, 2015). Most surges occur in regular cycles consisting of active phases and quiescent phases (Meier and Post, 1969). During the active phase of a surge, glacier velocities can increase by 1 or 2 orders of magnitude within a few months, often accompanied by an advance of the glacier tongue as large volumes of ice are discharged from high to low elevations (Clarke, 1987; Raymond, 1987; Harrison and Post, 2003). During quiescent phases, these glaciers recharge their ice reservoirs at high elevation and recede across their ablation area. Since glacier surges are closely related to glacial hazards such as glacial lake outburst floods and debris flows, research on their controls and evolution has become a particular focus within the literature (Kargel et al., 2005; Gladstone et al., 2014; Dunse et al., 2015). Glacier surges are reported all over the world and HMA, particularly the Pamirs, Karakoram, and Tien Shan, is regarded as one of the most active surge zones (Sevestre and Benn, 2015). An inventory of glacier surges for the Pamir plateau in Tajikistan based on remote sensing revealed that 51 out of 215 glaciers had signs of dynamic instability and were considered to be of surge type (Kotlyakov et al., 2008). However, this inventory did not include the surges in the Pamir Mountains in China or investigate any changes in glacier dynamics that have occurred over recent years.
The objective of this paper is, therefore, to characterize the dynamics of glaciers within the KM. In doing this, we will also be able to identify the distribution and characteristics of surge-type glaciers in this region and describe their evolution for the first time and make comparisons with studies from neighbouring regions. Supported by analyses of glacier terminus position and areal change, we aim to quantify the behaviour of glaciers within this region over a 17-year period. This study will therefore provide valuable baseline data for future studies focussing on the glaciers of this region and will help stakeholders such as regional water resource managers in the city of Kashgar where glacial meltwater plays an important role in supporting agriculture and livestock to better understand the likely evolution of these important water sources in coming decades.
The KM, located on the eastern Pamir plateau (38–39∘ N, 73–75∘ E), together with the neighbouring Kongur Mountains and Muztag Ata mountains in the near southeast, forms the main mountain range in the eastern Pamir Mountains. The mountain range is oriented approximately southeast–northwest, extending for a length of 120 km and width of 40 km (Fig. 1). The highest summit of the KM is Chakragil, 6760 m above sea level (a.s.l.). Two other major peaks exist in the middle and northern parts of the range, Buduk Seltau (6110 m a.s.l.) and Aksay Bax (6102 m a.s.l.), respectively. In the southwest, the Muji River flows along the southern slopes of KM towards the southeast. In the north of the southeastern end of the mountain range lies the Oytag Glacier Park.
Since the study area is one of the coldest and driest glacierized areas in middle-latitude regions, the glaciers are considered to be continental in type (Zhang, 1980; Su et al., 1989; Li et al., 2004; Jiang et al., 2014). They provide a critical natural water reservoir for people living downstream (Yao et al., 2004) and changes in glacier extent or behaviour can directly impact their ability to be able to irrigate their land and support daily life. Taxkogan meteorological station ( N, E; 3090.9 m a.s.l.) is located near the Muztag Ata mountains, approximately 150 km away from KM. Based on data from this station, annual precipitation is less than 70 mm. Peak ablation generally occurs between June and August, when the mean temperature is as high as 15 ∘C (at an elevation of ∼3000 m a.s.l.) and the monthly mean air temperature over the glacier termini can be higher than 0 ∘C (Shangguan et al., 2006). The climate is largely controlled by high-altitude westerly circulation with precipitation sourced at middle latitudes from the Mediterranean, Black, and Caspian seas (Su et al., 1989; Seong et al., 2009; Jiang et al., 2014). According to the Second Glacier Inventory Dataset of China, there are more than 216 glaciers in the KM, with a total area of 551.16 km2 (Guo et al., 2014). Their terminus elevations vary from 3100 to 5200 m a.s.l., and their mean slopes range from 20 to 40∘. Glaciers on its southern slopes are generally smaller than those on its northern slopes, and most glaciers on the northern side are heavily debris covered, which is likely to impact their dynamic evolution and long-term ablation rates (Scherler et al., 2011; Huang et al., 2018). Many glaciers in this region are small (less than 2 km2); here we focus on 28 glaciers with areas larger than 5 km2 and remote-sensing observations can be made with good accuracy.
3.1 Satellite imagery and DEM
We obtained 13 Landsat 7 Enhanced Thematic Mapper Plus (ETM+) images from 1999 to 2013, 17 Landsat 8 Operational Land Imager (OLI) images from 2013 to 2017, and 12 ASTER L1T images from 2003 to 2013, with minimal cloud and snow cover. Imagery from late summer and autumn (∼ July to October) was preferentially selected to minimize snow cover (Table S1 in the Supplement). Several Landsat 2 and Landsat 5 images were also obtained for the identification of surge-type glaciers and surge cycle periods. These images were acquired from the United States Geological Survey (USGS) Earth Resources Observation and Science Center (EROS) (http://glovis.usgs.gov/, last access: 6 January 2018). High-spatial-resolution images from Google Earth (data provided by DigitalGlobe, NASA, and Landsat/Copernicus) were also used for detailed visual interpretations of surface change. Feature tracking was mainly conducted using the Landsat 7 and Landsat 8 images. However, due to the Landsat 7 ETM+ scan line corrector failure in May 2003, several ASTER images were used for feature tracking from 2003 to 2013. All Landsat 7, Landsat 8, and ASTER data were used for glacial boundary identification. Landsat 7 and Landsat 8 images were preprocessed using the USGS Level-1 Product Generation System, which includes radiometric and geometric correction and transformation to universal transverse mercator (UTM) projection. Due to the limited number of cloud-free images available for velocity detection and in order to minimize the effect of seasonal velocity variations on our data, we selected image pairs separated by approximately 365 days for the analysis. All the imagery used in this study is listed in Table S1. The ASTER Global Digital Elevation Model (GDEM Version 2) of this area (38–39∘ N; 074∘–075∘ E) was acquired from NASA's Earth Observing System Data and Information System (EOSDIS) and was used for interrogating glacier surface elevation profiles in support of the velocity analyses.
3.2 Determination of glacial motion
Glacier surface displacement was quantified by performing co-registration and correlation of the optical imagery using the software package COSI-Corr (Co-registration of Optically Sensed Images and Correlation), described in detail by Leprince et al. (2007) and Scherler et al. (2008). Images were first co-registered in a common reference system, specifically the UTM grid, such that misalignment was less than a single pixel for any pair. The correlation step then uses a sliding window to measure horizontal displacements along the east–west and north–south directions separately. This technique has been validated on several case examples of horizontal ground displacements (Avouac et al., 2006; Ayoub et al., 2009; Herman et al., 2011) and proved to be an effective tool for deriving glacier surface displacement from optical satellite imagery (Heid and Kääb, 2011). Horizontal displacements were measured with the frequential sub-pixel correlator using a multi-scale approach in which the correlation window size changed from 32×32 to 8×8, sliding every pixel. All imagery used for surface displacement detection had a spatial resolution of 15 m (i.e. panchromatic bands of Landsat 7 (ETM+) and Landsat 8 (OLI), and ASTER band 3N). The measured column and row displacements were combined to obtain the magnitude and direction of glacier surface displacement. The glacier velocity (GV) was acquired using Eq. (1):
where D is the displacement measured between each image pair, Ai is the interval between the image pair in days, and Ay is the number of days in the year. The unit of GV is metres per year.
We selected 28 glaciers with areas (including the debris-covered part) of more than 5 km2. These 28 glaciers are all recorded in the Second Glacier Inventory Dataset of China (Guo et al., 2014). Several of them are composite glaciers with multiple tributaries feeding a glacier trunk. The annual velocity fields of these glaciers were derived from 1999 to 2003 utilizing Landsat 7 images, from 2003 to 2011 utilizing ASTER images, and from 2013 to 2016 utilizing Landsat 8 images. For most glaciers, we derived the annual velocity fields in two periods, 1999–2003 and 2013–2016, to highlight any evolution of the glacial motion patterns. In order to complete the time series and investigate motion variability in greater detail, we incorporated ASTER images from 2003 to 2011 to derive the displacements of several surge-type glaciers during the course of their surge events.
Errors in the derived data are reflected by the residual value in the motionless (stable terrain) area. We statistically analysed the residual error in the non-glacier region without rugged topography. The mean uncertainty was 1.6 m yr−1 with a corresponding standard deviation of 1.3 m yr−1. Velocity profiles for different years were extracted along the centreline of each glacier to consider the interannual variability. Due to the heavy debris cover, different snow-cover and cloud-cover conditions, and a relatively small size for some parts of the glaciers, decorrelation of the image pair is an unavoidable problem for monitoring glacial motion in this region. In order to reduce the impact of decorrelation, we smoothed the velocity map using a Gaussian low-path filtering method with a kernel size of 3×3 (45 m × 45 m in horizontal distance). We took values that differed by >20 m yr−1, compared to those in surrounding areas, as blunders and manually removed them from the resulting data. This quantitative measurement provides sufficient precision to characterize the glacial motion patterns in the study area.
3.3 Glacier delineation and identification of surge-type glaciers
Glaciers in the KM are heavily covered by debris, making the delineation of their boundaries a challenging task. Considering the paucity of glacial research in the study area, we utilized the Second Glacier Inventory Dataset of China to identify the glacierized area (Guo et al., 2014). Some glaciers converge together at lower elevations, in which case we treat them as a single ice mass. In order to understand and quantify the evolution of these glaciers, as most of them are debris covered on their termini, we manually measured the changes in glacier termini for each time period using ArcMap 10.3.1. Manually digitizing glacier outlines may give inconsistent and unreproducible results (Hall et al., 2003). We therefore used the method recommended by Paul et al. (2013) to measure the associated error. This entailed repeatedly digitizing the termini position of five differently sized glaciers in our study area and calculating the standard deviation of changes along their centre lines. The final accuracy of our manual measurement was calculated as 15.7 m. A combination of Landsat multispectral, Landsat panchromatic, and high-resolution images in Google Earth helped us to determine the characteristics of terminal changes.
When a glacier experienced some special surface features, such as moraine looping or folding in the middle of the glacier, ice foliation, glacier surface crevassing, or sudden advance of its tongue, we identify the glacier as surge type (Meier and Post, 1969; Barrand and Murray, 2006). In some cases, discrete changes in glacial motion during a certain time, such as a clear acceleration or deceleration in some part of, or along the entire glacier within adjacent years, were also taken as evidence of a surge event.
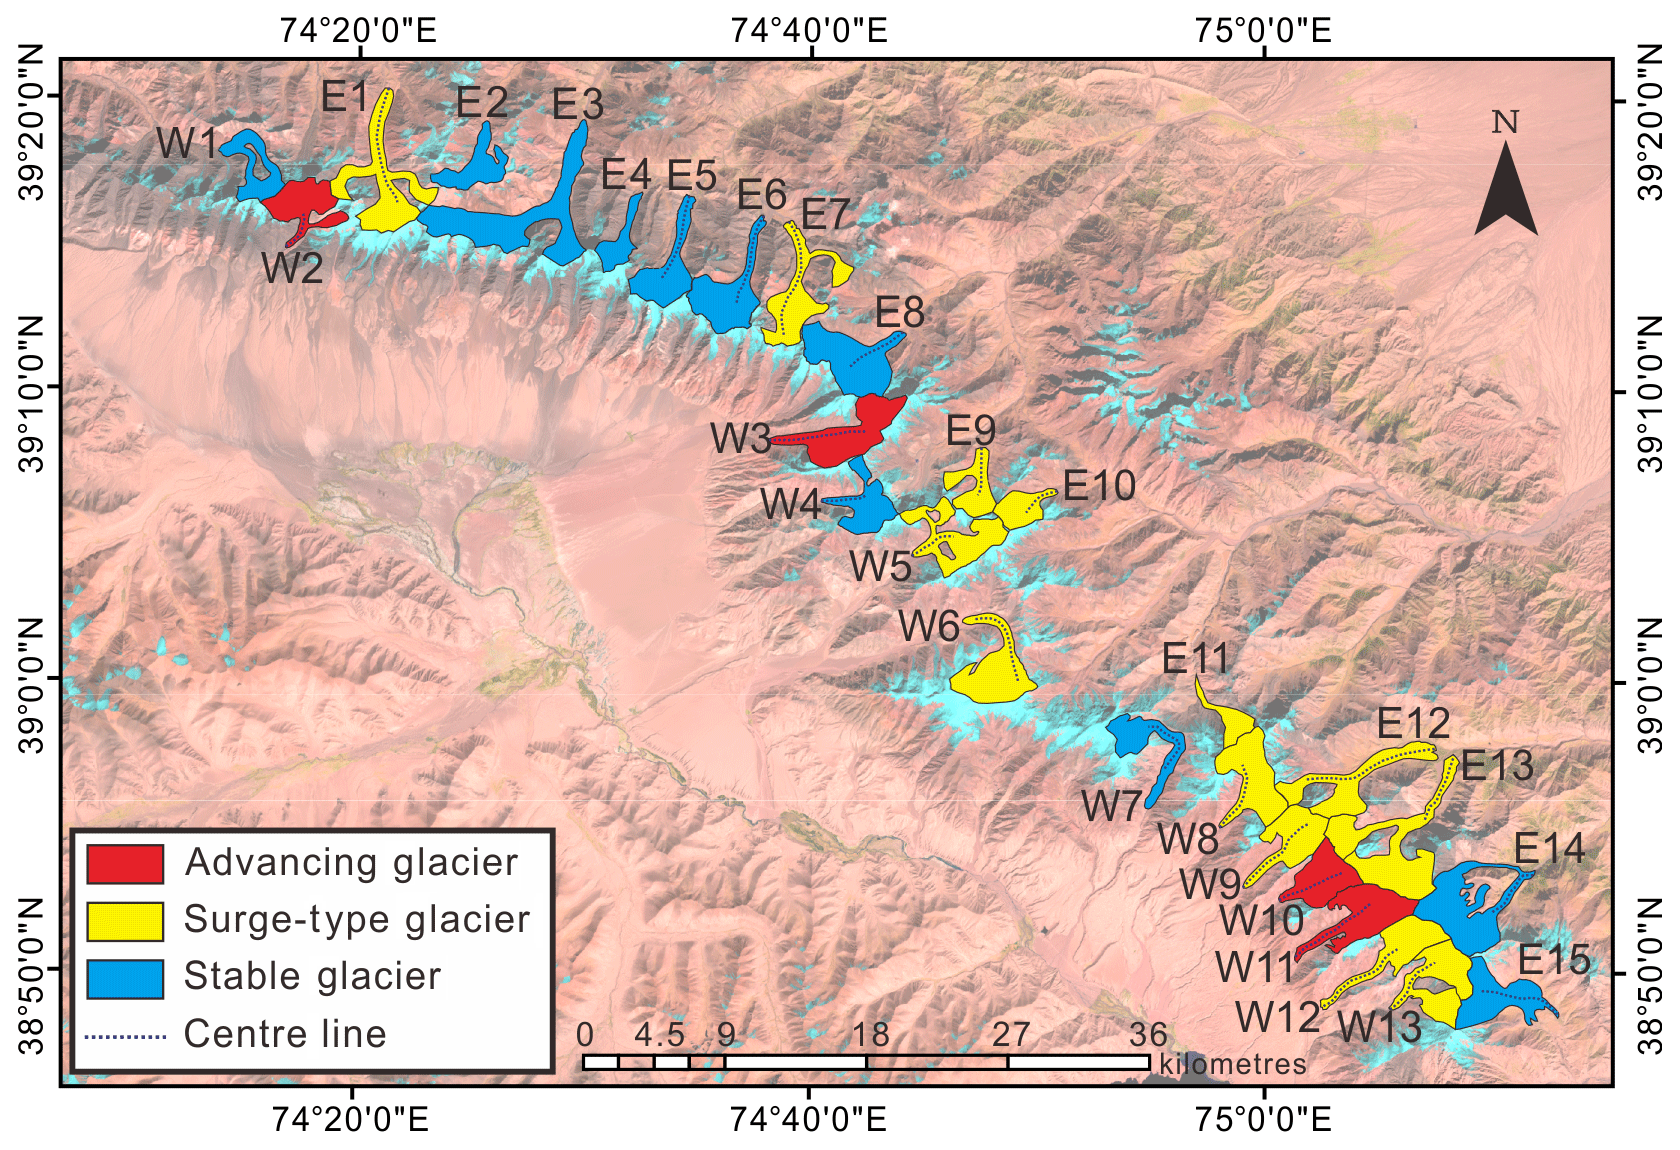
Through visual inspection of the satellite imagery we identified 17 out of 28 studied glaciers that had clearly changed in either terminus positions or surface features between 1999 and 2016 (Fig. 2). By directly comparing the differences between successive images and velocity profiles in different years, we classified these glaciers into 13 surge-type glaciers and 15 non-surge glaciers, including four advancing glaciers and 11 glaciers which did not show obvious changes in termini or surface features. Their characteristics, including areal changes, are listed in Table 1. In general, our data show that glaciers on northeast-facing slopes are lower and more heavily debris covered than those on southwest-facing slopes (Table 1). The total glacier area in 2016 was 357.19 km2, an increase of more than 1.33 km2 since 1999.
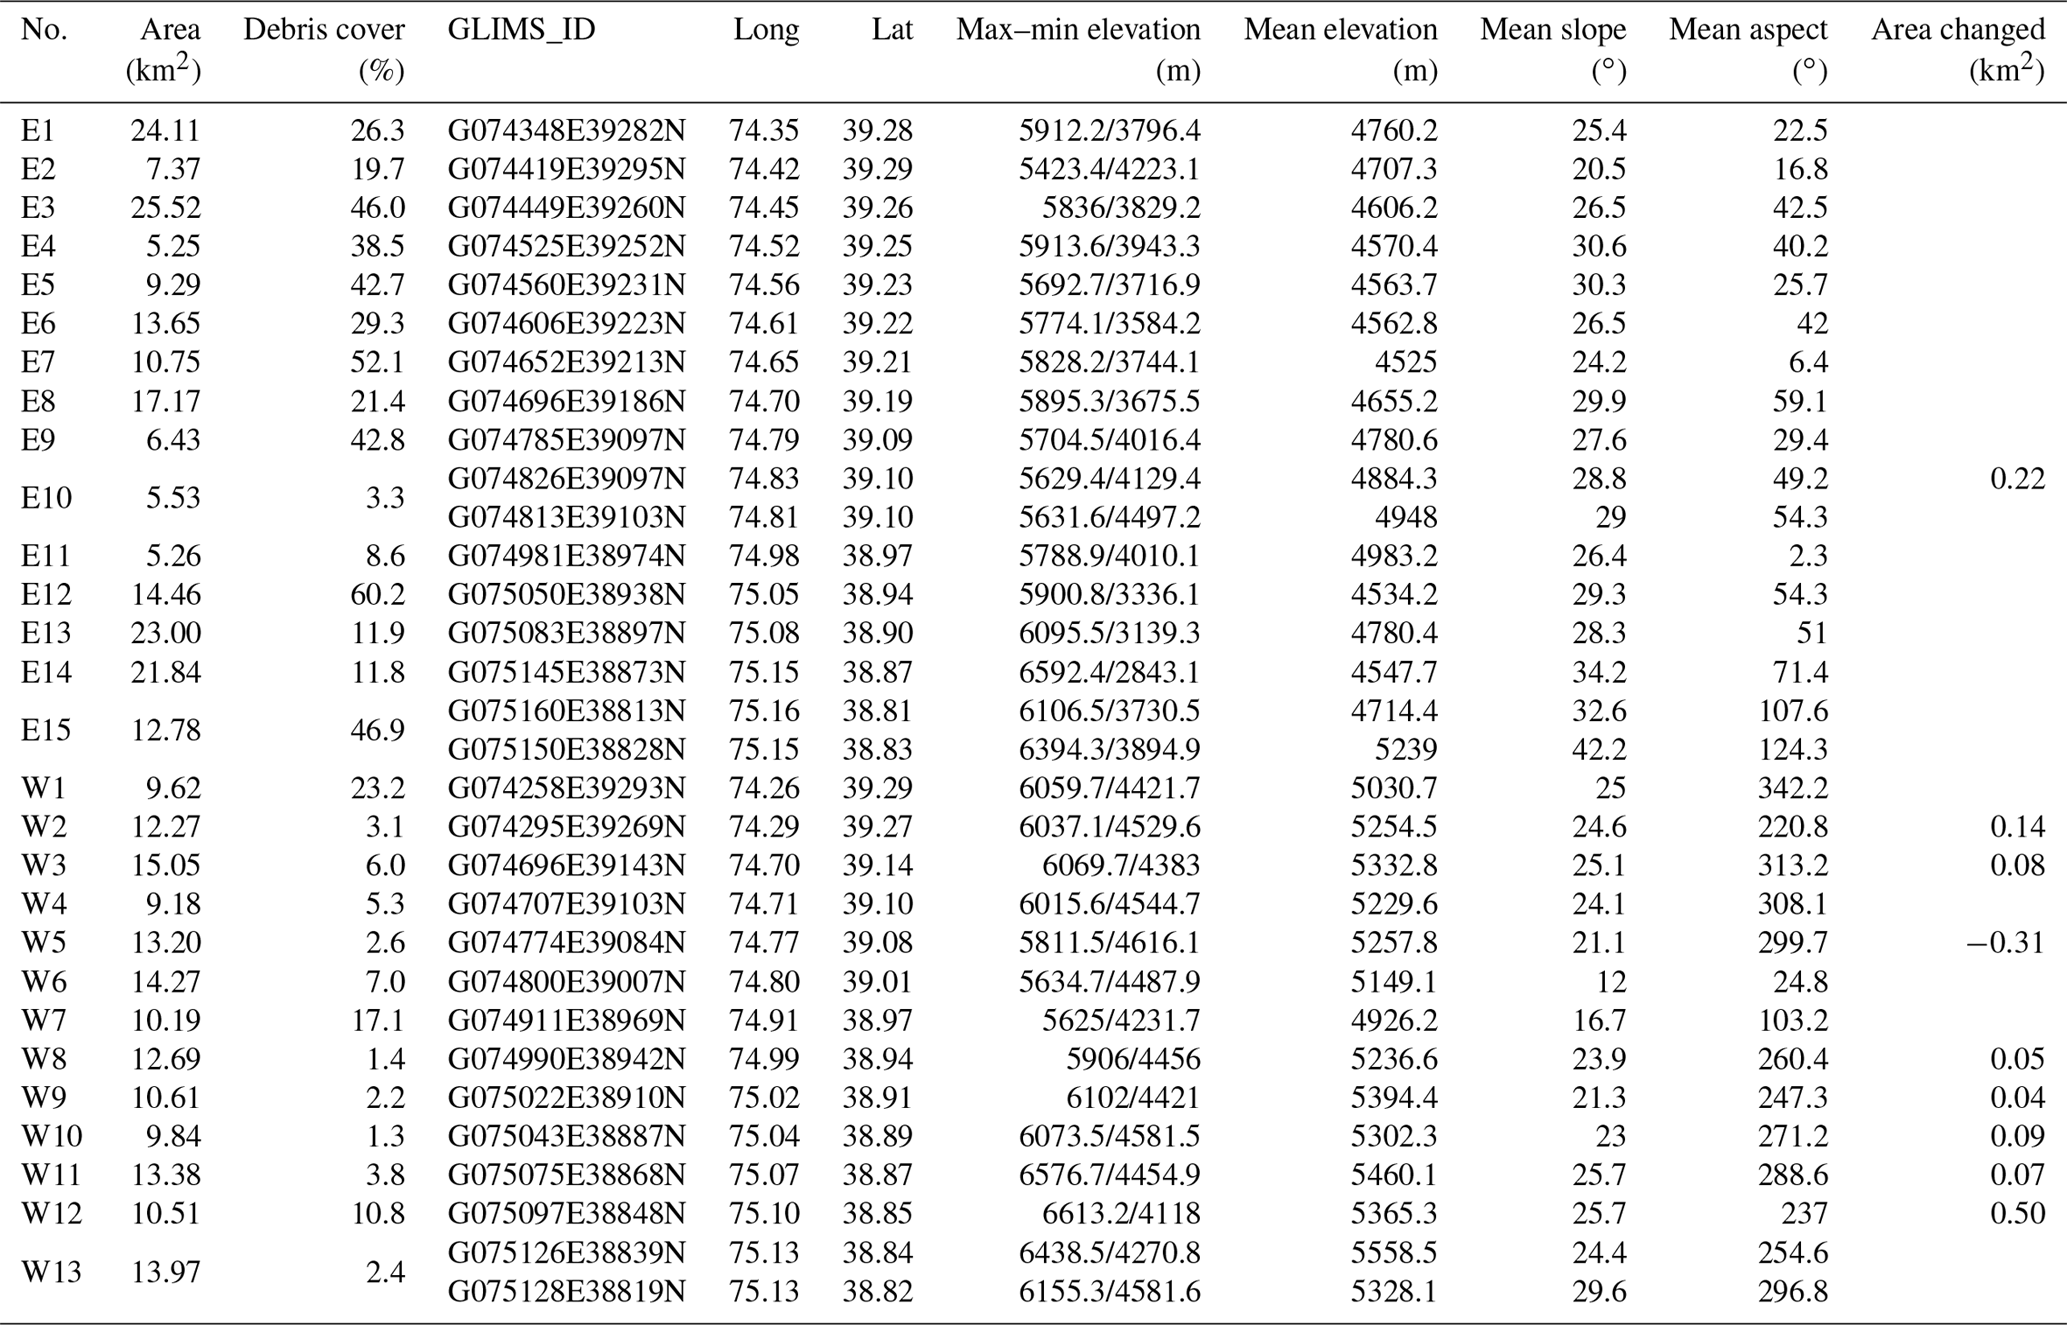
Table 1Attributes of the glaciers in this study. Glacier area and percentage of debris cover are measured based on images in 2016. Values relating to areal changes were measured from 1999 to 2016. E10, E15, and W13 are composite glaciers as recorded in the Second Glacier Inventory Dataset of China.
Of the 17 glaciers that showed change over the study period, we measured the changes in terminus positions for four advancing glaciers and five surge-type glaciers with the remaining eight showing no clear terminus fluctuations (Fig. 3). As surge-type glaciers, the termini of W9, W12, and E10 moved more than 500 m over relatively short time periods. The durations of these surges ranged from 1 year to several years (Table 2). Even though W8 has not shown significant glacier terminus movements since 1999, there was a clear terminus advance between 1993 and 1999 (Fig. S1 in the Supplement) and its terminus position change also shows a trend similar to the records of W12 and E10 after their rapid advances. For W13, we measured the change of the south branch glacier terminus. The main (west) branch terminus of W13 remained stable over the observation period; however, the east branch surged into the main branch at a rate of approximately 100 m yr−1 from 2007 to 2016. The termini of advancing glaciers (W2, W3, W10, and W11) changed less than 300 m and did not change abruptly from 1999 to 2016. They remained relatively stable until 2007 and moved down-valley with a speed of at most 30 m yr−1 thereafter. W5 diminished in size year to year between 1999 and 2016.

Figure 3Changes in glacier terminus positions from 1999 to 2016 for 10 glaciers with detectable change.
Table 2Detailed information of each surge-type glacier in this study including evidence of each surge event, their initiating and terminating year, and their duration.

4.1 Non-surge glaciers: advancing glaciers
Four advancing glaciers (W2, W3, W10, and W11) are located on the southwestern slopes of the KM with a relatively lower percentage of debris cover than the glaciers on the northeastern slopes. Their surface features did not undergo significant change, but they all advanced (W2: 245 m, W3: 212 m, W10: 154 m, and W11: 224 m) from 1999 to 2016, leading to a total increase of 0.38 km2 (Fig. 4). The appearance of ice crevasses and rearrangement of surface debris cover was evident on W2, W10, and W11, and surface hydrology was also modified with the disappearance of a glacial pond at the margin of W11 and change of glacial pond distribution on W10 (Fig. S2).
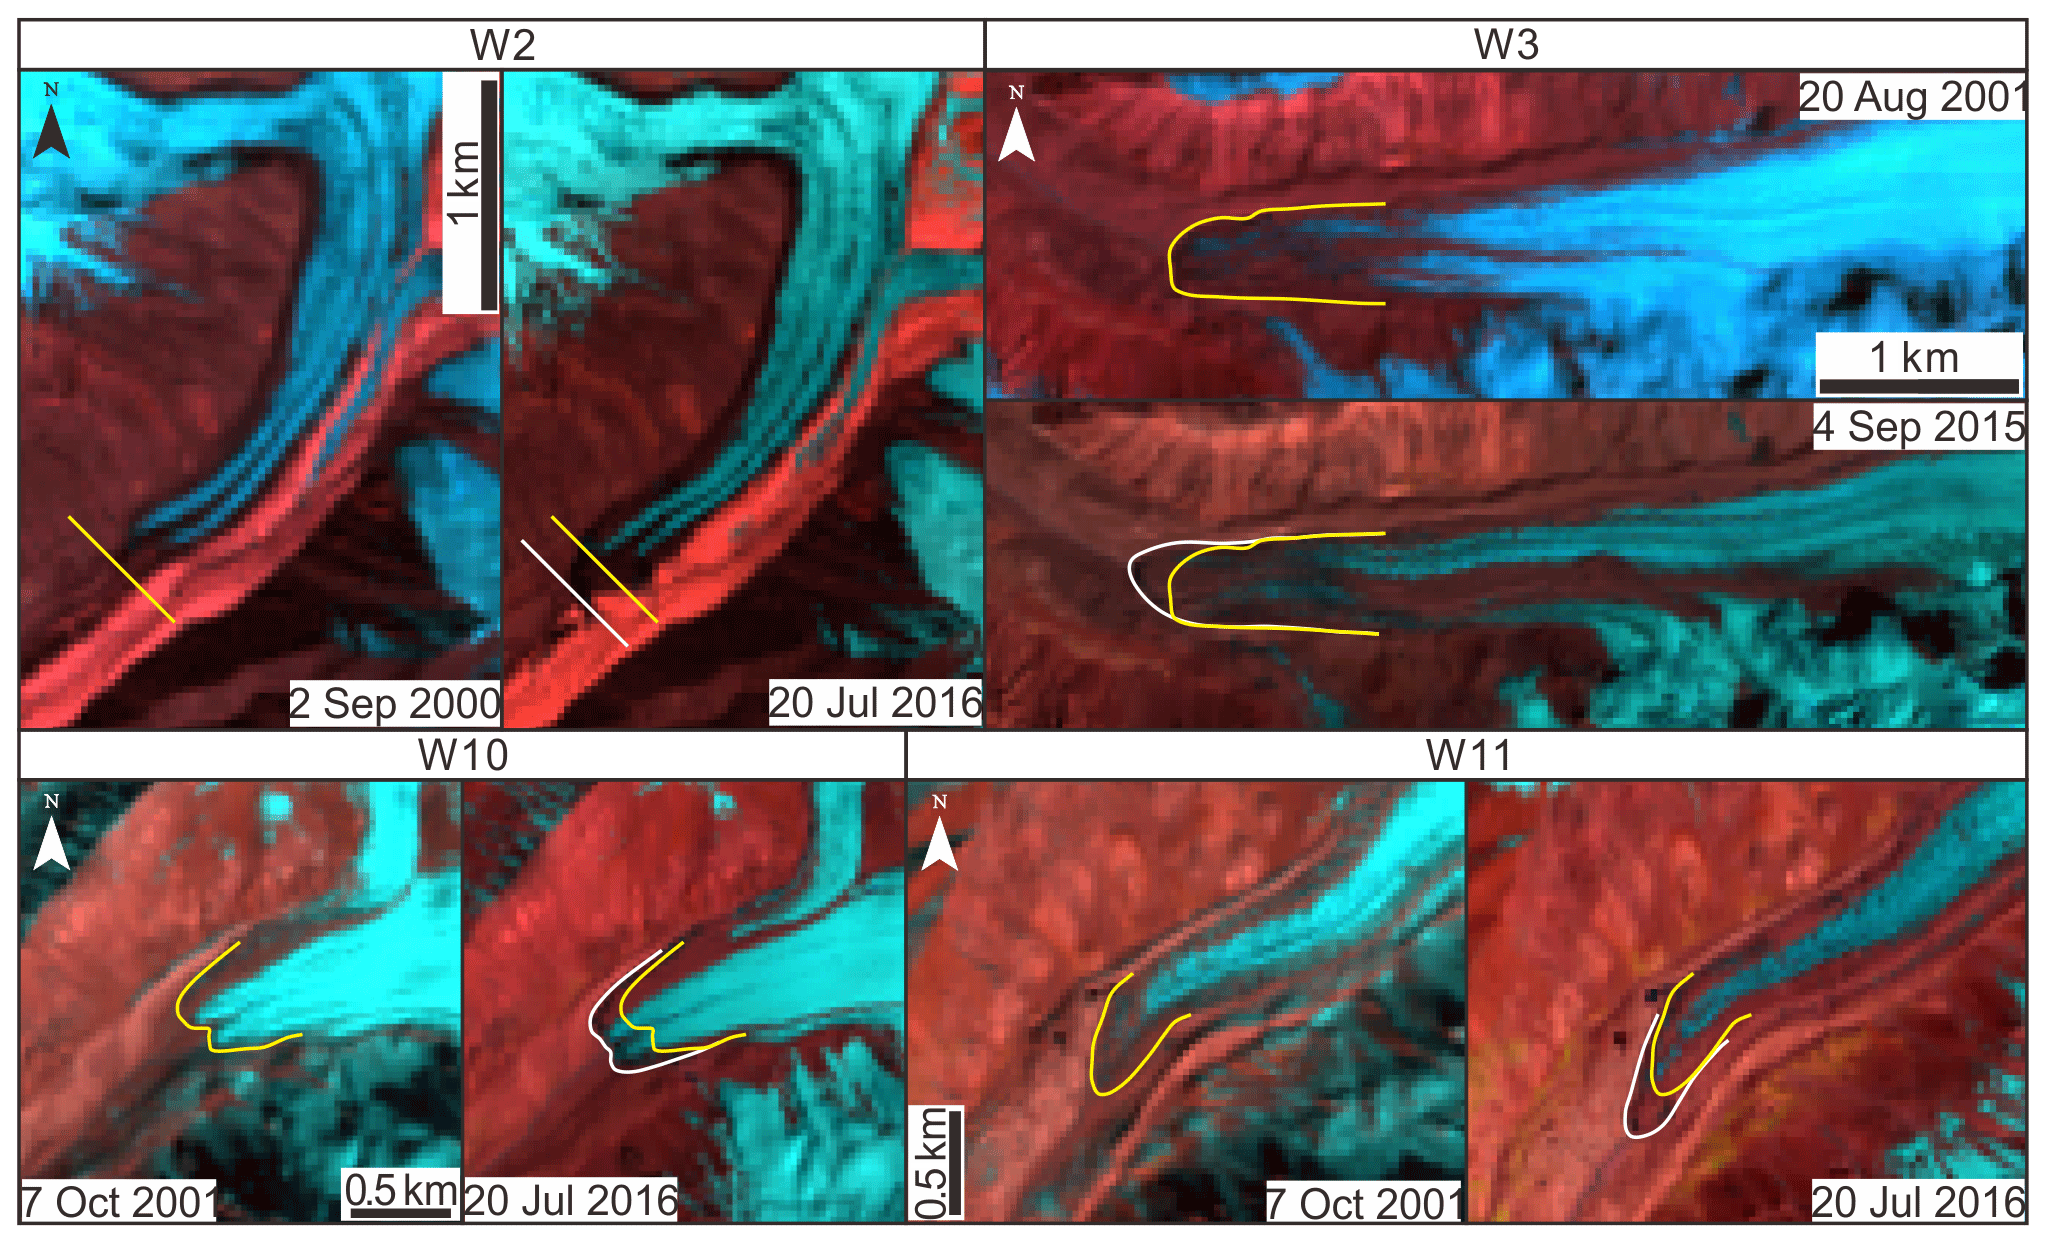
Figure 4Comparison of the advancing glaciers before and after an advance. The yellow lines show the positions of glacier termini in early images and the white lines show the positions of the termini in recent images.
The velocity profiles of these advancing glaciers show different motion patterns along their centre lines, but all with an obvious acceleration during 2013–2016 compared to 1999–2002. For W2, W3, and W10 (Fig. 5a–c), the values are ∼10 m yr−1 higher in the upper parts, increasing to ∼30 m yr−1 higher near the termini. For W11 (Fig. 5d), although the profiles in the upper parts (km3–km6) did not show a clear change, the profiles in the lower parts (km0–km3) increased by ∼30–50 m yr−1.
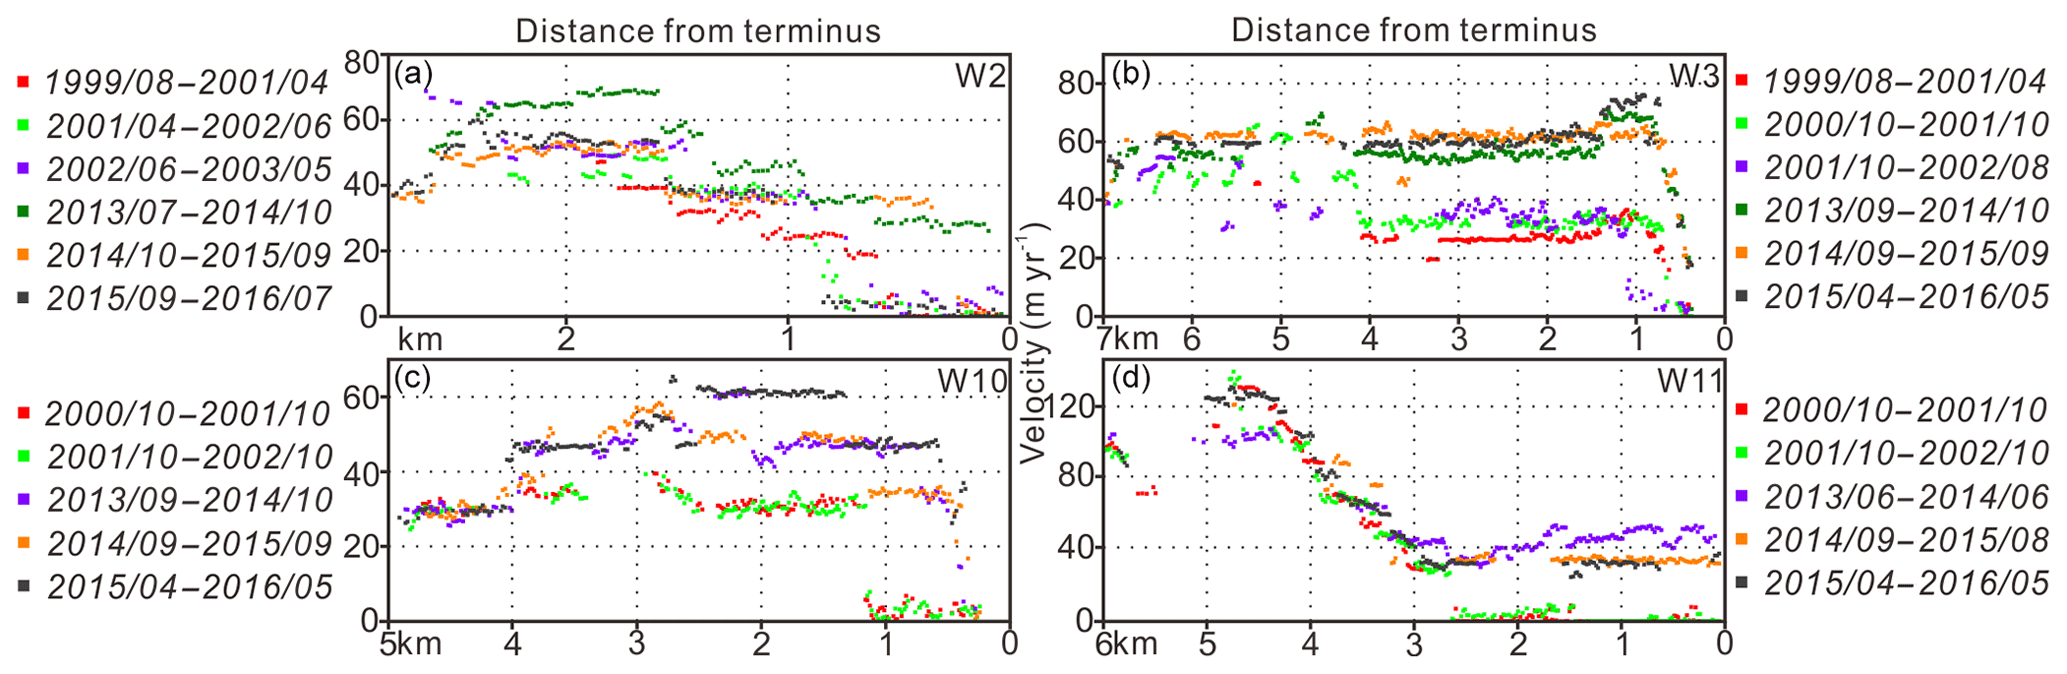
Figure 5Centre line annual-velocity profiles for advancing glaciers: (a) W2, (b) W3, (c) W10, and (d) W11.
4.2 Non-surge glaciers: stable glaciers
A total of 11 glaciers in our study area are classified as being stable over the study period, having shown no detectable change in terminus position or surface features beyond error limits. Most of these glaciers are located on the northeastern side of KM and are covered by heavy debris ranging from 11.8 % to 52.1 %. Only the area and distribution of glacial ponds on some stable glaciers has changed between 1999 and 2016 (Fig. S3). Velocity profiles of some glaciers (W1, E2, E3, E4) are absent in Fig. 6 because they exhibited no detectable motion and/or decorrelation among available image pairs.
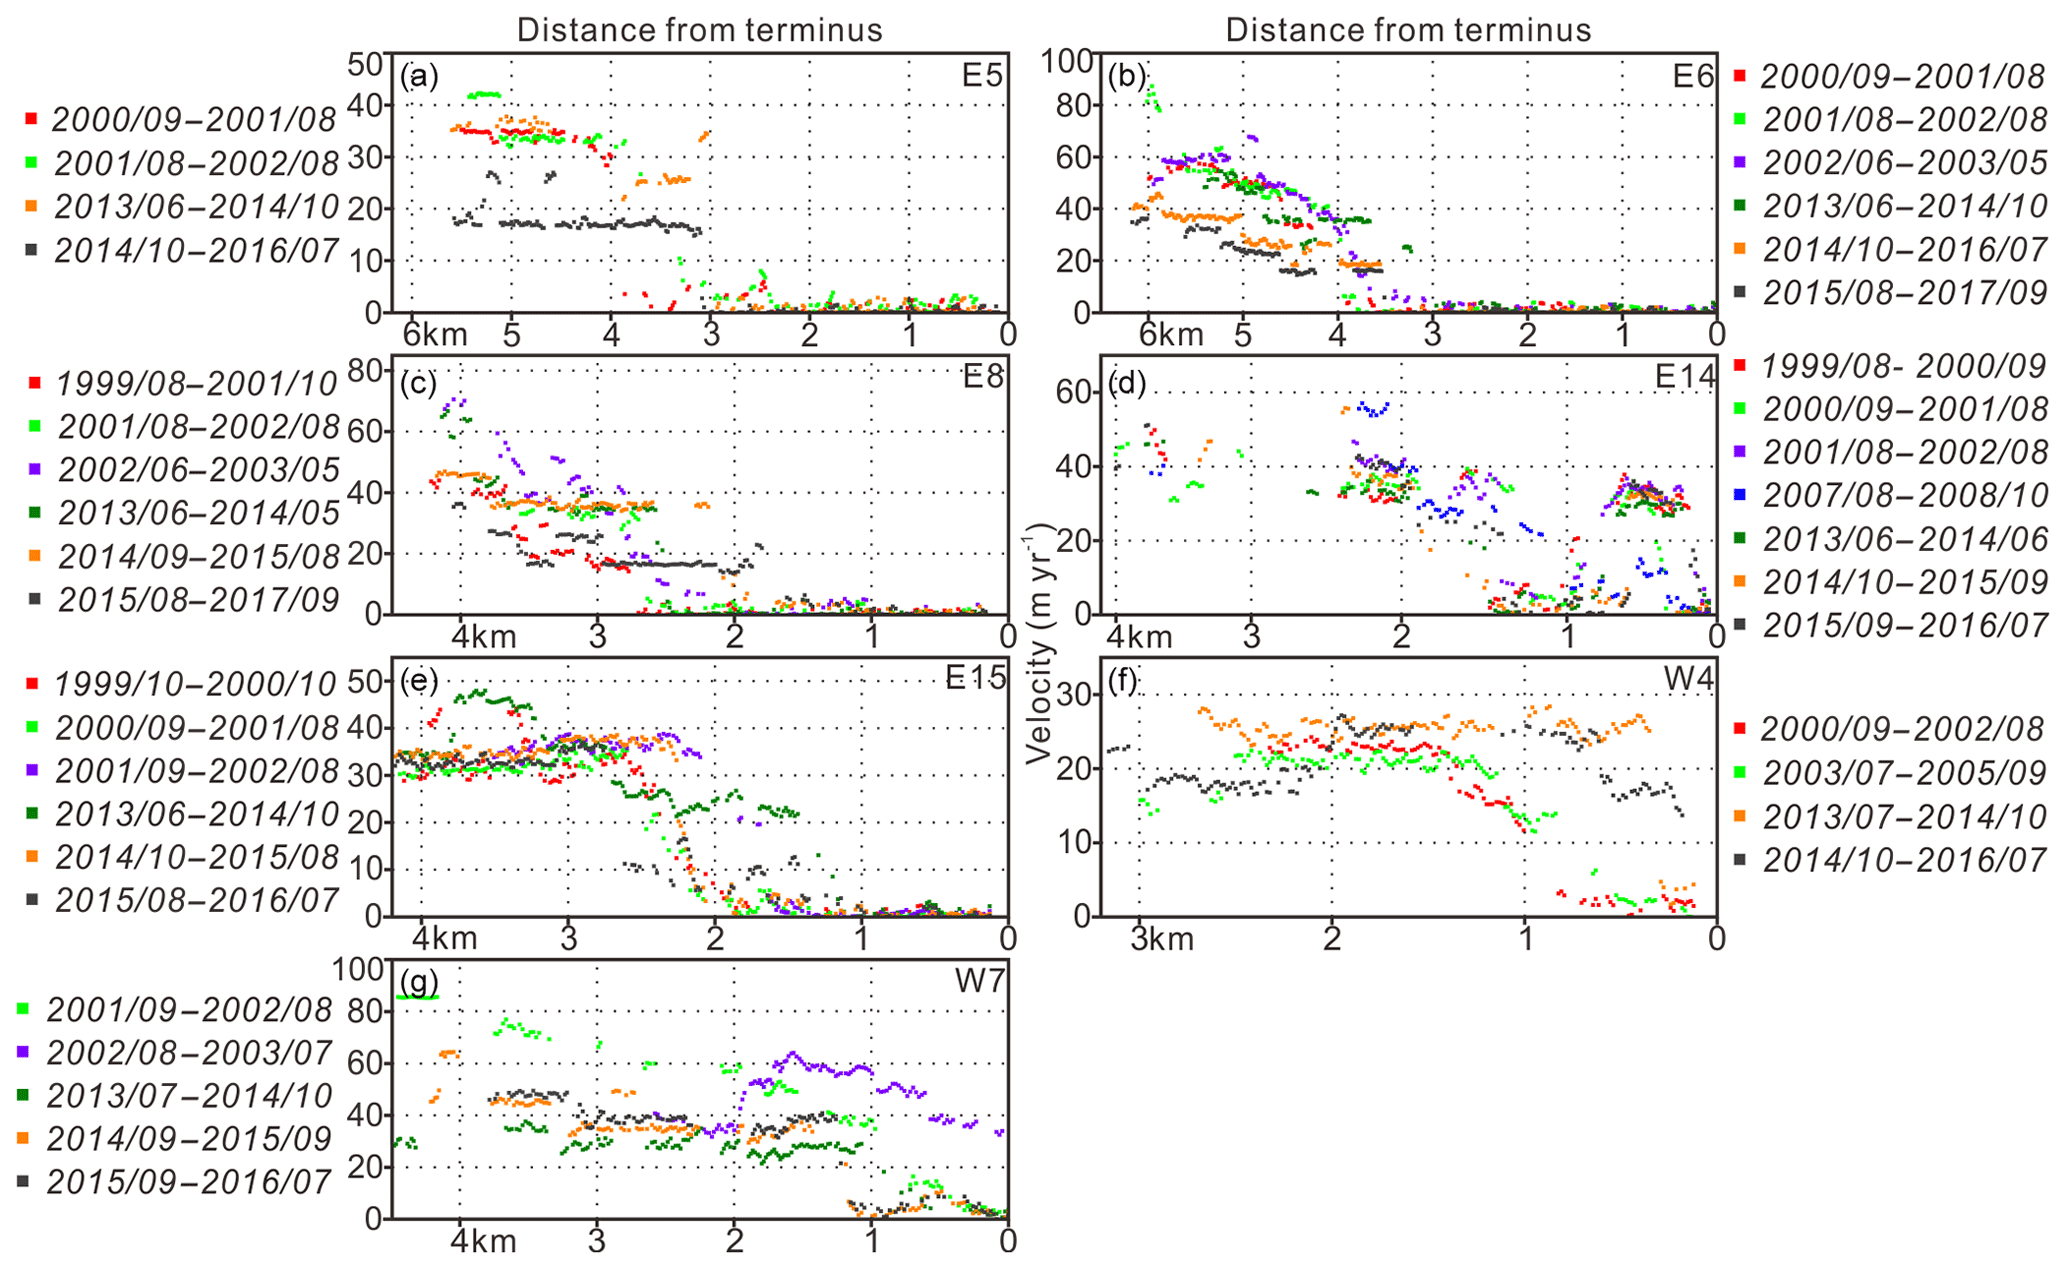
Figure 6Centre line annual-velocity profiles for stable glaciers: (a) E5, (b) E6, (c) E8, (d) E14, (e) E15, (f) W4, and (g) W7. Note that profiles of W7 start from the clean ice boundary rather than the glacier terminus.
Stable glaciers in our study area show a range of glacial motion patterns. For E5, E6, and W7 (Fig. 6a, b, g), the velocity profiles in 2013–2016, compared to those in 1999–2003, show a decelerating trend (decrease of 20–40 m yr−1). For E8, E14, and E15 (Fig. 6c, d, e), the velocities in 2013–2016 remain unchanged when compared to 1999–2003. W4 is the slowest glacier among the stable glaciers with a peak velocity of less than 30 m yr−1 (Fig. 6f), although its velocity at km0–km1 increased by ∼20 m yr−1 in 2013–2016. Even though the glacier termini and surface features remained stable, their motion change is diverse.
4.3 Surge-type glaciers
We identified 13 surge-type glaciers and 14 discrete surge events from the studied glaciers (Table 2). These surge events generally have two styles of behaviour based on whether the surge impacts the terminus position or not.
Five glacier surges have resulted in a terminus advance (E10, W8, W9, W12, and W13) that happened only once between 1999 and 2016. According to the glacier termini evolution in Fig. 3 and satellite images in Figs. 7 and S1, glaciers E10, W9, and W12 advanced more than 500 m, with the surge duration varying from nearly 1 year (W9) to several years (W12). For W12, there was clear lowering around the terminus and changes in surface crevasse patterns between 2007 and 2011 (Fig. S2). The south branch of W13 advanced ∼450 m to the north and compressed the trunk glacier by ∼150 m (Fig. 7). Subsequently, the trunk glacier advanced ∼100 m every year since 2008 (Fig. 3). The surge of W8 was in its recession stage in 1999, having begun in 1993 (Fig. S1), and no further changes were detected from 2007 to 2012 (Fig. S2).
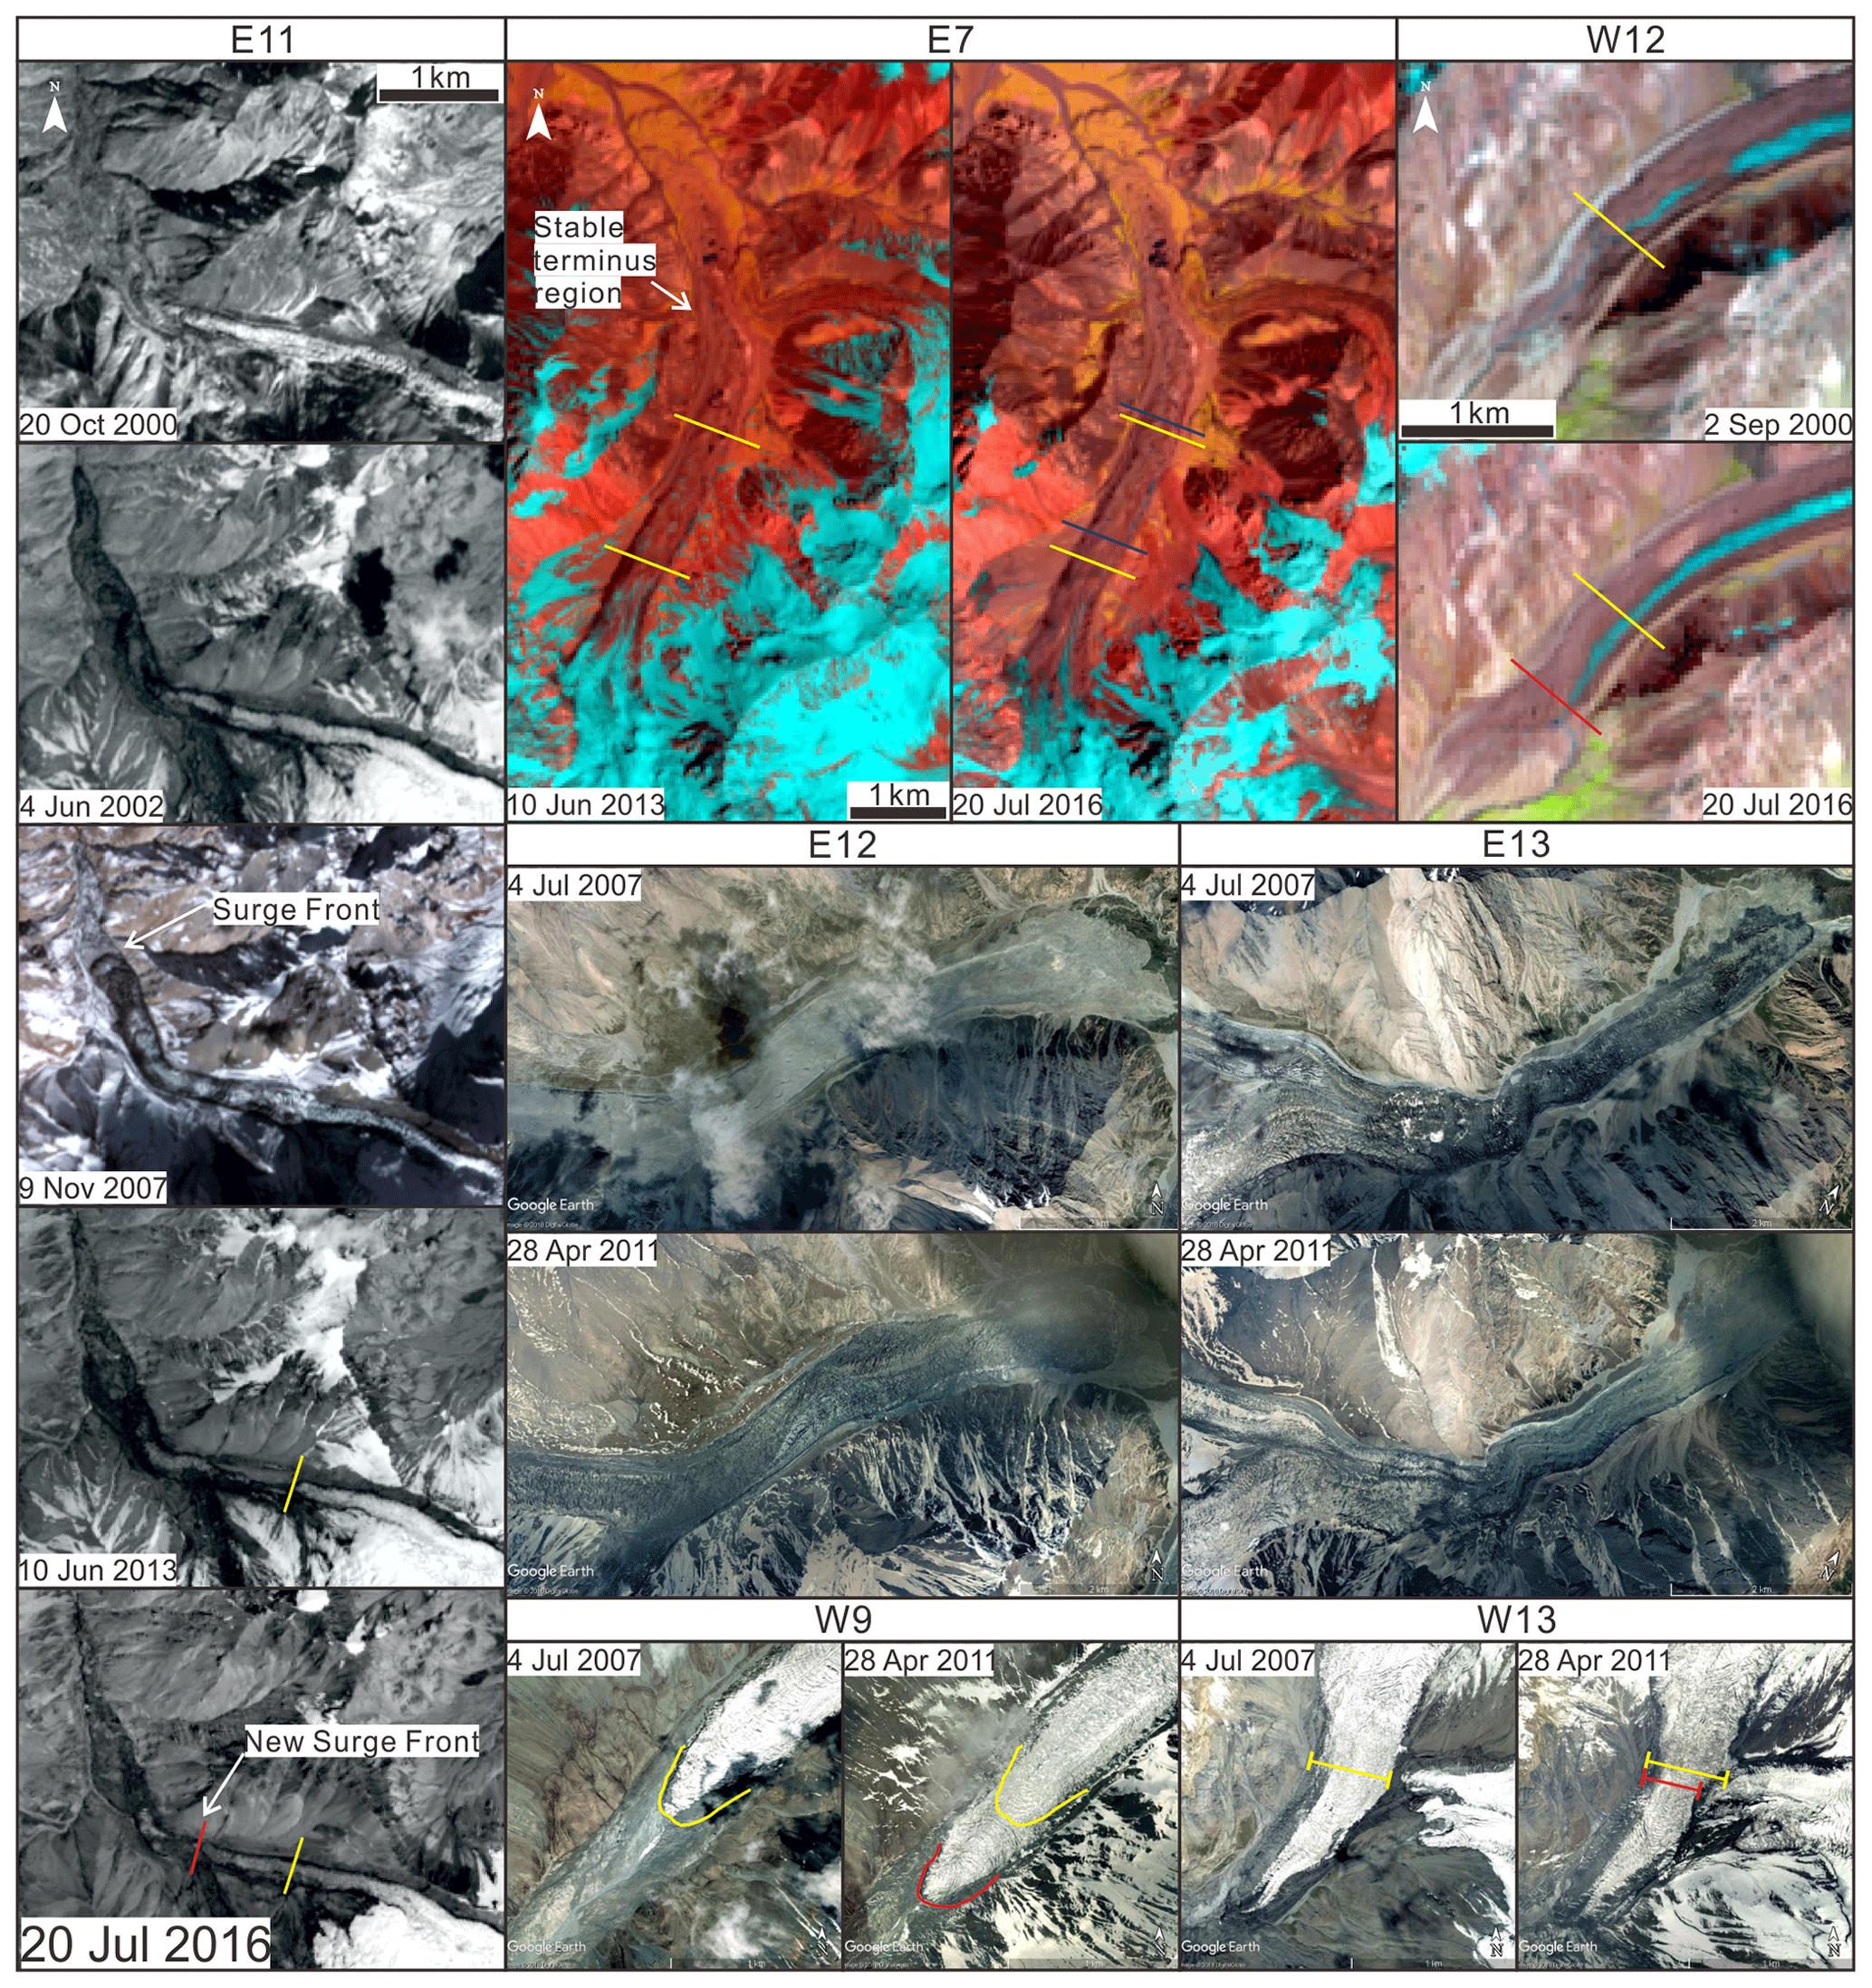
Figure 7Comparison of the surge-type glaciers before and after surge events. The yellow lines show the positions of visible surface features in the earlier images and the red lines (blue lines for E7) show the positions of the same surface features in recent images. Note that the south branch of W13 surged into the trunk branch and narrowed the trunk branch to nearly two-thirds of its original width. E11 panels show the panchromatic band of Landsat, except for the middle panel, which shows ASTER true colour combination in 2007.
There are seven glaciers that surged without affecting their termini (E1, E7, E9, E11, E12, E13, and W6). These glaciers showed obvious and dramatic changes in surface features within relatively short time periods (several months) from 1999 to 2016 (Table 2). These glaciers are all heavily debris covered and most develop what appear to be composite masses of rock and ice at their termini. In most cases the surges destroy the original surface structures and reshape the glaciers and debris during the surges. The satellite images of E11, E12, and E13 clearly show that new surge fronts propagated down-glacier, breaking down original surface features and transporting mixtures of ice and debris. These mixtures created new alluvial fans, ice crevasses, and looped moraines, which in addition changed the original glacial outflow (Figs. 7, S1, S2). For E1 and E7, the surges did not entirely destroy the original surface features and the general appearance remained after the surge events. However, new crevasses in the terminus region of E1 can be detected on Google Earth images (Fig. S1). Although these surges did not result in terminus advances, they modified the inner surface structures of glaciers, bringing about the rapid expansion of original supraglacial lakes and the growth of new debris-dammed supraglacial ponds (cf. E7 and E13 in Fig. 7).
Centre line profiles of annual velocities provide quantitative information about the glacial motion before, during, and after the surges. For E1, E7, and E12 we could only extract the profiles during the active phases, showing a clear surge front in each case (Fig. 8). Due to the limitation of available satellite images, it is not possible to provide complete velocity profiles throughout the other glacier surge events. Instead, we present the comparison before and after the surges to identify the impact of surges on glacial motion. Profiles of E1 reveal two surge events: the first peaked between 1999 and 2000, and the second peaked between 2013 and 2014. The interval of the surge events is ∼14 years, which can be taken as an indication of the surge cycle period of E1. Two different surge fronts were also detected on the surface of E11 with a 14-year surge cycle from 1999 to 2013 (Fig. 7). Since the width of E11 (most parts) is less than 300 m it is difficult to detect the displacement fields directly from satellite images with low spatial resolution. The two surges of E1 are not identical in their nature. According to Fig. 8a and b, the surge in 1999 affected a larger area (km2–km7) with higher peak velocity (∼100 m yr−1) than the surge in 2013 (affected area: km1–km5, peak velocity: ∼70 m yr−1). E7 (Fig. 8c) has a much higher peak velocity, nearly 10 times greater during active surge phases (∼150 m yr−1) than in its quiescent phase (∼15 m yr−1). The profiles of E12 show a moving surge front propagating downstream, although our observations are limited to the initiation and decay of the surge (Fig. 8f). In the cases of E1, E7, and E11, the surge lasted for 3 to 4 years. For E12, the surge front is still detectable near its terminus, lasting 9 years after initiation (Table 2).
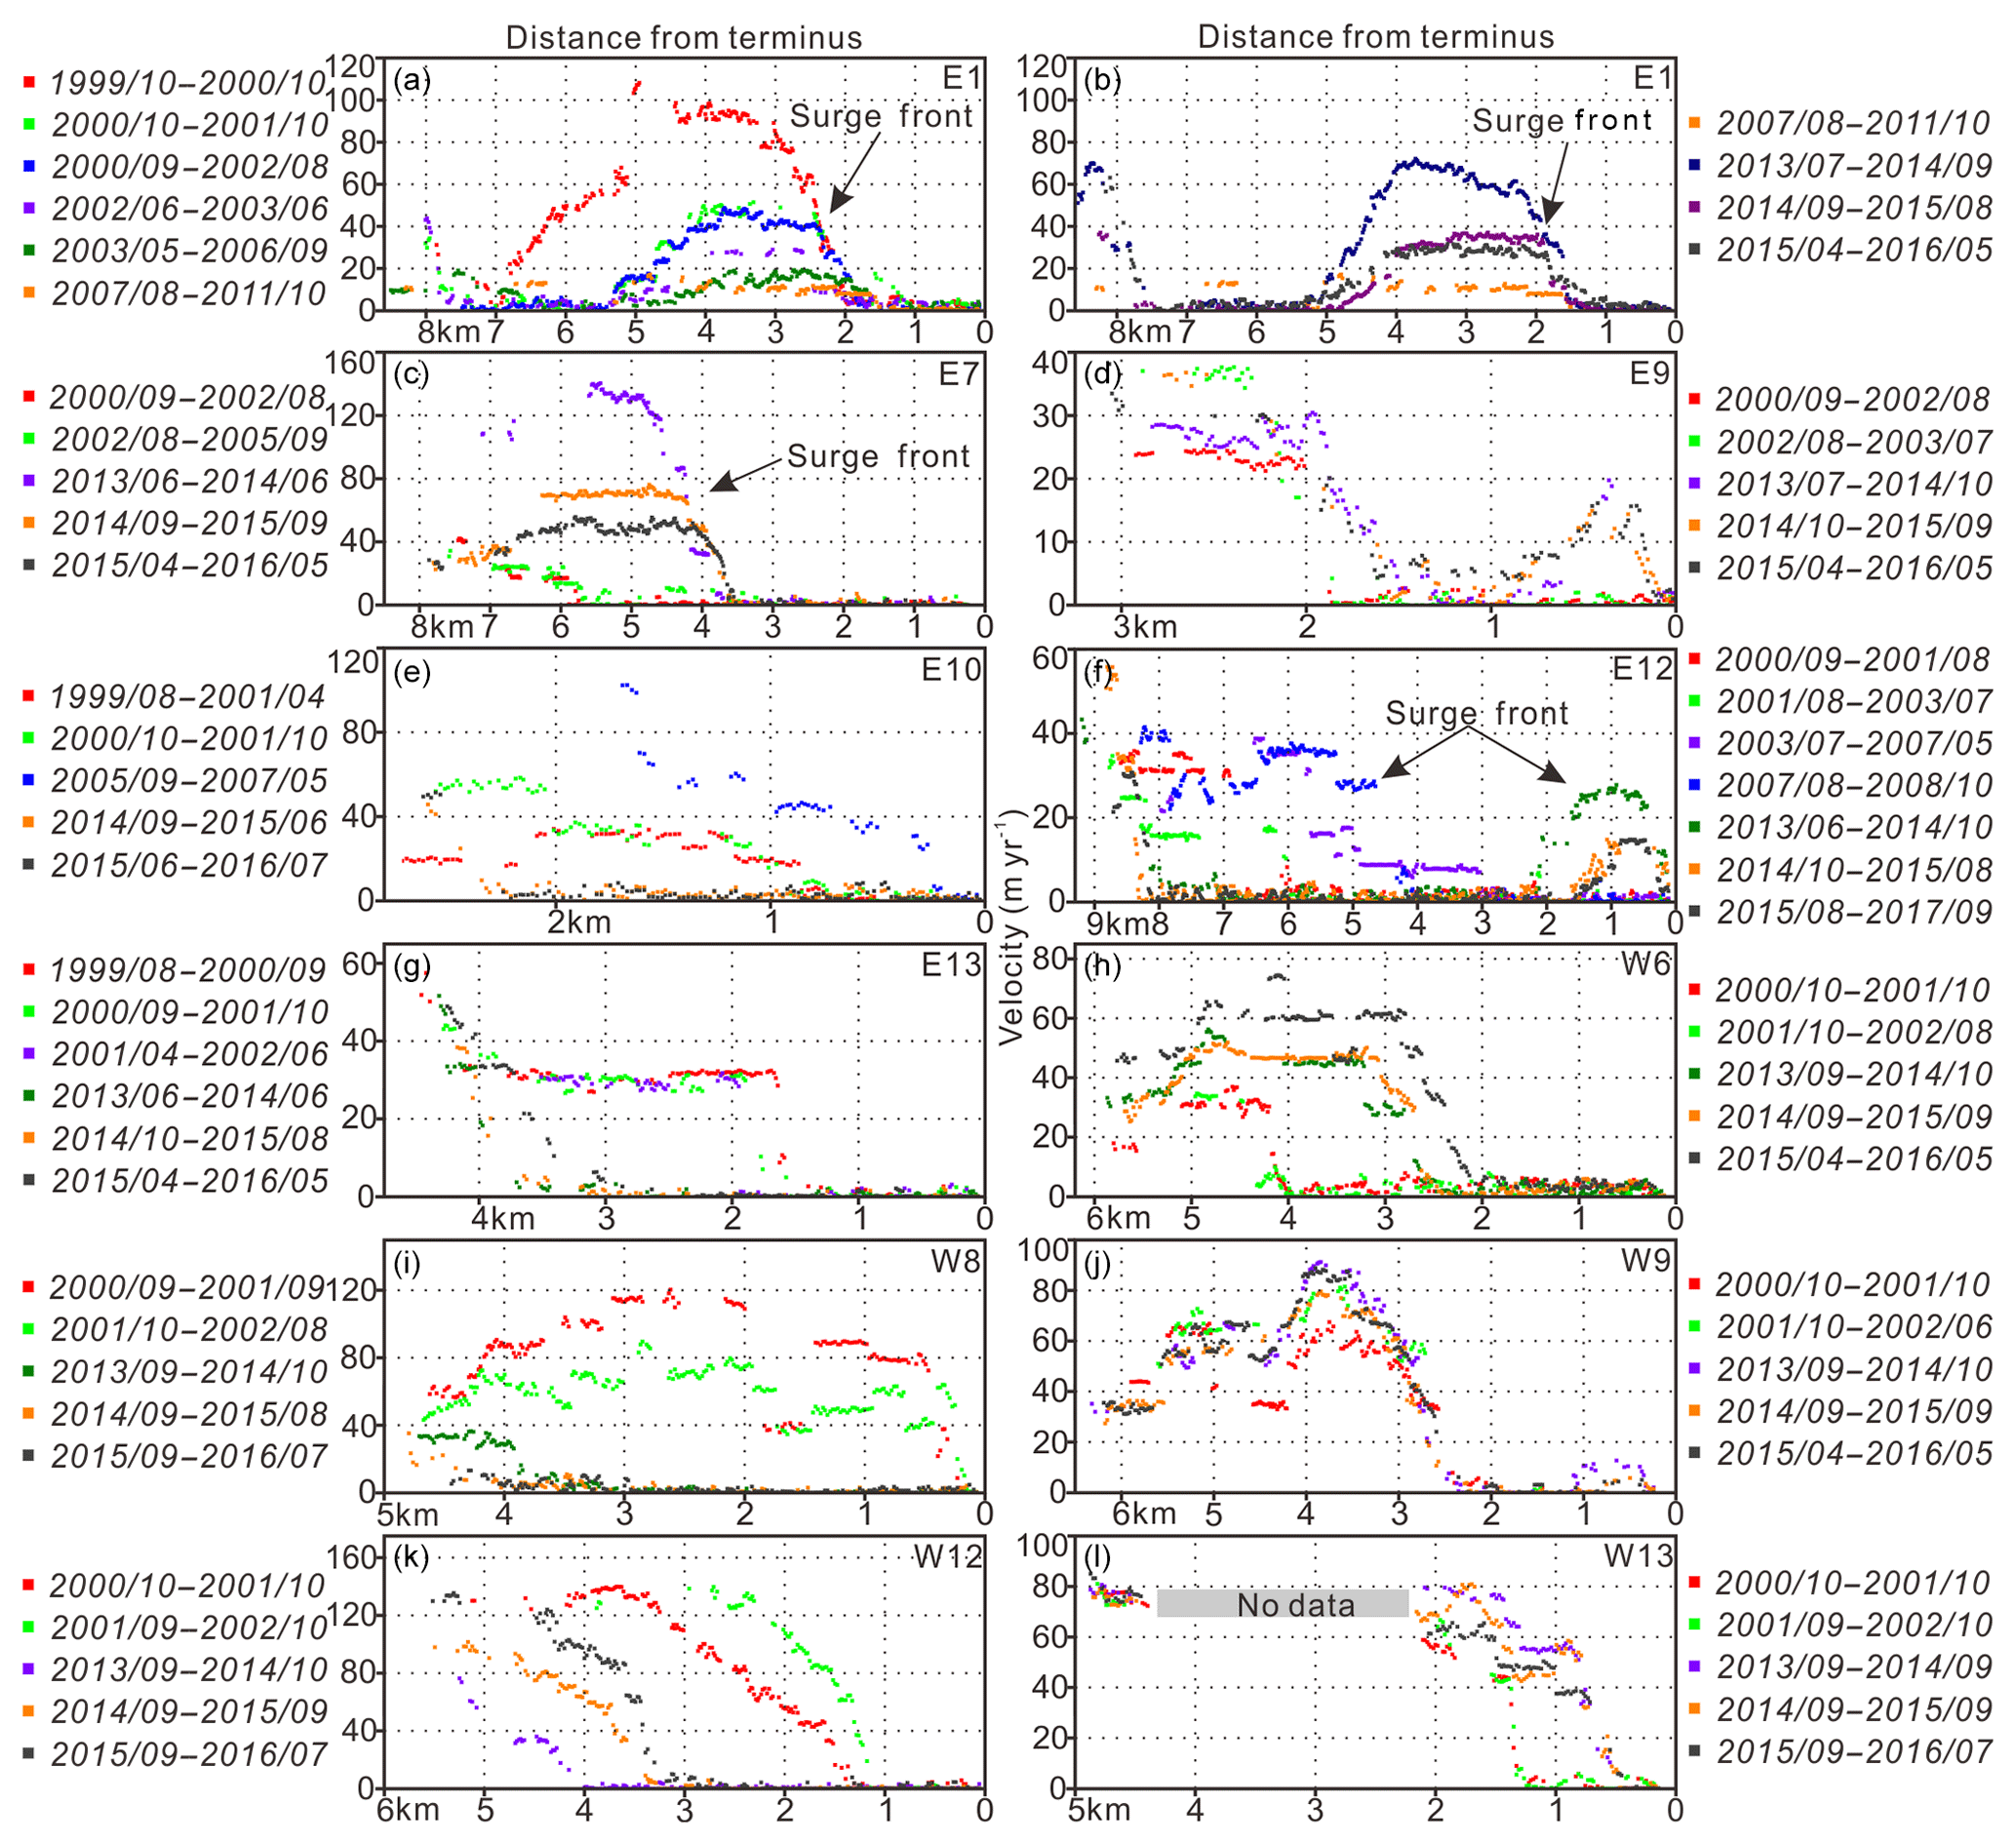
Figure 8Centre line annual-velocity profiles for surge-type glaciers: (a) E1 (1999–2011), (b) E1 (2007–2016), (c) E7, (d) E9, (e) E10, (f) E12, (g) E13, (h) W6, (i) W8, (j) W9, (k) W12, and (l) W13.
Changes in the surface features of E9 and W9 are also indicative of surge behaviour in 2007. The surface velocity of E9 (2013 to 2016) appeared to be the same as prior to the surge in 1999–2003, except in the lower reaches, where the glacier showed faster flow in the earlier image pairs (Fig. 8d). The velocity profiles of W9 (Fig. 8j) in 2013–2016 show a trend similar to those in 1999–2002, except for a higher peak velocity zone at 3–4 km from the terminus (∼90 m yr−1) shown in 2013–2016. We suggest that until 2013, E9 and W9 had recovered from the surges in 2007 judging from the similar motion patterns in 1999–2003 and 2013–2016. Profiles of E10, E13, W8, and W12 vary markedly in both amplitude and shape. Most parts of these glaciers flowed much slower between 2013 and 2016 than they did between 1999 and 2003. W12 increased in velocity year to year in 2013–2016, indicating it is currently recovering from the last surge event (Fig. 8k). E10, E13, and W8 may follow this pattern in the near future as well. For W13 (Fig. 8l), the south branch surged into the trunk glacier at km2 from the terminus in 2008. The trunk glacier was compressed by the south branch after the surge, which resulted in a motion change of the trunk glacier, characterized by acceleration in the lower parts (km0–km2).
Velocities of W6, which surged before 1989 (Fig. S1), were 20–60 m yr−1 higher in 2013–2016 than those in 1999–2002 and the profiles show a clear downstream-propagating trend (Fig. 8h). The retreat in the ablation zone in recent years and the fast-moving mass in the accumulation zone indicate that W6 is preparing for the next surge and its surge cycle period is more than 27 years (1989–2016).
W5 has two branches converging into the trunk glacier from both the north and south slopes of the valley. Its terminus position moved ∼300 m up-valley between 2000 and 2016, reducing its area by 0.31 km2. The proglacial stream is clearly seen in the images acquired in July 2016 in an area previously occupied by glacier ice (Fig. 9). The distorted moraines in the lower terminus region in 2000 give a hint of a previous surge event but there are no obvious signs in the historic imagery other than a gradual advance of ∼160 m between 1972 and 1977. The centre line velocity of W5 fluctuated between 20 and 40 m yr−1 prior to 2007, whereas from 2013 to 2016 the glacier was flowing consistently at 40 m yr−1. The velocity of the main glacier tongue showed an accelerating trend in the 2010s, despite the terminus position receding as described. Based on this, we suggest that W5 is a surge-type glacier in its quiescent phase during our study period.
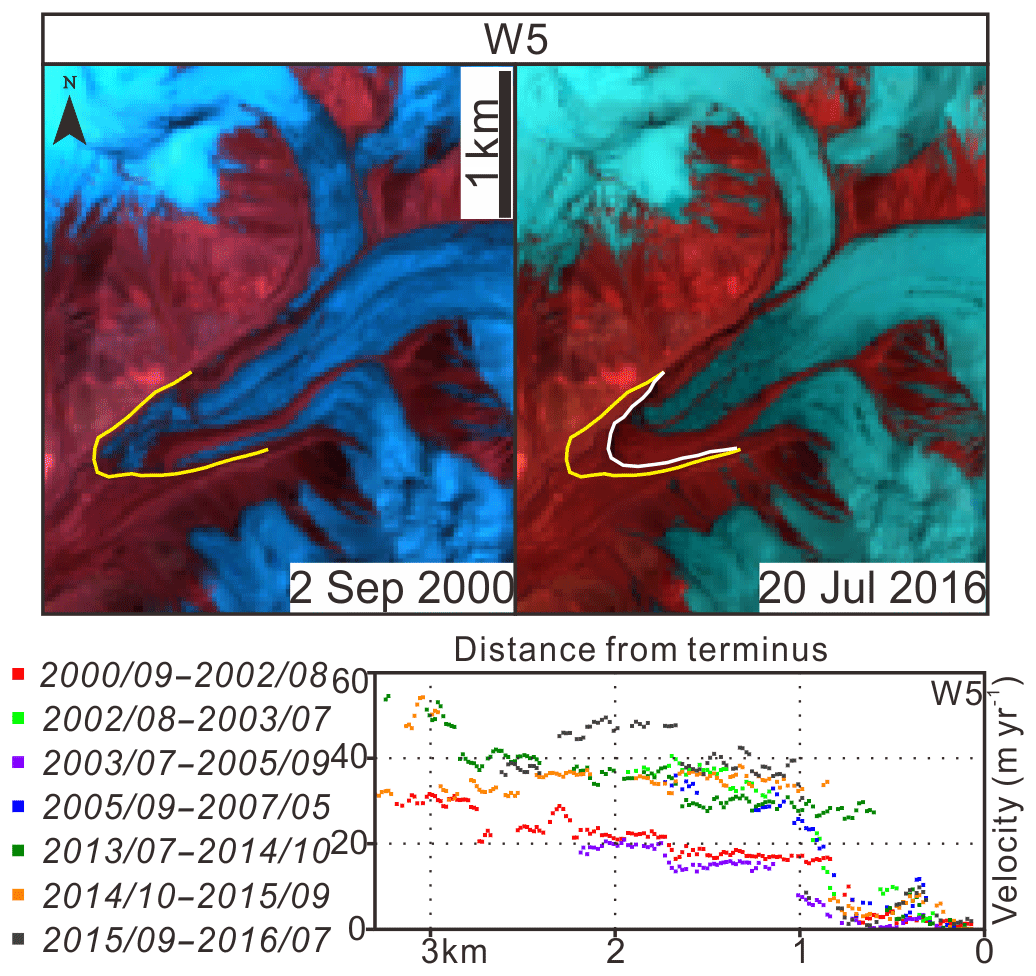
Figure 9Comparison of W5 between 2000 and 2016 and its centre line annual-velocity profiles. The yellow line indicates its terminus position in 2000 and the white line indicates its terminus position in 2016.
5.1 Motion pattern of surge-type glaciers
The existence of at least 13 surge-type glaciers out of 28 in the KM provides strong evidence that the Pamir region is one of the world's most active surge zones, as indicated by the geodatabase of surge-type glaciers (Sevestre and Benn, 2015). None of the glaciers detailed here have been identified as surge-type glaciers in previous publications. By analysing the velocity profiles of these glaciers in the study area, we define 13 glaciers (E1, E7, E9, E10, E11, E12, E13, W5, W6, W8, W9, W12, and W13) as surge-type glaciers. A total of 14 surge events were identified, with E1 and E11 surging twice each until 2016. Despite these glaciers being of different sizes and shapes, we find that they tend to show broadly similar motion patterns during their active and quiescent phases (Fig. 10). Prior to the onset of the surge, the glacier occupies a relatively stable stage (Profile a). In the active phase (Profile b to Profile d), the glaciers in our study area show peak velocities in the first year (E1 and E7) when surges occur, followed by gradually decreasing velocities in the following few years as the surge front propagates downstream. After the active phase, the glacier surface velocities drop to their minimum level (Profile e to Profile g). In many cases, the glacier tongue will then remain largely stagnant flowing 0–10 m yr−1 in most parts for several years as ice is recharged in the accumulation zone (see Fig. 8e, g, i). After an uncertain period (varying from 11 to 14 years) of accumulation, the glacier again begins to transport ice downstream in a gradually recovered velocity event initiated from the accumulation zone to the ablation zone until it reaches its stable stage before the next surge (see Fig. 8d, j). We interpret the relatively motionless (Profile e to Profile g) and stable (Profile a) stages to define the glacial quiescent phase. We note that the exact periods corresponding to the active and quiescent phases differ with glacier geometry and amount of debris cover.
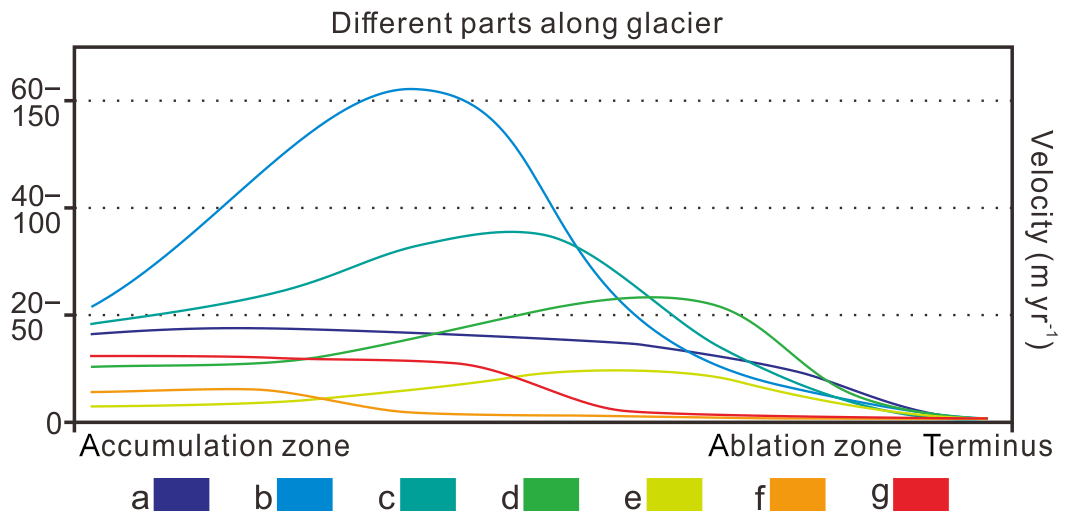
Figure 10Conceptual characterization of the glacial motion pattern of surge-type glaciers in the Kingata Mountains. Profile a to Profile g indicate different stages during the active and quiescent phases of a surge-type glacier.
Previous studies have reported travelling waves during glacier surges, such as observations of Gasherbrum Glacier (Mayer et al., 2011) and Kunyang Glacier (Quincey et al., 2011). They are interpreted to be a result of both hydrological and thermal changes (Kamb et al., 1985; Fowler et al., 2001; Hewitt, 2007). Hydrologically controlled surges are suggested to accelerate during winter conditions when the down-glacier basal hydrology is inefficient and decelerate during summer conditions when the water pressure is reduced by melting-water channelization (Raymond, 1987). The hydrologically controlled surge front represents the boundary between an efficient tunnel drainage system in the up-glacier direction and an inefficient cavitized system in the down-glacier direction. Thermally controlled surges rely on a change in conditions at the bed and the surge fronts in this case represent the transition between warm ice (up-glacier) and cold ice (down-glacier) (Clarke, 1976). Another explanation of the fronts of surges in the Karakoram can relate to the individual glacier configurations (see Quincey et al., 2015). In these cases, immobile cold ice or a remnant of a previous glacier surge may exist as an obstacle to fast-moving ice from up-glacier.
Although many other surge events likely remain undiscovered, we identified seven glaciers (that surged nine times) in the KM (E1, E7, E9, E11, E12, E13, and W6) that occurred without affecting their termini. Due to their heavy debris cover and long glacier tongues these events were inhibited to reach the terminus by immobile and likely cold ice, and consequently these glacier termini remained stable during and after the surge events. The surges of E1 and E7 showed new crevasses with yearly detectable surface feature advances and the other five surges (E9, E11, E12, E13, and W6) caused the rearrangement of surface features in the middle parts of the glacier tongue and overrode the remnant left by a possible previous glacier surge, similar to the surges of Braldu and Unnamed1 glaciers in the Karakoram (Quincey et al., 2015). This type of glacier surge is common in the eastern Pamir Mountains (Lv et al., 2016; Shangguan et al., 2016), although their evolutions differ both spatially and temporally. We suggest these flow instabilities can be attributed to the geomorphological characteristics of different glaciers, such as the slope of the glacier, the size of the accumulation area, the width of the outlet, and their configurations in relation to neighbouring glaciers.
Even though the poor temporal resolution of our data cannot provide any seasonal signal of the surge evolution, it is clear that most of the surges reached their peak velocities in the first year of initiation and their termination phase lasted for years, contrasting with the hydrologically controlled surges in Alaska where the termination phase has been shown as much more abrupt than the initiation phase, lasting as little as several days (Burgess et al., 2013).
We attribute the relatively shorter surge cycle period of E1 and E11 compared to other glaciers to their large accumulation areas and abundant ice supply. E1 has one trunk glacier and three tributaries and E11 has a narrow outlet, which make them much quicker to accumulate and transport newly formed ice downstream. Conversely, W6, which appears to have a cycle period of more than 27 years, has a winding and broad outlet and only one reservoir in its accumulation area. The surface velocity (70 m yr−1) of W6 in recent years indicates that it is approaching its next surge. Our data indicate that return periods vary widely from glacier to glacier but in general the larger the accumulation area and the narrower the outlet, the shorter the return period of the glacier. The return period of glacier surges in Kingata appears to range between 1 decade and several decades, which is coincident with Karakoram glacier surges, reported to be of the order of several decades (Copland et al., 2011; Quincey and Luckman, 2014; Quincey et al., 2015). This is quite different from other thermally controlled surges elsewhere with a return cycle of up to several centuries (Dowdeswell et al., 1991).
The duration of Kingata glacier surges is usually less than ∼10 years, and more commonly 3–4 years, similar to those in the Karakoram. The extremely short-lived surges, and the large-scale velocity variations of W9 and E10 (1–2 years), are similar to surge events reported on Shakesiga Glacier in the Karakoram (Quincey et al., 2015) and Kelayayilake Glacier on Mont Tobe Feng (Lv et al., 2016). The surge of Kelayayilake Glacier, located to the south of KM, was initiated in the winter months and terminated in the summer months of 2015. The significantly reduced water discharge before and during the surge reported by Gez hydrological station suggests that this type of glacier surge is partially dominated by a hydrological control. Unfortunately, there are no hydrological data for the KM to help resolve the dominant processes operating here in a similar way.
Glacier surges in the eastern Pamir Mountains share many, although not all, common features with Karakoram glacier surges and they both do not completely resemble either thermal or hydrologically controlled surges reported in Svalbard and Alaska. We suggest that surges in the eastern Pamir Mountains, as with surges in Karakoram, have variable controlling processes depending on the thermal and hydrological conditions, and the geomorphological characteristics of different individuals.
Although such surge-type glaciers represent a small percentage of the world's glacier population, they are of great importance in the investigation of glacier processes, flow instabilities, and fast glacier flow (Clarke, 1987). Before and after the surges, the interannual velocity profiles of surge-type glaciers show significant variations in their shape and amplitude, which reflect the internal structure change. Their rapid acceleration and deceleration gives us a different insight into the acknowledged stable glacial situation in the Pamir region in the context of glacial shrinkage in HMA; in addition, more surge events likely remain undiscovered because of insufficient availability of high-spatial-resolution satellite data and decorrelation between image pairs that precludes the derivation of velocity data by feature tracking.
5.2 Glacial motion pattern change
Glaciers in northwestern China are of continental type, formed under dry and cold climate conditions. These glaciers were previously regarded as stable, low-ablation glaciers with short glacier tongues and low motion rates. In particular, glaciers in the Pamir region experienced the least glacial retreat in HMA over recent decades (Yao et al., 2012). In our study, with the exception of surge-type glaciers, advancing and stable glaciers both showed diverse motion pattern changes during the study period.
The patterns we describe in this study show some similarity with glacial motion patterns in the Bhutan Himalayas; Kääb (2005) ascertained that large differences in dynamics were present between fast-moving north-facing glaciers and slow-moving south-facing glaciers and concluded that different erosion and sediment evacuation processes should act on the two sides of the Bhutan Himalayan main ridge. There, glaciers on the northern slope are debris free and glaciers on the south slope have heavy debris cover with thermokarst features. In the KM, glaciers on the northeastern slopes flowing into the Tarim Basin range in peak velocity from 30 to 60 m yr−1, whereas fast-moving glaciers on the southwestern slopes flowing into the Pamir plateau range from 40 to 120 m yr−1. The topography and surface features are very different either side of the divide, which we suggest might lead to the motion variation we have detected here.
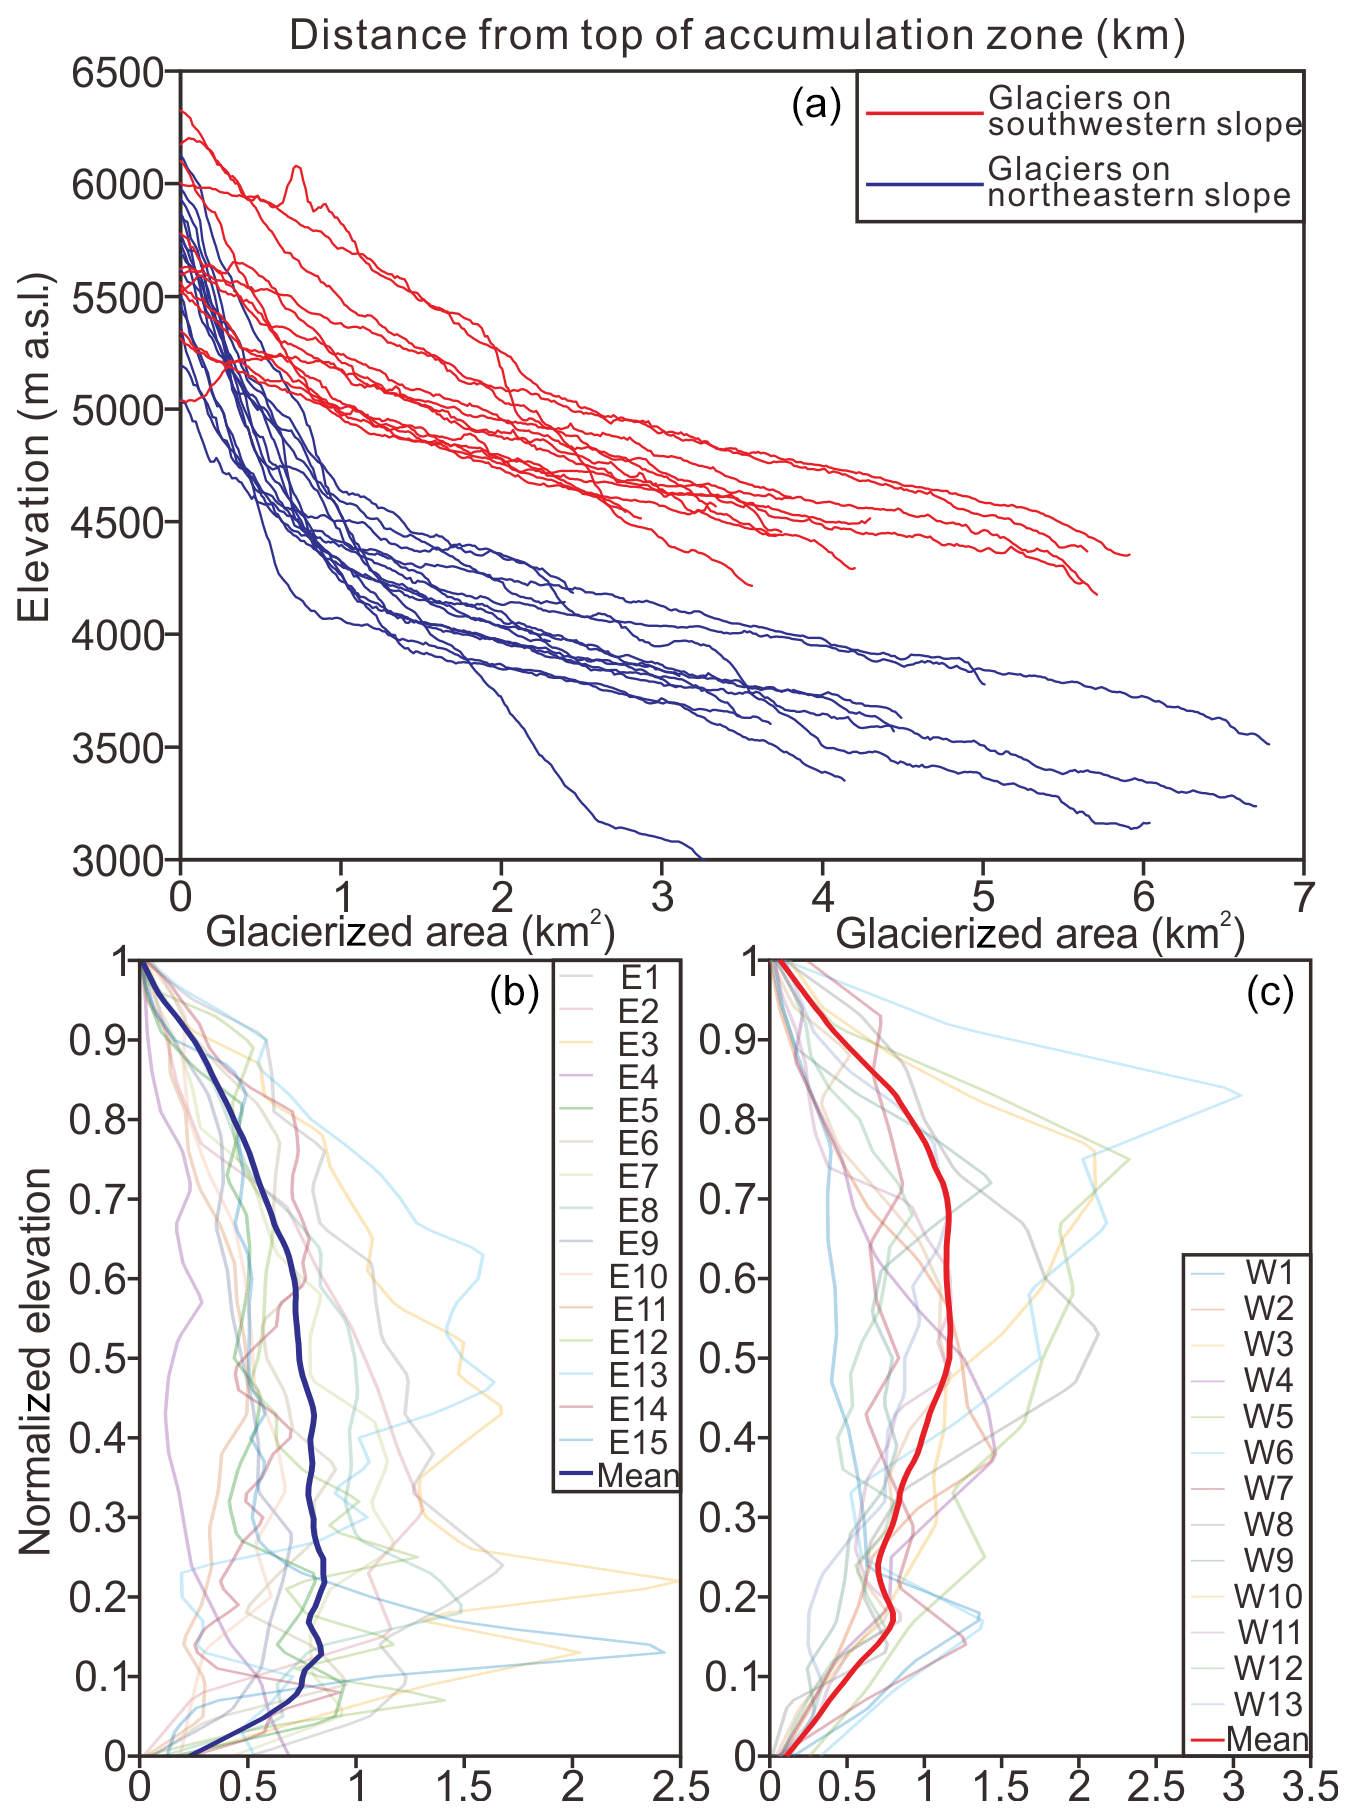
Figure 11(a) Surface elevation profiles of studied glaciers extracted from ASTER GDEM, (b) hypsometry curves of northeastern glaciers, and (c) hypsometry curves of southwestern glaciers.
Elevation profiles (Fig. 11a) indicate that glaciers to the southwest have plateau-type accumulation areas and gentle surface slopes, which might exert a positive influence on the formation and preservation of new ice in the accumulation zones. The westerly winds deliver most of the total annual precipitation to the eastern Pamir Mountains (Su et al., 1989; Seong et al., 2009; Jiang et al., 2014). As the wind-facing slopes, glaciers on the southwest have the potential to capture most of the precipitation. Little precipitation makes its way over the divide to nourish the high-elevation areas on the northeast, even though snow may be blown further into the accumulation area by winds from the southwest. Most glaciers on the northeastern slopes have steep-ice accumulation zones, indicating that they are predominantly fed by avalanches. No reliable measurements of precipitation exist in this region with which we can verify these trends. However, the southwestern glaciers have bigger total glacierized areas than the northeastern ones judging from the mean hypsometry profiles of glaciers on both slopes (Fig. 11b, c). Meanwhile, the southwestern glaciers have most ice at high elevation, which is opposite for the northeastern ones. The broad, high-elevation accumulation zones on the southwest give a reasonable explanation for their faster-moving behaviour compared to the other slopes.
Glaciers on the northeastern-facing slopes also flow down to much lower elevations, usually about 1000 m lower than those on the southwest (Fig. 11a). Some of these glaciers flow at a much slower rate and tend to remain stable with well-developed supraglacial melt ponds (see E3), features which are also prevalent for many other long debris-covered glacier tongues in HMA, including the Everest region (Luckman et al., 2007; Scherler et al., 2008; Quincey et al., 2009; Watson et al., 2016). These glaciers in different catchments around the Everest region have experienced substantial mass loss over the last few decades as revealed by DEM differencing (King et al., 2017).
Changes in glacial motion can also be attributed to changes in precipitation and temperature over recent decades (Raper and Braithwaite, 2009). Most glaciers in the KM are relatively small compared to glaciers in nearby areas, such as the Kelayayilake Glacier (Lv et al., 2016; Shangguan et al., 2016) and Muztag Glacier (Yang et al., 2013). No in situ climate data exist for this region, making it difficult to disentangle glacier response to a change in accumulation from other factors. Moreover, there are no robust data on ablation rates or ice thickness that might be used to make estimations of glacier response times (Jóhannesson et al., 1989). Nevertheless, it may be reasonable to suggest that the acceleration or deceleration we observed is a product of climate changes over the last 2 decades given their relatively small size and insulating debris cover. This speculation underlines the need for more detailed meteorological records with robust and long-term field data if the climate impacts on glaciers in the KM and surrounding regions are to be robustly characterized.
Using cross-correlation feature tracking on Landsat and ASTER images, we have studied the temporal and spatial evolution of glacial motion in the Kingata Mountains for the first time. When combined with the record of terminus positions and surface features indicative of surging, these data demonstrate the following. (1) By analysing and quantifying glacial motion from 1999 to 2016, we can define 13 surge-type glaciers and summarize a surge-type glacial motion pattern for the characterization of different surge states. (2) The controlling process of each surge varied for different glaciers depending on their thermal and hydrological conditions and geomorphological characteristics. These surges resemble those in Karakoram and do not fit into classic thermal and hydrological classification. (3) Glaciers on southwestern slopes have relatively higher speeds than glaciers on northeastern slopes. (4) Glaciers experienced a significant and diverse change in their motion patterns, which may indicate decadal-scale changes in climate, although glaciers in the Pamir region are acknowledged to have a stable mass balance and show the least glacial retreat in high-mountain Asia. In future research, precipitation and temperature data, associated with estimates of glacier thickness and its change, will greatly aid the study of climate impacts on glaciers in the Pamir region.
The Landsat-7, Landsat-8, and ASTER images can be freely downloaded from http://glovis.usgs.gov (last access: 6 January 2018). ASTER GDEM can be found from NASA's Earth Observing System Data and Information System (EOSDIS). The Second Glacier Inventory Dataset of China is available from http://westdc.westgis.ac.cn/data/f92a4346-a33f-497d-9470-2b357ccb4246 (Guo et al., 2014). These data are publicly accessible.
The supplement related to this article is available online at: https://doi.org/10.5194/tc-13-219-2019-supplement.
ML, GL, HG, and XL designed this study. ML carried out the data processing. ML, DJQ, and SY wrote the paper. DJQ, ZR, and YD assisted in data interpretation and edited the paper.
The authors declare that they have no conflict of interest.
This research was supported by the Strategic Priority Research Program of the
Chinese Academy of Sciences (XDA19070202); the International Cooperation
Program of CAS (131211KYSB20150035); National Natural Science Foundation of
China (NSFC) (41120114001, 41001264); Natural Science Foundation of Jiangsu
Province (no. BK20150189); program B for outstanding PhD candidates of
Nanjing University. We acknowledge Tobias Bolch and Jeffrey S. Kargel for
their comments on an early version of this paper and the support from Owen
King on the analysis of glacier hypsometry. We thank Arjen Stroeven, Luke
Copland, and the anonymous reviewer for their detailed and supportive
assessments of the paper.
Edited by: Arjen
Stroeven
Reviewed by: Luke Copland and one anonymous referee
Avouac, J.-P., Ayoub, F., Leprince, S., Konca, O., and Helmberger, D. V.: The 2005, M-w 7.6 Kashmir earthquake: Sub-pixel correlation of ASTER images and seismic waveforms analysis, Earth Planet. Sc. Lett., 249, 514–528, https://doi.org/10.1016/j.epsl.2006.06.025, 2006.
Ayoub, F., Leprince, S., and Avouac, J.-P.: Co-registration and correlation of aerial photographs for ground deformation measurements, ISPRS J. Photogramm., 64, 551–560, https://doi.org/10.1016/j.isprsjprs.2009.03.005, 2009.
Barrand, N. E. and Murray, T.: Multivariate controls on the incidence of glacier surging in the Karakoram Himalaya, Arct. Antarct. Alp. Res., 38, 489–498, https://doi.org/10.1657/1523-0430(2006)38[489:mcotio]2.0.co;2, 2006.
Bolch, T., Kulkarni, A. V., Kääb, A., Huggel, C., Paul, F., Cogley, J. G., Frey, H., Kargel, J. S., Fujita, K., Scheel, M., Bajracharya, S., and Stoffel, M.: The state and fate of Himalayan glaciers, Science, 336, 310–314, https://doi.org/10.1126/science.1215828, 2012.
Brun, F., Berthier, E., Wagnon, P., Kääb, A., and Treichler, D.: A spatially resolved estimate of High Mountain Asia glacier mass balances from 2000 to 2016, Nat. Geosci., 10, 668–673, https://doi.org/10.1038/ngeo2999, 2017.
Burgess, E. W., Forster, R. R., and Larsen, C. F.: Flow velocities of Alaskan glaciers, Nat. Commun., 4, 2146, https://doi.org/10.1038/ncomms3146, 2013.
Clarke, G. K. C.: Thermal regulation of glacier surging, J. Glaciol., 16, 231–250, https://doi.org/10.3189/S0022143000031567, 1976.
Clarke, G. K. C.: Fast glacier flow: Ice streams, surging, and tidewater glaciers, J. Geophys. Res., 92, 8835–8841, https://doi.org/10.1029/JB092iB09p08835, 1987.
Copland, L., Pope, S., Bishop, M. P., Shroder Jr., J. F., Clendon, P., Bush, A., Kamp, U., Seong, Y. B., and Owen, L. A.: Glacier velocities across the central Karakoram, Ann. Glaciol., 50, 41–49, https://doi.org/10.3189/172756409789624229, 2009.
Copland, L., Sylvestre, T., Bishop, M. P., Shroder, J. F., Seong, Y. B., Owen, L. A., Bush, A., and Kamp, U.: Expanded and recently increased glacier surging in the Karakoram, Arct. Antarct. Alp. Res., 43, 503–516, https://doi.org/10.1657/1938-4246-43.4.503, 2011.
Dowdeswell, J., Hamilton, G., and Hagen, J.: The duration of the active phase on surge-type glaciers: Contrasts between Svalbard and other regions, J. Glaciol., 37, 388–400, https://doi.org/10.3189/S0022143000005827, 1991.
Dunse, T., Schellenberger, T., Hagen, J. O., Kääb, A., Schuler, T. V., and Reijmer, C. H.: Glacier-surge mechanisms promoted by a hydro-thermodynamic feedback to summer melt, The Cryosphere, 9, 197–215, https://doi.org/10.5194/tc-9-197-2015, 2015.
Farinotti, D., Longuevergne, L., Moholdt, G., Duethmann, D., Mölg, T., Bolch, T., Vorogushyn, S., and Güntner, A.: Substantial glacier mass loss in the Tien Shan over the past 50 years, Nat. Geosci., 8, 716–722, https://doi.org/10.1038/ngeo2513, 2015.
Fowler, A. C., Murray, T., and Ng, F. S. L.: Thermally controlled glacier surging, J. Glaciol., 47, 527–538, https://doi.org/10.3189/172756501781831792, 2001.
Gardelle, J., Berthier, E., and Arnaud, Y.: Slight mass gain of Karakoram glaciers in the early 21st century, Nat. Geosci., 5, 322–325, https://doi.org/10.1038/NGEO1450, 2012.
Gardelle, J., Berthier, E., Arnaud, Y., and Kääb, A.: Region-wide glacier mass balances over the Pamir-Karakoram-Himalaya during 1999–2011, The Cryosphere, 7, 1263–1286, https://doi.org/10.5194/tc-7-1263-2013, 2013.
Gardner, A. S., Moholdt, G., Cogley, J. G., Wouters, B., Arendt, A. A., Wahr, J., Berthier, E., Hock, R., Pfeffer, W. T., Kaser, G., Ligtenberg, S. R. M., Bolch, T., Sharp, M. J., Hagen, J. O., van den Broeke, M. R., and Paul, F.: A Reconciled Estimate of Glacier Contributions to Sea Level Rise: 2003 to 2009, Science, 340, 852–857, https://doi.org/10.1126/science.1234532, 2013.
Gladstone, R., Schäfer, M., Zwinger, T., Gong, Y., Strozzi, T., Mottram, R., Boberg, F., and Moore, J. C.: Importance of basal processes in simulations of a surging Svalbard outlet glacier, The Cryosphere, 8, 1393–1405, https://doi.org/10.5194/tc-8-1393-2014, 2014.
Goldstein, R. M., Engelhardt, H., Kamb, B., and Frolich, R. M.: Satellite Radar Interferometry for Monitoring Ice Sheet Motion: Application to an Antarctic Ice Stream, Science, 262, 1525–1530, https://doi.org/10.1126/science.262.5139.1525, 1993.
Gourmelen, N., Kim, S. W., Shepherd, A., Park, J. W., Sundal, A. V., Björnsson, H., and Pálsson, F.: Ice velocity determined using conventional and multiple-aperture InSAR, Earth Planet. Sc. Lett., 307, 156–160, https://doi.org/10.1016/j.epsl.2011.04.026, 2011.
Guo, W. Q., Liu, S. Y., Yao, X. J., Xu, J. L., Shangguan, D. H., Wu, L. Z., Zhao, J. D., Liu, Q., Jiang, Z. L., Wei, J. F., Bao, W. J., Yu, P. C., Ding, L. F., Li, G. Q., Li, P., Ge, C. M., and Wang, Y.: The Second Glacier Inventory Dataset of China (Version 1.0), https://doi.org/10.3972/glacier.001.2013.db, 2014.
Hall, D. K., Bahr, K. J., Shoener, W., Bindschadler, R. A., and Chien, J. Y. L.: Consideration of the errors inherent in mapping historical glacier positions in Austria from the ground and space, Remote Sens. Environ., 86, 566–577, https://doi.org/10.1016/S0034-4257(03)00134-2, 2003.
Harrison, W. D. and Post, A. S.: How much do we really know about glacier surging?, Ann. Glaciol., 36, 1–6, https://doi.org/10.3189/172756403781816185, 2003.
Heid, T. and Kääb, A.: Evaluation of existing image matching methods for deriving glacier surface displacements globally from optical satellite imagery, Remote Sens. Environ., 118, 339–355, https://doi.org/10.1016/j.rse.2011.11.024, 2011.
Herman, F., Anderson, B., and Leprince, S.: Mountain glacier velocity variation during a retreat/advance cycle quantified using sub-pixel analysis of ASTER images, J. Glaciol., 57, 197–207, https://doi.org/10.3189/002214311796405942, 2011.
Hewitt, K.: Tributary glacier surges: an exceptional concentration at Panmah Glacier, Karakoram Himalaya, J. Glaciol., 53, 181–188, https://doi.org/10.3189/172756507782202829, 2007.
Holzer, N., Vijay, S., Yao, T., Xu, B., Buchroithner, M., and Bolch, T.: Four decades of glacier variations at Muztagh Ata (eastern Pamir): a multi-sensor study including Hexagon KH-9 and Pléiades data, The Cryosphere, 9, 2071–2088, https://doi.org/10.5194/tc-9-2071-2015, 2015.
Huang, L., Li, Z., Han, H., Tian, B., and Zhou, J.: Analysis of thickness changes and the associated driving factors on a debris-covered glacier in the Tienshan Mountain, Remote Sens. Environ., 206, 63–71, https://doi.org/10.1016/j.rse.2017.12.028, 2018.
Jiang, Z., Liu, S., Long, S., Lin, J., Wang, X., Li, J., Xu, J., Wei, J., and Bao, W.: Analysis of the glacier dynamics features in Kongur Mountain based on SAR technology and DEMs, J. Glaciol. Geocryol., 36, 286–295, 2014 (in Chinese).
Jóhannesson, T., Raymond, C., and Waddington, E.: Time–Scale for Adjustment of Glaciers to Changes in Mass Balance, J. Glaciol., 35, 355–369, https://doi.org/10.3189/S002214300000928X, 1989.
Kääb, A.: Monitoring high-mountain terrain deformation from repeated air- and spaceborne optical data: examples using digital aerial imagery and ASTER data, ISPRS J. Photogramm., 57, 39–52, https://doi.org/10.1016/s0924-2716(02)00114-4, 2002.
Kääb, A.: Combination of SRTM3 and repeat ASTER data for deriving alpine glacier flow velocities in the Bhutan Himalaya, Remote Sens. Environ., 94, 463–474, https://doi.org/10.1016/j.rse.2004.11.003, 2005.
Kääb, A., Berthier, E., Nuth, C., Gardelle, J., and Arnaud, Y.: Contrasting patterns of early twenty-first-century glacier mass change in the Himalayas, Nature, 488, 495–498, https://doi.org/10.1038/nature11324, 2012.
Kääb, A., Treichler, D., Nuth, C., and Berthier, E.: Brief Communication: Contending estimates of 2003–2008 glacier mass balance over the Pamir–Karakoram–Himalaya, The Cryosphere, 9, 557–564, https://doi.org/10.5194/tc-9-557-2015, 2015.
Kamb, B., Raymond, C. F., Harrison, W. D., Engelhardt, H., Echelmeyer, K. A., Humphrey, N., Brugman, M. M., and Pfeffer, T.: Glacier surge mechanism: 1982-1983 surge of Variegated Glacier, Alaska, Science, 227, 469–479, https://doi.org/10.1126/science.227.4686.469, 1985.
Kargel, J. S., Abrams, M. J., Bishop, M. P., Bush, A., Hamilton, G., Jiskoot, H., Kaab, A., Kieffer, H. H., Lee, E. M., Paul, F., Rau, F., Raup, B., Shroder, J. F., Soltesz, D., Stainforth, D., Stearns, L., and Wessels, R.: Multispectral imaging contributions to global land ice measurements from space, Remote Sens. Environ., 99, 187–219, https://doi.org/10.1016/j.rse.2005.07.004, 2005.
Kenyi, L. W. and Kaufmann, V.: Estimation of rock glacier surface deformation using SAR interferometry data, IEEE T. Geosci. Remote Sens., 41, 1512–1515, https://doi.org/10.1109/tgrs.2003.811996, 2003.
Khromova, T. E., Osipova, G. B., Tsvetkov, D. G., Dyurgerov, M. B., and Barry, R. G.: Changes in glacier extent in the eastern Pamir, Central Asia, determined from historical data and ASTER imagery, Remote Sens. Environ., 102, 24–32, https://doi.org/10.1016/j.rse.2006.01.019, 2006.
King, O., Quincey, D. J., Carrivick, J. L., and Rowan, A. V.: Spatial variability in mass loss of glaciers in the Everest region, central Himalayas, between 2000 and 2015, The Cryosphere, 11, 407–426, https://doi.org/10.5194/tc-11-407-2017, 2017.
Kotlyakov, V. M., Osipova, G. B., and Tsvetkov, D. G.: Monitoring surge glaciers of the Pamirs, central Asia, from space, Ann. Glaciol., 48, 125–134, https://doi.org/10.3189/172756408784700608, 2008.
Leprince, S., Barbot, S., Ayoub, F., and Avouac, J.-P.: Automatic and precise orthorectification, coregistration, and subpixel correlation of satellite images, application to ground deformation measurements, IEEE T. Geosci. Remote Sens., 45, 1529–1558, https://doi.org/10.1109/tgrs.2006.888937, 2007.
Li, Z., Yao, T. D., Tian, L. D., Xu, B. Q., Wu, G. J., and Zhu, G. C.: Borehole Temperature at the Ice-core Drilling Site in the Muztag Ata Glacier, East Pamirs, J. Glaciol. Geocryol., 25, 280–284, https://doi.org/10.3969/j.issn.1000-0240.2004.03.007, 2004 (in Chinese).
Luckman, A., Quincey, D., and Bevan, S.: The potential of satellite radar interferometry and feature tracking for monitoring flow rates of Himalayan glaciers, Remote Sens. Environ., 111, 172–181, https://doi.org/10.1016/j.rse.2007.05.019, 2007.
Lv, M., Lu, X., Guo, H., Liu, G., Ding, Y., Ruan, Z., Ren, Y., and Yan, S.: A rapid glacier surge on Mount Tobe Feng, western China, 2015, J. Glaciol., 1, 1–3, https://doi.org/10.1017/jog.2016.42, 2016.
Mayer, C., Fowler, A. C., Lambrecht, A., and Scharrer, K.: A surge of North Gasherbrum, Karakoram, China, J. Glaciol., 57, 904–916, https://doi.org/10.3189/002214311798043834, 2011.
Meier, M. F. and Post, A.: What are glacier surges?, Can. J. Earth Sci., 6, 807–817, https://doi.org/10.1139/e69-081, 1969.
Meier, M. F., Dyurgerov, M. B., Rick, U. K., O'Neel, S., Pfeffer, W. T., Anderson, R. S., Anderson, S. P., and Glazovsky, A. F.: Glaciers dominate Eustatic sea-level rise in the 21st century, Science, 317, 1064–1067, https://doi.org/10.1126/science.1143906, 2007.
Oerlemans, J.: Quantifying global warming from the retreat of glaciers, Science, 264, 243–245, https://doi.org/10.1126/science.264.5156.243, 1994.
Ono, Y., Liu, D., and Zhao, Y.: Paleoenvironments of Tibetan Plateau Viewed from Glacial Fluctuations in the Northern Foot of the West Kunlun Mountains, J. Geogr., 106, 184–198, https://doi.org/10.5026/jgeography.106.plate7, 1997.
Osmonov, A., Bolch, T., Xi, C., Kurban, A., and Guo, W.: Glacier characteristics and changes in the Sary-Jaz River Basin (Central Tien Shan, Kyrgyzstan)-1990–2010, Remote Sens. Lett., 4, 725–734, https://doi.org/10.1080/2150704X.2013.789146, 2013.
Paul, F., Barrand, N. E., Baumann, S., Berthier, E., Bolch, T., Casey, K., Frey, H., Joshi, S. P., Konovalov, V., Le Bris, R., Molg, N., Nosenko, G., Nuth, C., Pope, A., Racoviteanu, A., Rastner, P., Raup, B., Scharrer, K., Steffen, S., and Winsvold, S.: On the accuracy of glacier outlines derived from remote-sensing data, Ann. Glaciol., 54, 171–182, https://doi.org/10.3189/2013AoG63A296, 2013.
Quincey, D. J. and Luckman, A.: Brief Communication: On the magnitude and frequency of Khurdopin glacier surge events, The Cryosphere, 8, 571–574, https://doi.org/10.5194/tc-8-571-2014, 2014.
Quincey, D. J., Luckman, A., and Benn, D.: Quantification of Everest region glacier velocities between 1992 and 2002, using satellite radar interferometry and feature tracking, J. Glaciol., 55, 596–606, https://doi.org/10.3189/002214309789470987, 2009.
Quincey, D. J., Braun, M., Glasser, N. F., Bishop, M. P., Hewitt, K., and Luckman, A.: Karakoram glacier surge dynamics, Geophys. Res. Lett., 38, 113–120, https://doi.org/10.1029/2011GL049004, 2011.
Quincey, D. J., Glasser, N. F., Cook, S. J., and Luckman, A.: Heterogeneity in Karakoram glacier surges, J. Geophys. Res., 120, 1288–1300, https://doi.org/10.1002/2015jf003515, 2015.
Raper, S. C. B. and Braithwaite, R. J.: Glacier volume response time and its links to climate and topography based on a conceptual model of glacier hypsometry, The Cryosphere, 3, 183–194, https://doi.org/10.5194/tc-3-183-2009, 2009.
Raymond, C. F.: How do glaciers surge? A review, J. Geophys. Res., 92, 9121–9134, https://doi.org/10.1029/JB092iB09p09121, 1987.
Scherler, D., Leprince, S., and Strecker, M. R.: Glacier-surface velocities in alpine terrain from optical satellite imagery – Accuracy improvement and quality assessment, Remote Sens. Environ., 112, 3806–3819, https://doi.org/10.1016/j.rse.2008.05.018, 2008.
Scherler, D., Bookhagen, B., and Strecker, M. R.: Spatially variable response of Himalayan glaciers to climate change affected by debris cover, Nat. Geosci., 4, 156–159, https://doi.org/10.1038/ngeo1068, 2011.
Seong, Y. B., Owen, L. A., Yi, C., Finkel, R. C., and Schoenbohm, L.: Geomorphology of anomalously high glaciated mountains at the northwestern end of Tibet: Muztag Ata and Kongur Shan, Geomorphology, 103, 227–250, https://doi.org/10.1016/j.geomorph.2008.04.025, 2009.
Sevestre, H. and Benn, D. I.: Climatic and geometric controls on the global distribution of surge-type glaciers: implications for a unifying model of surging, J. Glaciol., 61, 646–662, https://doi.org/10.3189/2015jog14j136, 2015.
Shangguan, D., Liu, S., Ding, Y., Ding, L., Xiong, L., Cai, D., Li, G., Lu, A., Zhang, S., and Zhang, Y.: Monitoring the glacier changes in the Muztag Ata and Konggur mountains, east Pamirs, based on Chinese Glacier Inventory and recent satellite imagery, Ann. Glaciol., 43, 79–85, https://doi.org/10.3189/172756406781812393, 2006.
Shangguan, D., Liu, S., Ding, Y., Guo, W., Xu, B., Xu, J., and Jiang, Z.: Characterizing the May 2015 Karayaylak Glacier surge in the eastern Pamir Plateau using remote sensing, J. Glaciol., 62, 944–953, https://doi.org/10.1017/jog.2016.81, 2016.
Su, Z., Liu, S., and Wang, Z.: Modern glaciers of Mt. Muztagata and Mt. Kongur, J. Nat. Resour., 4, 241–246, https://doi.org/10.11849/zrzyxb.1989.03.008, 1989 (in Chinese).
Thompson, L. G., Mosley-Thompson, E., Davis, M. E., Lin, P. N., Dai, J., Bolzan, J. F., and Yao, T.: A 1000 year climatic ice-core record from the Guliya ice cap, China: its relationship to global climate variability, Ann. Glaciol., 21, 175–181, https://doi.org/10.3189/S0260305500015780, 1995.
Tian, L., Yao, T., Li, Z., MacClune, K., Wu, G., Xu, B., Li, Y., Lu, A., and Shen, Y.: Recent rapid warming trend revealed from the isotopic record in Muztagata ice core, eastern Pamirs, J. Geophys. Res., 111, D13103, https://doi.org/10.1029/2005JD006249, 2006.
Watson, C. S., Quincey, D. J., Carrivick, J. L., and Smith, M. W.: The dynamics of supraglacial ponds in the Everest region, central Himalaya, Global Planet. Change, 142, 14–27, https://doi.org/10.1016/j.gloplacha.2016.04.008, 2016.
Yan, S., Ruan, Z., Liu, G., Deng, K., Lv, M., and Perski, Z.: Deriving Ice Motion Patterns in Mountainous Regions by Integrating the Intensity-Based Pixel-Tracking and Phase-Based D-InSAR and MAI Approaches: A Case Study of the Chongce Glacier, Remote Sens., 8, 611, https://doi.org/10.3390/rs8070611, 2016.
Yang, H., Yan, S., Liu, G., and Ruan, Z.: Fluctuations and movements of the Kuksai Glacier, western China, derived from Landsat image sequences, J. Appl. Remote Sens., 8, 084599, https://doi.org/10.1117/1.jrs.8.084599, 2013.
Yao, T. D., Liu, S. Y., Pu, J. C., Shen, Y. P., and Lu, A. X.: Recent glacial retreat in High Mountain Asia and its influence on water resource in northwest China, Sci. China Ser. D, 47, 1065–1075, https://doi.org/10.1360/03yd0256, 2004.
Yao, T. D., Thompson, L., Yang, W., Yu, W. S., Gao, Y., Guo, X. J., Yang, X. X., Duan, K. Q., Zhao, H. B., Xu, B. Q., Pu, J. C., Lu, A. X., Xiang, Y., Kattel, D. B., and Joswiak, D.: Different glacier status with atmospheric circulations in Tibetan Plateau and surroundings, Nat. Clim. Change, 2, 663–667, https://doi.org/10.1038/nclimate1580, 2012.
Yasuda, T. and Furuya, M.: Dynamics of surge-type glaciers in West Kunlun Shan, Northwestern Tibet, J. Geophys. Res., 120, 2393–2405, https://doi.org/10.1002/2015jf003511, 2015.
Zhang, X.: Recent variations in the glacial termini along the Karakorum Highway, Acta Geogr. Sinica, 35, 149–160, https://doi.org/10.3321/j.issn:0375-5444.1980.02.006, 1980 (in Chinese).