the Creative Commons Attribution 4.0 License.
the Creative Commons Attribution 4.0 License.
Unravelling the evolution of Zmuttgletscher and its debris cover since the end of the Little Ice Age
Tobias Bolch
Andrea Walter
Andreas Vieli
Debris-covered glaciers generally exhibit large, gently sloping, slow-flowing tongues. At present, many of these glaciers show high thinning rates despite thick debris cover. Due to the lack of observations, most existing studies have neglected the dynamic interactions between debris cover and glacier evolution over longer time periods. The main aim of this study is to reveal such interactions by reconstructing changes of debris cover, glacier geometry, flow velocities, and surface features of Zmuttgletscher (Switzerland), based on historic maps, satellite images, aerial photographs, and field observations. We show that debris cover extent has increased from ∼13 % to ∼32 % of the total glacier surface since 1859 and that in 2017 the debris is sufficiently thick to reduce ablation compared to bare ice over much of the ablation area. Despite the debris cover, the glacier-wide mass balance of Zmuttgletscher is comparable to that of debris-free glaciers located in similar settings, whereas changes in length and area have been small and delayed by comparison. Increased ice mass input in the 1970s and 1980s resulted in a temporary velocity increase, which led to a local decrease in debris cover extent, a lowering of the upper boundary of the ice-cliff zone, and a strong reduction in ice-cliff area, indicating a dynamic link between flow velocities, debris cover, and surface morphology. Since 2005, the lowermost 1.5 km of the glacier has been quasi-stagnant, despite a slight increase in the surface slope of the glacier tongue. We conclude that the long-term glacier-wide mass balance is mainly governed by climate. The debris cover governs the spatial pattern of elevation change without changing its glacier-wide magnitude, which we explain by the extended ablation area and the enhanced thinning in regions with thin debris further up-glacier and in areas with abundant meltwater channels and ice cliffs. At the same time rising temperatures lead to increasing debris cover and decreasing ice flux, thereby attenuating length and area losses.
- Article
(13518 KB) - Full-text XML
-
Supplement
(5275 KB) - BibTeX
- EndNote
Debris-covered glaciers have been observed to show a delayed adjustment of their length to climatic changes (e.g. Ogilvie, 1904; Scherler et al., 2011; Banerjee and Shankar, 2013). This behaviour can be explained by melt reduction due to insulation by the debris layer, which commonly increases in thickness towards the terminus (Östrem, 1959; Nakawo et al., 1986; Nicholson and Benn, 2006; Anderson and Anderson, 2018), and is expected to distinctly prolong the glacier's response time (Jóhannesson et al., 1989). Several studies showed that debris-covered glaciers exhibit similar thinning rates to debris-free glaciers in the Himalayas (e.g. Kääb et al., 2012; Gardelle et al., 2012; Nuimura et al., 2012). Explanations proposed for this behaviour include the emergence of surface features with exposed ice (e.g. ice cliffs, water flow channels, ponds), enhanced thinning further up-glacier that compensates for the debris-induced melt reduction, reduced mass flux from the accumulation areas and decreasing emergence velocities at the tongue, and englacial ablation with subsequent roof collapsing (e.g. Pellicciotti et al., 2015; Vincent et al., 2016; Ragettli et al., 2016; Banerjee, 2017; Brun et al., 2018). Ice cliffs and ponds can enhance ablation in comparison to debris-covered surfaces and even debris-free ice and are common features on debris-covered glacier tongues (Benn et al., 2012; Brun et al., 2016). Especially during periods of negative mass balance, the down-glacier increase in debris cover thickness reduces ablation through its insulating effect and can lead to a lower – and even reversed – mass balance gradient (Nakawo et al., 1999; Benn and Lehmkuhl, 2000; Benn et al., 2012; Ragettli et al., 2016; Rounce et al., 2018). Over time, this reduction in ablation can lead to a decrease in surface slope and, consequently, driving stress and ice flow velocity (Kääb, 2005; Bolch et al., 2008b; Quincey et al., 2009; Jouvet et al., 2011; Rowan et al., 2015; Dehecq et al., 2019). Furthermore, with an increase in equilibrium line altitude (ELA) the englacial debris melts out earlier, leading to an extended debris cover further up-glacier (Benn et al., 2012; Kirkbride and Deline, 2013; Carturan et al., 2013). As a consequence of reduced ablation and driving stress, heavily debris-covered glaciers often have long, gently sloping, low-lying tongues with low flow velocities or even stagnant parts (Benn et al., 2012). Current research on many debris-covered glaciers is mostly focussed on processes, such as ablation beneath the debris cover and in areas of ice cliffs and ponds, thinning of glacier tongues, surface flow velocities, or changes in debris cover over time (e.g. Hambrey et al., 2008; Bolch et al., 2012; Benn et al., 2012; Dobhal et al., 2013; Ragettli et al., 2016; Gibson et al., 2017). A few studies have started to integrate the existing understanding and interactions of some of these processes into numerical models for the evolution of such glaciers (Jouvet et al., 2011; Rowan et al., 2015; Anderson and Anderson, 2016; Banerjee, 2017).
However, most studies face difficulties leading to persistent shortcomings in our understanding of the development of debris-covered glaciers: (i) time series are often too short to inform on the full response time of larger glaciers; (ii) investigations are often local because repeated tongue-wide data are sparse, especially for longer periods; (iii) by considering only one or a few variables, the mutual influences of changing debris cover and glacier geometry cannot be assessed; (iv) long-term (> decade) glacier-scale studies have mostly been conducted in the Himalayas (e.g. Bolch et al., 2008b; Ragettli et al., 2016; Lamsal et al., 2017).
To better understand how a changing debris cover affects glacier geometry, flow velocities, and surface features, and how debris cover is in turn affected by these variables, it is necessary to consider the long-term development of glaciers beyond their potential response times. Few studies have investigated the temporal evolution of debris cover on glaciers (overview in Kirkbride and Deline, 2013), or the evolution of debris-covered glaciers over time (e.g. D'Agata and Zanutta, 2007; Capt et al., 2016). Several studies observed an increase in debris cover on glaciers during negative mass balance periods (e.g. Bolch et al., 2008a; Quincey and Glasser, 2009; Kirkbride and Deline, 2013). Because of the overall negative mass balance trend, glaciers are and will be increasingly affected by debris cover. It is important to understand the magnitude of this increase and how it affects the geometry and dynamics of the glaciers in order to simulate their future development (Jouvet et al., 2011; Anderson and Anderson, 2016).
Large debris-covered glaciers in the Himalayas and Karakoram are not ideal candidates for long-term investigations due to their long response times (>50 years because of thick ice and debris cover; Cogley, 2011; Banerjee and Shankar, 2013) and data scarcity before the 1960s. In contrast, the long history of length monitoring as well as the availability of topographic maps and aerial photos from the mid-19th century onwards make glaciers in the Alps and especially in Switzerland well suited to study long-term development. In Switzerland, the earliest maps (1850s, 1870s) already include debris symbols and contour lines, and stereo imagery throughout the 20th century allows for detailed 3-D surface investigations.
In this study we aim to understand the long-term geometric evolution and dynamics of debris-covered glaciers through the study of Zmuttgletscher in the Swiss Alps. This medium-sized valley glacier has been going through the transition from a mostly debris-free glacier in the late 1850s to one that is almost completely debris-covered in its ablation area (2017). We quantify the evolution of geometry (length, area, elevation, slope), mass balance, flow, and debris cover at a high spatial and temporal resolution since the end of the Little Ice Age (LIA) around 1850. We use these data to investigate interactions between geometry evolution, ice flow, and debris cover and the related drivers. We further analyse the occurrence of ice cliffs and their role in long-term glacier evolution.
Zmuttgletscher ( N, E) is located in the southern end of the Matter Valley in the western Swiss Alps and ranges from ∼2240 to ∼4150 m a.s.l. It is surrounded by the Matterhorn (4478 m) and the Dent d'Hérens (4174 m) to the south, the Dent Blanche (4357 m) to the north, and high ridges (above 3400 m) in between (Fig. 1). In 2016, the glacier had a surface area of 15.74 km2 and was substantially debris-covered in its ablation area. The debris mainly originates from the surrounding rock walls.
Zmuttgletscher is located in a relatively dry region at the main divide of the Alps; thus it receives precipitation from both northern and southern weather systems. There are no direct measurements at higher elevations, but model estimates suggest values between 0.8 and 1.5 m (MeteoSwiss, 2014). Glaciological mass balance measurements at the nearby debris-free Findelgletscher (15 km distant) suggest end-of-winter accumulation around 0.8–1.5 m water equivalent (w.e.) (Sold et al., 2016). However, at Zmuttgletscher, avalanching additionally contributes to accumulation. When including contributing rock walls and lateral moraines, the total area available for accumulation is up to 22 km2 (restricted to areas >30∘ slope angle, Fig. 1).
Zmuttgletscher has several independent and connected tributaries (Fig. 1). The major accumulation area in the south – Tiefmattengletscher – reaches almost up to the summit of Dent d'Hérens. The western accumulation area – Stockjigletscher – is a relatively flat area above two distinct icefalls between Tête Blanche (3710 m), Stockji (3092 m), and Wandfluehorn (3588 m). Schönbielgletscher is a tributary from the north reaching up to ∼3400 m, below the Dent Blanche summit wall. The upper part of Tiefmattengletscher is completely surrounded by rock walls, including the >1000 m high Dent d'Hérens north wall and the almost 1500 m high Matterhorn west face. At the end of the LIA, the main glacier tongue was nourished from all of these accumulation areas. In 2017, it is mainly fed by Tiefmattengletscher and to a lesser extent from Stockjigletscher. Around 2010 the central, almost debris-free Stockjigletscher branch (between point 2095 and Stockji) detached from the main tongue. Because Stockjigletscher is lacking high rock walls in its accumulation area, it does not deliver substantial amounts of debris down to the ablation area. In contrast, the relatively low-lying Schönbielgletscher receives a lot of accumulation through avalanching from the surrounding rock walls and consequently exhibits a continuous debris cover even above the icefall at ∼2900 m.
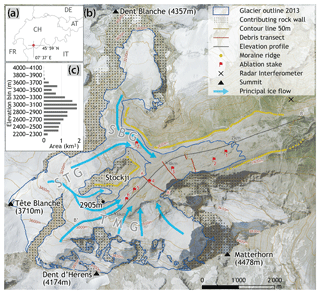
Figure 1(a) Geographical location. (b) Zmuttgletscher, its topographical setting and different tributaries: SBG: Schönbielgletscher; STG: Stockjigletscher; TMG: Tiefmattengletscher. Background image: orthomosaic from aerial imagery by Swisstopo from 2013 (Swisstopo, 2010). (c) Glacier hypsography in the year 2010 (© SwissTopo).
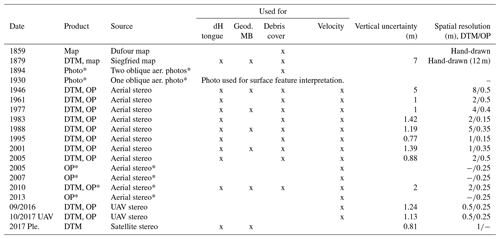
Our analyses are based on topographical maps, aeroplane-based and UAV-based aerial images, and satellite images (Table 1), in addition to various field observations, and long-term air temperature measurements. The use of these data is discussed in the respective sections below. Areal images were available from (i) post-war mapping flights by the American military, (ii) national flight campaigns for topographic map production, (iii) specific flight campaigns for glacier monitoring purposes conducted by Swisstopo, (iv) fixed-wing UAV flights (using a Sensefly eBee Classic; Sensefly SA) in 2016 and 2017, and (v) Pleiades tri-stereo images from 2017.
Table 1Topographic maps and satellite and aerial images used in this study. Abbreviations are as follows: dH: elevation change; DTM: digital terrain model; OP: orthophoto; obl. aer.: oblique aerial; Ple.: Pleiades. Entries denoted with an asterisk are used as a final product. All data except 1894, 2016, and 2017 are from Swisstopo (2018a). Oblique photos from 1894 were taken by Reid (1894).
3.1 Generation of digital terrain models (DTMs) and orthophotos
Glacier surface information was extracted from stereo-photogrammetric DTMs generated from aerial images and the Siegfried map (Table 1). To obtain a DTM representing the glacier tongue in 1879 the Siegfried map from 1880 (Swisstopo, 2010) was georeferenced using ground control points (GCPs). Subsequently, the contour lines were semi-automatically digitised by separating the differently coloured (blue is on-glacier; brown is off-glacier) contour lines from other symbols (Siedler, 2011). Their elevation information was extracted and interpolated using the Topo-to-Raster tool in ArcGIS. The point of origin for elevation measurements, situated at the shore of Lake Geneva, changed in the 1930s from 376.2 to 373.6 m (Swisstopo, 2018a) and the elevations derived from the Siegfried map were corrected accordingly.
The DTMs from 1946 to 2017 (apart from 2010 and the Pleiades DTM from 2017) were created with photogrammetric methods using structure-from-motion software (Agisoft LLC, 2016; Pix4D, 2016). For each date, a point cloud was produced from the available number of input images (4–29) and then georeferenced using a set of 10–15 GCPs, i.e. reference points in the images that could be referred to points on stable ground, taken from Swissimage 2013. The quality of the DTMs is comparable to DTMs from traditional photogrammetric software (see Mölg and Bolch, 2017). Their uncertainty in elevation – defined as the standard deviation over stable terrain around the glacier tongue – mostly lies within 2 m depending on the resolution of the aerial images, the number of images, and image quality factors (somewhat higher values were obtained for the DTMs from 1879 and 1946; Table 1). The uncertainties were derived for terrain with comparable steepness to the glacier surface () and are assumed constant in space, although DTM quality decreases in steep areas (e.g. rock walls). The DTM from 2010 (SwissAlti3D) was taken as a final product from Swisstopo and had also been produced from aerial stereo images; it has a nominal resolution and a vertical accuracy of 2 m (Swisstopo, 2018b). In addition, we generated a glacier-wide DTM for 2017 (spatial resolution 1 m) using Pleiades tri-stereo, high-resolution satellite imagery, based on photogrammetric principles using PCI Geomatics (Geomatica, 2016). All DTMs were co-registered to the reference DTM (2010) before further analysis by using the analytical approach by Nuth and Kääb (2011), followed by a second-order trend surface correction to eliminate remaining elevation differences (Pieczonka et al., 2013).
Orthophotos were generated by rectification of the stereo images using the respective DTM.
3.2 Glacier area and length
Glacier areas were measured from the Dufour map (1859), the Siegfried map (1879), all available orthophotos, and the Swissimage (2005, 2007, 2010, 2013; Swisstopo, 2010; Table 1) by manual digitisation. The Dufour map (map sheet 22, section 8, number 485) from 1859 was the first map containing elevation information (in the form of contour lines) and distances acquired with modern methods (Wolf, 1879; Graf, 1896; Rastner et al., 2016). The extent of the glacier and the supraglacial debris could be extracted from the map, whereas its elevation information was disregarded due to strong, non-linear, horizontal distortions.
The time series of maps and orthophotos resulted in glacier area values for each corresponding date since 1859. The mapping quality is often lower in debris-covered areas compared to debris-free areas (Paul et al., 2013), but the high resolution of these images allowed correct interpretation of the glacier margin. The glacier boundary in the accumulation area to the west was taken from the 2010 ice divide and was kept constant over time. The hanging glaciers at the north face of Dent d'Hérens have been included in the glacier area since they contribute mass to the main glacier through frequent ice avalanches.
Front variation measurements were conducted by using the glacier outlines for each date. Along the ice front – perpendicular to the flow – the change was measured at distances of 100 m and then averaged (Koblet et al., 2010; Bhambri et al., 2012). For the comparison to other glaciers we used GLAMOS length variations (GLAMOS, 2018), which were acquired in the field with the same concept of several parallel measurements, equidistant by 50 m. At Zmuttgletscher, GLAMOS measurements have regularly been conducted between 1892 and 1997, but with serious data issues before 1946. The GLAMOS data for Zmuttgletscher since 1946 are almost identical to our own relative length change record (Fig. S1 in the Supplement) and are therefore not further used. To interpret the observed length changes and the potential influence of debris cover, we compared the variations from our measurements to the GLAMOS data of 10 other Swiss glaciers.
The uncertainty of both area and length results is estimated to lie within pixel (Table 1) along the glacier boundary and the start and end of the length profile, respectively (Hall et al., 2003; Granshaw and Fountain, 2006; Bolch et al., 2010; Bajracharya et al., 2015). For the calculation of the changes, the uncertainties of the two respective dates are combined by error propagation, analogous to the mass balance data (Hall et al., 2003; Zemp et al., 2013).
3.3 Debris cover, on-site ablation, and on-site air temperature
Debris cover extent for the orthophotos and historic maps was manually digitised (Fig. 2a, b). We mapped only areas of continuous debris cover, thus avoiding the inclusion of sparse debris cover. The debris extent of the Siegfried map (1879) was verified using two photographs taken in 1894 (Fig. 2c). This information was valuable to limit the debris extent at and up-glacier of the confluence of Tiefmattengletscher and Schönbielgletscher, which was the region of the strongest changes (Fig. 2d).
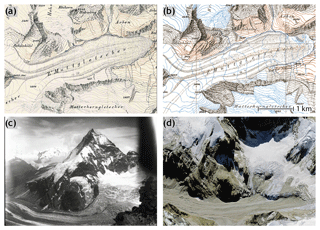
Figure 2Example of mapped debris cover on (a) Dufour map, 1859 (© SwissTopo), and (b) Siegfried map, 1879 (© SwissTopo). (c) Parts of the tongue in 1894 towards the south-west (Reid, 1894; National Snow and Ice Data Center, 2002, updated 2015). (d) Similar extent as in (c) in 2013 (Swisstopo, 2010). Panels (c) and (d) show the main tongue and Tiefmattengletscher.
Ablation was measured at seven points on the glacier tongue (Fig. 1) during summer 2017 to better understand the influence of debris on melt and to complement the long-term elevation change data. These point measurements were conducted on bare ice and on surfaces with variable debris thickness at elevations between 2300 and 2600 m using 2 m long PVC stakes that were connected by zip ties and drilled into the ice. Debris cover was removed for the drilling and repositioned after inserting the stakes. To get a rough estimate of ablation on ice cliffs, the horizontal backwasting of a south-facing and north-facing ice cliff was measured using horizontally inserted ablation stakes. All stakes were measured in intervals of several weeks over the course of the 2017 ablation season.
Debris thickness data were collected in the field by manual excavation along and in between three transects perpendicular to the glacier flow direction in September 2017 (for transect locations see Fig. 1). Each data point represents the average of three measurements ∼1 m apart, and the standard deviation is used as an uncertainty measure. However, for debris thicknesses greater than 20 cm only one measurement was taken.
Homogenised time series of air temperature measurements by MeteoSwiss (Füllemann et al., 2011) were used to interpret the observed glacier evolution. The selected climate stations had to be as close to the study site as possible, lie at similar elevations, and cover a long period. Since no single station fulfilled all requirements, we used the stations on Col du Grand St. Bernard (2472 m, ∼40 km, 1864–2018) and in Sion (484 m, ∼35 km, 1865–2017).
3.4 Surface flow velocities
Surface flow velocities provide important information about the glaciers' dynamical state and its change over time. Automatic feature tracking methods were not feasible for imagery acquired before 2005 because the time differences and, thus, displacements of the features were too large. Therefore we manually tracked boulders to infer flow velocities along the debris-covered part of the main tongue as well as on the lower debris-covered part of Schönbielgletscher. The tongue was divided into four sections and 11 subsections according to differences in dynamic state and ice flow units (Fig. 8). The individual measurements were averaged for every time period and subsection to achieve a comprehensive picture of the dynamic changes. For the periods 2005–2007 and 2016–2017 we extracted flow velocity fields using the feature tracking module IMCORR in SAGA GIS (Fahnestock et al., 1992; Scambos et al., 1992; Conrad et al., 2015). The results were filtered using a visually defined threshold of correlation quality (“strength” =10.0). Outliers were manually removed, e.g. in the area of strong ice-cliff change or proglacial water surfaces.
Between 22 and 24 August 2017 the tongue of Zmuttgletscher was observed with a terrestrial radar interferometer (GPRI) developed by Gamma Remote Sensing AG (Werner et al., 2008). The GPRI was installed on a hill about 3 km away from the terminus in 2017 (Fig. 1). Measurements were acquired every minute for 1.5 d with a final range resolution of 3.75 m and an azimuth resolution of 7 m at a slant range of 1 km. The interferograms were determined with a standard workflow following Caduff et al. (2015) using the Gamma software, were stacked over a window of 8 h to reduce noise, and were afterwards unwrapped using a stationary point on the ground. The unwrapped phases were then converted to line-of-sight displacements according to Werner et al. (2008), whereby negative velocities were considered to be noise and filtered out. The results were georeferenced by rotating the displacement map to best match with the DEM25 (Swisstopo, 2005). Afterwards, the data were resampled into the new grid using nearest-neighbour interpolation. To assess the uncertainties in the velocities we looked at the difference from zero in measured displacement of 10 stationary points. This results in an uncertainty of the stacked velocity maps of ±0.03 m d−1.
3.5 Surface features
Ice cliffs, exposed ice at supraglacial meltwater channels, and lakes were extracted in a semi-automatic process using an object-based approach with Trimble eCognition (eCognition Essentials 1.3, 2016); see Kraaijenbrink et al. (2016). The location and area of these surface features was determined on all orthophotos from 2013. A primary segmentation divides the image into polygons based on pixel intensity and image texture. Ice cliffs often consist of a lower, steeper section of bare ice and a flatter section of ice covered with sand and pebble-sized debris particles in the upper part, where the maximum solar angle seems to define the slope of pole-facing cliffs (Sakai et al., 2002; Buri et al., 2016). These changing slope areas were often separated by segmentation, and were in a second step manually selected and combined into one polygon per ice cliff or lake. Supraglacial channels cover only small areas and are thus incorporated into the term “ice cliffs”. The described approach is effort efficient and assures a low uncertainty level, which is on the order of pixel. In order to assess the potential influence of ice cliffs on surface elevation change, we investigated their changes in area on the glacier tongue for different time periods. A 35 m buffer was generated around the ice-cliff polygon for both date 1 and date 2, and the overlapping area of these two buffer zones defined the category of ice-cliff areas. For each period the average surface elevation change in this category was compared to the surface elevation change at the rest of the tongue (yellow area in Fig. 9b).
3.6 Surface elevation changes and geodetic mass balance
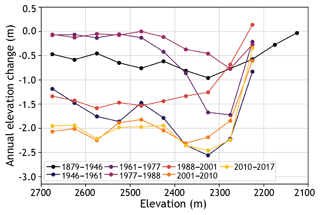
The time series of surface elevation change over the glacier tongue was restricted to the overlapping area of all available DTMs from 1879 to 2017 (11 dates), which reaches up to ∼2750 m a.s.l. and covers >50 % of the ablation area of Tiefmattengletscher (2017) as well as the lowest parts of Stockjigletscher and Schönbielgletscher. The surface elevation change maps were generated and investigated for each individual period as well as for the entire time span. A glacier's elevation change is typically stronger towards lower elevations, whereas the insulation effect of a continuous debris layer can reverse this gradient. To estimate whether such an effect can be discerned at Zmuttgletscher over time, we analysed the average elevation change of 50 m elevation bins (starting from 2125±25 m up to 2675±25 m) for seven periods since 1879.
Glacier-wide geodetic mass balance estimates were calculated between dates for which DTMs covered large parts of the glacier surface (1879, 1946, 1977, 1988, 2001, 2010, 2017). In areas of data voids or artefacts in the DTM, especially at higher elevations, no surface elevation change values could be calculated. In order to reduce the sensitivity to data voids and outliers, 100 m elevation bins (starting from 2100 m) were used for the elevation change calculation. In elevation bins without DTM coverage, the average of three extrapolation methods was used as the final mass balance value. The following three methods were used to fill the data voids: (1) a linear relationship between elevation and elevation change (e.g. Kohler et al., 2007; Kääb, 2008), which is based on the strong respective correlation up to R2=0.93; (2) the same relationship but additionally setting the elevation change values to 0 when they become positive in the highest elevations; (3) the mean elevation change value of the uppermost elevations that contain data and applied to the glacierised area above. The area-weighted average elevation change of all bins was summed to calculate the average elevation change of the total glacier surface. We assumed an average density of 850±60 kg m−3 (Sapiano et al., 1998; Huss, 2013) to convert the volume to mass changes.
3.7 Uncertainties
The total uncertainty of the surface elevation estimates and the mass balance consists in (i) the accuracy of the individual DTMs, (ii) the filling of the empty elevation zones, (iii) the glacier volume density, (iv) the debris volume changes, and (v) the DTM co-registration. Ice density changes are on average assumed to be negligible over a longer time span but we included an uncertainty of ±60 kg m−3 for the density to mass conversion (σdens); see Huss (2013). Debris volume changes were not accounted for due to a lack of such data, but they would have a negligible effect on the total uncertainty in volume change. The error from the filling of the elevation zones is taken into account as the standard deviation between the total mass balance after applying the three different interpolation methods (σfill). This uncertainty measure was combined with the uncertainties of the two DTMs framing the respective period (σDTM1 and σDTM2, standard deviation over stable terrain) to be used as the total uncertainty for the resulting mass balance by applying the law of error propagation (e.g. Hall et al., 2003; Zemp et al., 2013) and hence given by
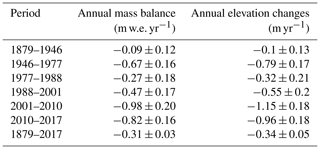
Uncertainties range from ±0.12 to ±0.2 m w.e. yr−1, whereas the uncertainty for the total period 1879–2017 is ±0.03 m yr−1 (Table 2).
4.1 Geodetic mass balance
Zmuttgletscher's long-term mass balance from 1879 to 2017 was m w.e. yr−1 (Table 2). The mass balance was least negative between 1879 and 1946 (Fig. 3a). Also during the climatically favourable period in the 1970s and 1980s Zmuttgletscher had less mass loss, even below the Swiss-wide mean (Fig. 3a). Between 1977 and 1988 the glacier-wide mass balance stayed negative ( m w.e. yr−1), although certain areas on the tongue showed an increase in elevation (Fig. 10c, d, e). After 1988, the mass balance became more negative again, even though the lowest areas on the tongue still showed stable or even increasing surface elevation (Fig. 10f). The negative trend continuously intensified and after 2001 Zmuttgletscher's mass balance became more negative than the Swiss-wide mean (Table 2).
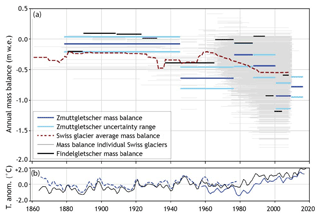
Figure 3(a) Geodetic mass balance of Zmuttgletscher and Findelgletscher (data from Rastner et al., 2016) in comparison to all Swiss glaciers. Mass balance data from WGMS (2017). (b) Evolution of air temperature anomaly (T. anom.) at the climate stations Col du Grand St. Bernard (black lines, 2472 m, ∼40 km) and Sion (blue lines, 484 m, ∼35 km). Note that the Sion climate station was slightly repositioned in the 1960s (dashed vs. solid blue). The air temperature data were smoothed with a 5-year running mean.
4.2 Glacier area and length changes
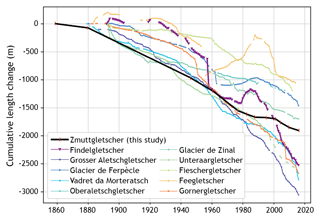
From close to the end of the LIA (∼1850s) to 2017, Zmuttgletscher retreated by 1907±12 m (i.e. 12.1±0.09 m yr−1; Fig. 4). The retreat rate peaked between 1961 and 1977 ( m yr−1). Between 1977 and 2001, parts of the glacier terminus stagnated or even slightly advanced. Between 2001 and 2005 Zmuttgletscher accelerated its retreat, reaching m yr−1, and slightly decelerated to m yr−1 after 2005. The total glacier area decreased from 21.24±0.34 km2 in 1859 to 15.74±0.02 km2 in 2016 (Fig. 5). Similar to the length change, the area decreased only slightly between 1977 and 2001 ( km2 yr−1), after which the loss rate increased again to km2 yr−1 (see also Figs. S1, S2, S3). Overall, Zmuttgletscher shows a relatively modest retreat while other debris-covered glaciers – Unteraargletscher and Glacier de Zinal – have retreated more rapidly (Fig. 4).
4.3 Debris cover
4.3.1 Debris cover evolution
At the end of the LIA 2.75±0.2 km2 of Zmuttgletscher was debris-covered, which increased to 5.03±0.01 km2 in 2013. During this time the total glacier area decreased from 21.24±0.4 to 15.82±0.3 km2, resulting in an increase in percentage of debris cover from ∼12.9 % to 31.8±0.06 % of the glacier area from ∼1850 to 2013 (Fig. 5).
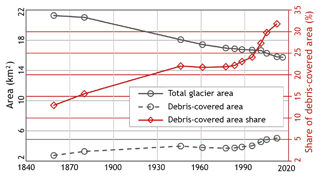
Figure 5Evolution of total glacier area, debris-covered glacier area, and the share of the debris-covered glacier area.
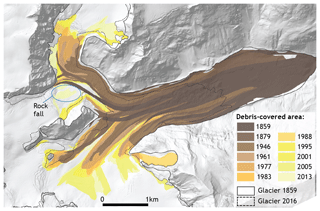
Generally, the debris cover extent has expanded up-glacier in Tiefmattengletscher and Schönbielgletscher. The extension was pronounced along the surface of Schönbielgletscher and in the central part of the main glacier tongue (Fig. 6). In both areas the debris extent has expanded to above the icefall into the former accumulation areas and now is close to the foot of the contributing rock walls of Dent d'Hérens (Tiefmattengletscher) and Dent Blanche (Schönbielgletscher). The debris extent also strongly expanded at the glacier margins below Stockji, due to further input from moraines and the disconnection of a contributing tributary. By 2010, the icefall at Stockjigletscher had thinned sufficiently to disconnect and expose the rock wall beneath, from which a small rock fall detached between 2010 and 2013 (Fig. 6). This debris mound covered an area of approximately 170×300 m and is now being slowly transported down-glacier and spreading laterally.
4.3.2 Debris cover characteristics
Field investigations revealed a homogeneous debris cover in some regions with stone sizes in the topmost layer mainly between 10 and 30 cm in diameter, and a much more heterogeneous debris cover in other regions, with pebble-sized stones to metre-scale boulders (Fig. S4). The typical base layer of the debris consists of fine-grained material (sand and even silt), and is overlain by a few centimetres of pebbles. The thickness of the debris layer along each transect varied from less than 5 cm to greater than 70 cm. The thickest areas were found on the elongated ridge, especially on the steep, southern slope (Fig. 7a, transect length 400–500 m). The average thickness along the upper transect was 16.3±1.3 cm.
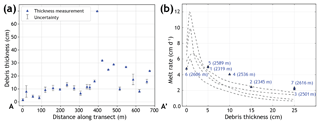
Figure 7(a) Debris thickness along the upper transect (Fig. 1). Uncertainty bars represent the standard deviation of three measurements per location for depths <20 cm. (b) Ablation of seven stakes over the time period 5 July–22 August 2017 (for locations see Fig. 1). For comparison the curves of Rakhiot Glacier, Barpu Glacier, Kaskawalsh Glacier, and Isfallsglaciären are displayed (adapted from Mattson et al., 1993).
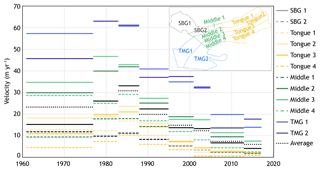
Figure 8Evolution of surface flow since 1961 for the different sections of the glacier tongue as labelled in the inset map. After an increase in the 1970s and 1980s a rapid slowdown occurred in all observed regions. SBG: Schönbielgletscher; TMG: Tiefmattengletscher.
Ablation measurements from seven locations and over a 7-week period in summer 2017 show an “Östrem-like” behaviour with respect to debris thickness (Fig. 7b; Östrem, 1959). These data indicate that melt is strongly dependent on debris thickness and much less on elevation. Compared to the reference stake at 2606 m on debris-free ice, field measurements in summer 2017 showed a reduction of ∼15 % and ∼50 % for debris thicknesses of 10 and 25 cm, respectively. These values are somewhat smaller than in the literature, where melt reductions of ∼40 %–60 % and 70 %–80 % for ∼10 and ∼25 cm, respectively, were found (Östrem, 1959; Mattson et al., 1993; Nicholson and Benn, 2006; Brock et al., 2007). Note that our debris-free reference stake is at the highest elevation of all stakes, which may partly explain our underestimation in melt reduction by debris. The backwasting rate of ice cliffs was 1.3 times higher than at the debris-free reference stake. The uncertainty of the ablation measurements is ∼3 cm, which results in an ablation rate uncertainty in the order of ±0.09 cm d−1.
4.4 Surface flow velocities
Overall, there is a trend of decreasing velocities since the first measurement period of 1961–1977 until the most recent one (2010–2017), but with a clear phase of acceleration in the late 1970s and 1980s. Velocities in the lowest section of the glacier tongue (yellow) as well as the lower Schönbielgletscher have decreased from 10 to 20 m yr−1 in the 1980s to almost zero (<3 m yr−1 since 2005) and can be considered close to stagnant. The middle section (green) showed values of 30–40 m yr−1 until the 1980s; afterwards velocities strongly decreased to ∼5–10 m yr−1. Velocities in the highest section (blue) have decreased over the same period from 50 to 60 to ∼15 m yr−1. In the periods 1977–1983 and 1983–1988 a velocity increase of close to 50 % was observed in all areas, with a slightly delayed signal down-glacier. It was followed by a strong velocity decrease in the 1990s that became weaker thereafter. In all time periods central glacier parts moved faster than the margins, and velocities strongly decreased down-glacier (Figs. 8, S5). Uncertainties are on the order of ±0.1 m yr−1.
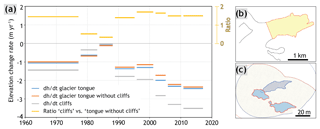
Figure 9Influence of ice cliffs on total elevation change rate over the lowest area of the glacier tongue for eight time periods from 1961 to 2017. (a) Elevation change rate periods; (b) area that was considered “tongue” for elevation change analysis; (c) examples of ice cliffs of two different years (2005 in red; 2001 in blue), the corresponding borders of the 35 m buffer, and the overlapping area of this buffer (yellow, grey dotted area).
The displacements from radar interferometry from the 1.5 d period in summer 2017 yield similar results and confirm the quasi-stagnation of the lower tongue with line-of-sight flow speeds <2 m yr−1 (Fig. S5). The more active part of the glacier with velocities >10 m yr−1 extends up-glacier from just above the confluence of Tiefmattengletscher and Schönbielgletscher. During recent years, the flow in this mid-tongue section has strongly decreased and velocities have halved between 2005–2007 and 2016–2017 (Figs. 8 and S5).
4.5 Ice cliffs and related elevation change
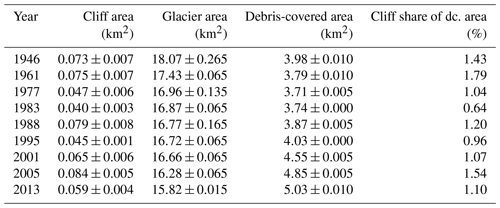
Even though the glacier has become more debris-covered, we did not find any clear long-term trend in area and location of ice cliffs (Table 3). They are almost exclusively located in the lowest part of the glacier tongue (yellow area in Fig. 9). The total ice-cliff area decreased by over 40 % in the 1970s and early 1980s but increased again afterwards. The topographically corrected ice-cliff area amounts to less than 0.5 % of the total glacier area and less than 1.8 % of the debris-covered glacier area (Table 3). As only a few small ponds have been detected (<5 per time step) they have not been further analysed.
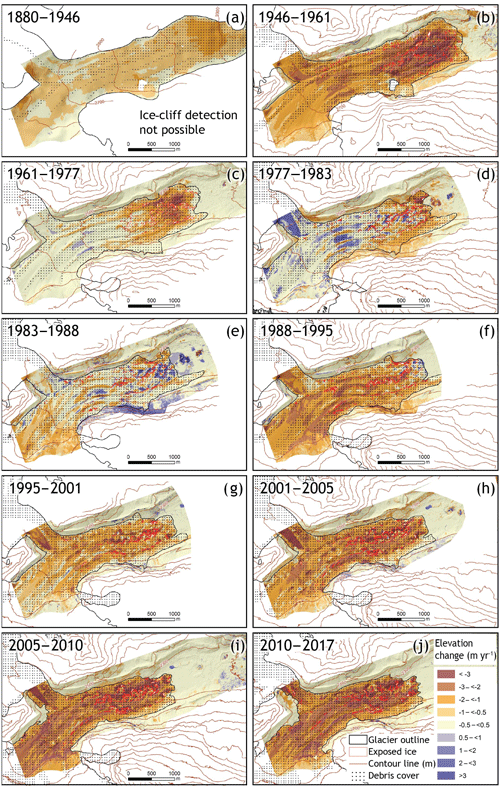
Figure 10Evolution of elevation change over the glacier tongue since 1879. Ice-cliff areas are shown in red. Note how the “wave” of mass flux moves down-glacier from (c)–(f). High values in the glacier forefield (e.g. 1983–1988) are linked to artefacts from water surfaces and the activities of a gravel mining company. See Figs. S7 to S16 in the Supplement for enlarged panels.
Over the entire period, the average elevation change of ice-cliff areas (cliffs + buffer overlap) was 1.2 times higher than over the rest of the tongue (Fig. 9). During the 1970s and 1980s the thinning rates were almost the same and close to zero whereas since 1988 the ratio of average elevation change ranged between 1.5 and 1.7. When considering average thinning rates over the entire glacier tongue from 1995 to 2017, the inclusion of ice-cliff areas enhances the surface lowering only by less than 5 % compared to average thinning of the glacier tongue without ice cliffs. Thus the presence of ice cliffs does not seem to affect the mass loss substantially.
4.6 Tongue-wide surface elevation change and patterns
Since the end of the LIA, the surface elevation of the Zmuttgletscher tongue below 2750 m a.s.l. has almost continuously decreased (Fig. 10). Between 1879 and 1946, the average elevation change was negative at m yr−1, and substantially decreased to m yr−1 between 1946 and 1961. In the 1970s and 1980s the tongue partially thickened, which is most pronounced at the tip of the Stockjigletscher tongue ( m yr−1 from 1977 to 1983) and in the main trunk of the tongue, while the terminus area was still substantially thinning. Between 1977 and 1983 the tongue's average surface elevation barely changed, at a rate of m yr−1. Between 1983 and 1995 the upper part of the tongue already started to thin again whereas in the lowest 1 km a mixed signal of thickening and thinning occurred (Fig. 10f), consistent with a slight advance at the centre of the terminus after 1995. After 1988 the tongue began to thin substantially at a rate of −1 m yr−1, becoming even more negative with m yr−1 after 2005 (see Fig. S6 for exact values of all periods). Since 1879, the average thinning over the ablation area has been 104.7 ±0.05 m (∼0.76 m yr−1), with maximum values of >190 m in the area of the terminus position in 2017, i.e. the former central part of the tongue. Before 1946, surface lowering was greatest near the terminus (Fig. 10a–d), whereas later it became more heterogeneous throughout the tongue, particularly since 2001. Locally, surface lowering was most pronounced in ice-cliff areas and in the debris-free upper regions (panels f, h, i in Fig. 10).
The relation between surface elevation change and surface elevation has strongly shifted over time (Fig. 11). During the periods from 1879 to 1988 thinning was stronger in lower elevations, with an almost stable surface above 2500 m in the period of 1977–1988. After 1988 the thinning has in general become stronger but also more homogeneous along the glacier tongue.
5.1 Method suitability and shortcomings
The DTMs used for calculating mass balance and surface elevation changes have uncertainties of ∼1–2 m (i.e. ±0.2–0.4 m yr−1; Table 1), which are derived as the standard deviation over stable terrain and therefore represent the upper bound of the uncertainty (Magnússon et al., 2016). Except for the periods 1879–1946 and 1977–1988, these uncertainties are significantly lower than the glacier changes and thus have little impact on the final decadal elevation change rates. High elevation change values outside of the glacier surface are found in very steep terrain and in the immediate forefield, and in the latter case stem from artefacts on water surfaces (e.g. Fig. 10e), or the activities of a gravel mining company (e.g. Fig. 10g, h, i), and do not affect the results on glacier elevation change.
The time series of glacier surface flow velocities along the lowest ∼4 km is over 50 years long (1961–2017) and includes periods of glacier acceleration and deceleration. Even though it covers less than half of the total study period, it is one of the longest time series of a debris-covered glacier, comparable to the velocity series from Glacier de Tsarmine from 1967 to 2005 (Capt et al., 2016). Despite difficulties in tracking boulders in more active areas on Zmuttgletscher due to large displacements (long periods between image dates) and crevasses (e.g. massive increase in crevasses in 1980s), several representative data points could be extracted per glacier subsection and time period, which provide a clear picture of the dynamic evolution of the entire glacier tongue since 1961. Unfortunately, the time period 1946–1961 yielded too few data points (due to image quality and snow cover) and had to be excluded from the time series. In the lowest areas the velocity field derived from the 2016–2017 orthophotos (Fig. S14) shows slightly higher values than the interferometer (e.g. 4±0.25 m vs. 1±0.57 m yr−1) and a reduced extent in low flow, but confirms the stagnation of the lower tongue. This difference can be attributed to the short duration and time of observation in late summer, when flow velocities are likely below the annual average due to the establishment of an effective basal drainage system (e.g. Nienow et al., 1998).
The uncertainty of the mapped debris extent is equal to that of the glacier and ice-cliff mapping at pixel. For 1961, the debris cover extent might be slightly underestimated as the orthophoto does not fully cover the ablation area and a thin snow-cover was present in higher areas. This could partly explain the slight reduction in debris extent from 1946 (3.98±0.01 km2) to 1961 (3.79±0.01 km2).
The automatic detection of ice cliffs using topographic and geometric variables as applied by others (e.g. Brun et al., 2016; Kraaijenbrink et al., 2016) showed no satisfying results. Many steep areas (>40∘) were incorrectly identified as debris-covered, and slope values extracted over ice cliffs were often below those typically observed in situ elsewhere (e.g. Reid and Brock, 2014). Our object-based mapping approach is efficient to map larger numbers of cliffs for several orthophotos. However, the polygons are based on a somewhat subjective choice of separation parameters and the manual correction of the polygons is time-consuming. When considering image quality (texture, contrast, snow cover, cast shadow) the results include both omission and commission errors, which also lie in the range of pixel along the polygon margins.
5.2 Chronological evolution and process interactions
On the basis of their dynamic behaviour we distinguish four distinct phases over the entire observation period since 1879. In the first phase, between 1879 and 1977, as a response to the atmospheric warming in the mid-19th century, the mass balance of Zmuttgletscher turned negative (Fig. 3), first only slightly (1879–1946: m. w.e. yr−1), then more strongly (1946–1977: m. w.e. yr−1), leading to glacier thinning and retreat. At the same time, the debris-covered area increased from 2.75±0.2 km2 in 1859 to 3.67±0.01 km2 in 1961. Rising air temperatures are probably the main reason for the increasing debris extent as they lead to a rise of the rain–snow transition altitude as well as higher ice ablation. Therefore, debris emergence accelerates and moves further up-glacier (Stokes et al., 2007). Decreasing ice flow further supports the development of a continuous debris cover of substantial thickness as the emerging debris is evacuated more slowly, and the debris has more time to melt out and thicken (Kirkbride and Deline, 2013). In the mid-20th century, a continuous debris cover existed on the lower part of the tongue, likely already responsible for a flattening of the mass balance gradient. Ice cliffs and supraglacial meltwater channels already existed in the lowest, debris-covered part of Zmuttgletscher in 1930 (Fig. S17) and thereafter increased in area until 1977. These surface features are partly responsible for increased thinning in these areas close to the terminus compared to further up-glacier.
In a second phase between 1977 and 1988, atmospheric cooling and increased precipitation brought a shift towards less negative mass balance ( m w.e. yr−1, Fig. 3). This is reflected in a partial thickening of the tongue (Fig. 10d, e) as well as in increased flow velocities (Figs. 8, 12b). At the same time, the upper boundary of debris cover in these areas migrated slightly down-glacier (Fig. 12a), but because the debris cover continued to expand in other areas, the total debris-covered area was roughly stable during this period. The upper boundary of the zone with most ice cliffs was also moved down-glacier during this period and the total area of ice cliffs dropped by a factor of 2 (Table 3). The adjustment of the glacier length and area was less direct, but the retreat and area loss gradually slowed down.
In the third phase between 1988 and 2001 the mass balance became more negative again – along with an abrupt rise in air temperature (Fig. 3a, b) – and flow velocity reductions were pervasive across the glacier tongue, first higher up, then also in the lowest regions (Figs. 8, 12b). The debris-covered area substantially increased – especially during the 1990s – while the glacier area was stable and the central part of the terminus even advanced for some metres, leaving behind a small moraine (Fig. S18). The delayed response to the preceding period with less negative mass balance is, however, still detectable in the slight elevation gain right at the terminus in the period 1995–2001, whereas it was already highly negative on the rest of the tongue (Fig. 10f).
In the most recent period (2001 to 2017), the glacier has continued to develop a more negative mass balance (approx. −0.8 to −1.0 m w.e. yr−1). Thinning has been most pronounced in debris-free areas – especially on the tongue of Stockjigletscher – and in the ice-cliff zone, and rates remained high (>1 m yr−1) across the tongue. Towards the terminus these thinning rates are, however, not comparable to values typically observed on debris-free glacier tongues at similar elevations (e.g Findelgletscher: >5 m yr−1; Sold et al., 2016), which might explain the relatively small length and area changes given the high overall mass loss (Figs. 3, 4). Flow velocities have continuously decreased after 1988, and since ∼2001 the lowest 1.5 km of the tongue has become almost stagnant (mostly below 3 m yr−1).
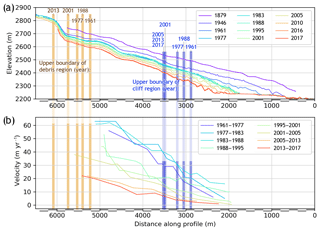
Figure 12(a) Central elevation profiles over the glacier tongue from the 19th century until 2017; the red line (2017) marks the former glacier bed from 0 to ∼2000 m along the profile; the rugged lower part of the lines is shaped by ice cliffs and flow channels. (b) Surface flow velocities from the 1960s until 2017 along the same profile; velocities were highest during the positive mass balance period in the 1970s and 1980s; the lowest part of the tongue is almost stagnant (2017). Vertical brown and blue bars show the upper boundaries of the debris-covered area and the ice-cliff zone, respectively; both boundaries have interrupted their up-glacier trend between 1977 and 1988.
5.3 Unprecedented debris cover increase
Zmuttgletscher's debris extent has increased by ∼19 % points since the end of the LIA without evidence of particularly large rock falls. Here the headwalls surrounding the accumulation area are the most relevant input sources, but lateral moraines also have a minor influence in marginal areas (van Woerkom et al., 2019). Increases in debris cover extent (for periods from several years to decades) have been shown for other Alpine glaciers (Deline, 2005; Kellerer-Pirklbauer et al., 2008), the Caucasus (Stokes et al., 2007), and the Himalayas (Bolch et al., 2008a; Bhambri et al., 2011), but have so far not been quantified for a century-long period. These studies found debris cover extent increases of 2 %–10 % points for glaciers with absolute debris cover extents of 2 %–42 %, which is well below the rates we found for Zmuttgletscher, even on a decadal scale. At Zmuttgletscher we could also identify strong temporal variations in the rate of debris cover extent change (e.g. stable extent in 1970s and 1980s and high rates of change of >4 % points per decade in the 1990s and early 2000s), which coincide with distinct changes in climate and related dynamic responses. This strong link to climate may also help to explain the strong debris cover extent increase on Zmuttgletscher, which we suggest is the result of (i) a combined effect of elevated temperatures and decreasing velocities, (ii) the large debris-free ablation area that still existed a few decades ago, and likely also the (iii) the comparatively small glacier size, i.e. the shorter response time.
5.4 The influence of debris cover on geometry
To understand the potential long-term effects of a debris cover on glacier evolution, regional comparisons provide a useful context. Nevertheless, one has to be careful in comparing length and area changes of glaciers for a given climate history because of differences in geometry and hence response times (Jóhannesson et al., 1989). The retreat of Zmuttgletscher is relatively modest compared to that of other large Swiss glaciers (Fig. 4) and it has shown little terminus fluctuation, even during the climatically favourable period in the 1970s and 1980s. Other glaciers with similarly subdued fluctuations are Unteraargletscher and Glacier de Zinal, which are also debris covered in their lower reaches. Unlike smaller and debris-free glaciers, neither Unteraargletscher nor Glacier de Zinal advanced in the 1980s and 1990s (Fig. 4). Aletschgletscher (>80 km2) is too large and thick to react to short periods of positive mass balance and shows a smooth and accelerating long-term retreat trend since the end of the LIA (i.e. −24 m yr−1; GLAMOS, 2018). Conversely, Findelgletscher, a nearby debris-free glacier of similar size, thickness, and elevation range as Zmuttgletscher, showed much stronger fluctuations in length and mass balance. Findelgletscher experienced periods of balanced and even positive mass balances, accompanied by a sharp terminus advance in the 1980s (+41 m yr−1), followed by a strong retreat since 1985 (−44 m yr−1). During these recent periods of strongly negative mass balance, the retreat rate at Zmuttgletscher ( m yr−1) was lower than that of all other glaciers in Fig. 4.
Area changes from the beginning of the 1970s until ∼2012 reveal that Zmuttgletscher has lost 7 % of its area (−0.17 % yr−1), which is comparatively low (Table S1). In comparison, Findelgletscher has lost more than 11 % of its area (−0.32 % yr−1) during a similar period. Thus, in terms of length and area changes, Zmuttgletscher shows a distinctly subdued and delayed response to climatic perturbations compared to debris-free glaciers in the region.
The relatively uniform and reduced thinning over much of Zmuttgletscher's tongue can be attributed to the debris cover and is observed at several debris-covered glaciers in Switzerland. This suppression of thinning by debris cover on the lower ablation area is best illustrated when plotting the elevation change for one period (1980–2010) for 11 larger Swiss glaciers along 10 vertical elevation bins of equal size (Fig. 13). For all debris-covered glaciers, including Zmuttgletscher, the thinning becomes almost independent of elevation for the lower elevation bins, whereas for debris-free glaciers, it continues to increase towards the terminus. The non-linear relationship between thinning and elevation causes the slower adaptation of debris-covered glacier length and area and hence more extended tongues. A similar flattening or even reversal of the elevation change gradient towards debris-covered glacier termini has also been observed in other regions, e.g. in the central Himalayas (Inoue, 1977; Bolch et al., 2008a; Benn et al., 2012; Ye et al., 2015; Ragettli et al., 2016) and the Tien Shan (Pieczonka and Bolch, 2015).
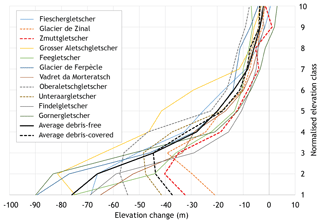
Figure 13Elevation change between 1980 and 2010 against normalised elevation for a selection of Swiss glaciers. Solid lines: mostly debris-free glaciers; dashed lines: debris-covered glaciers. Data from Fischer et al. (2015). The lowest section of Aletschgletscher (yellow line) is actually also slightly debris covered.
5.5 Climate-driven glacier mass balance and flow dynamics
The evolution of glacier-wide mass balance of Zmuttgletscher since 1879 is comparable to centennial trends in other debris-free glaciers in the Swiss Alps, which are closely related to variations in climate (Fig. 3; Schmidli, 2000; Bauder et al., 2007; Huss et al., 2010; Hirschi et al., 2013; World Glacier Monitoring Service, 2017). For Zmuttgletscher, the strong connection of mass balance to climate is exemplified by the almost balanced conditions during colder phases before 1920 and in the 1970s and 1980s as well as by the strongly negative mass balance in the 1940s and 1950s and in recent decades (Fig. 3; Bauder et al., 2007; Escher-Vetter et al., 2009). This clearly demonstrates that the glacier-wide mass balance of Zmuttgletscher has foremost been governed by climatic changes and has not been strongly influenced by debris cover and changes thereof. This is in contrast to the case of Glacier de Miage in Italy, for which Thomson et al. (2000) related the positive mass balance on the tongue over the 20th century partly to debris cover. The debris cover of Glacier de Miage is, however, thicker than at Zmuttgletscher.
The relatively thin debris at Zmuttgletscher may on the one hand limit the decoupling from climatic influences, and on the other hand still be sufficient to reduce glacier thinning and terminus retreat. This results in an extended and stagnating glacier tongue that increases the area of ablation (relative to a debris-free glacier tongue), which in turn enhances the sensitivity of the glacier-wide mass balance to climatic changes.
The observed temporal variations in ice flow and thickness on the main glacier tongue of Zmuttgletscher also closely reflect variations in climate as exemplified by the acceleration and thickening in the period of more positive mass balance in the 1970s and 1980s. Positive mass balances impacting flow velocities were also observed at debris-covered Glacier de Tsarmine (Capt et al., 2016) and a number of other debris-free glaciers in Switzerland (Glacier de Giétro, Glacier de Corbassière, Mattmark; Bauder, 2017), Austria (Hintereisferner, Kesselwandferner; Stocker-Waldhuber et al., 2018), and France (Glacier d' Argentière; Vincent et al., 2009). Also at Glacier de Miage, a kinematic wave migrating down-glacier was observed between the 1960s and 1980s that led to a small terminus advance in the late 1980s (Thomson et al., 2000). Also the long-term (1960s until 2017) reduction in flow velocities on the tongue of Zmuttgletscher is in line with observations from all of the above-mentioned glaciers.
All these examples show a direct reaction of flow velocities and hence ice flux to climatic changes. This link is consistent with the principle of mass conservation, regardless of debris coverage, but breaks down when the glacier tongue starts to stagnate as a result of the debris cover slowing down the retreat. Such a dynamical stagnation and decoupling has in the last decade also been observed at the tongue of Zmuttgletscher and is characteristic of strongly debris-covered glaciers (e.g. Bolch et al., 2012).
On large debris-covered glaciers, lower flow velocities are often the result of a decreased driving stress due to flat tongues that result from a sustained reversal of the mass balance gradient (Bolch et al., 2008a; Anderson and Anderson, 2016). At Zmuttgletscher, the elevation change gradient has indeed decreased to almost zero during recent decades. Nevertheless, the glacier surface slope has slightly increased over time; therefore we attribute the decrease in dynamic activity to the reduction in ice thickness and, hence, mass flux and climate. This conclusion is coherent with findings by Dehecq et al. (2019) from glaciers in south and central Asia.

Figure 14Examples of superficial and englacial ablation and their consequences. (a) Meander of a large supraglacial water channel with confining, under-cut ice cliff. (b) Almost circular surface lowering as a consequence of en- and subglacial ablation. (c) Subglacial water flow channel. (d) Supraglacial pond and ambient cliffs.
5.6 The role of debris-related surface features
Whilst the presence of a debris mantle may not substantially influence the overall mass loss rate of Zmuttgletscher, we find that the main reason for the observed heterogeneous thinning pattern is the increasingly extensive and also likely thicker debris cover that is heterogeneously distributed over the tongue. The heterogeneity is further increased by the presence of ice cliffs. Field visits and patterns of surface lowering suggest a close association between ice-cliff formation and the presence of supraglacial meltwater channels. Surface meltwater often runs off superficially over substantial distances and water flow channels are abundant all over the glacier tongue outside of crevassed areas. Inside and alongside these channels bare ice becomes exposed when water washes away the debris or laterally cuts into the ice (Fig. 14a) and the debris slides off the oversteepened channel walls. The location of supraglacial meltwater channels on Zmuttgletscher seems closely related to areas of compressional flow – in flat and stagnating areas – and has been most pronounced in the lowest ∼1.5 km, where most ice cliffs also occur. This is consistent with the cessation in up-glacier migration of the ice-cliff boundary in 2005, just below a step in the surface with extensional flow (Fig. 12a at a profile distance ∼3500 m). Ice cliffs also develop when en- and subglacial voids collapse and the shear planes of the fractured ice become exposed as also observed at Zmuttgletscher (Fig. 14b). We suggest that englacial ablation is effectively creating and enlarging such voids (Benn et al., 2012; Immerzeel et al., 2014; Fischer, 2011; Fig. 14c). Supraglacial ponds are known to have a high potential to increase ablation (Sakai et al., 2000; Röhl, 2008; Miles et al., 2016) and are also potential origins of ice cliffs (Fig. 14d) but these features are not prevalent on Zmuttgletscher.
Large ice cliffs also exist at the terminus and are responsible for exacerbated retreat compared to where the terminus is gently sloping and debris mantled. The situation of a terminal cliff at the glacier mouth combined with terminus retreat is also found at Gangotri glacier for example (Bhambri et al., 2012; Bhattacharya et al., 2016), whereas some glaciers with a stable terminus (e.g. Khumbu, Miage) do not show such terminal cliffs (Bolch et al., 2008a; Diolaiuti et al., 2009). Remarkably, depressions and irregular surface topography near the terminus were already indicated in the Siegfried map from 1879. Certain ice cliffs on Zmuttgletscher have reached >25 m in height and have persisted for over 2 decades. The consequences of ice cliffs at Zmuttgletscher are (i) a more chaotic pattern of surface elevation changes due strong local ablation, (ii) debris redistribution through cliff backwasting and fluvial transport, (iii) and stronger surface elevation changes at the lower part of the tongue (especially downstream of topographic steps). As a result, the elevation change is still stronger towards the terminus than without ice cliffs.
The strong expansion of debris cover might suggest a high and increasing importance of ice cliffs. However, we found that ice cliffs are only responsible for approximately 5 % of glacier-wide volume loss because (i) their total area is small (Table 3; also compared to other glaciers: e.g. Sakai et al., 2000; Juen et al., 2014; Ragettli et al., 2016) and (ii) the debris is relatively thin on Zmuttgletscher.
5.7 Dynamic interaction between flow velocities, debris cover, and ice cliffs
Even though high flow velocities may be expected to subdue the emergence of ice cliffs, we could not find a clear velocity threshold linked to their occurrence, e.g. to designate areas of potential ice-cliff formation. However, the upper boundary of the ice-cliff zone was moved downstream by increased flow velocities in the 1970s and 1980s (Fig. 12). Further, during this period the total ice-cliff area was clearly reduced compared to both periods with lower flow speeds before and after (Table 3). This suggests a clear link between dynamic state and the occurrence of ice cliffs and would imply expanding ice-cliff areas on stagnating tongues, consistent with the general interpretation of observations (e.g. Pellicciotti et al., 2015).
Increased flow velocities also led to a local down-glacier movement of the upper boundary of the debris extent (Fig. 12). Similarly, Deline (2005) documented a decrease in debris-covered area for Glacier de Miage between ∼1890 and ∼1920, caused by an increase in surface elevation and flow velocity (Thomson et al., 2000), which confirms that changes in glacier dynamics can directly impact supraglacial debris extent.
This study presents a >150-year-long reconstruction of the geometry, surface topography, and debris cover of Zmuttgletscher, as well as observations of surface flow velocities over 5 decades. We observed the strongest debris cover extent increase on record, from 12.9±0.9 % of the total glacier surface in 1859 to 31.8±0.06 % in 2013. The heterogeneous debris thickness distribution reduces ablation from 15 % to 80 % (compared to bare ice) over large parts of the debris-covered area, causing persistent debris-related thinning patterns. Even though this debris cover is relatively thin (mostly ∼15 cm), it has efficiently attenuated and delayed the response to climatic changes in terms of glacier length and area adjustment compared to debris-free glaciers in the Alps, during periods of both mass gain and mass loss. Hence, elevation change has become (almost) independent from elevation. Despite the expansive debris cover, our observations demonstrate that the evolution of Zmuttgletscher has been mainly driven by climatic changes, on both decadal and centennial timescales. Glacier-wide mass balances are throughout the last century comparable to other debris-covered but also debris-free Swiss glaciers, corroborating a direct link to climate. The prevalence of localised ablative processes such as ice-cliff expansion caused surface elevation change in otherwise heavily debris-covered areas, which leads to increased ice loss in the lowest glacier parts, thereby preventing a reversal of the elevation change gradient.
In general, flow velocities have strongly decreased in the last 2 decades similar to other glaciers in the Alps, and the lower 1.5 km of the tongue is almost stagnant (2017), even though the glacier tongue has slightly steepened over time. The low flow velocities are due to thinning and reduced ice flux, and to a minor degree influenced by debris cover. Higher flow velocities between 1977 and 1988 were triggered by a more positive surface mass balance and the related increased mass flux from the accumulation area, which also caused local glacier thickening. This increase led to a slight down-glacier migration of the debris cover boundary, followed by a strong debris cover increase when velocities dropped in the 1990s and rising air temperature led to increasingly negative mass balance. Higher flow velocities also moved the upper boundary of the ice-cliff zone down-glacier, temporarily reduced the ice-cliff area, and eventually led to a slight advance in the 1990s.
These findings suggest a clear and direct influence of flow dynamics on debris extent and ice-cliff formation. The above-described processes and feedbacks are likely valid and relevant for other debris-covered glaciers in the Alps and elsewhere at potentially different rates and magnitudes. In the context of global warming, it is therefore crucial to include these findings in models for glacier projections.
Most datasets derived in this study are under the educational license and any third-party transfer is restricted. The original stereo images and historic maps can be purchased from SwissTopo (https://shop.swisstopo.admin.ch/en/products/images/aerial_images/aerial_images_digital, last access: 10 July 2019). Long-term temperature measurements can be acquired from MeteoSwiss (https://shop.meteoswiss.ch/index.html, last access: 10 July 2019). Flow velocities from feature tracking and radar interferometry as well as ablation and debris thickness measurements and DTMs and orthophotos from 2016 and 2017 will be made available on PANGAEA.
The supplement related to this article is available online at: https://doi.org/10.5194/tc-13-1889-2019-supplement.
NM, TB, and AV designed the study. NM generated the DTMs and Orthophotos and performed all analysis. AW performed radar measurements and processing and provided the respective text section. NM wrote the draft of the paper. All authors contributed to the final version of the paper.
The authors declare that they have no conflict of interest.
The study profited from the effort of a number of fieldworkers: Alessandro Cicoira, Philipp Rastner, Martin Schulthess, James Ferguson, Jan Beutel, Rémy Mercenier, Johann Junghardt, Luisa von Albedyll, and Florentin Brendler. Additionally, Rahel Ganarin conducted and supported the comprehensive debris thickness measurements. Mauro Fischer and Horst Machguth provided the much appreciated elevation change dataset of all Swiss glaciers. We thank Owen King for proofreading a previous version of the paper. A special thank you goes to the 3G group for the constructive discussions. We are grateful for the long-term homogenised temperature data series provided by MeteoSwiss. Finally, we acknowledge the thorough, stimulating, and fast reviews by David Rounce and Philip Kraaijenbrink and the additional comments by the scientific editor, which were of great help when revising the paper and have significantly improved its quality.
This research has been supported by the Swiss National Science Foundation “Understanding and quantifying the transient dynamics and evolution of debris-covered glaciers” (grant no. 200021_169775).
This paper was edited by Etienne Berthier and reviewed by David Rounce and Philip Kraaijenbrink.
Agisoft LLC: PhotoScan, Agisoft, Software: version 1.2, 2016.
Anderson, L. S. and Anderson, R. S.: Modeling debris-covered glaciers: response to steady debris deposition, The Cryosphere, 10, 1105–1124, https://doi.org/10.5194/tc-10-1105-2016, 2016.
Anderson, L. S. and Anderson, R. S.: Debris thickness patterns on debris-covered glaciers, Geomorphology, 311, 1–12, https://doi.org/10.1016/j.geomorph.2018.03.014, 2018.
Bajracharya, S. R., Maharjan, S. B., Shrestha, F., Guo, W., Liu, S., Immerzeel, W., and Shrestha, B.: The glaciers of the Hindu Kush Himalayas: Current status and observed changes from the 1980s to 2010, Int. J. Water Resour. D., 31, 161–173, https://doi.org/10.1080/07900627.2015.1005731, 2015.
Banerjee, A.: Brief communication: Thinning of debris-covered and debris-free glaciers in a warming climate, The Cryosphere, 11, 133–138, https://doi.org/10.5194/tc-11-133-2017, 2017.
Banerjee, A. and Shankar, R.: On the response of Himalayan glaciers to climate change, J. Glaciol., 59, 480–490, https://doi.org/10.3189/2013JoG12J130, 2013.
Bauder, A. (Ed.): The Swiss Glaciers: 2013/14 and 2014/15, Glaciological Report, 135/136, Cryospheric Commission of the Swiss Acadamey of Sciences, Zürich, Switzerland, 2017.
Bauder, A., Funk, M., and Huss, M.: Ice-volume changes of selected glaciers in the Swiss Alps since the end of the 19th century, Ann. Glaciol., 46, 145–149, https://doi.org/10.3189/172756407782871701, 2007.
Benn, D. I. and Lehmkuhl, F.: Mass balance and equilibrium-line altitudes of glaciers in high-mountain environments, Quatern. Int., 65–66, 15–29, https://doi.org/10.1016/S1040-6182(99)00034-8, 2000.
Benn, D. I., Bolch, T., Hands, K., Gulley, J., Luckman, A., Nicholson, L. I., Quincey, D., Thompson, S., Toumi, R., and Wiseman, S.: Response of debris-covered glaciers in the Mount Everest region to recent warming, and implications for outburst flood hazards, Earth-Sci. Rev., 114, 156–174, https://doi.org/10.1016/j.earscirev.2012.03.008, 2012.
Bhambri, R., Bolch, T., Chaujar, R. K., and Kulshreshtha, S. C.: Glacier changes in the Garhwal Himalaya, India, from 1968 to 2006 based on remote sensing, J. Glaciol., 57, 543–556, https://doi.org/10.3189/002214311796905604, 2011.
Bhambri, R., Bolch, T., and Chaujar, R. K.: Frontal recession of Gangotri Glacier, Garhwal Himalayas, from 1965 to 2006, measured through high-resolution remote sensing data, Curr. Sci., 102, 489–494, https://doi.org/10.5167/uzh-59630, 2012.
Bhattacharya, A., Bolch, T., Mukherjee, K., Pieczonka, T., Kropáček, J. A. N., and Buchroithner, M. F.: Overall recession and mass budget of Gangotri Glacier, Garhwal Himalayas, from 1965 to 2015 using remote sensing data, J. Glaciol., 62, 1115–1133, https://doi.org/10.1017/jog.2016.96, 2016.
Bolch, T., Buchroithner, M., Pieczonka, T., and Kunert, A.: Planimetric and volumetric glacier changes in the Khumbu Himal, Nepal, since 1962 using Corona, Landsat TM and ASTER data, J. Glaciol., 54, 592–600, https://doi.org/10.3189/002214308786570782, 2008a.
Bolch, T., Buchroithner, M. F., Peters, J., Baessler, M., and Bajracharya, S.: Identification of glacier motion and potentially dangerous glacial lakes in the Mt. Everest region/Nepal using spaceborne imagery, Nat. Hazards Earth Syst. Sci., 8, 1329–1340, https://doi.org/10.5194/nhess-8-1329-2008, 2008b.
Bolch, T., Menounos, B., and Wheate, R.: Landsat-based inventory of glaciers in western Canada, 1985–2005, Remote Sens. Environ., 114, 127–137, https://doi.org/10.1016/j.rse.2009.08.015, 2010.
Bolch, T., Kulkarni, A., Kääb, A., Huggel, C., Paul, F., Cogley, J. G., Frey, H., Kargel, J. S., Fujita, K., Scheel, M., Bajracharya, S., and Stoffel, M.: The state and fate of Himalayan glaciers, Science, 336, 310–314, https://doi.org/10.1126/science.1215828, 2012.
Brock, B., Rivera, A., Casassa, G., Bown, F., and Acuña, C.: The surface energy balance of an active ice-covered volcano: Villarrica Volcano, southern Chile, Ann. Glaciol., 45, 104–114, https://doi.org/10.3189/172756407782282372, 2007.
Brun, F., Buri, P., Miles, E. S., Wagnon, P., Steiner, J., Berthier, E., Ragettli, S., Kraaijenbrink, P., Immerzeel, W. W., and Pellicciotti, F.: Quantifying volume loss from ice cliffs on debris-covered glaciers using high-resolution terrestrial and aerial photogrammetry, J. Glaciol., 62, 684–695, https://doi.org/10.1017/jog.2016.54, 2016.
Brun, F., Wagnon, P., Berthier, E., Shea, J. M., Immerzeel, W. W., Kraaijenbrink, P. D. A., Vincent, C., Reverchon, C., Shrestha, D., and Arnaud, Y.: Ice cliff contribution to the tongue-wide ablation of Changri Nup Glacier, Nepal, central Himalaya, The Cryosphere, 12, 3439–3457, https://doi.org/10.5194/tc-12-3439-2018, 2018.
Buri, P., Pellicciotti, F., Steiner, J. F., Miles, E. S., and Immerzeel, W. W.: A grid-based model of backwasting of supraglacial ice cliffs on debris-covered glaciers, Ann. Glaciol., 57, 199–211, https://doi.org/10.3189/2016AoG71A059, 2016.
Caduff, R., Schlunegger, F., Kos, A., and Wiesmann, A.: A review of terrestrial radar interferometry for measuring surface change in the geosciences, Earth Surf. Proc. Land., 40, 208–228, https://doi.org/10.1002/esp.3656, 2015.
Capt, M., Bosson, J.-B., Fischer, M., Micheletti, N., and Lambiel, C.: Decadal evolution of a very small heavily debris-covered glacier in an Alpine permafrost environment, J. Glaciol., 62, 535–551, https://doi.org/10.1017/jog.2016.56, 2016.
Carturan, L., Filippi, R., Seppi, R., Gabrielli, P., Notarnicola, C., Bertoldi, L., Paul, F., Rastner, P., Cazorzi, F., Dinale, R., and Dalla Fontana, G.: Area and volume loss of the glaciers in the Ortles-Cevedale group (Eastern Italian Alps): controls and imbalance of the remaining glaciers, The Cryosphere, 7, 1339–1359, https://doi.org/10.5194/tc-7-1339-2013, 2013.
Cogley, J. G.: Present and future states of Himalaya and Karakoram glaciers, Ann. Glaciol., 52, 69–73, https://doi.org/10.3189/172756411799096277, 2011.
Conrad, O., Bechtel, B., Bock, M., Dietrich, H., Fischer, E., Gerlitz, L., Wehberg, J., Wichmann, V., and Böhner, J.: System for Automated Geoscientific Analyses (SAGA) v. 2.1.4, Geosci. Model Dev., 8, 1991–2007, https://doi.org/10.5194/gmd-8-1991-2015, 2015.
D'Agata, C. and Zanutta, A.: Reconstruction of the recent changes of a debris-covered glacier (Brenva Glacier, Mont Blanc Massif, Italy) using indirect sources: Methods, results and validation, Global Planet. Change, 56, 57–68, https://doi.org/10.1016/j.gloplacha.2006.07.021, 2007.
Dehecq, A., Gourmelen, N., Gardner, A. S., Brun, F., Goldberg, D., Nienow, P. W., Berthier, E., Vincent, C., Wagnon, P., and Trouvé, E.: Twenty-first century glacier slowdown driven by mass loss in High Mountain Asia, Nat. Geosci., 12, 22–27, https://doi.org/10.1038/s41561-018-0271-9, 2019.
Deline, P.: Change in surface debris cover on Mont Blanc massif glaciers after the “Little Ice Age” termination, Holocene, 15, 302–309, https://doi.org/10.1191/0959683605hl809rr, 2005.
Diolaiuti, G., D'Agata, C., Meazza, A., Zanutta, A., and Smiraglia, C.: Recent (1975–2003) changes in the Miage debris-covered glacier tongue (Mont Blanc, Italy) from analysis of aerial photos and maps, Geogr. Fis. Dinam. Quat., 32, 117–127, 2009.
Dobhal, D. P., Mehta, M., and Srivastava, D.: Influence of debris cover on terminus retreat and mass changes of Chorabari Glacier, Garhwal region, central Himalaya, India, J. Glaciol., 59, 961–971, https://doi.org/10.3189/2013JoG12J180, 2013.
eCognition Essentials 1.3: Trimble Germany GmbH, 2016.
Escher-Vetter, H., Kuhn, M., and Weber, M.: Four decades of winter mass balance of Vernagtferner and Hintereisferner, Austria: Methodology and results, Ann. Glaciol., 50, 87–95, https://doi.org/10.3189/172756409787769672, 2009.
Fahnestock, M. A., Scambos, T. A., and Bindschadler, R. A.: Semi-automated ice velocity determination from satellite imagery, Eos, 73, 493, 1992.
Fischer, A.: Comparison of direct and geodetic mass balances on a multi-annual time scale, The Cryosphere, 5, 107–124, https://doi.org/10.5194/tc-5-107-2011, 2011.
Fischer, M., Huss, M., and Hoelzle, M.: Surface elevation and mass changes of all Swiss glaciers 1980–2010, The Cryosphere, 9, 525–540, https://doi.org/10.5194/tc-9-525-2015, 2015.
Füllemann, C., Begert, M., Croci-Maspoli, M., and Brönnimann, S.: Digitalisieren und Homogenisieren von historischen Klimadaten des Swiss NBCN – Resultate aus DigiHom, Arbeitsberichte der MeteoSchweiz, 236, 48 pp., 2011.
Gardelle, J., Berthier, E., and Arnaud, Y.: Slight mass gain of Karakoram glaciers in the early twenty-first century, Nat. Geosci., 5, 322–325, https://doi.org/10.1038/NGEO1450, 2012.
Gibson, M. J., Glasser, N. F., Quincey, D. J., Rowan, A. V., and Irvine-Fynn, T. D.: Changes in glacier surface cover on Baltoro glacier, Karakoram, north Pakistan, 2001–2012, J. Maps, 13, 100–108, https://doi.org/10.1080/17445647.2016.1264319, 2017.
GLAMOS: Swiss glacier monitoring network – Length variation, available at: http://swiss-glaciers.glaciology.ethz.ch/index.html, last access: 7 December 2018.
Graf, J. H.: Die schweizerische Landesvermessung 1832–1864: Geschichte der Dufourkarte, https://doi.org/10.3931/e-rara-41134, 1896.
Granshaw, F. D. and Fountain, A.: Glacier change (1958–1998) in the North Cascades National Park Complex, Washington, USA, J. Glaciol., 52, 251–256, https://doi.org/10.3189/172756506781828782, 2006.
Hall, D. K., Bayr, K. J., Schöner, W., Bindschadler, R. A., and Chien, J. Y. L.: Consideration of the errors inherent in mapping historical glacier positions in Austria from the ground and space (1893–2001), Remote Sens. Environ., 86, 566–577, https://doi.org/10.1016/S0034-4257(03)00134-2, 2003.
Hambrey, M. J., Quincey, D. J., Glasser, N. F., Reynolds, J. M., Richardson, S. J., and Clemmens, S.: Sedimentological, geomorphological and dynamic context of debris-mantled glaciers, Mount Everest (Sagarmatha) region, Nepal, Quaternary Sci. Rev., 27, 2361–2389, https://doi.org/10.1016/j.quascirev.2008.08.010, 2008.
Hirschi, E., Auchmann, R., Martius, O., and Brönnimann, S.: The 1945–1949 droughts in Switzerland, in: Weather extremes during the past 140 years, edited by: Brönnimann, S. and Martius, O., Geographica Bernensia, G89, Bern, 81–90, 2013.
Huss, M.: Density assumptions for converting geodetic glacier volume change to mass change, The Cryosphere, 7, 877–887, https://doi.org/10.5194/tc-7-877-2013, 2013.
Huss, M., Hock, R., Bauder, A., and Funk, M.: 100-year mass changes in the Swiss Alps linked to the Atlantic Multidecadal Oscillation, Geophys. Res. Lett., 37, L10501, https://doi.org/10.1029/2010GL042616, 2010.
Immerzeel, W. W., Kraaijenbrink, P. D. A., Shea, J. M., Shrestha, A. B., Pellicciotti, F., Bierkens, M. F. P., and de Jong, S. M.: High-resolution monitoring of Himalayan glacier dynamics using unmanned aerial vehicles, Remote Sens. Environ., 150, 93–103, https://doi.org/10.1016/j.rse.2014.04.025, 2014.
Inoue, J.: Mass Budget of Khumbu Glacier, Journal of the Japanese Society of Snow and Ice, 39, 15–19, https://doi.org/10.5331/seppyo.39.Special_15, 1977.
Jóhannesson, T., Raymond, C., and Waddington, E.: Time–Scale for Adjustment of Glaciers to Changes in Mass Balance, J. Glaciol., 35, 355–369, https://doi.org/10.3189/S002214300000928X, 1989.
Jouvet, G., Huss, M., Funk, M., and Blatter, H.: Modelling the retreat of Grosser Aletschgletscher, Switzerland, in a changing climate, J. Glaciol., 57, 1033–1045, https://doi.org/10.3189/002214311798843359, 2011.
Juen, M., Mayer, C., Lambrecht, A., Han, H., and Liu, S.: Impact of varying debris cover thickness on ablation: a case study for Koxkar Glacier in the Tien Shan, The Cryosphere, 8, 377–386, https://doi.org/10.5194/tc-8-377-2014, 2014.
Kääb, A.: Combination of SRTM3 and repeat ASTER data for deriving alpine glacier flow velocities in the Bhutan Himalaya, Remote Sens. Environ., 94, 463–474, https://doi.org/10.1016/j.rse.2004.11.003, 2005.
Kääb, A.: Glacier Volume Changes Using ASTER Satellite Stereo and ICESat GLAS Laser Altimetry. A Test Study on EdgeØya, Eastern Svalbard, IEEE T. Geosci. Remote, 46, 2823–2830, https://doi.org/10.1109/TGRS.2008.2000627, 2008.
Kääb, A., Berthier, E., Nuth, C., Gardelle, J., and Arnaud, Y.: Contrasting patterns of early twenty-first-century glacier mass change in the Himalayas, Nature, 488, 495–498, https://doi.org/10.1038/nature11324, 2012.
Kellerer-Pirklbauer, A., Lieb, G. K., Avian, M., and Gspurning, J.: The response of partially debris-covered valley glaciers to climate change: The example of the pasterze glacier (austria) in the period 1964 to 2006, Geogr. Ann. A, 90, 269–285, https://doi.org/10.1111/j.1468-0459.2008.00345.x, 2008.
Kirkbride, M. P. and Deline, P.: The formation of supraglacial debris covers by primary dispersal from transverse englacial debris bands, Earth Surf. Proc. Land., 38, 1779–1792, https://doi.org/10.1002/esp.3416, 2013.
Koblet, T., Gärtner-Roer, I., Zemp, M., Jansson, P., Thee, P., Haeberli, W., and Holmlund, P.: Reanalysis of multi-temporal aerial images of Storglaciären, Sweden (1959–99) – Part 1: Determination of length, area, and volume changes, The Cryosphere, 4, 333–343, https://doi.org/10.5194/tc-4-333-2010, 2010.
Kohler, J., James, T. D., Murray, T., Nuth, C., Brandt, O., Barrand, N. E., Aas, H. F., and Luckman, A.: Acceleration in thinning rate on western Svalbard glaciers, Geophys. Res. Lett., 34, F04007, https://doi.org/10.1029/2007GL030681, 2007.
Kraaijenbrink, P. D. A., Shea, J. M., Pellicciotti, F., Jong, S. D., and Immerzeel, W. W.: Object-based analysis of unmanned aerial vehicle imagery to map and characterise surface features on a debris-covered glacier, Remote Sens. Environ., 186, 581–595, https://doi.org/10.1016/j.rse.2016.09.013, 2016.
Lamsal, D., Fujita, K., and Sakai, A.: Surface lowering of the debris-covered area of Kanchenjunga Glacier in the eastern Nepal Himalaya since 1975, as revealed by Hexagon KH-9 and ALOS satellite observations, The Cryosphere, 11, 2815–2827, https://doi.org/10.5194/tc-11-2815-2017, 2017.
Magnússon, E., Muñoz-Cobo Belart, J., Pálsson, F., Ágústsson, H., and Crochet, P.: Geodetic mass balance record with rigorous uncertainty estimates deduced from aerial photographs and lidar data – Case study from Drangajökull ice cap, NW Iceland, The Cryosphere, 10, 159–177, https://doi.org/10.5194/tc-10-159-2016, 2016.
Mattson, L. E., Gardner, J. S., and Young, G. J.: Ablation on Debris Covered Glaciers: an Example from the Rakhiot Glacier, Punjab, Himalaya, in: Kathmandu Symposium 1992 – Snow and Glacier Hydrology, edited by: Young, G. J., Kathmandu, 218, 289–296, 1993.
MeteoSwiss: Normwertkarte Niederschlag 1981–2010, MeteoSwiss, available at: https://www.meteoswiss.admin.ch/home/climate/swiss-climate-in-detail/climate-normals/norm-value-charts.html?filters=precip_8110_yy (last access: 10 July 2019), 2014.
Miles, E. S., Pellicciotti, F., Willis, I. C., Steiner, J. F., Buri, P., and Arnold, N. S.: Refined energy-balance modelling of a supraglacial pond, Langtang Khola, Nepal, Ann. Glaciol., 57, 29–40, https://doi.org/10.3189/2016AoG71A421, 2016.
Mölg, N. and Bolch, T.: Structure-from-Motion Using Historical Aerial Images to Analyse Changes in Glacier Surface Elevation, Remote Sensing, 9, 1021, https://doi.org/10.3390/rs9101021, 2017.
Nakawo, M., Iwata, S., Watanabe, O., and Yoshida, M.: Processes which Distribute Supraglacial Debris on the Khumbu Glacier, Nepal Himalaya, Ann. Glaciol., 8, 129–131, https://doi.org/10.3189/S0260305500001294, 1986.
Nakawo, M., Yabuki, H., and Sakai, A.: Characteristics of Khumbu Glacier, Nepal Himalaya: Recent change in the debris-covered area, Ann. Glaciol., 28, 118–122, https://doi.org/10.3189/172756499781821788, 1999.
National Snow and Ice Data Center: Glacier Photograph Collection, Version 1, NSIDC: National Snow and Ice Data Center, Boulder, Colorado, USA, https://doi.org/10.7265/N5/NSIDC-GPC-2009-12, 2002, updated 2015.
Nicholson, L. and Benn, D. I.: Calculating ice melt beneath a debris layer using meteorological data, J. Glaciol., 52, 463–470, https://doi.org/10.3189/172756506781828584, 2006.
Nienow, P., Sharp, M., and Willis, I.: Seasonal changes in the morphology of the subglacial drainage system, Haut Glacier d'Arolla, Switzerland, Earth Surf. Proc. Land., 23, 825–843, https://doi.org/10.1002/(SICI)1096-9837(199809)23:9<825::AID-ESP893>3.0.CO;2-2, 1998.
Nuimura, T., Fujita, K., Yamaguchi, S., and Sharma, R. R.: Elevation changes of glaciers revealed by multitemporal digital elevation models calibrated by GPS survey in the Khumbu region, Nepal Himalaya, 1992–2008, J. Glaciol., 58, 648–656, https://doi.org/10.3189/2012JoG11J061, 2012.
Nuth, C. and Kääb, A.: Co-registration and bias corrections of satellite elevation data sets for quantifying glacier thickness change, The Cryosphere, 5, 271–290, https://doi.org/10.5194/tc-5-271-2011, 2011.
Ogilvie, I. H.: The Effect of Superglacial Débris on the Advance and Retreat of Some Canadian Glaciers, J. Geol., 12, 722–743, 1904.
Östrem, G.: Ice Melting under a Thin Layer of Moraine, and the Existence of Ice Cores in Moraine Ridges, Geogr. Ann., 41, 228–230, 1959.
Paul, F., Barrand, N. E., Baumann, S., Berthier, E., Bolch, T., Casey, K., Frey, H., Joshi, S. P., Konovalov, V., Le Bris, R., Mölg, N., Nosenko, G., Nuth, C., Pope, A., Racoviteanu, A., Rastner, P., Raup, B., Scharrer, K., Steffen, S., and Winsvold, S.: On the accuracy of glacier outlines derived from remote-sensing data, Ann. Glaciol., 54, 171–182, https://doi.org/10.3189/2013AoG63A296, 2013.
Pellicciotti, F., Stephan, C., Miles, E., Herreid, S., Immerzeel, W. W., and Bolch, T.: Mass-balance changes of the debris-covered glaciers in the Langtang Himal, Nepal, from 1974 to 1999, J. Glaciol., 61, 373–386, https://doi.org/10.3189/2015JoG13J237, 2015.
Pieczonka, T. and Bolch, T.: Region-wide glacier mass budgets and area changes for the Central Tien Shan between ∼1975 and 1999 using Hexagon KH-9 imagery, Global Planet. Change, 128, 1–13, https://doi.org/10.1016/j.gloplacha.2014.11.014, 2015.
Pieczonka, T., Bolch, T., Junfeng, W., and Shiyin, L.: Heterogeneous mass loss of glaciers in the Aksu-Tarim Catchment (Central Tien Shan) revealed by 1976 KH-9 Hexagon and 2009 SPOT-5 stereo imagery, Remote Sens. Environ., 130, 233–244, https://doi.org/10.1016/j.rse.2012.11.020, 2013.
Pix4D: Pix4Dmapper pro, Pix4D, Version 4.4, available at: http://www.pix4d.com (last access: 10 July 2019), 2016.
Quincey, D. J. and Glasser, N. F.: Morphological and ice-dynamical changes on the Tasman Glacier, New Zealand, 1990–2007, Global Planet. Change, 68, 185–197, https://doi.org/10.1016/j.gloplacha.2009.05.003, 2009.
Quincey, D. J., Luckman, A., and Benn, D.: Quantification of Everest region glacier velocities between 1992 and 2002, using satellite radar interferometry and feature tracking, J. Glaciol., 55, 596–606, https://doi.org/10.3189/002214309789470987, 2009.
Ragettli, S., Bolch, T., and Pellicciotti, F.: Heterogeneous glacier thinning patterns over the last 40 years in Langtang Himal, Nepal, The Cryosphere, 10, 2075–2097, https://doi.org/10.5194/tc-10-2075-2016, 2016.
Rastner, P., Joerg, P. C., Huss, M., and Zemp, M.: Historical analysis and visualization of the retreat of Findelengletscher, Switzerland, 1859–2010, Global Planet. Change, 145, 67–77, https://doi.org/10.1016/j.gloplacha.2016.07.005, 2016.
Reid, H. F.: Zmutt Glacier. From the Glacier Photograph Collection, NSIDC: National Snow and Ice Data Center, Boulder, Colorado, USA, available at: https://nsidc.org/data/glacier_photo (last access: 21 August 2018), 1894.
Reid, T. D. and Brock, B. W.: Assessing ice-cliff backwasting and its contribution to total ablation of debris-covered Miage glacier, Mont Blanc massif, Italy, J. Glaciol., 60, 3–13, https://doi.org/10.3189/2014JoG13J045, 2014.
Röhl, K.: Characteristics and evolution of supraglacial ponds on debris-covered Tasman Glacier, New Zealand, J. Glaciol., 54, 867–880, https://doi.org/10.3189/002214308787779861, 2008.
Rounce, D. R., King, O., McCarthy, M., Shean, D. E., and Salerno, F.: Quantifying Debris Thickness of Debris-Covered Glaciers in the Everest Region of Nepal Through Inversion of a Subdebris Melt Model, J. Geophys. Res., 123, 1094–1115, https://doi.org/10.1029/2017JF004395, 2018.
Rowan, A. V., Egholm, D. L., Quincey, D. J., and Glasser, N. F.: Modelling the feedbacks between mass balance, ice flow and debris transport to predict the response to climate change of debris-covered glaciers in the Himalaya, Earth Planet. Sc. Lett., 430, 427–438, https://doi.org/10.1016/j.epsl.2015.09.004, 2015.
Sakai, A., Takeuchi, N., Fujita, K., and Nakawo, M.: Role of supraglacial pond in the ablation process of a debris-covered glacier in the Nepal Himalayas, in: Debris-Covered Glaciers, edited by: Nakawo, M., Raymond, C. F., and Fountain, A., Debris-Covered Glaciers, Seattle, 13–15 September, IAHS publication, IAHS, Wallingford, Oxfordshire, 264, 119–130, 2000.
Sakai, A., Nakawo, M., and Fujita, K.: Distribution Characteristics and Energy Balance of Ice Cliffs on Debris-covered Glaciers, Nepal Himalaya, Arct. Antarct. Alp. Res., 34, 12–19, https://doi.org/10.1080/15230430.2002.12003463, 2002.
Sapiano, J. J., Harrison, W. D., and Echelmeyer, K. A.: Elevation, volume and terminus changes of nine glaciers in North America, J. Glaciol., 44, 119–135, https://doi.org/10.3189/S0022143000002410, 1998.
Scambos, T. A., Dutkiewicz, M. J., Wilson, J. C., and Bindschadler, R. A.: Application of image cross-correlation to the measurement of glacier velocity using satellite image data, Remote Sens. Environ., 42, 177–186, https://doi.org/10.1016/0034-4257(92)90101-O, 1992.
Scherler, D., Bookhagen, B., and Strecker, M. R.: Spatially variable response of Himalayan glaciers to climate change affected by debris cover, Nat. Geosci., 4, 156–159, https://doi.org/10.1038/NGEO1068, 2011.
Schmidli, J.: Reconstruction and analysis of mesoscale precipitation in the Alps for the 20th century, Doctoral Thesis at ETH Zurich, https://doi.org/10.3929/ethz-a-004137916, 2000.
SenseFly SA: Bee classic, available at: https://www.sensefly.com/drone/ebee-mapping-drone/ (last access: 10 July 2019), Parrot Company, 2016.
Siedler, A.: Rekonstruktion von Gletscherhöhenmodellen, Master Thesis, Cartography and Geoinformatics, ETH Zürich, Zürich, 2011.
Sold, L., Huss, M., Machguth, H., Joerg, P. C., Leysinger Vieli, G., Linsbauer, A., Salzmann, N., Zemp, M., and Hoelzle, M.: Mass Balance Re-analysis of Findelengletscher, Switzerland; Benefits of Extensive Snow Accumulation Measurements, Front. Earth Sci., 4, 319, https://doi.org/10.3389/feart.2016.00018, 2016.
Stocker-Waldhuber, M., Fischer, A., Helfricht, K., and Kuhn, M.: Ice flow velocity as a sensitive indicator of glacier state, The Cryosphere Discuss., https://doi.org/10.5194/tc-2018-37, in review, 2018.
Stokes, C. R., Popovnin, V., Aleynikov, A., Gurney, S. D., and Shahgedanova, M.: Recent glacier retreat in the Caucasus Mountains, Russia, and associated increase in supraglacial debris cover and supra-/proglacial lake development, Ann. Glaciol., 46, 195–203, https://doi.org/10.3189/172756407782871468, 2007.
Swisstopo: DHM25. Das landesweite digitale Höhenmodell, available at: https://www.swisstopo.admin.ch/de/home/products/height/dhm25.html (last access: 10 July 2019), 2005.
Swisstopo: Swissimage. Das digitale Farborthophotomosaik der Schweiz, available at: https://www.swisstopo.admin.ch/content/swisstopo-internet/de/home/products/images/ortho/swissimage/_jcr_content/contentPar/tabs/items/dokumente/tabPar/downloadlist/downloadItems/588_1464190449870.download/infosi201003deu.pdf, last access: 21 August 2018, 2010.
Swisstopo: Hintergrundinformation zur Siegfriedkarte, available at: https://www.swisstopo.admin.ch/de/wissen-fakten/karten-und-mehr/historische-kartenwerke/siegfriedkarte.html, last access: 3 October 2018a.
Swisstopo: Topographic maps, aerial images, digital terrain models, available at: https://www.swisstopo.admin.ch/, last access: 7 December 2018b.
Thomson, M. H., Kirkbride, M. P., and Brock, B. W.: Twentieth century surface elevation change of the Miage Glacier, Italian Alps, in: Debris Covered Glaciers, International Association of Hydrologic Sciences Publication Workshop at Seattle, 264, 219–225, 2000.
van Woerkom, T., Steiner, J. F., Kraaijenbrink, P. D. A., Miles, E. S., and Immerzeel, W. W.: Sediment supply from lateral moraines to a debris-covered glacier in the Himalaya, Earth Surf. Dynam., 7, 411–427, https://doi.org/10.5194/esurf-7-411-2019, 2019.
Vincent, C., Soruco, A., Six, D., and Le Meur, E.: Glacier thickening and decay analysis from 50 years of glaciological observations performed on Glacier d'Argentière, Mont Blanc area, France, Ann. Glaciol., 50, 73–79, https://doi.org/10.3189/172756409787769500, 2009.
Vincent, C., Wagnon, P., Shea, J. M., Immerzeel, W. W., Kraaijenbrink, P., Shrestha, D., Soruco, A., Arnaud, Y., Brun, F., Berthier, E., and Sherpa, S. F.: Reduced melt on debris-covered glaciers: investigations from Changri Nup Glacier, Nepal, The Cryosphere, 10, 1845–1858, https://doi.org/10.5194/tc-10-1845-2016, 2016.
Werner, C., Strozzi, T., Wiesmann, A., and Wegmuller, U.: Gamma's portable radar interferometer, Symposium on Deformation Measurement and Analysis, 2008.
Wolf, J. R.: Die Geschichte der Vermessung der Schweiz, Commission von S. Höhr, Zürich, 1879.
World Glacier Monitoring Service: Fluctuations of Glaciers Database, 2017.
Ye, Q., Bolch, T., Naruse, R., Wang, Y., Zong, J., Wang, Z., Zhao, R., Yang, D., and Kang, S.: Glacier mass changes in Rongbuk catchment on Mt. Qomolangma from 1974 to 2006 based on topographic maps and ALOS PRISM data, J. Hydrol., 530, 273–280, https://doi.org/10.1016/j.jhydrol.2015.09.014, 2015.
Zemp, M., Thibert, E., Huss, M., Stumm, D., Rolstad Denby, C., Nuth, C., Nussbaumer, S. U., Moholdt, G., Mercer, A., Mayer, C., Joerg, P. C., Jansson, P., Hynek, B., Fischer, A., Escher-Vetter, H., Elvehøy, H., and Andreassen, L. M.: Reanalysing glacier mass balance measurement series, The Cryosphere, 7, 1227–1245, https://doi.org/10.5194/tc-7-1227-2013, 2013.


