the Creative Commons Attribution 4.0 License.
the Creative Commons Attribution 4.0 License.
 | 01 Jul 2019
Monitoring of snow surface near-infrared bidirectional reflectance factors with added light-absorbing particles
Mark Flanner
Roger De Roo
Alden Adolph
Broadband snow albedo can range from 0.3 to 0.9 depending on microphysical properties and light-absorbing particle (LAP) concentrations. Beyond the widely observed direct and visibly apparent effect of darkening snow, it is still unclear how LAPs influence snow albedo feedbacks. To investigate LAPs' indirect effect on snow albedo feedbacks, we developed and calibrated the Near-Infrared Emitting and Reflectance-Monitoring Dome (NERD) and monitored bidirectional reflectance factors (BRFs) hourly after depositing dust and black carbon (BC) particles onto experimental snow surfaces. After comparing snow infrared BRFs to snow specific surface areas (SSAs), we found that both measured and modeled snow infrared BRFs are correlated with snow SSA. These results, however, demonstrate a considerable uncertainty of ±10 m2 kg−1 in the determination of snow SSA from our BRF measurements. The nondestructive technique for snow SSA retrieval that we present here can be further developed for science applications that require rapid in situ snow SSA measurements. After adding large amounts of dust and BC to snow, we found more rapid decreasing of snow BRFs and SSAs in snow with added LAPs compared to natural (clean) snow but only during clear-sky conditions. These results suggest that deposition of LAPs onto snow can accelerate snow metamorphism via a net positive snow grain-size feedback.
- Article
(2934 KB) - Full-text XML
- BibTeX
- EndNote


Snow cover modulates the Earth's surface energy budget by reflecting a large portion of the incident solar radiative energy flux. As snow melts, more absorptive surfaces are uncovered resulting in a positive feedback mechanism known as the snow albedo feedback (SAF) (Qu and Hall, 2007; Hall, 2004). Light-absorbing particles (LAPs) within the snowpack, including elemental (black) carbon (BC), brown carbon, dust, and microbes, directly decrease snow albedo which can initiate the SAF and accelerate snowmelt (Bond et al., 2013; Qian et al., 2015; Skiles et al., 2018). Hadley and Kirchstetter (2012) experimentally verified that the reduction of snow albedo due to BC is enhanced for larger snow grains, implying a possible positive “grain-size” feedback induced by impurities in the snow. This positive feedback can also be inferred from the spectral snow albedo models presented by Warren and Wiscombe (1980) and from the Snow, Ice, and Aerosol Radiation (SNICAR) model (Flanner et al., 2007, 2009). Generally, two-layer models that represent snowpack as a collection of spheres can reproduce spectral hemispherical reflectances that compare well with observations (Grenfell et al., 1994).
Snow grain size is often quantified by its optically equivalent sphere effective radius, re, which is related to specific surface area, SSA, such that ), where ρice is the density of pure ice (917 kg m−3 at 0 ∘C). Snow SSA is defined as the total ice–air interfacial surface area S to ice mass m ratio such that
is expressed in terms of its total ice mass or volume V (Hagenmuller et al., 2016; Gallet et al., 2014). In snowpack with large temperature gradients, the diffusion of vapor causes snow SSA to decrease during the natural process of snow metamorphism (Flanner and Zender, 2006; Wang and Baker, 2014). In the absence of a temperature gradient, an isothermal snowpack with snow grains with low radii of curvature undergoes coarsening in a process driven by the Kelvin effect. Ebner et al. (2015) show that measurements of snow SSA evolution in isothermal snow agree with the isothermal snow metamorphism modeling framework developed by Legagneux et al. (2004) and Legagneux and Domine (2005). These laboratory studies express snow SSA in isothermal metamorphism as a function of time t as follows:
for initial snow SSA0 at t=0, growth rate parameter τ, and growth exponent n.
Snow SSA strongly affects absorption of infrared radiation. This relationship is evident from measurements of infrared reflectance that are highly correlated with snow SSA for various snow types (Domine et al., 2006). Among others, Gallet et al. (2009, 2014) use this correlation to determine dry snow SSA and wet snow SSA, respectively, using 1.31 µm directional hemispherical reflectance measurements (1.55 µm for measurements of snow SSA >60 m2 kg−1). Arnaud et al. (2011) present the Profiler Of Snow SSA Using SWIR reflectance Measurement (POSSUM), which applies the theoretical formulations from Kokhanovsky and Zege (2004) and Picard et al. (2009) to derive snow SSA from hemispherically averaged bidirectional reflectance measurements. Other studies establish techniques to obtain snow SSA using methane gas absorption (Legagneux et al., 2002) and X-ray micro-computed tomography (X-CT) in cold rooms (Pinzer and Schneebeli, 2009). Matzl and Schneebeli (2006) also derive snow SSA using infrared photography. Other techniques that are nondestructive enable the rapid retrieval of snow effective radius re from field measurements. Gergely et al. (2014), for example, demonstrate a technique to quickly determine the snow optically equivalent diameter from 0.95 µm bi-hemispherical reflectance measurements. Painter et al. (2007) infer snow re from spectral hemispherical directional reflectance factor measurements using a contact probe and a spectrometer.
While previous studies monitor snow metamorphism in clean snow, in situ experimentation of how LAPs affect the snow grain-size feedback diurnally in natural environments is challenging. These challenges can be partly attributed to the limited availability of inexpensive snow SSA measurement devices that can operate quickly in the field, and to the numerous constraints on the reproduction of naturally occurring conditions for which LAPs in snow strongly influence the climate system. While the POSSUM is a suitable instrument for this study, here, our first objective is to demonstrate the utility of a new instrument we use to quickly obtain approximate surface snow SSA (with LAPs). Our second objective is to investigate the effects of added LAPs on the snow grain-size feedback.
In the following sections, we first describe a numerical model that simulates multiple scattering in three dimensions to aid the design and calibration of the Near-Infrared Emitting and Reflectance-Monitoring Dome (NERD). Next, we describe the NERD apparatus, which enables multiple 1.30 and 1.55 µm bidirectional reflectance factor (BRF) measurements in just minutes while minimally altering the snow structure. To calibrate the NERD with respect to snow SSA, we then compare snow BRFs with X-CT-derived SSAs and develop an empirical relationship between measured SSAs and snow 1.30 µm BRFs. Finally, we discuss results from our LAPs in snow experiments in which we monitored accelerated snow metamorphism. Overall, this study demonstrates the NERD measurement technique and conditions for which the snow grain-size feedback can be enhanced by the presence of LAPs.
2.1 Monte Carlo modeling of multiple scattering in snowpack
The Monte Carlo method is applied to numerically simulate three-dimensional (3-D) light scattering within an idealized snowpack. Gaussian distributions (with 0.085 and 0.130 µm full widths at half-maximum) of photon wavelengths (centered around 1.30 and 1.55 µm) were selected to model light emission by narrow-band infrared light-emitting diodes (LEDs). One by one, photons are initiated downward into the snow medium, as demonstrated by Kaempfer et al. (2007), and propagated in optical depth space. Extinction, absorption, and polarization are accounted for following the scattering approach for geometrical optics described by Malinka (2014). Accordingly, random numbers (RNi) in the interval (0, 1) are generated to determine the photon optical path lengths, li such that
before the first scattering event (i=0) and again after each scattering event i. Absorption (and termination) of a photon can occur during a scattering event if an additionally generated random number (between 0 and 1) is greater than the particles' single scattering albedo. When a photon is scattered, its new direction cosines are determined from an optimized “rejection method” using the particles' scattering matrices (Ramella-Roman et al., 2005).
To calculate snow BRFs, 1 000 000 photons are propagated and traced through the modeled snowpack until they are absorbed or exit the medium. The snowpack is modeled as two-phase (air and ice) media containing a regular arrangement of suspended homogenous ice particles. Aspherical particle single scattering properties, including the mass absorption cross sections, asymmetry parameters, single scattering albedos, projected areas, volumes, and scattering matrices were calculated by Yang et al. (2013) for randomly oriented droxtals and solid hexagonal columns. For spheres, Mie theory is applied but with the analytical Henyey–Greenstein phase function (van de Hulst, 1968) to improve computational efficiency. The subset of shape habits (smooth droxtals and hexagonal columns) from the large dataset provided by Yang et al. (2013) was selected because these shape habits are purely convex solid ice. Because they are solid convex bodies, their SSAs can be computed from the their projected areas and volumes (Vouk, 1948). Azimuthal mean BRFs are calculated according to the reflectance definitions presented by Dumont et al. (2010), Hudson et al. (2006), and Nicodemus et al. (1977). Accordingly, photon exit angles are grouped into 30 exit zenith angle (θr) bins at 3∘ resolution. Azimuthal (ϕ) mean BRFs are calculated by zenith angle, θr, from the total incident photon flux, Φi (at a given θi) from
where dΦr represents the reflected photon flux through discrete solid angle bins. In the denominator, the cos θr factor satisfies Lambert's cosine law while sin θr accounts for the zenith angular dependence of the azimuthally integrated projected solid angle. Finally, the factor 2 is necessary to normalize the resulting weighting function w(θr)=sin θrcos θr as
Statistical uncertainty was determined by computing BRFs from simulations of Lambertian surfaces and tested using different numbers of photons. Azimuthal averaging reduces the BRFs' dimensionalities so that fewer photons are needed to mitigate Monte Carlo noise. Equation (4) was initially applied to Monte Carlo simulations of 75 000 photons reflected by various ideal Lambertian surfaces. At 3∘ (zenith angular) resolution, 30 and 60∘ BRFs of Lambertian surfaces were simulated accurately to within ±2 %. This margin of uncertainty was determined by computing rms differences between calculated and specified Lambertian reflectances ranging from 0 to 1. Across this range, rms differences at 30 and 60∘ were generally less than 0.01. In subsequent test cases, simulating snowpack BRFs with up to 10 000 000 photons did not significantly change results when compared with simulations of 250 000 photons. Ultimately, it was determined that simulations with 1 000 000 photons were appropriate for the remainder of this study.
2.2 Near-infrared bidirectional reflectance factor measurements
The NERD is designed to measure 1.30 and 1.55 µm BRFs. These wavelengths are selected for snow SSA retrieval due to the strong dependence of snow albedo on grain size in these parts of the spectrum. Snow spectral albedo is simulated here using the SNICAR model to demonstrate its sensitivity (Fig. 1). While snow spectral albedo is sensitive to the snow effective radius re (and thus snow SSA), it is not sensitive to small black carbon concentrations at these wavelengths. Snow SSA can therefore be retrieved using 1.30 µm and 1.55 µm reflectance measurements for snow with small black carbon concentrations.
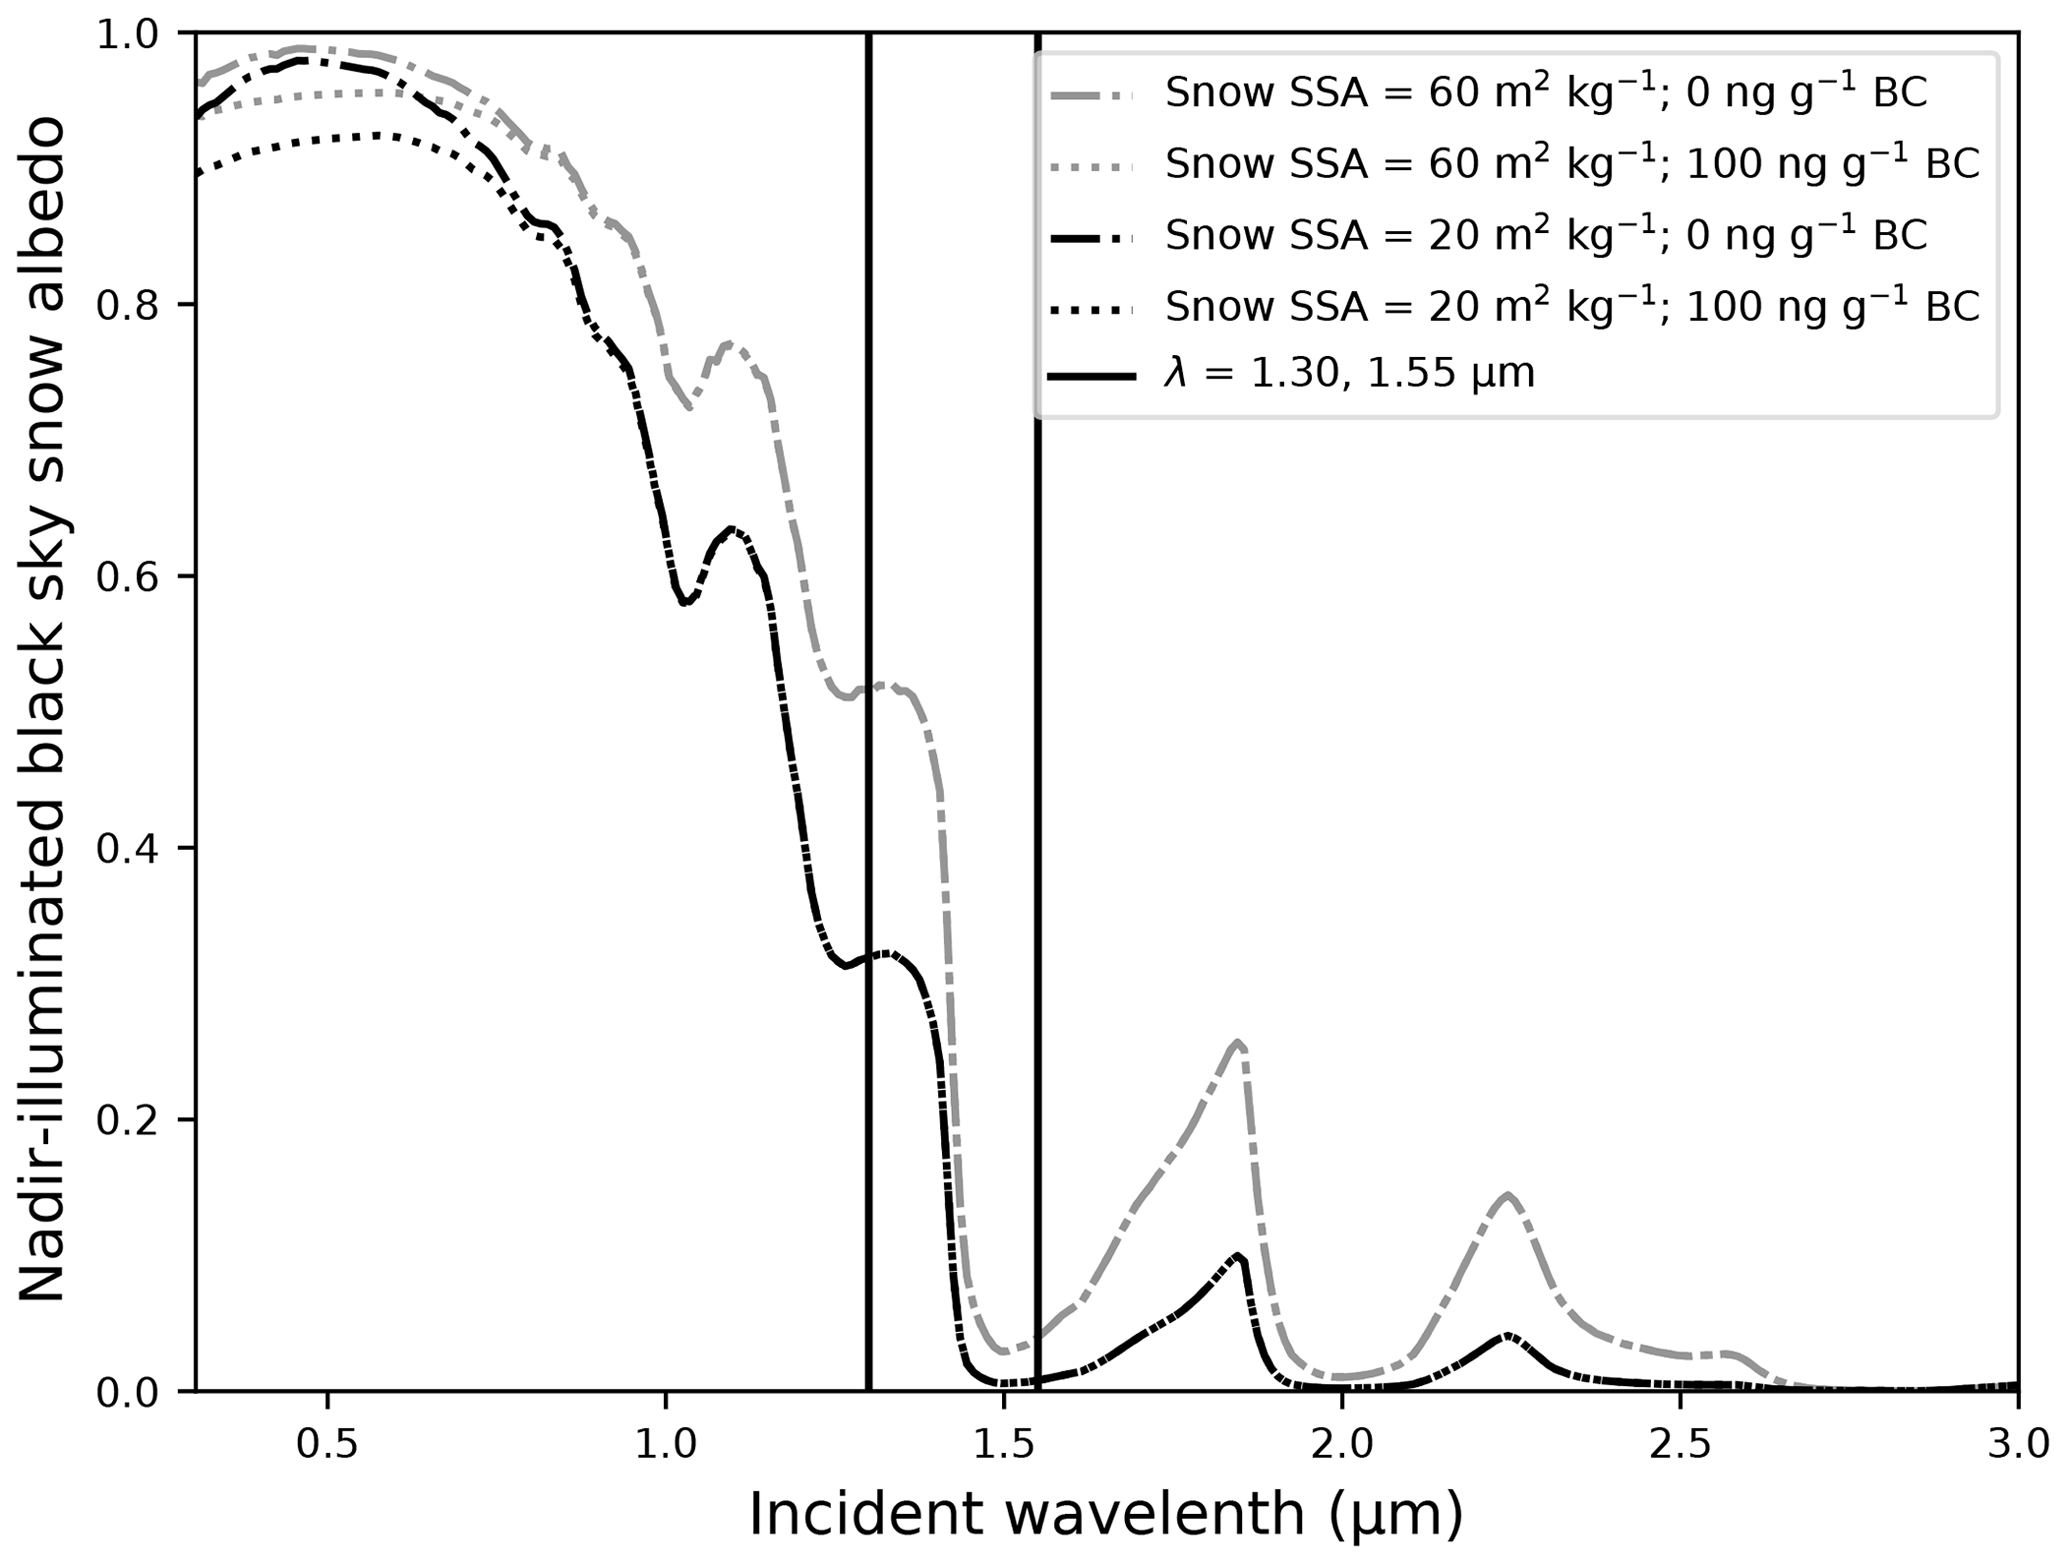
Figure 1Black sky spectral snow albedo under nadir illumination. Snow albedo is simulated by the Snow, Ice, and Aerosol Radiation (SNICAR) model (Flanner et al., 2007). Dashed-dotted curves represent clean snow of medium-high SSA (60 m2 kg−1, gray) and medium-low SSA (20 m2 kg−1, black) to show the dependence of snow albedo on snow SSA. Dotted curves represent contaminated snow with uncoated black carbon (BC) particulate concentrations of 100 ng g−1.
The design principle is similar to the DUal Frequency Integrating Sphere for Snow SSA measurements (DUFISSS) (Gallet et al., 2009). The NERD also uses 1.30 (1.31 in DUFISSS) and 1.55 µm emitters to illuminate the snow surface from nadir (15∘ off nadir for 1.55 µm in NERD). The main distinction between the DUFISSS and the NERD is the type of reflectance measured. Gallet et al. (2009) use an integrating sphere to measure hemispherical reflectance. In the NERD, however, photodiodes are directed toward the illuminated surface in a black dome to measure BRFs, as demonstrated by Arnaud et al. (2011). The interior of the dome is painted with a flat black paint to increase absorptivity and to minimize internal reflections between the dome and snow surface. To test the near-infrared absorptivity of the black pigment, the NERD was used to measure BRFs of a painted black surface. All measured BRFs of the black surface were less than 0.03.

Figure 2Near-Infrared Emitting and Reflectance-Monitoring Dome (NERD) schematic (a) and photographs (b). The photograph on the bottom right shows the (radial) placement of photodiodes and LEDs (toward the center) within the dome.
Four infrared light-emitting diodes (LEDs) are mounted into the 17 cm in diameter black styrene half-sphere. Two LEDs with peak emission wavelengths of 1.30 µm are mounted at nadir and 10∘ relative to zenith and two LEDs with peak emission wavelengths of 1.55 µm are mounted at 15∘ off nadir (see Fig. 2). The 1.30 µm LEDs have spectral line half-widths of 0.085 µm and half-intensity beam angles of 10∘, while the 1.55 µm LEDs have half-maximum bandwidths of 0.130 µm and 20∘ beam angles. These high powered, narrow beam infrared LEDs were selected to illuminate a small oval (estimated major axes of 1.5 cm at 1.30 µm and 3.0 cm at 1.55 µm) of the experimental surface to maximize the reflected radiance signal. The reflected radiance signal is measured using four indium gallium arsenide photodiodes mounted in two different azimuthal planes (0 and 90∘ relative to the illumination): two each at 30 and 60∘ relative to zenith. Photodiodes highly sensitive to light with wavelengths ranging from 0.80 to 1.75 µm and relatively large active areas (1 mm) were selected to maximize sensitivity.
Because the orientation of LEDs and photodiodes are fixed, reflectance factors of surfaces with negligible subsurface scattering can be obtained after calibration using two diffuse reflectance targets (Gallet et al., 2009; Gergely et al., 2014; Dumont et al., 2010). These Lambertian targets reflect incident light according to Lambert's cosine law and appear equally bright at all viewing angles. By comparing the measured voltage signal from the experimental (snow) surface to that measured from the reflectance targets, two BRFs at both 30 and 60∘ viewing angles are obtained for each light source. While subsurface scattering of visible light in snow is pervasive (Smith et al., 2018), the light penetration in snow near 1.30 and 1.55 µm is at most a couple centimeters due to the strong absorption features in the near-infrared (Kaempfer et al., 2007; Grenfell et al., 1994; Brandt and Warren, 1993). Subsurface scattering is therefore assumed to be minimal and fully contained within each photodiode's field of view.
Table 1NERD Lambertian reflectance measurements. Tabulated values represent median BRFs (R(θi;θr)) calculated for n samples of measurements from Lambertian reflectance targets with nominal reflectances of ρL (rms difference in parentheses). Linear regressions for each wavelength (λ) are calculated from samples.
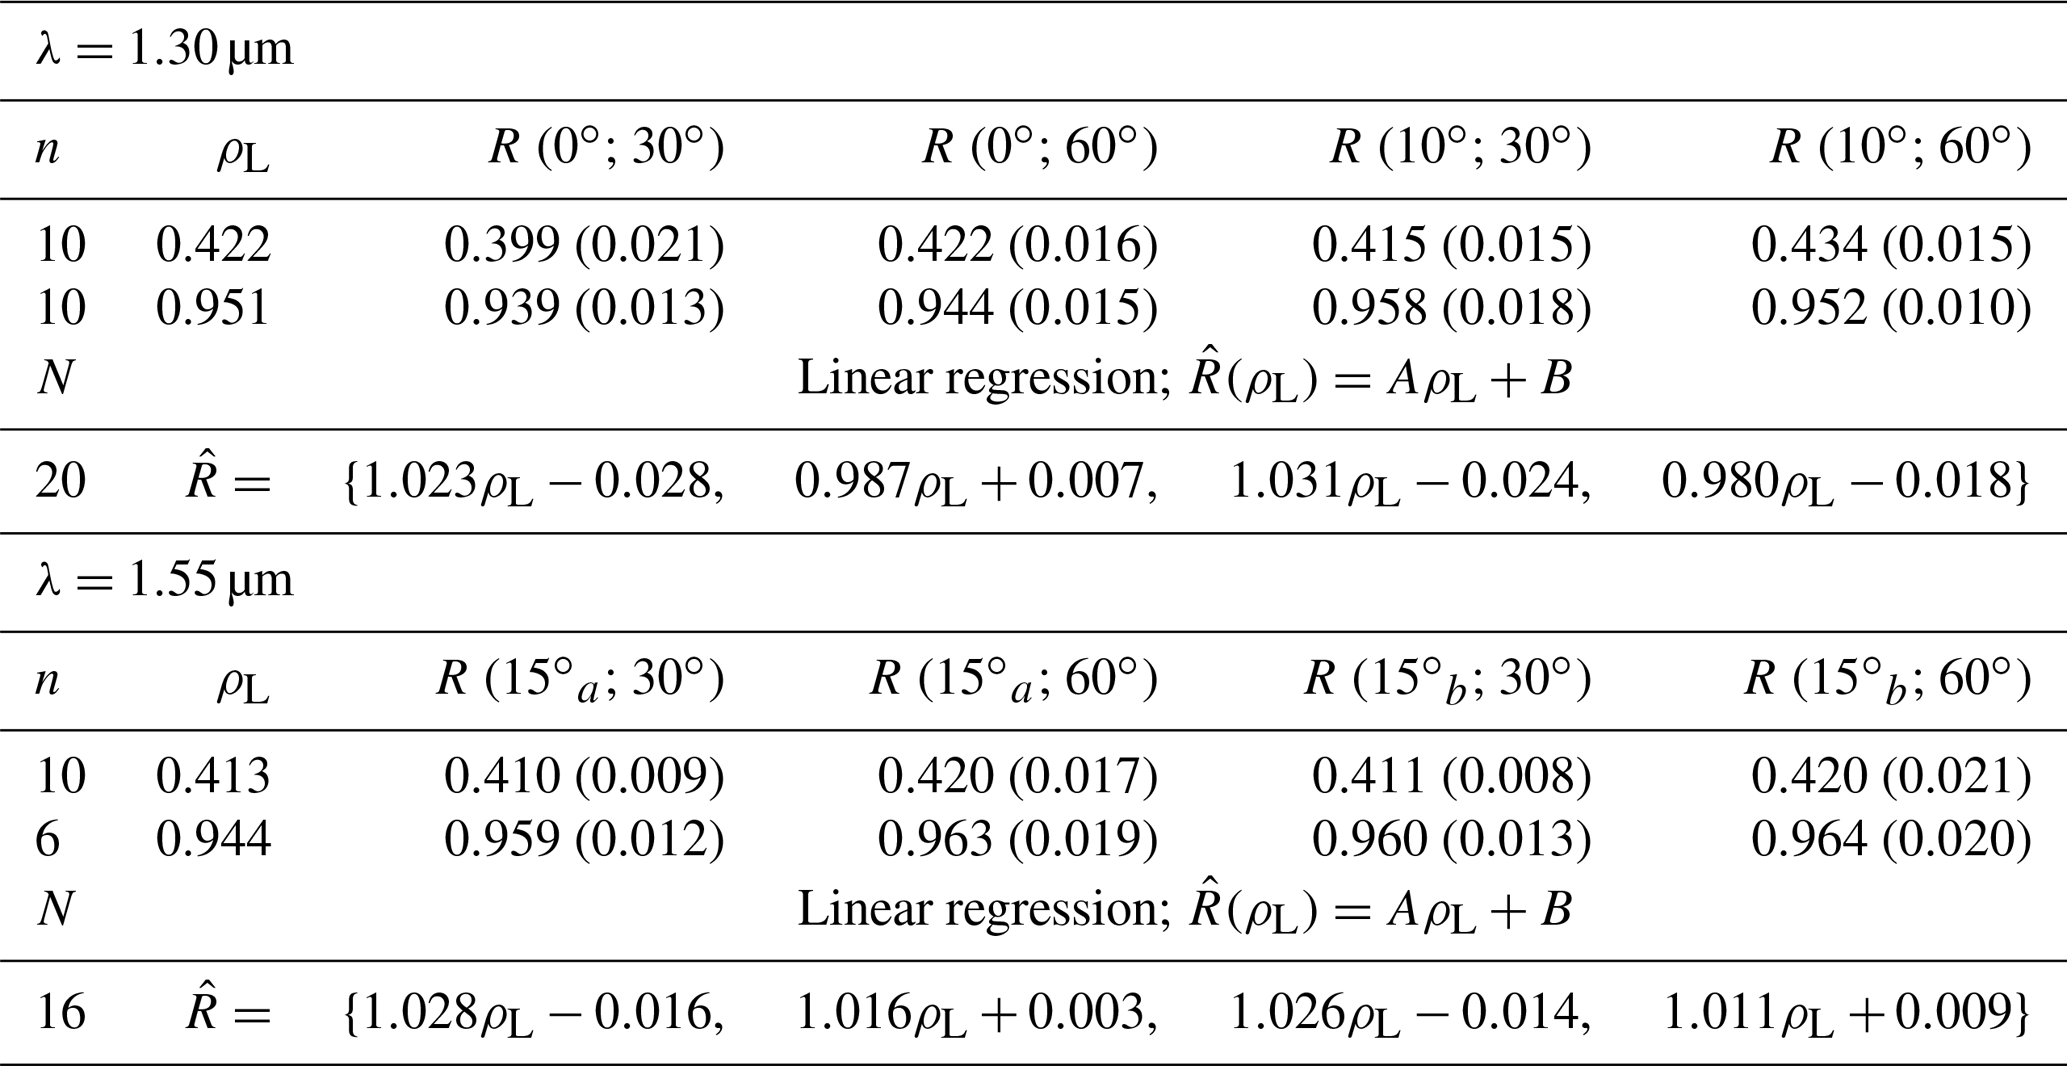
To validate NERD reflectance measurement accuracy, precision, and responsiveness, measured BRFs of reflectance standards are recorded after calibration. BRFs (R) for each LED and photodiode viewing zenith angle (θi;θr) combination are measured in temperatures ranging from −20 to +2 ∘C. In general, NERD BRFs of the Lambertian reflectance standards are accurate to within ±2 %. We quantify instrument precision (2 %) by computing root mean squared (rms) differences from repeated measurements (see Table 1). Linear regressions quantify the linear response (A) over the reflectance range of 0.41 to 0.95. Response uncertainty ranges from −2 % to +3 % and from +1 % to +3 % at 1.30 and 1.55 µm, respectively. These test results indicate the NERD's ability to obtain BRFs on smooth reflectance standards with a measurement uncertainty of 1 %–2 %.
2.3 Snow specific surface area measurements
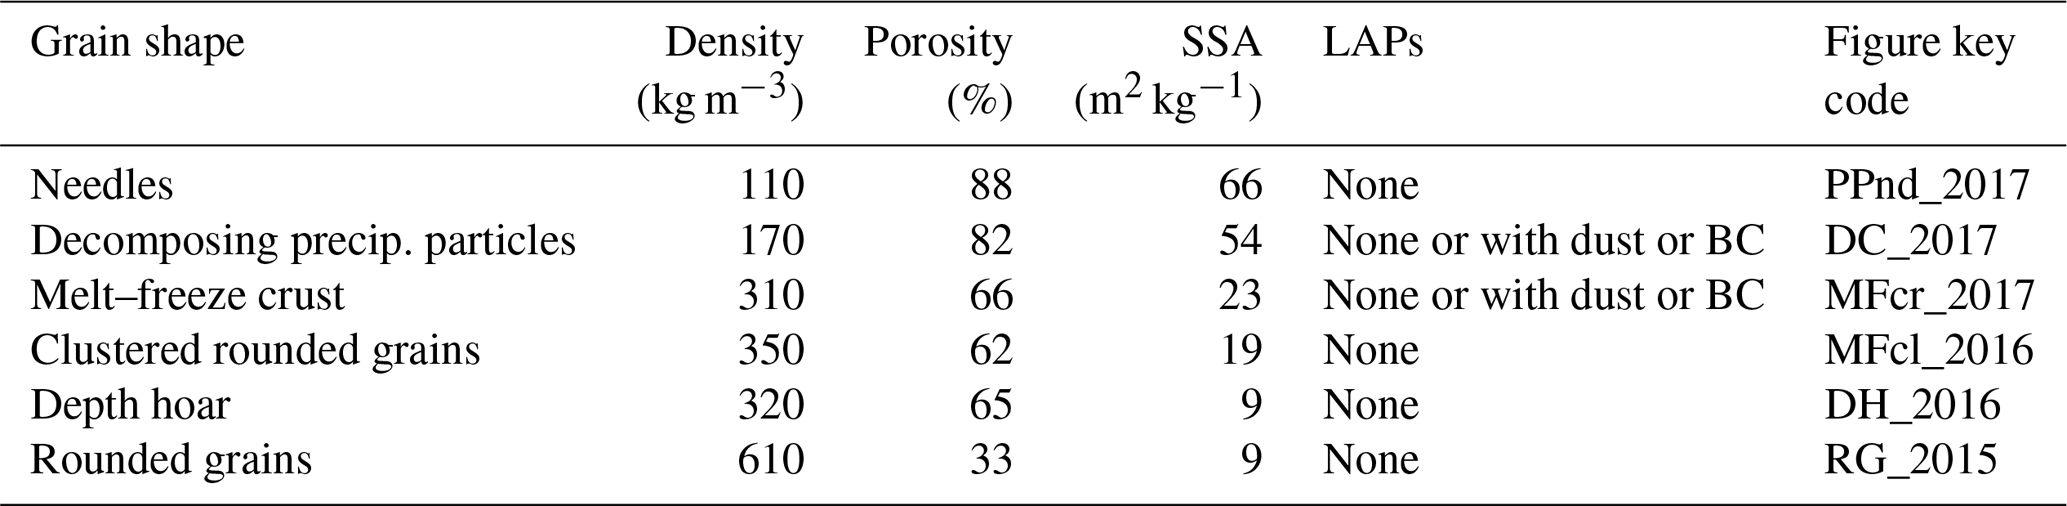
Surface snow (just the top few centimeters) samples were collected in nature over the span of 3 years (winters 2015–2017) and transported in coolers to the nearby U.S. Army's Cold Regions Research Engineering Laboratory (CRREL) in Hanover, New Hampshire. Depth hoar samples, however, were instead grown inside the CRREL at −20 ∘C using a forced temperature gradient. Snow samples are classified based on X-CT results according to Fierz et al. (2009) (Table 2). Snow SSA was derived from X-CT analysis and contact spectroscopy as described below.
Table 2Snow sample physical classification (Fierz et al., 2009). Snow densities, porosities, and specific surface areas (SSAs) are calculated from X-ray micro-computed tomography.
To determine snow SSA, X-CT was conducted on a class of six snow samples according to Lieb-Lappen et al. (2017). X-ray (40–45 kV, 177–200 µA) transmission through cylindrical snow samples was measured at rotation steps of 0.3–0.4∘. To limit scan times to 15 min, exposure time was set to 340 ms at a cubic voxel resolution of 14.9 µm. Processing software enables SSA calculations from 3-D morphology results (Pinzer and Schneebeli, 2009).
In some cases, snow samples were scanned several hours or days after snow BRFs were measured. To correct for natural isothermal snow SSA metamorphism while samples were being stored, Eq. (2) was applied with time t set equal to the total time elapsed between NERD measurements and X-CT scan times. The unitless growth rate parameters τ=721.2 or 14 400 and growth exponents n=2.15 or 0.32, respectively, were inferred from Ebner et al. (2015) depending on the snow sample type. Applying this correction yielded a SSA decrease between 3 and 5 m2 kg−1.
Snow SSA was also inferred from optical grain-size measurements using contact spectroscopy (Painter et al., 2007). Snow reflectance spectra were collected using an ASD FieldSpec4 spectroradiometer and a high-intensity contact probe with reference to a Spectralon white reference panel. Snow effective radius re is determined from the normalized area of the absorption feature centered at approximately 1 µm using a lookup table (Nolin and Dozier, 2000). These measurements were conducted inside the CRREL in a cold lab only for the depth hoar (DH_2016) and rounded grain (RG_2015) samples.
2.4 Light-absorbing particles in snow experiments
Snow BRFs and SSAs were measured throughout the day in the following dust and BC in snow experiments. Sand particles and hydrophobic BC were sifted multiple times with a salt shaker (with holes of roughly 1 mm in diameter) to filter out larger particles. The filtered LAPs were then deposited onto experimental snow plots in an open field in Hanover, New Hampshire, on 10 and 16 February 2017 shortly after fresh snowfall events. For each experiment, 1 m2 plots of snow were designated as natural (control) or contaminated (experimental). Snow BRFs and SSAs were obtained using the NERD and from X-CT analyses, respectively. For each set of NERD measurements, 30 and 60∘ BRFs were both recorded four times. BRFs were measured over two different locations within the experimental plot using two photodiodes at each viewing angle (30 and 60∘).
2.4.1 Cloudy sky with diffuse ambient lighting (10 February 2017)
Early on 10 February, experimental plots were loaded with BC until visible darkening was apparent. Snow BRFs were measured shortly after 00:00, 03:00, 06:00 eastern standard time (EST) (during the night) and then periodically throughout the day. Because these plots were well shaded by tall trees, these measurements were used to monitor snow metamorphism without the influence of direct solar illumination. Furthermore, mostly cloudy conditions on 10 February obscured direct solar radiation so that ambient lighting was diffuse.
2.4.2 Clear sky with direct solar irradiance (17 February 2017)
On 17 February, just a pinch (<1 g) of BC and 30 g of sand were deposited (quasi-)uniformly over separate 1 m2 plots. These experimental deposition fluxes were selected to mimic the most extreme LAPs' loading event observed by Skiles and Painter (2017) in the San Juan Mountains in Colorado. As in the previous experiment, snow BRFs were measured periodically throughout the day; however, all snow plots were in full view of the clear sky to maximize incident direct solar irradiance.
3.1 Near-infrared reflectance calculations for regular homogenous ice particles
To validate the Monte Carlo model for snow applications, we simulated 1.30 and 1.55 µm narrow band black-sky albedo for snow effective radius re ranging from 36 to 327 µm (SSA =80 to 10 m2 kg−1) and compared results with the SNICAR model (Fig. 3). As expected, results from Monte Carlo simulations yield slightly higher hemispheric reflectances for droxtals (for all SSAs) and solid hexagonal columns (for SSA >40 m2 kg−1) than for spheres and from the SNICAR model (Dang et al., 2016). For all particle sizes, Monte Carlo simulations using spherical ice particles generated nearly identical narrow-band albedo values compared to those from Flanner et al. (2007). These results are also similar to the numerical modeling results from Picard et al. (2009) and the analytical solutions from Kokhanovsky and Zege (2004), though for different particle shapes.
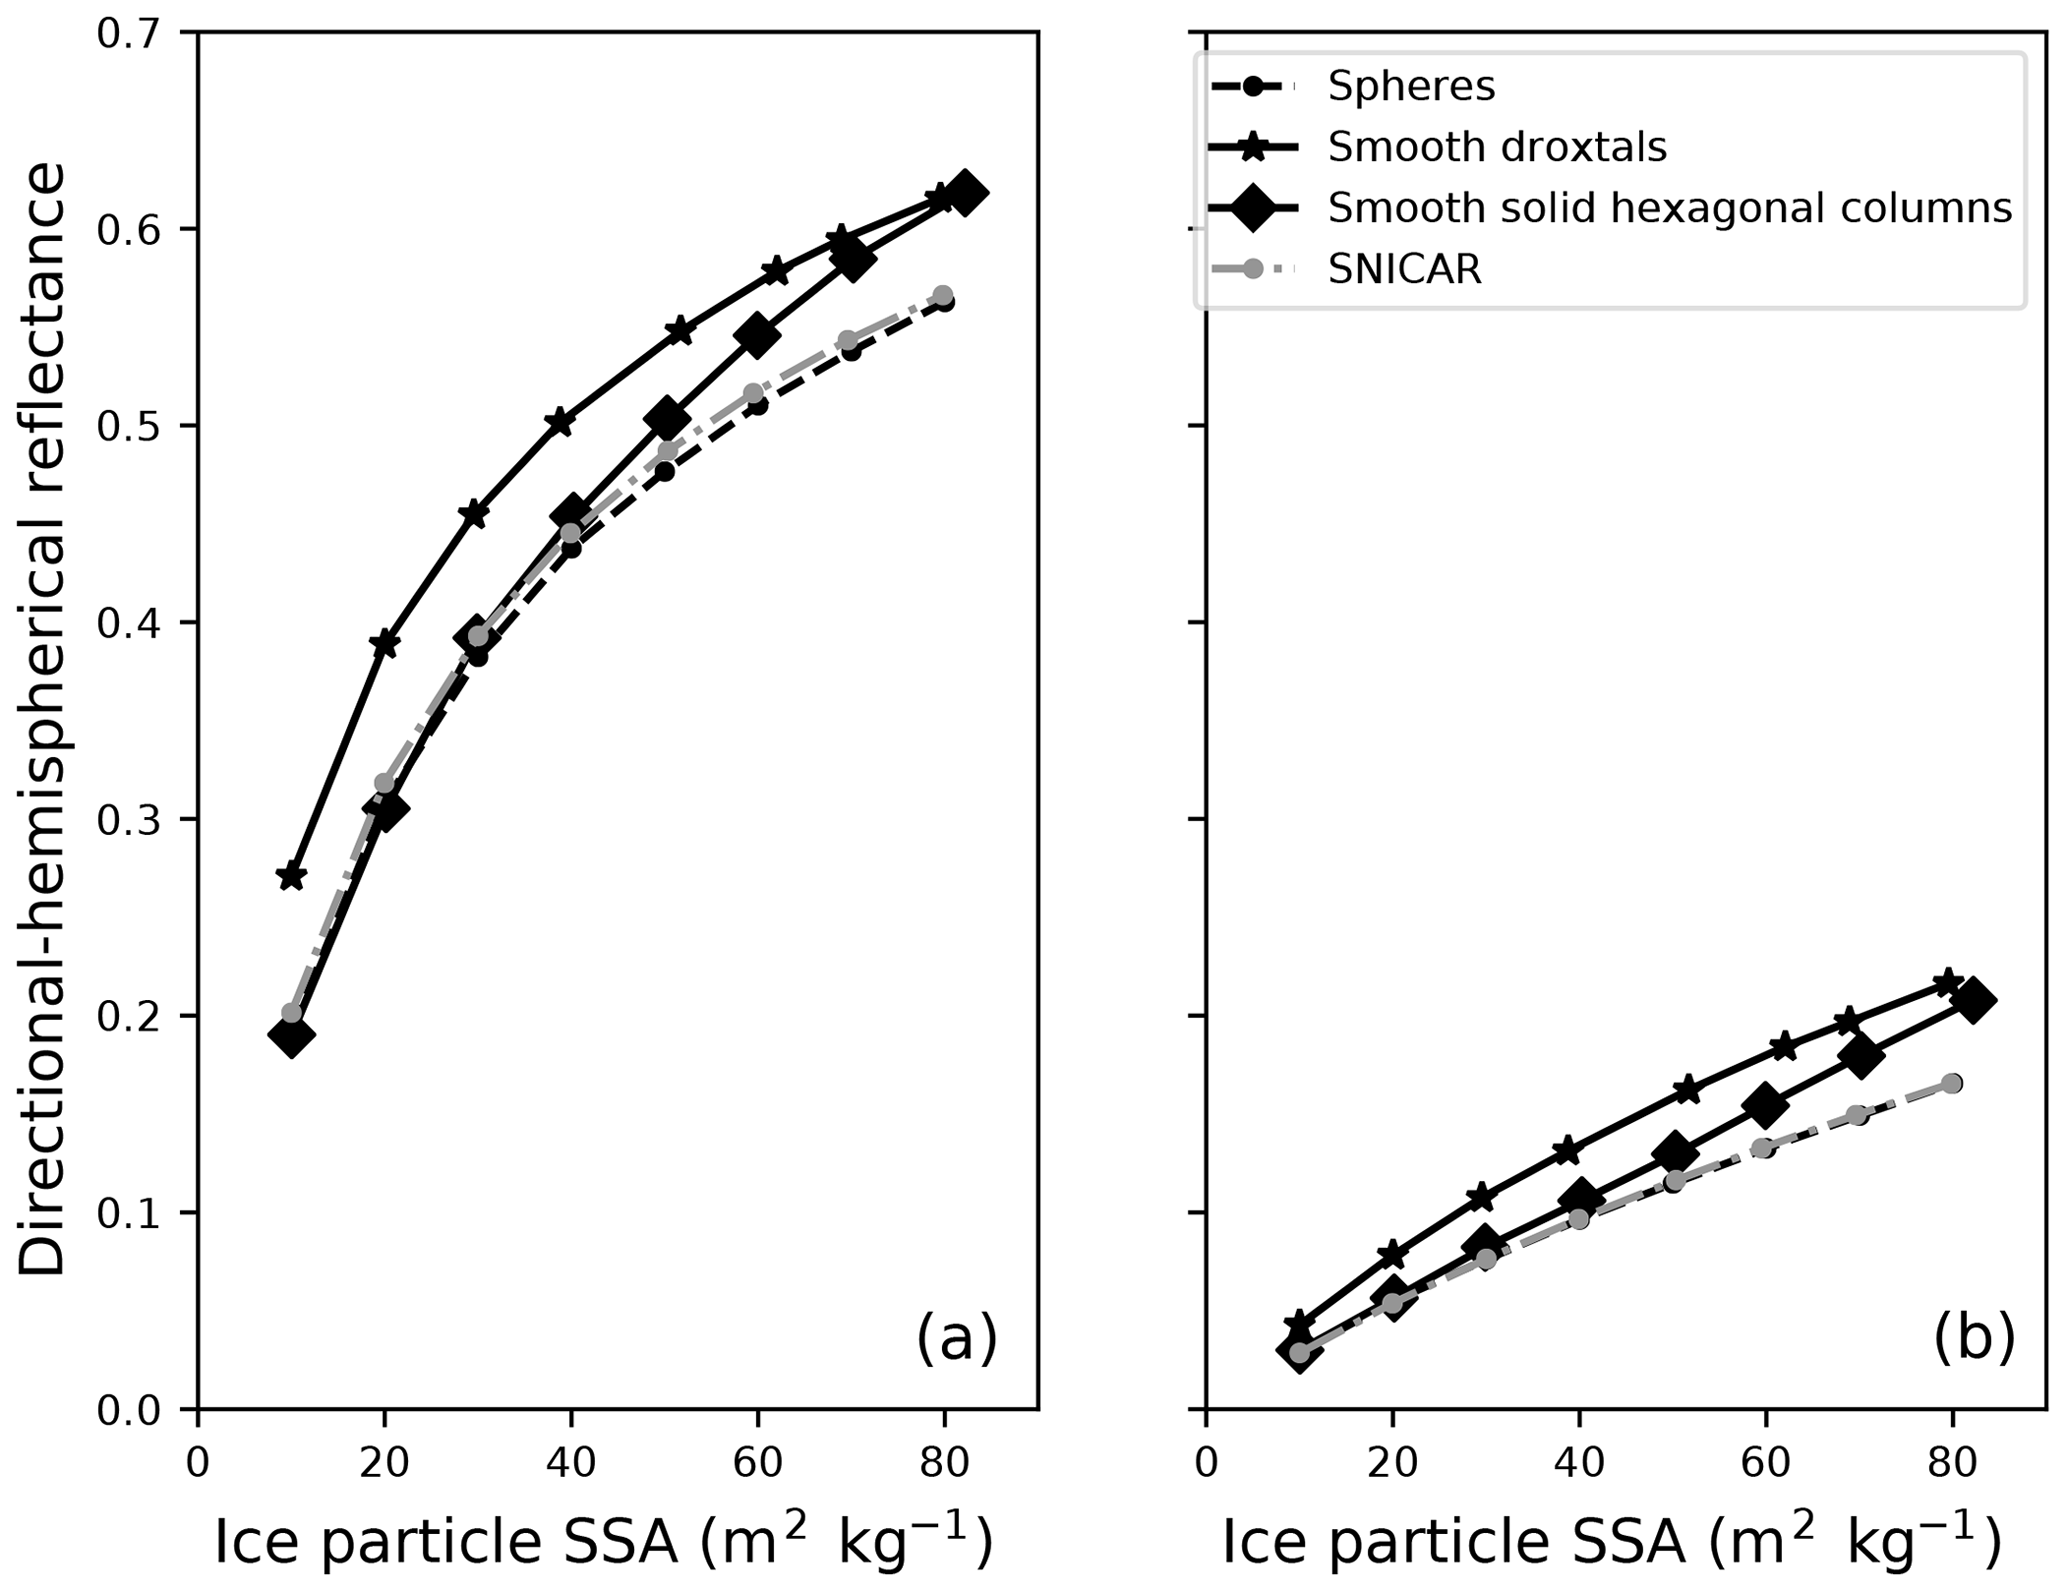
Figure 3Modeled 1.30 µm nadir (a) and 1.55 µm 15∘ directional hemispherical reflectance (b) for various snow SSA. Solid line segments connect albedo calculations from Monte Carlo simulations of light scattering in snow media comprised of droxtals (stars) and solid hexagonal columns (diamonds). Circles connected by dashed or dotted line segments connect snow albedo calculations modeled as spherical ice particles from Monte Carlo modeling (black) and from the Snow, Ice, and Aerosol Radiation (SNICAR) online model (gray).
To guide our choice of a snow BRF to SSA calibration function, we calculated BRFs from Eq. (4) for various particle SSAs ranging from 10 to 80 m2 kg−1 (Fig. 4, line graphs). Generally, we found exponential (linear) relationships between 1.30 (1.55) µm BRFs and particle SSAs. Modeled 1.30 µm BRFs are slightly higher at 30∘ than at 60∘ for particle SSA >30 m2 kg−1. For a given particle size, a different shape habit can yield changes in BRFs of as much as 0.1. Monte Carlo modeling results yield the highest reflectances for droxtals and the lowest reflectances for spheres.
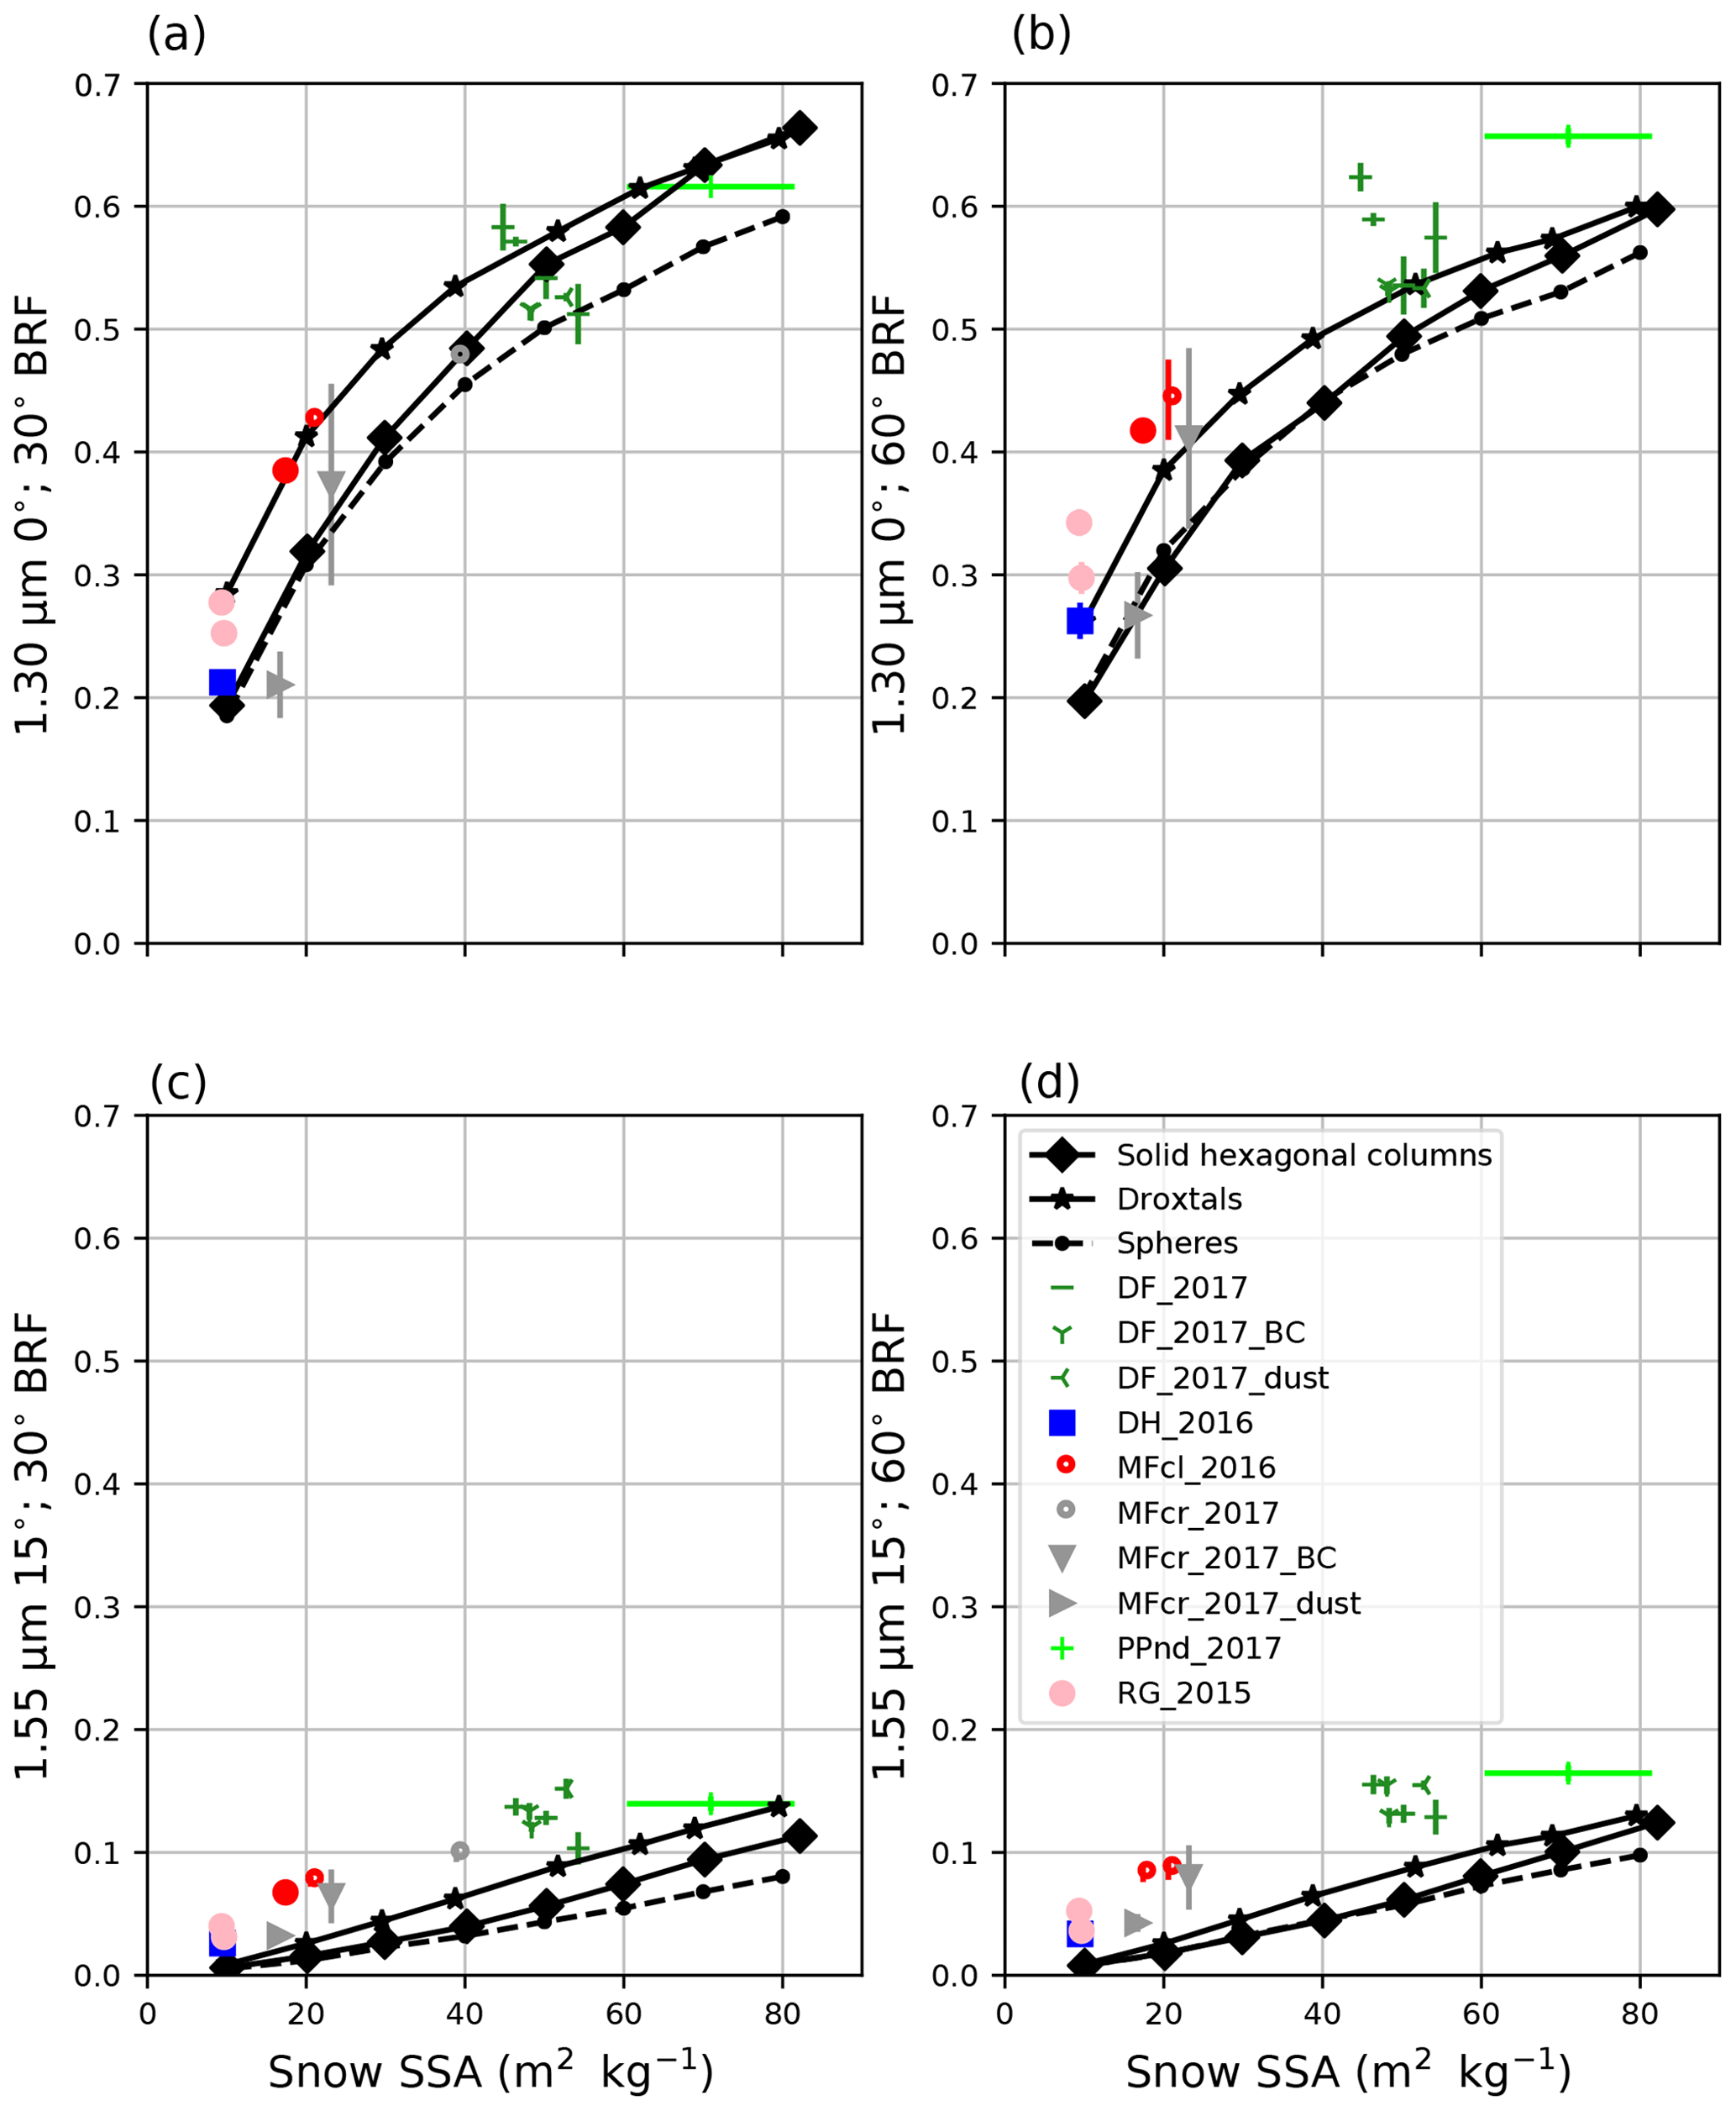
Figure 4NERD SSA calibration. All panels contain NERD-measured and Monte Carlo-modeled (black) BRFs (1.30 µm, a, b; 1.55 µm, c, d; 30∘ viewing, a, c; 60∘ viewing, b, d scattered against snow SSA. NERD BRFs are scattered against X-CT-derived snow SSA. Line segments connect Monte Carlo modeled BRFs of snow media comprised of spheres (filled circles, dashed lines), droxtals (stars, solid lines), and solid hexagonal columns (diamonds, solid lines). Snow sample key codes, symbols, and colors conform with the physical snow classification standards defined by Fierz et al. (2009) (Table 2). Vertical error bars on NERD BRFs represent standard deviations calculated from multiple azimuthal samples. Horizontal error bars on X-CT-derived SSA, where present, represent standard deviations from multiple scans on similar snow samples.
3.2 Relating snow specific surface area to near-infrared bidirectional reflectance factors
To calibrate the NERD for snow SSA retrieval, we compared X-CT-derived snow SSA with NERD snow BRF measurements (Fig. 4). In general, measured snow BRFs are directly related to snow SSAs. At 1.30 µm, BRFs range from just under 0.2 (for low SSAs) to as high as 0.7 (for high SSAs) and are slightly higher at 60∘ than at 30∘. We observed 1.55 µm snow BRFs close to 0 (for low SSAs) and as high as 0.2 (for high SSAs). We recorded the highest 1.55 µm snow BRFs at 60∘ for fresh snow (needles). At 1.30 µm, measured 30∘ snow BRFs for varying snow SSA fall within the envelope of Monte Carlo modeled BRFs for all three shape habits (Fig. 4, top left). Modeling results are in closest agreement with measurements at 30∘ viewing for 1.30 µm. At 1.55 µm, measured BRFs are larger than predicted from modeling across all SSA.
Our measurements and modeling results show a considerable spread of BRFs across snow samples and shape habits, respectively, for both 1.30 and 1.55 µm and for both 30 and 60∘ viewing angles. The spread in measurements, in particular, indicates a considerable uncertainty in the ability to retrieve snow SSA from measured BRFs. While the 1.30 µm 30∘ viewing zenith angle BRF combination most closely agrees with modeled BRFs, the 60∘ viewing zenith angle can provide a second estimate of snow SSA. Reporting two snow SSA values using both view angles can provide an estimate of the variability in SSA retrieval resulting from the anisotropy of the snow bidirectional reflectance distribution function in the near-infrared (Dumont et al., 2010).
Our finding of the exponential relationships between snow SSAs and 1.30 µm BRFs is consistent with results from previous studies (Picard et al., 2009; Gallet et al., 2009). Gallet et al. (2009) also identify a linear relationship between 1.55 µm reflectance and snow SSA and use the longer wavelength in their DUFISSS to obtain measurements of high snow SSA (>60 m2 kg−1). In this study, however, nearly all snow samples are lower than this threshold.
Measured snow BRFs at 1.55 µm are higher than both hemispherical reflectance measurements by Gallet et al. (2009) and Monte Carlo calculations. This discrepancy might be explained by the NERD LEDs, which have full widths at half-maximum (FWHM) of 0.130 µm and emit non-negligible light at shorter wavelengths. Supplementary SNICAR and albedo calculations using a broadened FWHM of 0.260 µm support this hypothesis in which values closer to the measured 1.55 µm BRFs are reproduced (Fig. 3b).
In light of these empirical and numerical results, we propose the following general exponential form relating 1.30 µm snow BRFs to SSA such that
for 1.30 µm snow BRF R1.30. Using least squares regression analysis, we estimate “best fit” values for α and β for both 30 and 60∘ viewing zenith angles (see Fig. 5).
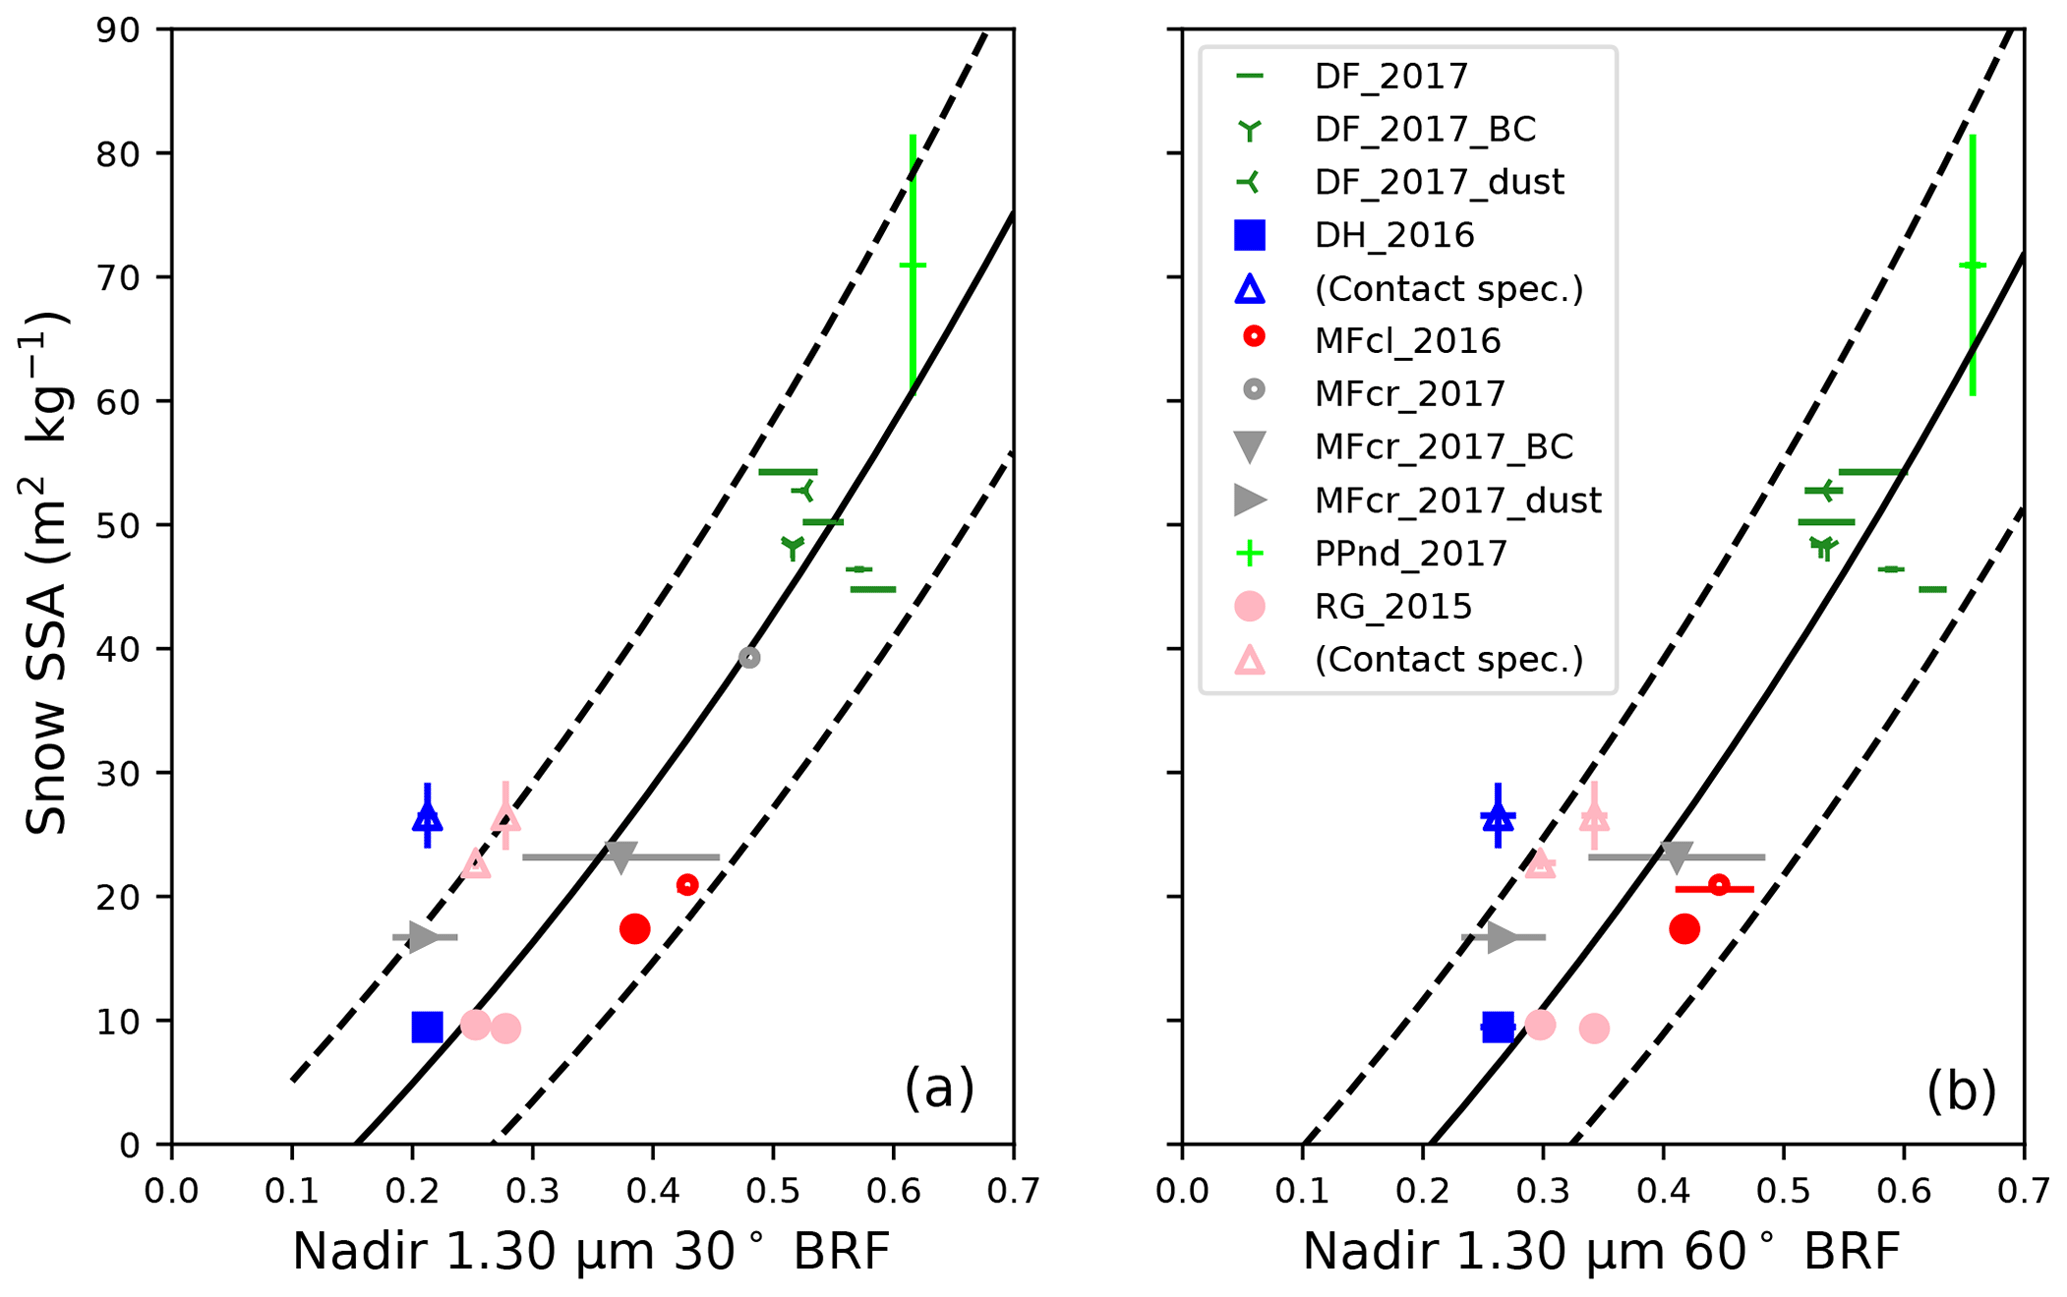
Figure 5Snow 1.3 µm BRF to SSA exponential regressions. Markers with standard error bars represent SSA measured with X-CT∗ and scattered against nadir 1.30 µm 30∘ (a) and 60∘ (b) BRFs measured by the NERD. Solid curves represent exponential regression functions, and dashed curves represent standard errors of the regressions such that at 30∘ viewing, m2 kg−1 and m2 kg−1, and at 60∘ viewing, m2 kg−1 and m2 kg−1. ∗ Hollow triangles (blue, depth hoar; pink, rounded grains) represent snow SSA measurements derived from contact spectroscopy.
Ideally, an empirically derived calibration function would include SSA measurements from multiple methods to mitigate uncertainties associated with collection methods needed for X-CT analysis. Such collection methods can easily change the snow microphysical characteristics and lead to biases in the X-CT-derived SSAs. As a preliminary validation of Eq. (6), we compare snow SSA results to SSAs derived from snow effective radius re measurements conducted using contact spectroscopy in Fig. 5. Encouragingly, two out of three measurements fall within the bounds of the standard error of the regression. Contact spectroscopy snow SSA values are consistently higher than those calculated from X-CT analysis and are also higher than those determined by Eq. (6). This comparison provides a preliminary assessment of the NERD snow BRF to SSA calibration function.
Hereafter, we apply Eq. (6) in the following LAPs in snow experiments to estimate hourly snow SSAs from measured snow BRFs. Because the remainder of this study is concerned with relatively large changes in SSAs, approximate SSA retrieval using the NERD is useful to quantitatively assess how added LAPs affect snow grain-size feedback and snow metamorphism.
3.3 Light-absorbing particles' effect on snow metamorphism
First, to monitor snow metamorphism without solar heating, during the early morning (night) hours on 10 February, we deposited BC onto an experimental plot after the previous day's snowfall. Surface temperatures ranged from −14 to −9 ∘C. We observed low to moderate wind speeds from the early morning hours through the afternoon with partly to mostly cloudy conditions during the day. The 1.30 µm snow BRF measurements conducted shortly after BC application indicate a direct darkening of 0.03 at 30∘ viewing and 0.05 at 60∘ viewing. While these decreased BRF values are considerable, this experiment contained heavily contaminated snow with a high BC concentration unlikely to occur in nature. Despite the high BC concentration, BRFs measured at 1.30 (1.55) µm remained within 0.5 and 0.6 (0.1 and 0.2) throughout the day in both contaminated and natural snow (see Fig. 6). X-CT analysis showed small differences in morning (49 m2 kg−1) and afternoon (48 m2 kg−1) snow SSA. Our results indicate that heavy BC loading had little to no effect on snow metamorphism during the 16 h experiment without direct solar irradiance.
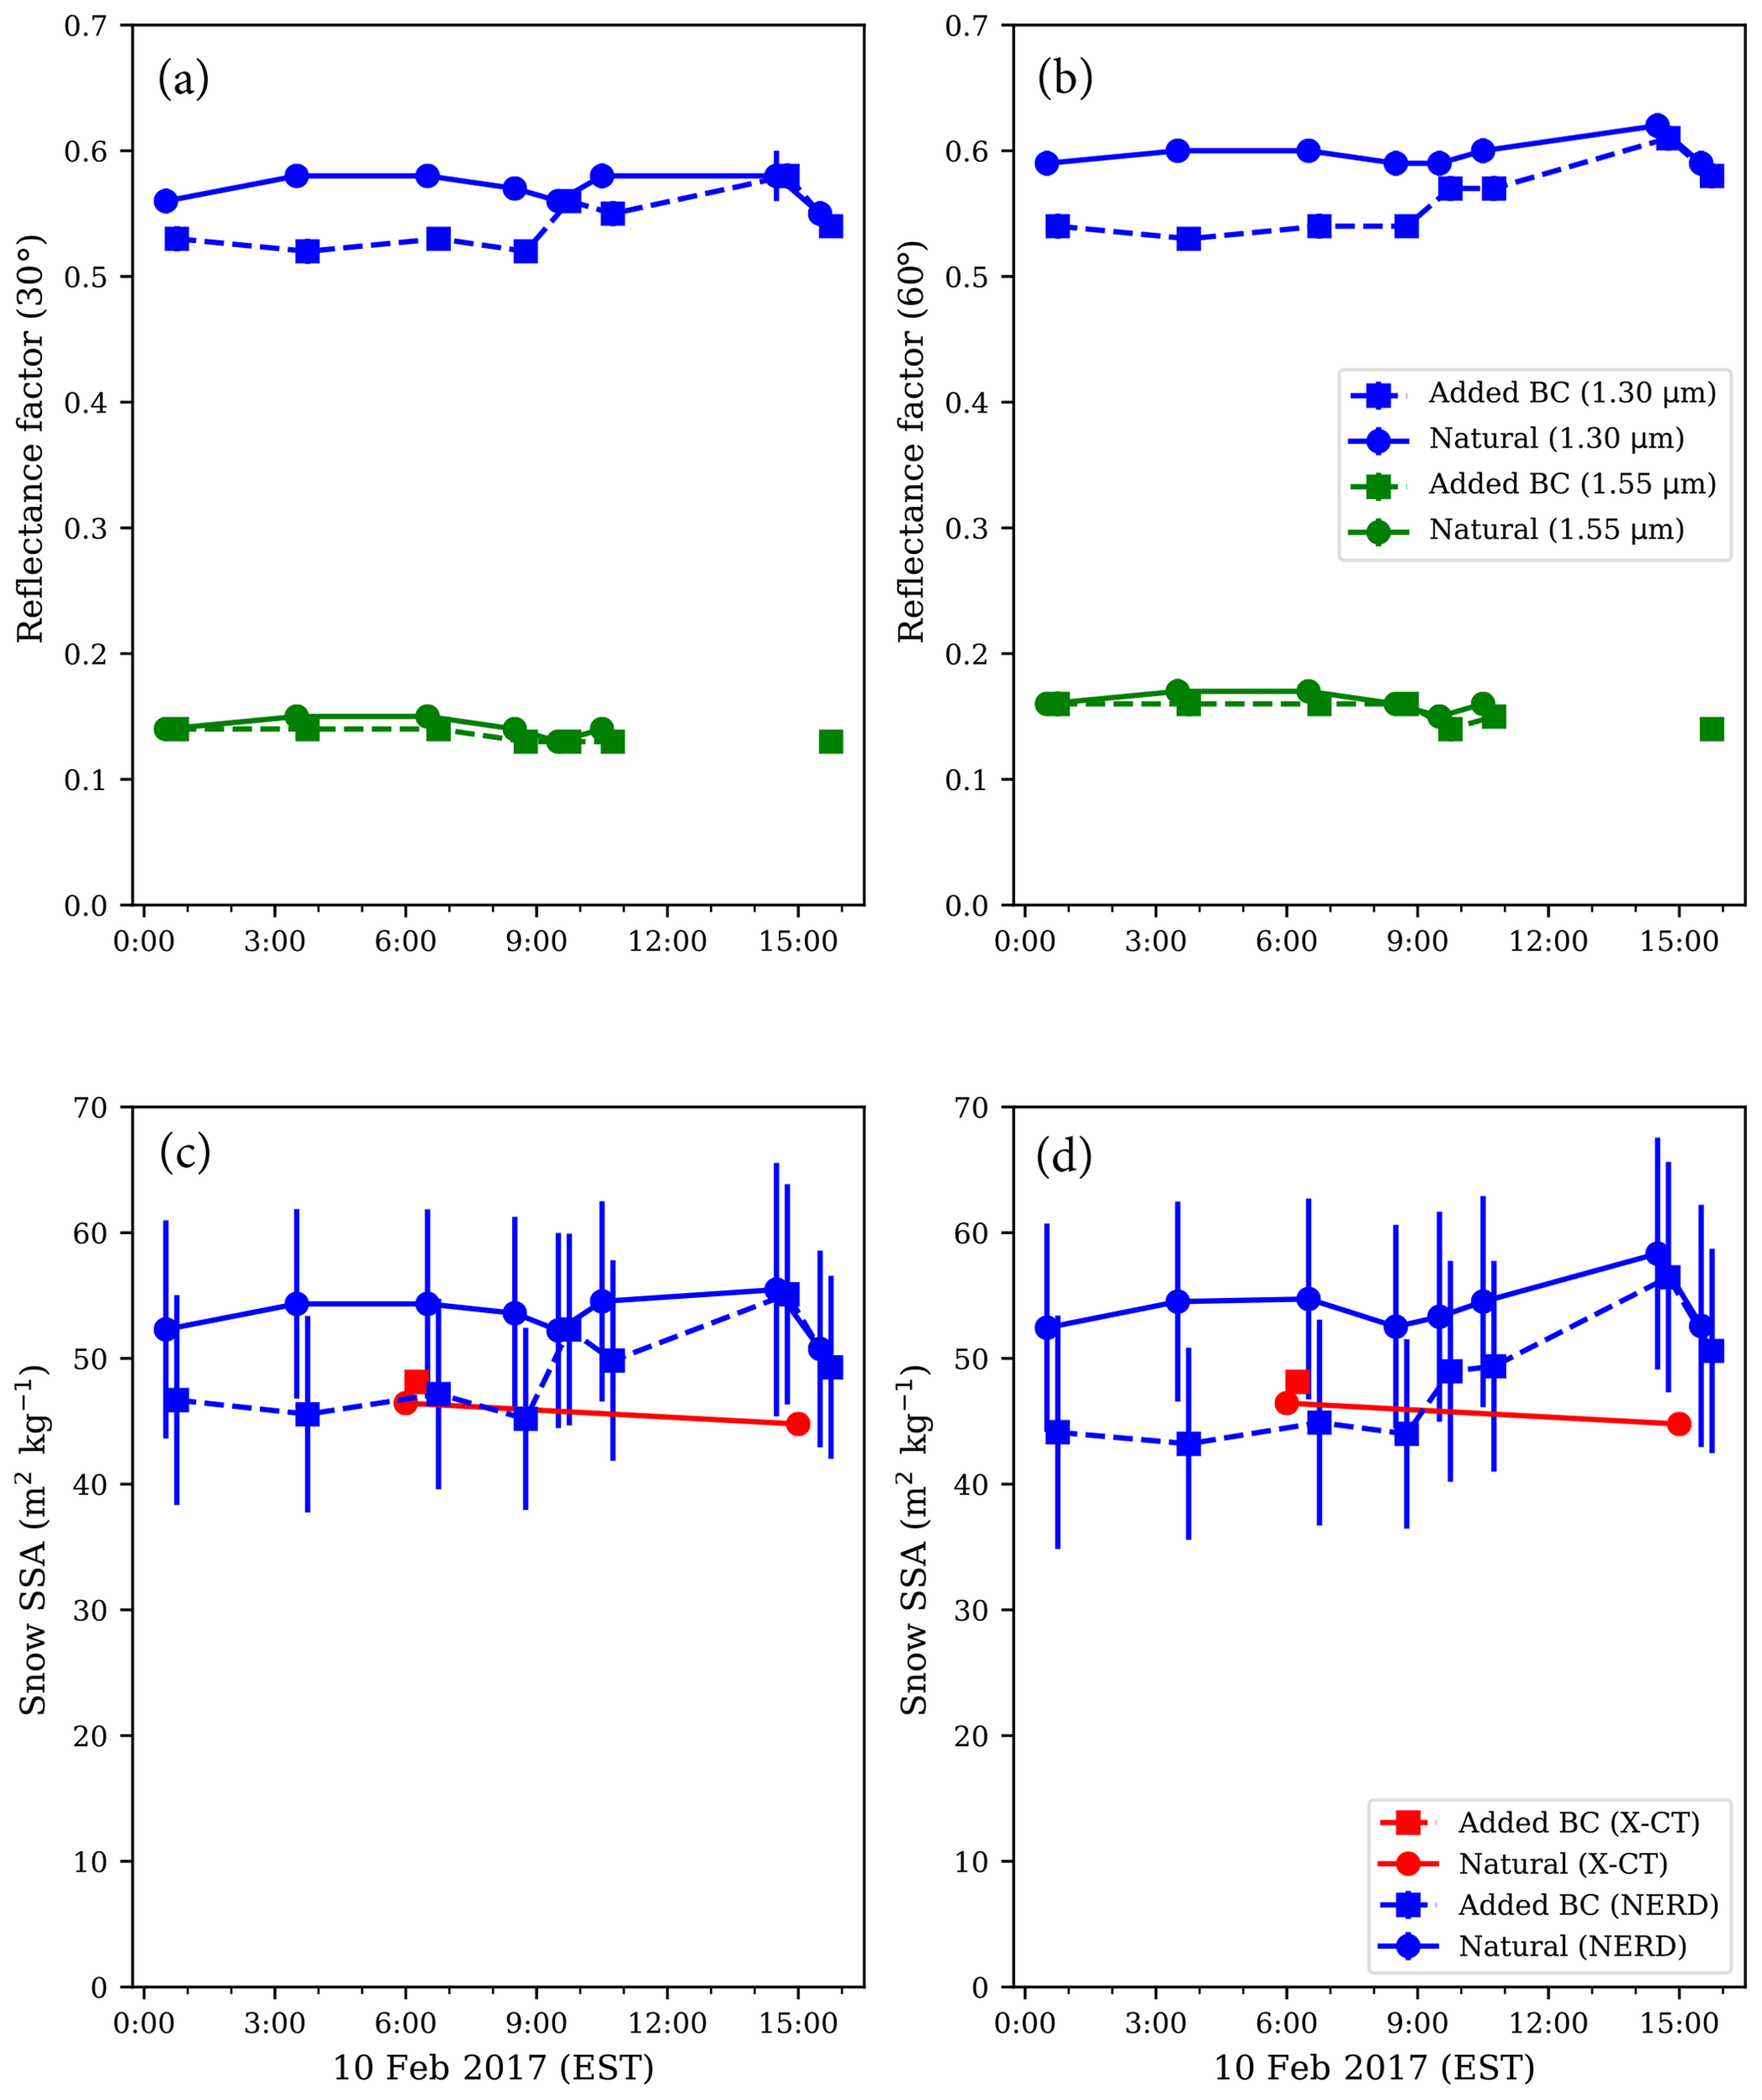
Figure 6The 10 February control results (mostly cloudy). All panels contain NERD measurement data collected from 00:00 through to 17:00 eastern standard time (EST) on 10 February, 2017. Filled circles connected by solid lines represent measurements on natural snow. Filled squares connected by dashed lines represent measurements on snow heavily contaminated by hydrophobic BC. In panels (a) and (b), blue (green) curves represent 1.30 µm (1.55 µm) BRFs at 30∘ viewing (a) and 60∘ viewing (b). Error bars represent standard errors calculated from sample averages from as many as eight locations within each 1 m2 plot. In panels (c) and (d), blue curves represent NERD-calibrated SSAs from 30∘ (c) and 60∘ (d) viewing BRFs. Red curves represent SSAs derived from X-CT scans. Error bars represent NERD calibration uncertainty computed from regression analysis (standard errors of the gradients).
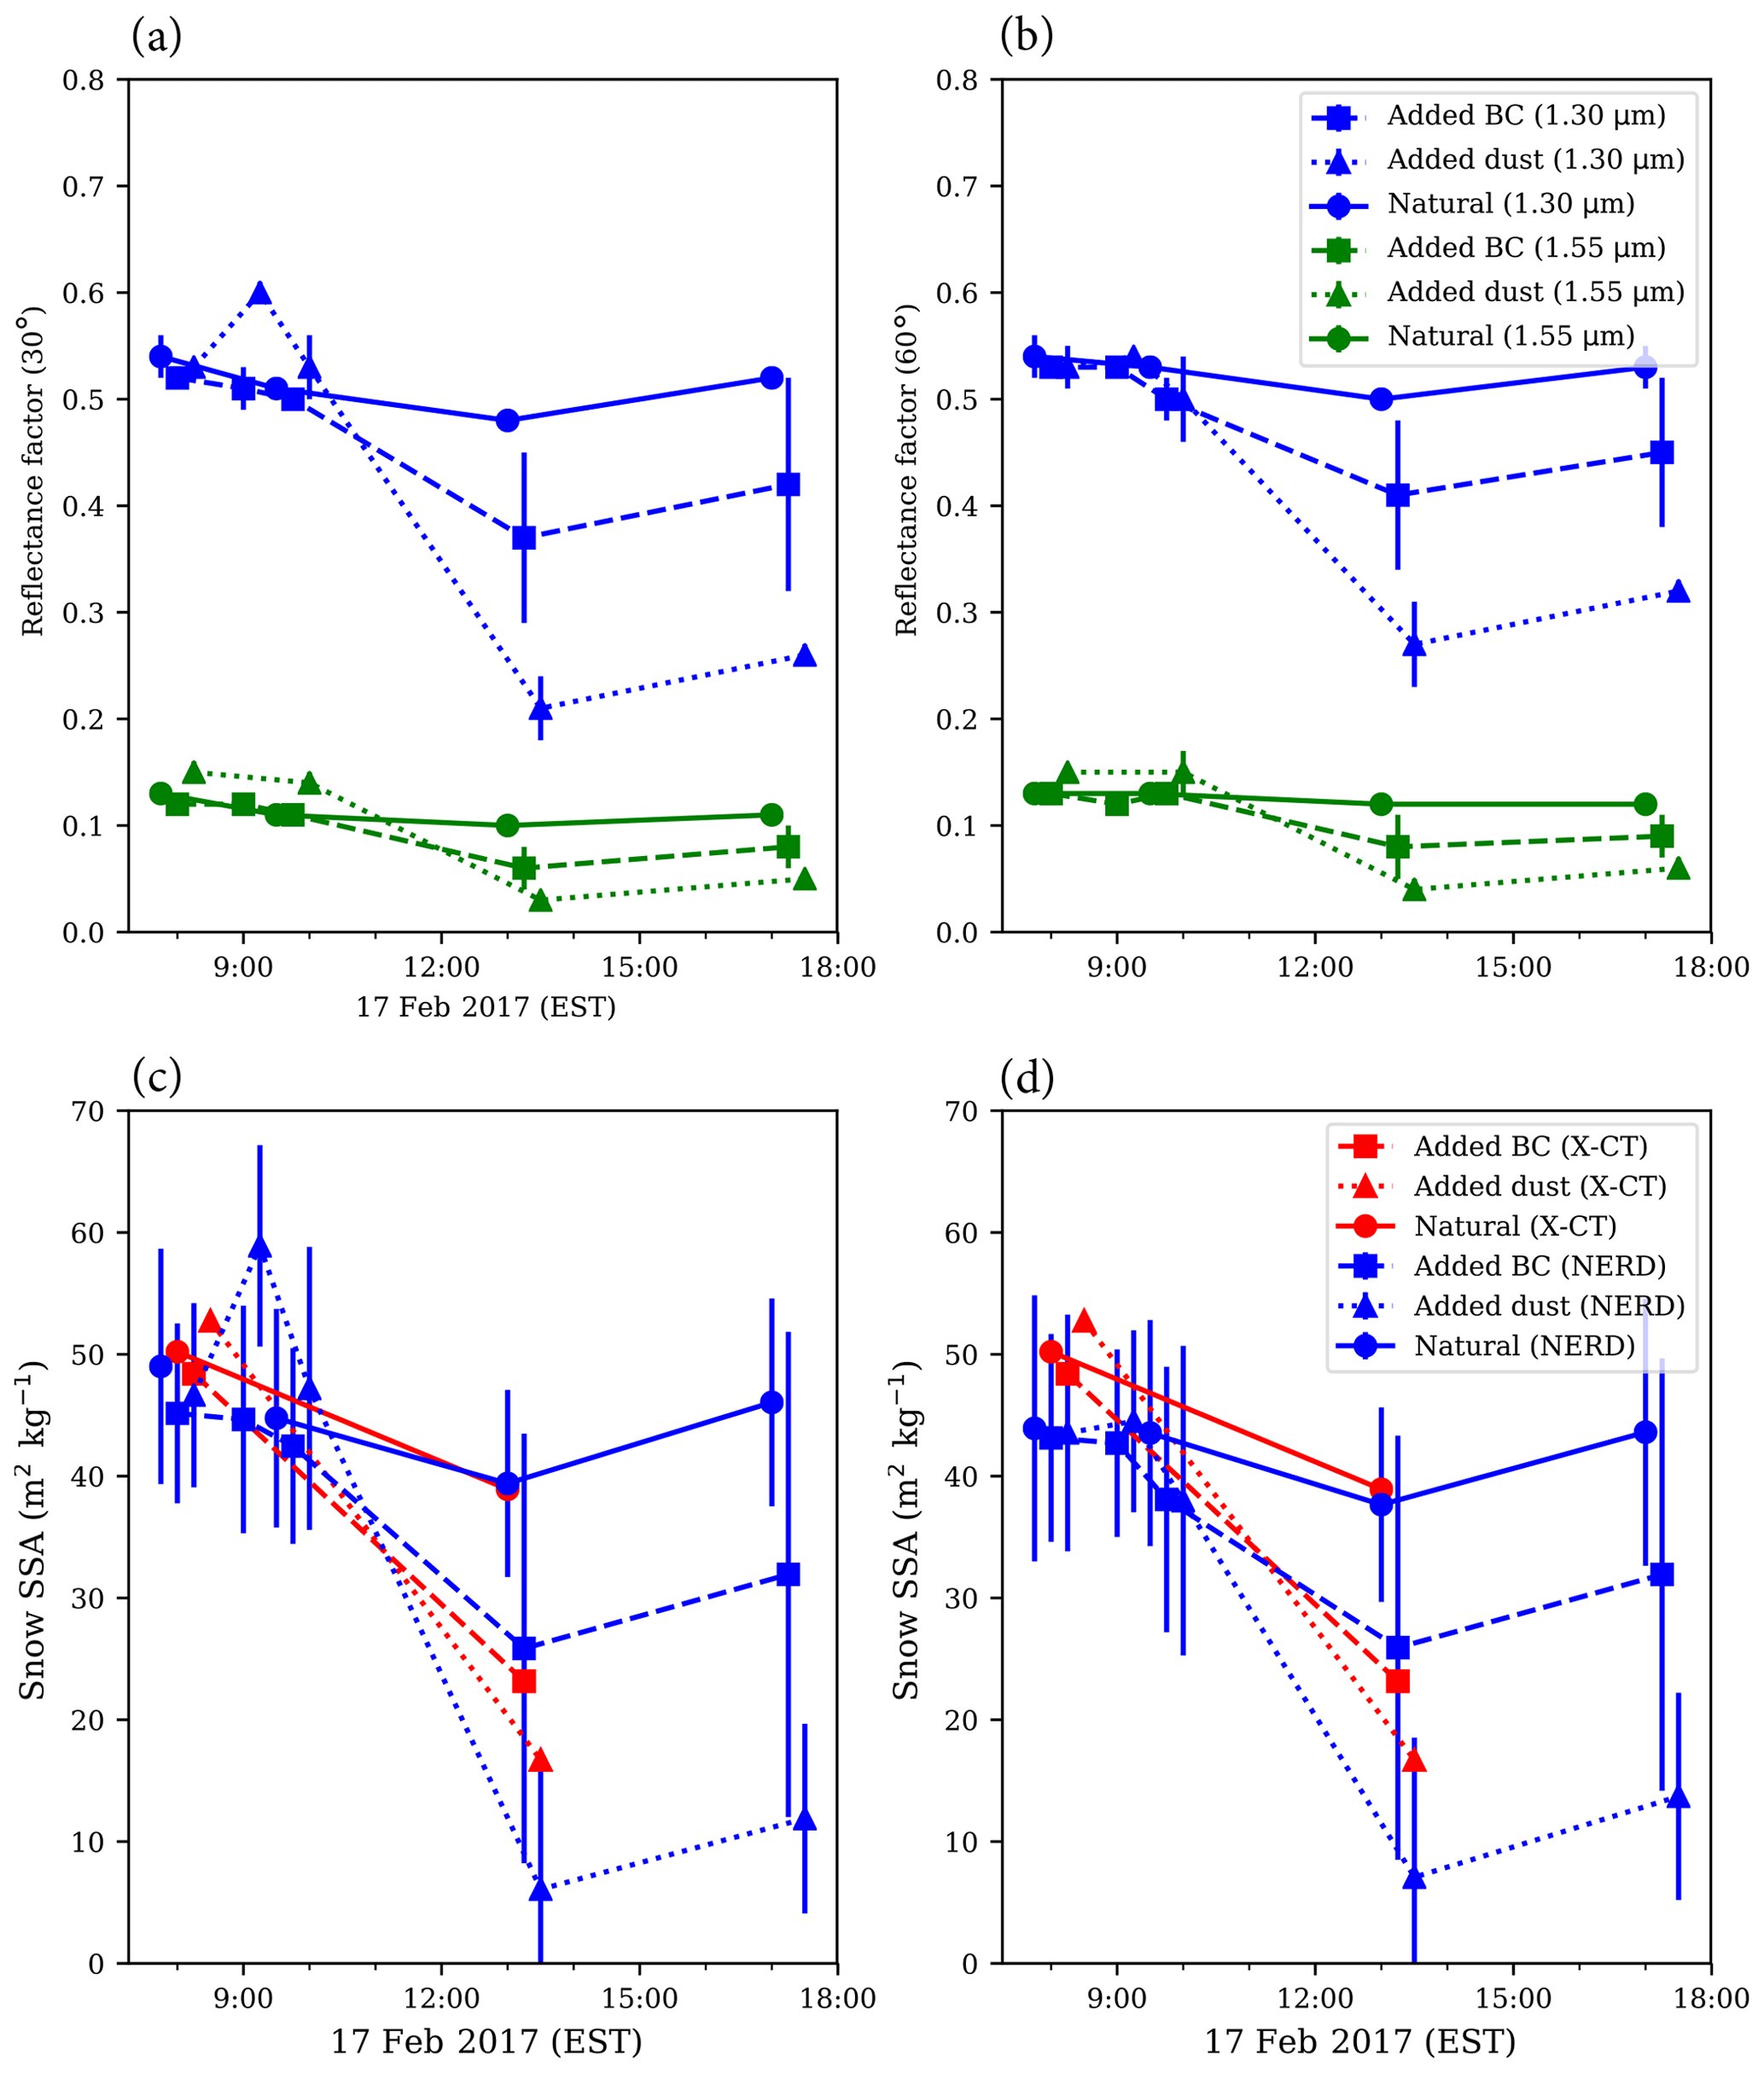
Figure 7The 17 February experimental results (clear sky). All panels contain NERD measurement data collected from 07:00 through to 17:00 EST on 17 February 2017. Filled circles connected by solid lines represent measurements on natural snow. Filled squares connected by dashed lines represent measurements on snow lightly contaminated (<1 g m−2) by hydrophobic BC. Triangles connected by dotted lines represent measurements on snow contaminated by dust (30 g m−2). In panels (a) and (b), blue (green) curves represent 1.30 µm (1.55 µm) BRFs at 30∘ viewing (a) and 60∘ viewing (b). Error bars represent standard errors calculated from sample averages from as many as eight locations within each 1 m2 plot. In panels (c) and (d), blue curves represent NERD-calibrated SSAs from 30∘ (c) and 60∘ (d) viewing BRFs. Red curves represent SSAs derived from X-CT scans. Error bars represent NERD calibration uncertainty computed from regression analysis (standard errors of the gradients).
Second, to monitor snow metamorphism occurring after forced large BC and dust deposition events under direct solar illumination, on 17 February, we set up a similar experiment in full view of the sun. Surface temperatures ranged from −4 to +2 ∘C. We observed minimal wind speeds and cloud cover resulting in calm, clear-sky conditions. BRF measurements conducted shortly after LAPs application indicate minimal direct darkening at 1.30 µm and possibly a small brightening effect by dust at 1.55 µm. In natural snow, 1.30 µm BRFs remained close to 0.5 throughout the day, with the lowest values (0.49) recorded in the afternoon (13:00 EST) and the highest values (0.55) recorded in the morning (08:00 EST) and evening (17:00 EST). The 1.55 µm BRFs remained just above 0.1. In the dust loaded plot, snow 1.30 (1.55) µm BRFs decreased rapidly from above 0.5 (0.1) before 10:00 to below 0.3 (0.05) by 13:00 EST. We found less extreme metamorphism in the lightly contaminated snow with added BC, as BRF measurements decreased from above 0.5 (0.1) to below 0.45 (0.1), 1.30 µm snow BRFs slightly increased thereafter (from 13:00 to 17:00 EST) in both natural and contaminated snow (see Fig. 7). Snow SSA also decreased throughout the day. From X-CT analysis, we found morning snow SSA to be about 50 m2 kg−1, which thereafter decreased to 41, 23, and 18 m2 kg−1 in natural, BC loaded, and dust loaded snow, respectively. NERD-derived snow SSA appears to be biased low in the afternoon dust loaded plot. This bias might be an indication of the presence of liquid water that was also visible to the naked eye. X-CT scans performed on this snow sample are representative of refrozen snow and do not conform to the isothermal snow SSA correction (Eq. 2) applied to snow samples scanned several hours after collection. In BC loaded plots, we observed a large spatial heterogeneity in measurements, indicating that small BC deposition has a powerful localized effect on snow metamorphism.
These results suggest that extreme LAPs deposition can accelerate snow metamorphism. The primary cause of this accelerated process is enhanced absorption of solar radiation by LAPs. Surprisingly, added BC had little to no effect on snow metamorphism during cloudy conditions. In the clear-sky experiments, LAPs enhanced solar absorption at the surface which warmed the snowpack. As the snow surface began to melt, near-infrared reflectance decreased rapidly. Rapidly decreasing near-infrared reflectance is indicative of either the accumulation of liquid water from melting snow or decreasing snow SSA.
Accelerated snow metamorphism by dust loading is consistent with the findings of Skiles and Painter (2017). The indirect effect of LAPs on snow is also demonstrated by Hadley and Kirchstetter (2012) in which the albedo reduction due to the presence of BC in snow is amplified in snow of lower SSA. This enhancement of snow albedo reduction is another source of instability in the snowpack that increases the strength of the snow grain-size feedback. Typical BC deposition events are very small, however, so it is difficult to reproduce natural BC concentrations when adding any BC to a 1 m2 plot.
LAPs in snow accelerated snow metamorphism and enhanced positive grain-size feedback during cloud free, calm weather conditions when surface air temperatures were near 0 ∘C. To observe this effect, we engineered an instrument (i.e., the NERD) that measures 1.30 and 1.55 µm snow BRFs without destroying snow samples. We evaluated the NERD's accuracy, precision, and responsiveness by testing with idealized Lambertian surfaces before obtaining snow BRFs. Notwithstanding the limitations associated with retrieving precise snow SSA from BRFs, we proposed an analytical calibration function relating snow SSA to 1.30 µm BRFs. Our results lead to the conclusion that the NERD can provide estimates of snow SSA to within ±10 m2 kg−1.
The NERD will serve to further study the effects of LAPs on snow metamorphism and to explore the spatial heterogeneity of snow SSA. Because the NERD can also operate quickly, NERD measurements can complement satellite borne observations during narrow sampling windows. To fulfill these pursuits, however, a more comprehensive snow SSA measurement uncertainty assessment is needed to fully validate the NERD technique. Validation would also include additional independent measurement methods on snow samples with a larger snow SSA span from a variety of environmental conditions and further experimentation into the small-scale effects on snow BRF measurements. Further investigation of the natural variability of snow near the surface and the related quantitative uncertainties regarding the NERD snow SSA retrieval method will be the subject of a follow-up study. Such a study will also include snow of higher SSA to determine the utility of 1.55 µm snow BRFs in measuring fresh snow of extremely high SSA as demonstrated by Gallet et al. (2009). This would help expand the utility of the NERD measurement technique for future Arctic and Antarctic campaigns, building on the polar studies conducted by Legagneux et al. (2002) and Libois et al. (2015).
Plot data referenced in this paper and associated Python scripts used to generate figures are made available via the University of Michigan's Deep Blue data repository (Schneider and Flanner, 2018).
To detect reflected radiance signals, photodiodes are reverse biased to induce currents linearly related to the amount of light incident on their active regions. Because these light signals are reflected from the experimental surface, the currents induced by the photodiodes are very small (nano- to microampere). To measure the small currents, the photodiodes are connected to transimpedance amplifiers. The transimpedance amplifier circuits convert and amplify the small photodiode currents into measurable voltage signals.
Two NERDs are engineered with different photodiode current amplifications. Photodiode current amplification is determined by the feedback resistance in the transimpedance amplifier circuits. Active low pass filters are applied between the amplifier and the analog-to-digital converter (ADC) to reduce noise. This filter is designed to have a time constant of less than 0.5 s to achieve balance between adequate noise reduction and speed.
AS curated data, conducted the formal analyses, experiments, and validation, parallelized and expanded the Monte Carlo model, led the prototyping of the NERD hardware and software development, and prepared the figures, tables, and paper. MF led the project conceptualization, funding acquisition, and administration, provided SNICAR modeling results and computational resources, designed the original 3-D Monte Carlo model, and supervised the project. RDR provided study materials and laboratory equipment and helped advise the design principle of the NERD. AA conducted the contact spectroscopy measurements and analyses. All co-authors helped revise the paper throughout the review process.
Mark Flanner is currently an editor of The Cryosphere. We are not aware of any other competing interests associated with the publication of this paper.
The authors would like to thank their colleagues at the Cold Regions Research and Engineering Laboratory (CRREL) in Hanover, New Hampshire, for their generous support. In particular, thanks to Zoe Courville and John Fegyveresi for their hospitality and guidance navigating the facilities at CRREL. We also thank Ross Lieblappen for sharing his micro-computed tomography expertise through providing a thorough tutorial for running and analyzing snow scans.
The authors are thankful for reviews from the three referees. These detailed reviews were helpful in reorganizing the paper and improving the presentation of the key results.
This research has been supported by the National Science Foundation (grant no. ARC-1253154).
This paper was edited by Guillaume Chambon and reviewed by Marie Dumont and two anonymous referees.
Arnaud, L., Picard, G., Champollion, N., Domine, F., Gallet, J., Lefebvre, E., Fily, M., and Barnola, J.: Measurement of vertical profiles of snow specific surface area with a 1 cm resolution using infrared reflectance: instrument description and validation, J. Glaciol., 57, 17–29, https://doi.org/10.3189/002214311795306664, 2011. a, b
Bond, T. C., Doherty, S. J., Fahey, D. W., Forster, P. M., Berntsen, T., DeAngelo, B. J., Flanner, M. G., Ghan, S., Kärcher, B., Koch, D., Kinne, S., Kondo, Y., Quinn, P. K., Sarofim, M. C., Schultz, M. G., Schulz, M., Venkataraman, C., Zhang, H., Zhang, S., Bellouin, N., Guttikunda, S. K., Hopke, P. K., Jacobson, M. Z., Kaiser, J. W., Klimont, Z., Lohmann, U., Schwarz, J. P., Shindell, D., Storelvmo, T., Warren, S. G., and Zender, C. S.: Bounding the role of black carbon in the climate system: A scientific assessment: BLACK CARBON IN THE CLIMATE SYSTEM, J. Geophys. Res.-Atmos., 118, 5380–5552, https://doi.org/10.1002/jgrd.50171, 2013. a
Brandt, R. E. and Warren, S. G.: Solar-heating rates and temperature profiles in Antarctic snow and ice, J. Glaciol., 39, 99–110, https://doi.org/10.3189/S0022143000015756, 1993. a
Dang, C., Fu, Q., and Warren, S. G.: Effect of Snow Grain Shape on Snow Albedo, J. Atmos. Sci., 73, 3573–3583, https://doi.org/10.1175/JAS-D-15-0276.1, 2016. a
Domine, F., Salvatori, R., Legagneux, L., Salzano, R., Fily, M., and Casacchia, R.: Correlation between the specific surface area and the short wave infrared (SWIR) reflectance of snow, Cold Reg. Sci. Technol., 46, 60–68, https://doi.org/10.1016/j.coldregions.2006.06.002, 2006. a
Dumont, M., Brissaud, O., Picard, G., Schmitt, B., Gallet, J.-C., and Arnaud, Y.: High-accuracy measurements of snow Bidirectional Reflectance Distribution Function at visible and NIR wavelengths – comparison with modelling results, Atmos. Chem. Phys., 10, 2507–2520, https://doi.org/10.5194/acp-10-2507-2010, 2010. a, b, c
Ebner, P. P., Schneebeli, M., and Steinfeld, A.: Tomography-based monitoring of isothermal snow metamorphism under advective conditions, The Cryosphere, 9, 1363–1371, https://doi.org/10.5194/tc-9-1363-2015, 2015. a, b
Fierz, C., Armstrong, R., Durand, Y., Etchevers, P., Greene, E., McClung, D., Nishimura, K., Satyawali, P., and Sokratov, S.: The International Classification for Seasonal Snow on the Ground, International Hydrological Programme (IHP) of the United Nations Educational, Scientific and Cultural Organization (UNESCO), Paris, France, 2009. a, b, c
Flanner, M. G. and Zender, C. S.: Linking snowpack microphysics and albedo evolution, J. Geophys. Res., 111, D12208, https://doi.org/10.1029/2005JD006834, 2006. a
Flanner, M. G., Zender, C. S., Randerson, J. T., and Rasch, P. J.: Present-day climate forcing and response from black carbon in snow, J. Geophys. Res., 112, D11202, https://doi.org/10.1029/2006JD008003, 2007. a, b, c
Flanner, M. G., Zender, C. S., Hess, P. G., Mahowald, N. M., Painter, T. H., Ramanathan, V., and Rasch, P. J.: Springtime warming and reduced snow cover from carbonaceous particles, Atmos. Chem. Phys., 9, 2481–2497, https://doi.org/10.5194/acp-9-2481-2009, 2009. a
Gallet, J.-C., Domine, F., Zender, C. S., and Picard, G.: Measurement of the specific surface area of snow using infrared reflectance in an integrating sphere at 1310 and 1550 nm, The Cryosphere, 3, 167–182, https://doi.org/10.5194/tc-3-167-2009, 2009. a, b, c, d, e, f, g, h
Gallet, J.-C., Domine, F., and Dumont, M.: Measuring the specific surface area of wet snow using 1310 nm reflectance, The Cryosphere, 8, 1139–1148, https://doi.org/10.5194/tc-8-1139-2014, 2014. a, b
Gergely, M., Wolfsperger, F., and Schneebeli, M.: Simulation and Validation of the InfraSnow: An Instrument to Measure Snow Optically Equivalent Grain Size, IEEE T. Geosci. Remote, 52, 4236–4247, https://doi.org/10.1109/TGRS.2013.2280502,, 2014. a, b
Grenfell, T. C., Warren, S. G., and Mullen, P. C.: Reflection of solar radiation by the Antarctic snow surface at ultraviolet, visible, and near-infrared wavelengths, J. Geophys. Res., 99, 18669, https://doi.org/10.1029/94JD01484, 1994. a, b
Hadley, O. L. and Kirchstetter, T. W.: Black-carbon reduction of snow albedo, Nat. Clim. Change, 2, 437–440, https://doi.org/10.1038/nclimate1433,, 2012. a, b
Hagenmuller, P., Matzl, M., Chambon, G., and Schneebeli, M.: Sensitivity of snow density and specific surface area measured by microtomography to different image processing algorithms, The Cryosphere, 10, 1039–1054, https://doi.org/10.5194/tc-10-1039-2016, 2016. a
Hall, A.: The Role of Surface Albedo Feedback in Climate, J. Climate, 17, 1550–1568, https://doi.org/10.1175/1520-0442(2004)017<1550:TROSAF>2.0.CO;2, 2004. a
Hudson, S. R., Warren, S. G., Brandt, R. E., Grenfell, T. C., and Six, D.: Spectral bidirectional reflectance of Antarctic snow: Measurements and parameterization, J. Geophys. Res., 111, D18106, https://doi.org/10.1029/2006JD007290, 2006. a
Kaempfer, T. U., Hopkins, M. A., and Perovich, D. K.: A three-dimensional microstructure-based photon-tracking model of radiative transfer in snow, J. Geophys. Res., 112, D24113, https://doi.org/10.1029/2006JD008239, 2007. a, b
Kokhanovsky, A. A. and Zege, E. P.: Scattering optics of snow, Appl. Optics, 43, 1589, https://doi.org/10.1364/AO.43.001589, 2004. a, b
Legagneux, L. and Domine, F.: A mean field model of the decrease of the specific surface area of dry snow during isothermal metamorphism: Model Of Snow Surface Area Decrease, J. Geophys. Res.-Earth, 110, F04011, https://doi.org/10.1029/2004JF000181, 2005. a
Legagneux, L., Cabanes, A., and Dominé, F.: Measurement of the specific surface area of 176 snow samples using methane adsorption at 77 K: Measurement Using Methane Adsorption At 77 K, J. Geophys. Res.-Atmos., 107, ACH 5-1–ACH 5-15, https://doi.org/10.1029/2001JD001016, 2002. a, b
Legagneux, L., Taillandier, A.-S., and Domine, F.: Grain growth theories and the isothermal evolution of the specific surface area of snow, J. Appl. Phys., 95, 6175–6184, https://doi.org/10.1063/1.1710718, 2004. a
Libois, Q., Picard, G., Arnaud, L., Dumont, M., Lafaysse, M., Morin, S., and Lefebvre, E.: Summertime evolution of snow specific surface area close to the surface on the Antarctic Plateau, The Cryosphere, 9, 2383–2398, https://doi.org/10.5194/tc-9-2383-2015, 2015. a
Lieb-Lappen, R., Golden, E., and Obbard, R.: Metrics for interpreting the microstructure of sea ice using X-ray micro-computed tomography, Cold Reg. Sci. Technol., 138, 24–35, https://doi.org/10.1016/j.coldregions.2017.03.001, 2017. a
Malinka, A. V.: Light scattering in porous materials: Geometrical optics and stereological approach, J. Quant. Spectrosc. Ra., 141, 14–23, https://doi.org/10.1016/j.jqsrt.2014.02.022, 2014. a
Matzl, M. and Schneebeli, M.: Measuring specific surface area of snow by near-infrared photography, J. Glaciol., 52, 558–564, https://doi.org/10.3189/172756506781828412, 2006. a
Nicodemus, F., Richmond, J., Hsia, J., Ginsberg, I., and Limperis, T.: Geometrical considerations and nomenclature for reflectance, U.S. Department of Commerce, National Bureau of Standards, Washington, D.C., USA, 1977. a
Nolin, A. W. and Dozier, J.: A Hyperspectral Method for Remotely Sensing the Grain Size of Snow, Remote Sens. Environ., 74, 207–216, https://doi.org/10.1016/S0034-4257(00)00111-5, 2000. a
Painter, T. H., Molotch, N. P., Cassidy, M., Flanner, M., and Steffen, K.: Contact spectroscopy for determination of stratigraphy of snow optical grain size, J. Glaciol., 53, 121–127, https://doi.org/10.3189/172756507781833947, 2007. a, b
Picard, G., Arnaud, L., Domine, F., and Fily, M.: Determining snow specific surface area from near-infrared reflectance measurements: Numerical study of the influence of grain shape, Cold Reg. Sci. Technol., 56, 10–17, https://doi.org/10.1016/j.coldregions.2008.10.001, 2009. a, b, c
Pinzer, B. R. and Schneebeli, M.: Snow metamorphism under alternating temperature gradients: Morphology and recrystallization in surface snow, Geophys. Res. Lett., 36, L23503, https://doi.org/10.1029/2009GL039618, 2009. a, b
Qian, Y., Yasunari, T. J., Doherty, S. J., Flanner, M. G., Lau, W. K. M., Ming, J., Wang, H., Wang, M., Warren, S. G., and Zhang, R.: Light-absorbing particles in snow and ice: Measurement and modeling of climatic and hydrological impact, Adv. Atmos. Sci., 32, 64–91, https://doi.org/10.1007/s00376-014-0010-0, 2015. a
Qu, X. and Hall, A.: What Controls the Strength of Snow-Albedo Feedback?, J. Climate, 20, 3971–3981, https://doi.org/10.1175/JCLI4186.1, 2007. a
Ramella-Roman, J. C., Prahl, S. A., and Jacques, S. L.: Three Monte Carlo programs of polarized light transport into scattering media: part-I, Opt. Express, 13, 4420, https://doi.org/10.1364/OPEX.13.004420, 2005. a
Schneider, A. and Flanner, M.: Supporting data for the Near-Infrared Emitting and Reflectance-Monitoring Dome, type: dataset, https://doi.org/10.7302/Z23F4MVC, 2018. a
Skiles, S. M. and Painter, T.: Daily evolution in dust and black carbon content, snow grain size, and snow albedo during snowmelt, Rocky Mountains, Colorado, J. Glaciol., 63, 118–132, https://doi.org/10.1017/jog.2016.125, 2017. a, b
Skiles, S. M., Flanner, M., Cook, J. M., Dumont, M., and Painter, T. H.: Radiative forcing by light-absorbing particles in snow, Nat. Clim. Change, 8, 964–971, https://doi.org/10.1038/s41558-018-0296-5, 2018. a
Smith, B. E., Gardner, A., Schneider, A., and Flanner, M.: Modeling biases in laser-altimetry measurements caused by scattering of green light in snow, Remote Sens. Environ., 215, 398–410, https://doi.org/10.1016/j.rse.2018.06.012, 2018. a
van de Hulst, H.: Asymptotic fitting, a method for solving anisotropic transfer problems in thick layers, J. Comput. Phys., 3, 291–306, https://doi.org/10.1016/0021-9991(68)90023-5, 1968. a
Vouk, V.: Projected Area of Convex Bodies, Nature, 162, 330–331, https://doi.org/10.1038/162330a0, 1948. a
Wang, X. and Baker, I.: Evolution of the specific surface area of snow during high-temperature gradient metamorphism, J. Geophys. Res.-Atmos., 119, 13690–13703, https://doi.org/10.1002/2014JD022131, 2014. a
Warren, S. G. and Wiscombe, W. J.: A Model for the Spectral Albedo of Snow. II: Snow Containing Atmospheric Aerosols, J. Atmos. Sci., 37, 2734–2745, https://doi.org/10.1175/1520-0469(1980)037<2734:AMFTSA>2.0.CO;2, 1980. a
Yang, P., Bi, L., Baum, B. A., Liou, K.-N., Kattawar, G. W., Mishchenko, M. I., and Cole, B.: Spectrally Consistent Scattering, Absorption, and Polarization Properties of Atmospheric Ice Crystals at Wavelengths from 0.2 to 100 µm, J. Atmos. Sci., 70, 330–347, https://doi.org/10.1175/JAS-D-12-039.1, 2013. a, b