the Creative Commons Attribution 4.0 License.
the Creative Commons Attribution 4.0 License.
 | 20 May 2019
Brief communication: Full-field deformation measurement for uniaxial compression of sea ice using the digital image correlation method
Anliang Wang
Zhijun Wei
Xiaodong Chen
Shunying Ji
Yu Liu
Longbang Qing
The study of the mechanical properties of sea ice benefits the parameterization of sea-ice numerical models and the optimization of engineering design. Deformation measurement of sea ice has been seen as the essential foundation for the study of these properties. However, this measurement has proved to be difficult due to the complex and nonhomogeneous mechanical properties of sea ice. In this paper, we took advantage of DIC (digital image correlation) to obtain the full-field displacement and strain of sea-ice specimens in a uniaxial compression experiment. Full-field deformations of sea ice under both vertical and horizontal loading were measured. Different mechanical behaviors such as microcracks and failure modes due to the anisotropic properties of sea ice were successfully captured. The nonuniformity and local concentration of the strain field were observed and analyzed. Additionally, we evaluated the displacement and strain field of the specimens to verify the feasibility and accuracy of the method. This successful application provides a convenient and powerful option for the study of sea-ice mechanical properties including failure modes, nonlinear behavior and crack propagation.
- Article
(4571 KB) - Full-text XML
- BibTeX
- EndNote


Human activities in polar areas have been increasing as more space becomes available to be exploited (Laliberté et al., 2016; Rabatel et al., 2018). This trend calls for better numerical models of sea ice and cold region technology to reduce risks posed by the ice (Rabatel et al., 2018). Studies of the mechanical properties of sea ice are believed to have made such contributions (e.g., Timco and Weeks, 2010; Shokr and Sinha, 2015; Weiss and Dansereau, 2017). For example, the strength of flexure and compression (Ji et al., 2011), failure and fracture mode (Schulson et al., 2006; Weiss, 2013; Lian et al., 2017), and the Young modulus and Poisson ratio (Schulson and Duval, 2009) are all essential for the parameterization of sea-ice models (Hibler, 1979; Feltham, 2008; Weiss and Dansereau, 2017) and the optimization of polar engineering designs (Ibrahim et al., 2007). Deformation measurements at the laboratory scale are an essential foundation of those studies. However, it has been found to be difficult to measure the deformation due to the complex material properties of sea ice (Cole, 2001), even under the controlled conditions of a well-equipped laboratory (Sinha, 1984; Moslet, 2007). In particular, the measurement of full-field deformation has not been reported for sea-ice specimens.
In traditional ice mechanics, displacement actuators, strain gauges and extensometers are occasionally applied to measure the deformation of specimens (Moslet, 2007; Schulson and Duval, 2009; Timco and Weeks, 2010). The equipment for measuring displacement is generally installed onto the specimen's surface. Thus, the operation sometimes causes local damage and subsequently increases the local stress concentration. Another option is to obtain the equivalent displacement of the specimen from an indenter (Schulson and Duval, 2009; Wang et al., 2018). The loading surface of the specimen and indenter on it move together and thus have the same displacement all the time. Therefore, the strain of the specimens can be deduced from the displacement of indenter without considering the deformation of the rig itself. This method provides only one value to represent the overall deformation of the specimen, even under the assumption that the loading system has sufficient stiffness compared with that of the sea-ice specimen. For sea-ice material, the local variation in deformation cannot be ignored due to the existence of brine pockets and air bubbles inside the material (Schulson and Duval, 2009; Li et al., 2011). Therefore, full-field deformation is needed to capture the local conditions of sea-ice specimens and depict the failure characteristics during the loading process.
Fortunately, the digital image correlation (DIC) method has been developed (Sutton et al., 2009, 2016), which is suitable for deformation measurements. Based on DIC, full-field displacement and strain can be accurately obtained by comparing the digital images of specimen surfaces for the initial and deformed states (Pan et al., 2009). This method has been widely used in many fields to obtain the full-field deformation (Sutton et al., 2016). Recently, Lian et al. (2017) used DIC to investigate the uniaxial compressive strength and fracture mode of natural lake ice under moderate strain rates. They found that the strain rate calculated from DIC is quite different from that deduced from actuator displacement under dynamic loading conditions (Lian et al., 2017). Based on the DIC technique, the full-field deformation is accurately deduced and the damage process of the specimen is clearly obtained at a high spatiotemporal resolution (Lian et al., 2017). In fact, a similar principle has been applied to sea-ice satellite images to compute the velocity and strain fields on a geophysical scale (Muckenhuber and Sandven, 2017). Nevertheless, we are not aware of the application of DIC in sea-ice mechanical property experiments in the laboratory or in situ. This is partly due to the complex material properties and intricate mechanical behaviors of sea ice, which make such applications more difficult.
In this paper, we attempt to apply the DIC technique to a sea-ice uniaxial compression experiment in situ. First, we introduce the experimental procedure and briefly interpret the DIC theory. Then the displacement and the strain field of specimens are illustrated and analyzed to certify the feasibility and accuracy of the method. To our knowledge, this is the first attempt to experimentally capture sequential full-field deformations in the mechanical properties of sea ice. This achievement will extend the ability to further explore the complex mechanical behaviors of sea ice.
2.1 Specimens and equipment
The experiment was carried out at the Bayuquan ocean station (40∘07′15.32′′ N, 121∘57′34.77′′ E) in Liaodong Bay, where there is an ice-covered season of approximately 3 months each year. A large ice block 1.0 m × 1.0 m × 30 cm (the latter being the thickness) was cut from a level ice sheet using a chain saw. Meanwhile, we measured the salinity of seawater and collected several pieces of sea ice for salinity measurements. The crystal structure of the ice was columnar with a column diameter of approximately 4 mm. The seawater salinity was 33 ppt at the sampling site, and the ice salinities were between 5.5 and 7.4 ppt with a mean value of 6.1 ppt. The environmental temperature during our experiment was about −10 ∘C, and the ice temperatures were between −4.5 and −5.6 ∘C with a mean value of −4.9 ∘C. These ice blocks were finely processed into cuboid specimens with sizes of 50 mm × 50 mm × 107 mm using a band saw. This size ensured that the specimens contained enough ice crystals to avoid grain boundary effects (Timco and Weeks, 2010; Ji et al., 2011) and to meet the maximum load requirement of 3 t for our loading system.

Figure 1Specimen preparation, definition of coordinates and loading system. (a) Black/white speckles from spraying the oil paints onto the specimen surfaces. (b–c) The matching process between the initial subset and the deformed subset. (d) A magnified section of the prepared specimen corresponding to the yellow line in panel (a). (e) The load applied the specimen from bottom to top.
To obtain a high-contrast speckle pattern, we first sprayed white paint uniformly onto the specimen's surface as the background and then sprayed black paint randomly to produce speckles on the white surface, as shown in Fig. 1a. The specimen surface tended to be flat and smooth after the white paint was sprayed at least four times. Every spraying required an interval of 10 min. Half an hour or more after applying the white paint, the black paint was sprayed onto the white surface. During spray-painting, we kept the outlet of the black paint a specific distance – greater than 40 cm – from the white surface. This control ensured that the mist of black paint randomly fell onto the white surface and resulted in a random gray intensity pattern on the surface. Note that touching the sprayed surface of the specimen was forbidden during the experiment to prevent the contamination of the speckle pattern. After sitting for at least 2 h following the spray-painting, the specimens were ready for the compression experiment.
The experimental system mainly consisted of an optical image acquisition device and loading system. The CCD (charge coupled device) camera and high-intensity light source were the major components of the former. The camera was a Basler acA 1600-20gm with a resolution of 1200 pixels × 1600 pixels. This resolution assured an approximate specimen surface of 500 pixels × 1070 pixels, which was tantamount to 0.1±0.005 mm per pixel for each frame. The camera was placed parallel to the specimen's surface, and an appropriate distance was maintained between them – greater than 2.5 m in our experiment. This arrangement was used to alleviate the influence of the out-of-plane deformation (Pan et al., 2009; Sutton et al, 2009). The camera had a frequency of 20 fps (frames per second) to trace the deformation of the specimen surface. With respect to the loading system, the load was applied from the bottom to the top using a servomotor, which was located at the bottom of the apparatus and could supply the maximum force requirement of 3 t with a constant speed of 0.001–0.8 mm s−1. Here, we used a low loading speed of 0.05 mm s−1. Therefore, the frequency of the CCD camera was sufficient to capture the development of the full-field deformations. The time history of the load and displacement of the indenter were simultaneously recorded by the loading system.
2.2 Methods
The DIC method computes deformation information by matching the speckles on the specimen's surface before and after the loading stages. Generally, the equilateral grids are virtually assigned on the (specimen's) region of interest. The center of the subset carries the displacement information, as illustrated in Fig. 1b and c. The subset generally consists of an area of (M+1) pixel × (M+1) pixel. After the assignment of the subsets, the appropriate matching method for the centers between the initial image and the deformed image can be determined. Considering the robust noise-proof performance, we used the following correlation criterion (Pan et al., 2009):
where fij and gij are gray-level functions for the initial image and the deformed image, respectively; and Δf are defined as and in the initial image; and the same definitions of and Δg are calculated depending on gij in the deformed image. When the correlation coefficient C reaches the extrema, the center point of the subset in the initial image is matched to the deformed image. Figure 1b and c illustrate that the displacement u of the center point is computed according to the matching information.
Based on the displacement information of the center point at the initial subset, we can further obtain the displacement field for all points. Under the assumption that the deformation is continuous, all of the neighboring points in the deformed image remain in the same order in the deformed image. Therefore, all of the coordinates around the center point in Fig. 1b can be mapped to the points of the deformed subset in Fig. 1c according to the shape function, similar to the finite element method. Finally, we obtained the displacement and strain field for the entire surface of the specimen.
2.3 Image processing
The whole process flowchart of the DIC method is shown in Fig. 2. The detailed steps mainly include the following: (1) capturing speckle images before and after deformation; (2) drawing continuous analysis region(s) and setting DIC parameters, such as subset radius and subset spacing; (3) performing the initial guess and nonlinear optimization to obtain the whole displacement fields; (4) smoothing the displacement fields, after which the stain fields can be obtained by solving the gradients of displacements.
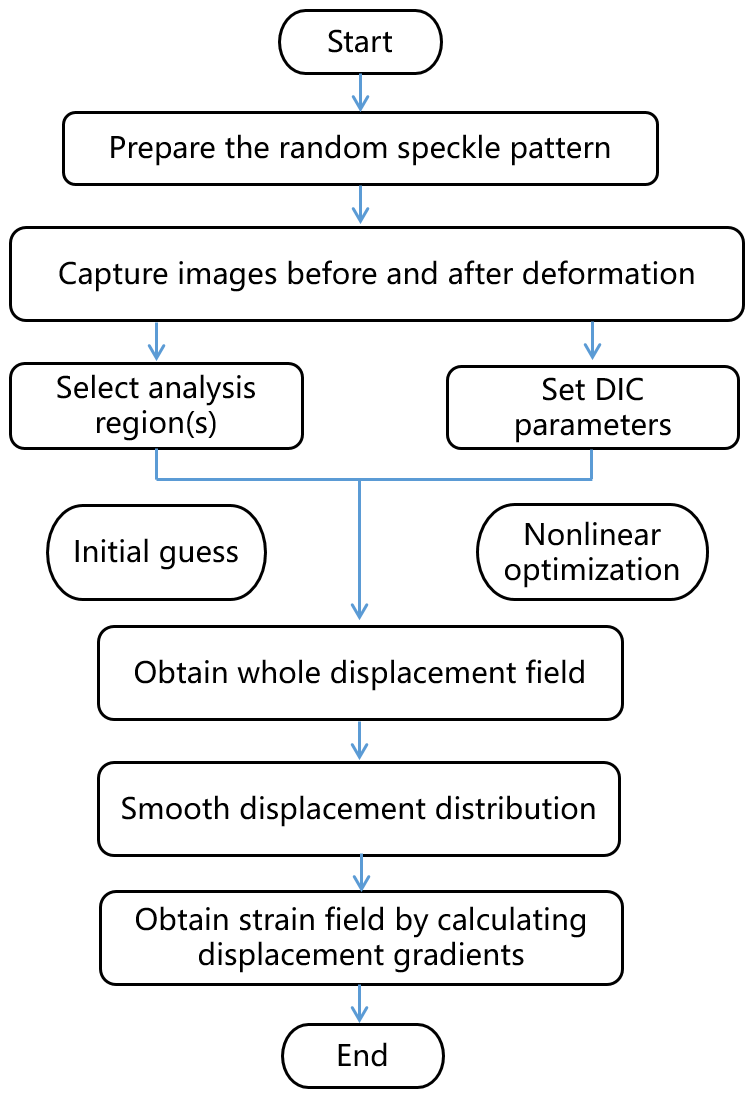
In practice, some open source codes on Github can be used to carry out the implementation of DIC, such as ncorr_2D_matlab (https://github.com/justinblaber/ncorr_2D_matlab, last access: 18 April 2019) and DICe (https://github.com/dicengine/dice, last access: 18 April 2019), which are followed by some manual files. Basically, the abovementioned resources are good options when applying the DIC method to study sea-ice mechanical properties.
Full-field deformations of sea ice under both vertical and horizontal loading directions were measured. These two loading directions are defined in reference to the ice crystal orientation, which is parallel to the vertical loading direction and perpendicular to the horizontal loading direction. Basically, the loading direction can influence the mechanical behaviors due to the anisotropic properties of sea ice (Timco and Weeks, 2010). In our experiment, DIC was able to capture these mechanical characteristics by full-field deformation.
The displacement and strain fields for the x direction and the y direction were obtained based on the images of the ice surface, as shown in Fig. 1d. Here, all of the strain fields were computed corresponding to the definition of nominal strain. The coordinates were defined according to Fig. 1b and c. In this experiment, minus and plus signs represented compressive and tensile deformation, respectively. We tested a total of seven samples in the experiments, three of which were subjected to vertical loading. However, the failure processes of the three samples were not captured by the DIC technique, as the black/white speckled surface was not the surface where the failure process occurred. In order to implement DIC analysis, the region of interest for digital image was selected as 50 mm × 105 mm on the specimen's surface. Figure 3 shows the evolution of the strain fields for the different loading stages. The full-field strain showed nonuniformity under both vertical and horizontal loading, and the localization appears to be significant in Fig. 3a and b. Even during the early stages before yielding, which were identified by the displacement–load curve of the indenter in Fig. 3c, the nonuniformity remained the same as that in the following plastic stage. For example, Fig. 3a exhibits strain fields for the x direction and the y direction corresponding to four time points (H1, H2, H3 and H4) that are marked on the displacement–load curve in Fig. 3c; point H3 is the instant when the maximum load occurs. The first two columns obviously present irregular strain distributions, although they are in the early stages before yielding. In particular, some of the bottom parts of the specimens experienced larger strain values than other regions. This trend became more obvious as the load applied to the specimen increased. A more perceptible trend occurred in the strain field of the x direction, and the relatively large values were apparently concentrated in the bottom parts of the specimens. This coincidence between the x direction and the y direction strain fields may mean that local failure began in the bottom parts of some the specimens, but the time points of H1 and H2 were still in the early stages before yielding according to the displacement–load curve in Fig. 3c. Unlike the typical metal displacement–load curve, sea ice had no clear yield points in Fig. 3c. Here, we took points located in the linear segment of the displacement–load curve for elastic analysis. As we predicted, the specimens under vertical loading failed in splitting failure mode, as shown in Fig. 3d. The final crack distribution in Fig. 3d further corroborated our speculation about the initial failure. The local damage configuration (the dashed circle) and vertical crack distribution in Fig. 3d were accurately captured by the corresponding strain fields of H3 and H4 in Fig. 3a. Some types of strain concentration frequently occurred during our experiment, but the overall displacement–load curves in Fig. 3c do not really represented their evolution.
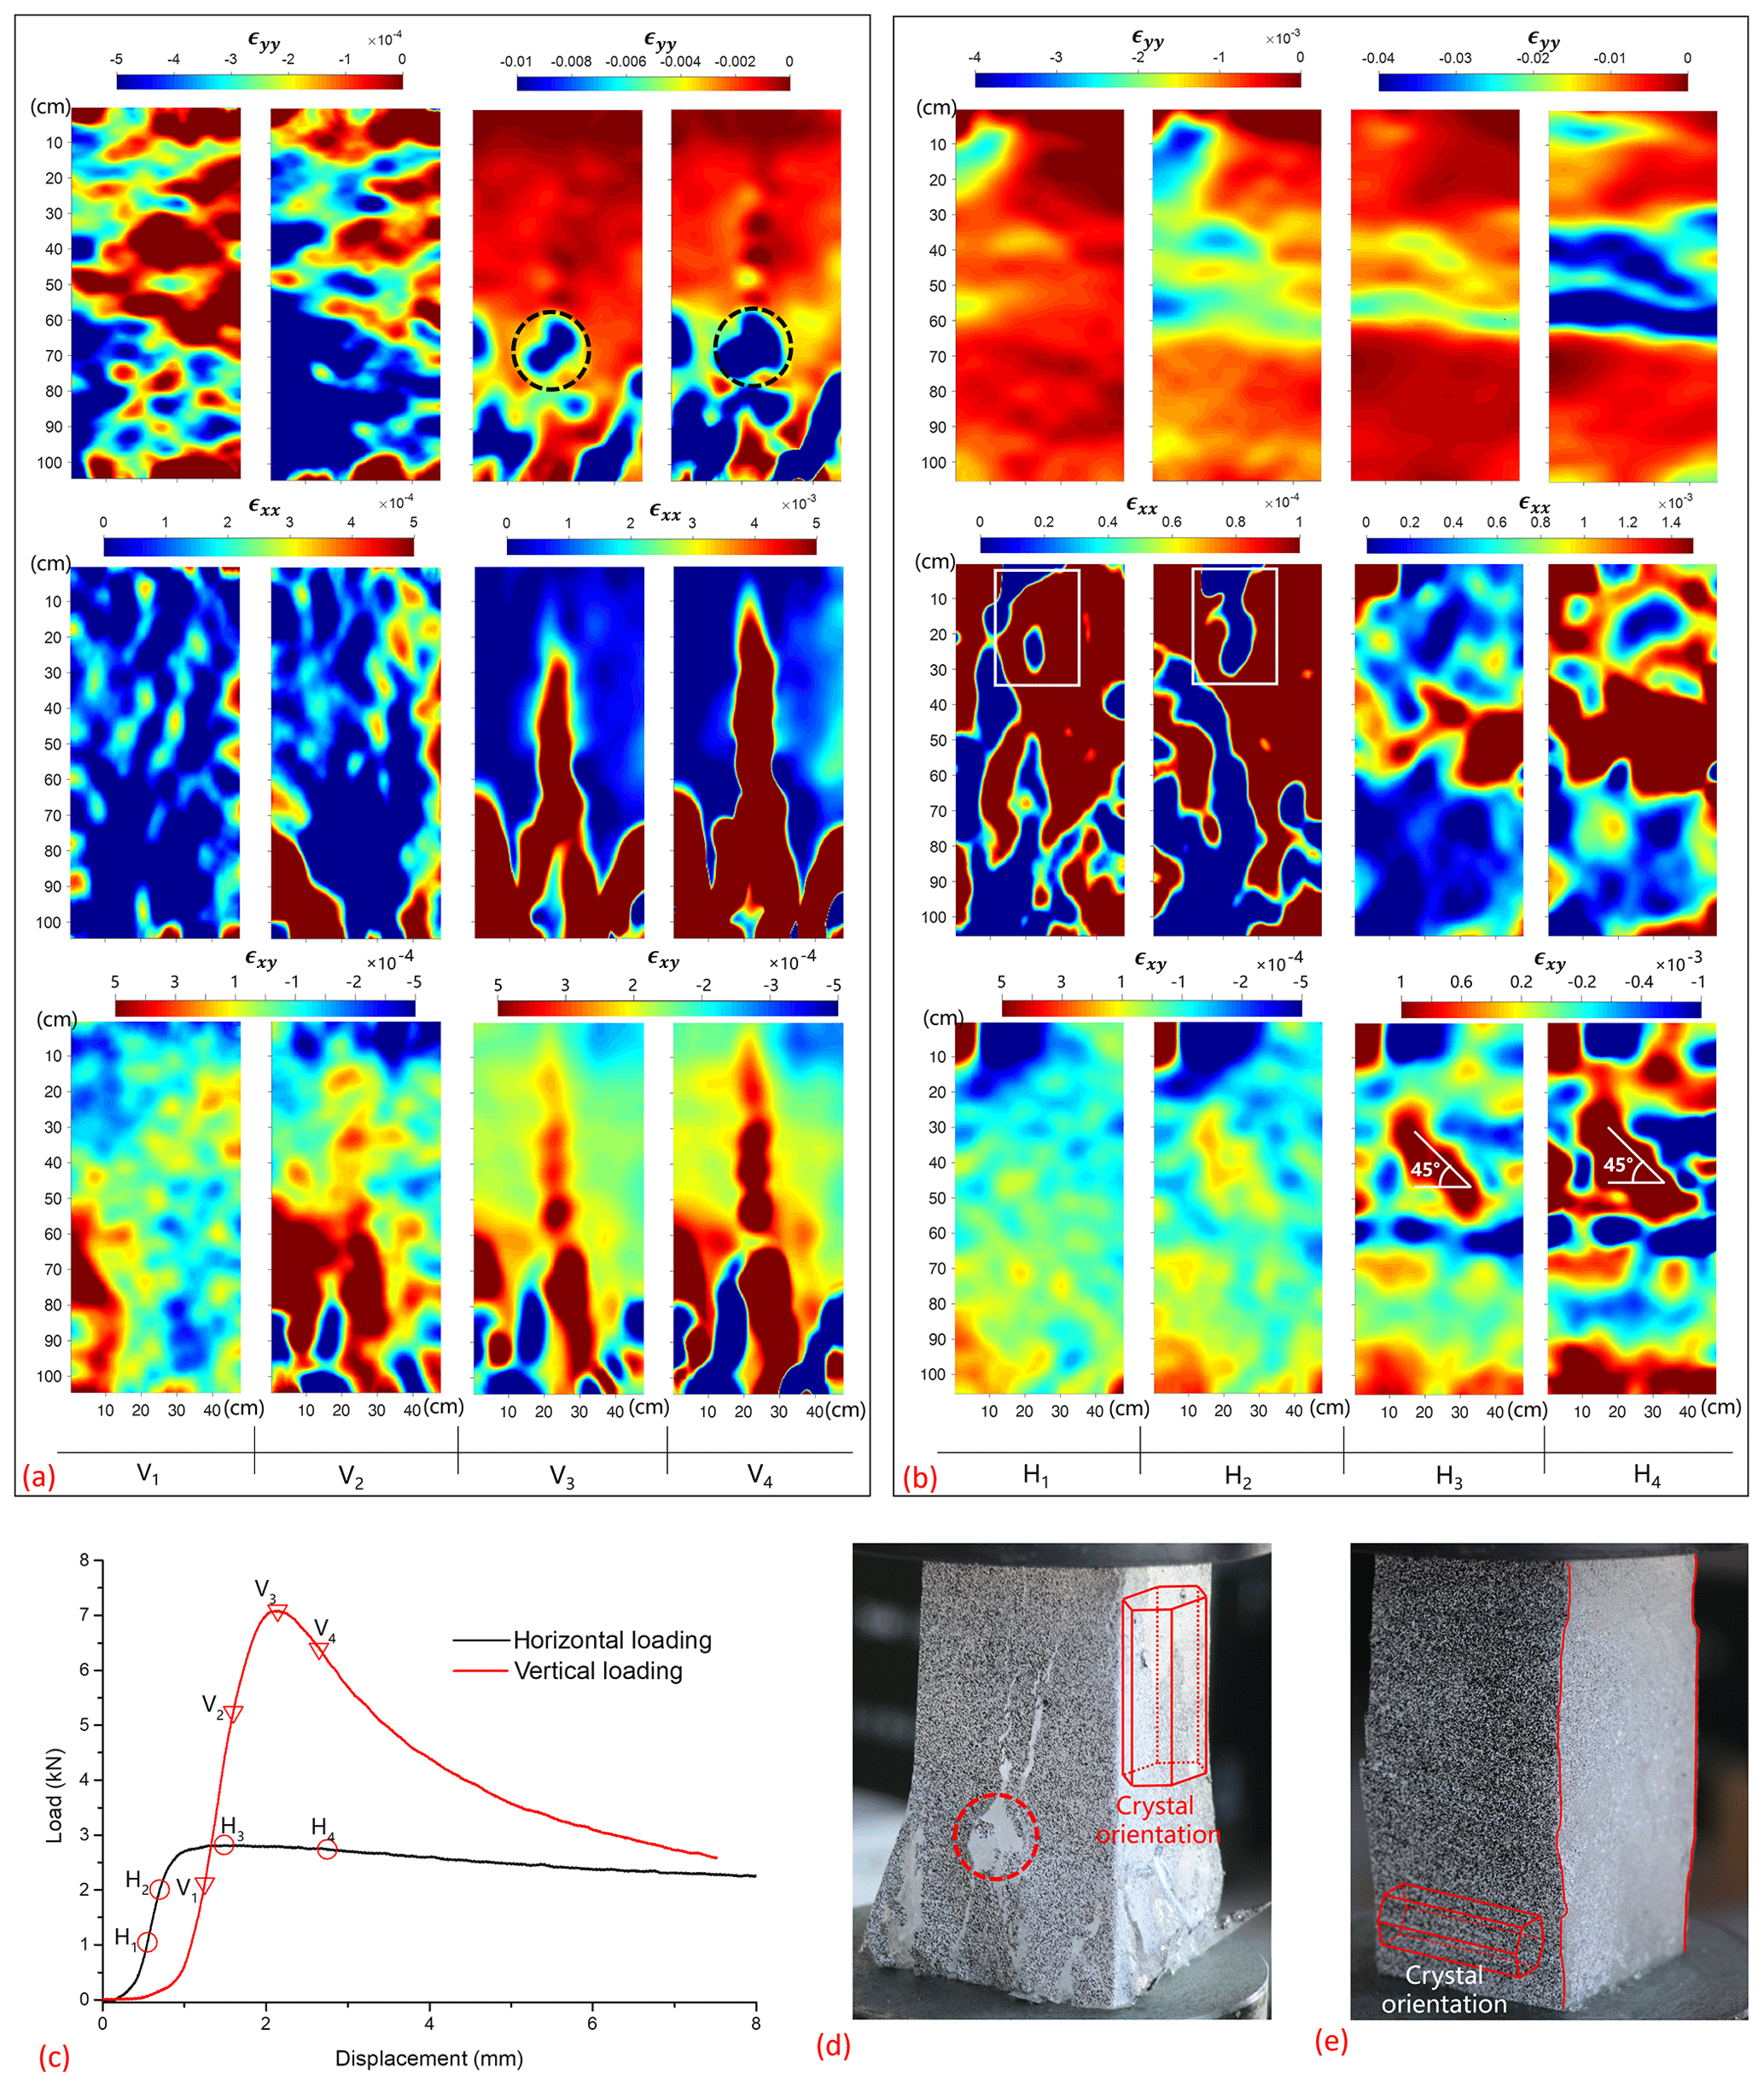
Figure 3The evolution of strain fields in the uniaxial compression experiment. The strain fields of specimens (a, b) with respect to the vertical and horizontal loading; the x direction and the y direction strain fields and shear strain fields are located from the first to the third row. The columns of Vi and Hi () correspond to the time points labeled in the displacement–load curves in panel (c). The failure pictures (d, e) for the specimens (a, b). Note that the same color bar is shared by the two neighboring strain fields in panels (a) and (b) to enhance the color contrast.
From Fig. 3a and b, we observed two different failure modes and strain distributions caused by different loading directions. The strain fields of the y direction in Fig. 3a demonstrate the tendency of layered distribution parallel to the direction of ice crystal orientation, whereas Fig. 3b does not exhibit this regularity. However, Fig. 3b shows that the propagation direction of the main crack was parallel to crystal orientation. One interesting phenomenon was the reversibility that some parts underwent relatively large strain in the x direction and then alternately took low strain during the early stages before yielding, such as the two squares within the white rectangle in Fig. 3b. However, once the fracture took shape at the maximum loads in V3 and H3 in Fig. 3a and b, respectively, the subsequent fractures could propagate based on that shape and resulted in an irreversible process. Compared with the maximum loads in V3 and H3, the fractures were notably expanded for the strain fields of the x direction and the y direction at V4 and H4. Obviously, sea-ice stiffness parallel to the crystal orientation tended to be higher than that perpendicular to the ice crystal orientation. In turn, the strength of vertical loading (V3) was greater than that of horizontal loading (H3), as shown in Fig. 3c. Figure 3d and e show the ductile and splitting failure for two specimens. Corresponding to these two failure modes of sea ice, the shear strain εxy concentrated along the fracture pathway in Fig. 3a for the splitting failure, whereas the shear zones with the angles of 45∘ were apparently observed in Fig. 3b for the ductile failure. Here, we noticed that even at the same indenter velocity, the different failure modes existed for two specimens due to the different orientations of the ice crystals. All of these strain characteristics of the two failure modes and the local fracture propagation were exactly captured by the DIC.
For this application of DIC, producing a high-quality speckle pattern on the specimen surface becomes to some extent the most challenging operation. The specimen surface needs to be covered with a random speckle pattern (Pan et al., 2009), which is in fact the carrier of deformation information during the loading process. Unfortunately, there is no natural texture on the surface of sea-ice specimen that can be used. Therefore, the high quality of the speckle pattern is an essential prerequisite for our experiment. In practice, the speckle patterns may show distinctly different intensity distribution characteristics and have a significant influence on DIC measurements. Our major challenge came from the natural properties of sea ice that entrap salt brine pockets and air bubbles. As a result, the surface of the cut specimens retained some faults, which could not be polished off in the same fashion as those on the surface of lake ice (Lian et al., 2017). We artificially created the speckle pattern by spraying the ice with black and white paints to overcome this drawback. We then applied the mean intensity gradient to the quality assessment of the speckle pattern. This method is straightforward and uses easy-to-calculate global parameters to assess the quality of the speckle pattern. The mean intensity gradient is given as follows (Pan et al., 2010):
where Wand H are the width and height of the specimen in units of pixels, is the modulus of the local intensity gradient vector and fx, fy are intensity derivatives at xij with respect to the x direction and the y direction. Here, we took advantage of the Sobel operator to compute the intensity derivatives. The mean intensity gradients of the initial images for specimens of Fig. 3a and b were 172.01 and 182.20, respectively. All the values of specimens for this experiment were between 146.11 and 182.20 with an average of 164.08. These values suggest a high-quality speckle pattern and subsequently a high-accuracy subset match in the DIC (Pan et al., 2010). From Fig. 4a, we found that the gray-level histogram for the speckle pattern tended to be a random distribution. Here, we took advantage of false color to enhance the contrast of the gray-level histogram. The randomness also indicated that we achieved a high-quality speckle pattern on the specimen surface for the measurements.

Figure 4(a) The distribution of gray-level histograms of subset grids in false color on the surface of a spray-painted specimen and (b) the comparison of displacements from the indenter and the DIC method during the loading process.
Our selection for the subset size was 35 pixels × 35 pixels, as shown in Fig. 4a. This took the large, complex and nonhomogeneous deformation of sea-ice specimens into consideration. On the one hand, the size of this subset was large enough to contain distinctive intensity variations so that every subset could have a unique speckle pattern and thus benefit the matching process of DIC; on the other hand, this selection reduced the additional systematic errors in measured displacements. From Fig. 4a, we can see that every subset is distinct from the others, as each subset comprises enough speckles to possess its own unique gray-level distribution.
In our experiments, strain concentrations in localized sections were often observed from the strain fields of specimens. This is most likely due to the existence of sea-ice defaults. These defaults are generally caused by air bubbles and salt brine pockets that are entrapped during the growth process of sea ice (Shokr and Sinha, 2015). In nature, these bubbles and pockets are randomly distributed inside the sea ice. Therefore, the strain concentration caused by the defaults could not be avoided by simply artificially handling the specimen's surface. This random distribution of defaults, to some degree, defines the difference in the mechanical properties of sea ice with respect to lake ice and other materials (Schulson, 1999; Cole, 2001; Shokr and Sinha, 2015; Weiss and Dansereau, 2017). Furthermore, the strength, failure mode and nonlinear mechanical behavior of sea ice are all related to these defaults and their random distribution (Schulson, 1999; Cole, 2001; Li et al., 2011). The strain concentration was exactly captured and further supported the feasibility of the use of DIC to study the mechanical properties of sea-ice material.
Additionally, we compared the displacement with that obtained from the indenter to evaluate the results from the DIC method. In our experiment, the indenter and the bottom of the specimen shown in Fig. 1e should have the same displacement. The displacements of the indenter were recorded by the loading system during our experiment. The bottom displacements can be derived from the digital images based on the DIC. Here, we averaged the displacements of two bottom lines of pixels as the bottom displacements of the specimen. Figure 4b demonstrates that these two sources of displacement agree well throughout the loading history. The red line represents the displacements of the indenter corresponding to the loading history. Even across the point of the maximum load where some nonplanar strain may subsequently occur on the surface of the specimen, the points in Fig. 4b are still close to the red line. This coincidence suggests that our control of the distance between the CCD camera and the specimen surface had a beneficial effect on reducing the influence of out-of-plane strain on the measurement of the full-field deformation. Nevertheless, when the loading process exceeds 100 s, the deviation seems to be evident. This is mainly due to the large fracture and damage of the specimen. In addition, the deviation may partly come from the selection of the analyzed region: the bottom line of the selected region is 1 cm above the bottom line of the specimen in the initial images. However, the reliability of DIC in the deformation measurement of sea ice is confirmed by the comparison.
Sea ice has heterogeneous mechanical properties due to its multiphase composition which includes crystalline ice, bubble and brine (Weiss and Dansereau, 2017). These structural heterogeneities of sea ice make the measurement of deformation difficult. Subsequently, the mechanical parameter determination and failure mode analysis for sea ice are influenced. Given the difficulty, we successfully applied the DIC technique to measure the deformation of sea ice in a uniaxial compression experiment. The full-field deformations are obtained and the ability of DIC to capture the strain concentration and failure modes is confirmed. The local and global characteristics of ductile and splitting failures are accurately reflected by the strain fields. In addition, the gray-level distribution and the comparison of displacements from the indenter and DIC are assessed. The results corroborate each other and bolster confidence in the reliability of the method, the quality of speckle pattern and the accuracy of the full-field deformation measurement in the experiment. The DIC method provides a convenient and powerful tool for the study of sea-ice mechanical properties such as the failure mode, nonlinear behavior and crack propagation. According to the procedure this paper, DIC could easily be extended to other types of sea-ice mechanical experiments such as flexural strength, shear strength and fracture toughness. Furthermore, based on the IDIC (integrated digital image correlation) theory (Roux and Hild, 2006; Leclerc et al., 2009), sea-ice full-field deformation from DIC should be incorporated into numerical models such as finite element analysis to realize the parameter identification, which is able to promote the measurement accuracy of a set of constitutive parameters such as the Young modulus and Poisson ratio.
All data that support our findings in this paper are available from the corresponding authors or the first author (wangal@nmefc.cn) upon reasonable request.
AW wrote the main text and prepared the figures. AW, ZW, XC and YL carried out the sea-ice experiment in situ. LQ extracted the full-field deformation based on the DIC method and SJ and AW analyzed the fracture process of sea-ice specimen. All authors discussed the results, drew conclusions and contributed to the manuscript text.
The authors declare that they have no conflict of interest.
This work is supported by the National Key Research and Development Program of China (grant no. 2016YFC1401500), the National Natural Science Foundation of China (grant nos. 41506109, 41676189 and 11602051) and the China Postdoctoral Science and Foundation (grant no. 2016M591433). The authors thank Guorui Cao for many helpful suggestions regarding the experimental design.
This research has been supported by the National Key Research and Development Program of China (grant no. 2016YFC1401500), the National Natural Science Foundation of China (grant nos. 41506109, 41676189 and 11602051), and the China Postdoctoral Science and Foundation (grant no. 2016M591433).
This paper was edited by Christian Haas and reviewed by Knut Høyland.
Cole, D. M.: The microstructure of ice and its influence on mechanical properties, Eng. Fract. Mech., 68, 1797–1822, 2001.
Feltham, D. L.: Sea ice rheology, Annu. Rev. Fluid Mech., 40, 91–112, https://doi.org/10.1146/annurev.fluid.40.111406.102151, 2008.
Hibler, W. D.: A dynamic thermodynamic sea ice model, J. Geophys. Res., 9, 815–846, 1979.
Ibrahim, R. A., Chalhoub, N. G., and Falzarano, J.: Interaction of ships and ocean structures with ice loads and stochastic ocean waves, Appl. Mech. Rev., 60, 246–289, https://doi.org/10.1115/1.2777172, 2007.
Ji, S., Wang, A., Su, J., and Yue, Q.: Experimental studies on elastic modulus and flexural strength of sea ice in the Bohai sea, J. Cold Reg. Eng., 25, 182–195, 2011.
Laliberté, F., Howell, S. E. L., and Kushner P. J.: Regional variability of a projected sea ice-free Arctic during the summer months, Geophys. Res. Lett., 43, 256–263, https://doi.org/10.1002/2015GL066855, 2016.
Leclerc, H., Périé, J N., Roux, S., and Hild, F.: Integrated digital image correlation for the identification of mechanical properties, Lect. Notes Comput. Sc., 5496, 161–171, 2009.
Li, Z., Zhang, L., Lu, P., Leppäranta, M., and Li, G. Experimental study on the effect of porosity on the uniaxial compressive strength of sea ice in Bohai Sea, Sci. China Technol. Sc., 54, 2429–2436, https://doi.org/10.1007/s11431-011-4482-1, 2011.
Lian, J., Ouyang, Q., Zhao, X., Liu, F., and Qi, C.: Uniaxial compressive strength and fracture mode of lake ice at moderate strain rates based on a digital speckle correlation method for deformation measurement, Appl. Sci., 7, 495, https://doi.org/10.3390/app7050495, 2017.
Moslet, P. O.: Field testing of uniaxial compression strength of columnar sea ice, Cold Reg. Sci. Technol., 48, 1–14, 2007.
Muckenhuber, S. and Sandven, S.: Open-source sea ice drift algorithm for Sentinel-1 SAR imagery using a combination of feature tracking and pattern matching, The Cryosphere, 11, 1835–1850, https://doi.org/10.5194/tc-11-1835-2017, 2017.
Pan, B., Qian, K., Xie, H., and Asundi, A.: Two-dimensional digital image correlation for in-plane displacement and strain measurement: a review, Meas. Sci. Technol., 20, 062001, https://doi.org/10.1088/0957-0233/20/6/062001, 2009.
Pan, B., Lu, Z., and Xie, H.: Mean intensity gradient: An effective global parameter for quality assessment of the speckle patterns used in digital image correlation, Opt. Laser. Eng., 48, 469–477, https://doi.org/10.1016/j.optlaseng.2009.08.010, 2010.
Rabatel, M., Rampal, P., Carrassi, A., Bertino, L., and Jones, C. K. R. T.: Impact of rheology on probabilistic forecasts of sea ice trajectories: application for search and rescue operations in the Arctic, The Cryosphere, 12, 935–953, https://doi.org/10.5194/tc-12-935-2018, 2018.
Roux, S. and Hild, F.: Stress intensity factor measurements from digital image correlation: post-processing and integrated approaches, Int. J. Fract., 140, 141–157, https://doi.org/10.1007/s10704-006-6631-2, 2006.
Schulson, E. M.: The structure and mechanical behavior of ice, JOM, 51, 21–27, https://doi.org/10.1007/s11837-999-0206-4, 1999.
Schulson, E. M. and Duval P.: Creep and fracture of ice, Cambridge University Press, Cambridge, UK, 2009.
Schulson, E. M., Fortt, A. L., Iliescu, D., and Renshaw, C. E. Failure envelope of first-year Arctic sea ice: The role of friction in compressive fracture, J. Geophys. Res., 111, C11S25, https://doi.org/10.1029/2005JC003235, 2006.
Shokr, S. and Sinha, N. K.: Sea ice: physics and remote sensing, American Geophysical Union and John Wiley & Sons, New Jersey, USA, 2015.
Sinha, N. K.: Uniaxial compressive strength of first-year and multi-year sea ice, Can. J. Civil Eng., 11, 82–91, 1984.
Sutton, M. A., Orteu, J. J., and Schreier, H.: Image correlation for shape, motion and deformation measurements: basic concepts, theory and applications, Springer, New York, USA, 2009.
Sutton, M. A., Matta, F., Rizos, D., Ghorbani, R., Rajan, S., Mollenhauer, D., H., Schreier, H. W., and Lasprilla A. O.: Recent progress in digital image correlation: background and developments since the 2013 W M Murray lecture, Exp. Mech., 57, 1–30, https://doi.org/10.1007/s11340-016-0233-3, 2016.
Timco, G. W. and Weeks, W. F.: A review of the engineering properties of sea ice, Cold Reg. Sci. Technol., 60, 107–129, https://doi.org/10.1016/j.coldregions.2009.10.003, 2010.
Wang, Q., Li, Z., Lei, R., Lu, P., and Han, H.: Estimation of the uniaxial compressive strength of Arctic sea ice during melt season, Cold Reg. Sci. Technol., 151, 9–18, https://doi.org/10.1016/j.coldregions.2018.03.002, 2018.
Weiss, J.: Drift, Deformation, and fracture of sea ice, Springer, London, UK, 2013.
Weiss, J. and Dansereau, V.: Linking scales in sea ice mechanics. Philos. T. Roy. Soc. A, 375, 20150352, https://doi.org/10.1098/rsta.2015.0352, 2017.