the Creative Commons Attribution 4.0 License.
the Creative Commons Attribution 4.0 License.
 | 15 Jan 2019
Evaluating the destabilization susceptibility of active rock glaciers in the French Alps
Marco Marcer
Charlie Serrano
Alexander Brenning
Xavier Bodin
Jason Goetz
Philippe Schoeneich
In this study, we propose a methodology to estimate the spatial distribution of destabilizing rock glaciers, with a focus on the French Alps. We mapped geomorphological features that can be typically found in cases of rock glacier destabilization (e.g. crevasses and scarps) using orthoimages taken from 2000 to 2013. A destabilization rating was assigned by taking into account the evolution of these mapped destabilization geomorphological features and by observing the surface deformation patterns of the rock glacier, also using the available orthoimages. This destabilization rating then served as input to model the occurrence of rock glacier destabilization in relation to terrain attributes and to spatially predict the susceptibility to destabilization at a regional scale. Significant evidence of destabilization could be observed in 46 rock glaciers, i.e. 10 % of the total active rock glaciers in the region. Based on our susceptibility model of destabilization occurrence, it was found that this phenomenon is more likely to occur in elevations around the 0 ∘C isotherm (2700–2900 m a.s.l.), on north-facing slopes, steep terrain (25 to 30∘) and flat to slightly convex topographies. Model performance was good (AUROC = 0.76), and the susceptibility map also performed well at reproducing observable patterns of destabilization. About 3 km2 of creeping permafrost, or 10 % of the surface occupied by active rock glaciers, had a high susceptibility to destabilization. Considering we observed that only half of these areas of creep are currently showing destabilization evidence, we suspect there is a high potential for future rock glacier destabilization within the French Alps.
- Article
(6560 KB) - Full-text XML
-
Supplement
(325 KB) - BibTeX
- EndNote


Warmer mean annual air temperatures (IPCC, 2013) are linked to a general trend in increasing permafrost temperature (Harris et al., 2003) and its water content (Ikeda et al., 2008), causing permafrost degradation, a phenomenon widely observed in the European Alps (Bodin et al., 2015; Haeberli et al., 1993, 2010; Springman et al., 2013). The occurrence of permafrost degradation is dependent on the ground properties, snow cover, and permafrost ice content (Scherler et al., 2013) and is therefore an heterogeneous phenomenon. Permafrost grounds affected by degradation experience a loss in strength due to the increasing ice ductility and reduced internal friction caused by the warmer ice and increasing water content (Davies et al., 2001; Haeberli et al., 1997; Harris and Davies, 2001; Huggel et al., 2010; Nater et al., 2008). Abnormal rockfall activity at high elevations (Ravanel and Deline, 2010) and increasing rock glacier displacement rates (Delaloye et al., 2008) are often assumed to be indicators of this change of state in the mountain permafrost. These processes may trigger mass movements that, in specific topographic conditions, may represent a hazard to alpine communities. Therefore, there is a growing need to understand the occurrence of these phenomena at a regional scale to allow for a targeted risk assessment and land use planning (Haeberli et al., 2010).
In this context, rock glaciers experiencing destabilization have recently become of interest. While active rock glaciers commonly present moderate interannual velocity variations that correlate with the ground temperature (Bodin et al., 2009; Delaloye et al., 2008; Kellerer-Pirklbauer and Kaufmann, 2012), destabilized rock glaciers are characterized by a significant acceleration that can bring the landform, or a part of it, to abnormally high velocities (Delaloye et al., 2013; Eriksen et al., 2018; Lambiel, 2011; Roer et al., 2008; Scotti et al., 2016). During this acceleration phase, morphological features typical of sliding processes, such as crevasses and scarps, appear and grow on the rock glacier surface. This suggests that the destabilization occurrence is caused by a basal sliding process over the normal creep movement of rock glaciers (Roer et al., 2008; Schoeneich et al., 2015). In this sense, crevasses and scarps are interpreted as the possible transition between creep-driven sections and sliding sections of the landform (Roer et al., 2008). This destabilization phase, also referred as a “surge” (Schoeneich et al., 2015) or a “crisis” (Delaloye et al., 2013), may last decades and it usually results in a deceleration or inactivation of the landform. In very rare circumstances, destabilized rock glaciers may reach complete failure and collapse in a landslide (Bodin et al., 2016).
The destabilization process can be triggered by either mechanical forces or changes in climate. An overload on the glacier surface caused by a landslide or glacio-isostatic uplift can cause a compressive wave that propagates through the landform, increasing its displacement rates and leading to destabilization (Delaloye et al., 2013; Roer et al., 2008). A warmer climate may also trigger a destabilization crisis as increasing temperatures may cause permafrost degradation of the rock glacier. This process may result in the onset of water-saturated shear layers in which sliding occurs, triggering the crisis (Eriksen et al., 2018; Lambiel, 2011; Schoeneich et al., 2015). The onset of crevasses and scarps can also increase the predisposition of the landform to trap water percolating into the permafrost body, causing a positive feedback process of destabilization (Ikeda et al., 2008). Although triggers are necessary to the destabilization occurrence, not all rock glaciers subjected to these external forces destabilize. For example, permafrost degradation in rock glaciers mainly causes permafrost thaw and results in inactivation (Scapozza et al., 2010). Destabilization can be triggered only if there is a local topographical predisposition of the rock glacier to this process, such as steep slopes (Delaloye et al., 2013; Roer et al., 2008). Therefore, the terrain attributes of the rock glaciers to the onset of a destabilization phase are a critical parameter in the process occurrence.
The purpose of this study was to obtain regional-scale insights into the issue of destabilizing rock glaciers in the French Alps. Destabilization has been observed by several studies in the region (Bodin et al., 2016; Echelard, 2014; Schoeneich et al., 2017; Serrano, 2017); however, there has not yet been a comprehensive assessment of this phenomenon. This was carried out by (i) identifying the rock glaciers showing evidence of destabilization in order to provide an assessment of destabilized landforms, and by (ii) modeling the occurrence of this phenomenon in order to spot rock glaciers susceptible to incoming destabilization. Destabilized rock glacier identification was performed with multi-temporal aerial image interpretation based on expert field knowledge (Sect. 2.2). The geomorphological features typically occurring on destabilized landforms such as scarps and crevasses, here called “surface disturbances”, were mapped and used to assign a destabilization rating ranging from 0 to 3 to each active rock glacier (Sect. 2.2). Rock glaciers attributed with a higher destabilization rating have typical geomorphological characteristics reported in known cases of destabilization, including pronounced surface disturbances that increased by number and size in the past decades. These rock glaciers were suggested to be potentially destabilized while rock glaciers not presenting surface disturbances were classified with lower ratings of destabilization (i.e. stable rock glaciers).
The following step, i.e. modelling the destabilization occurrence, was performed by using a statistical approach that has been used for mapping landslide susceptibility (Goetz et al., 2011; Sect. 2.3). Potentially destabilized rock glaciers were used as destabilization evidence and their relation with terrain attributes (e.g. slope angle and elevation) was modelled using a generalized additive model (GAM). This model can be applied to better understand the relation between destabilization occurrence and terrain predisposition and to compute a destabilization susceptibility map, which provides an overview of potentially destabilizing landforms at a regional scale (Sect. 2.3.1). Strengths and limitations of the methodology, as well as the contribution of the study to enhancing our knowledge rock glacier destabilization, are widely discussed in the paper.
2.1 Study area and rock glacier inventory
The French Alps cover an area approximately 50–75 km wide and 250 km long, located between 44 and 46∘ N and 5.7 and 7.7∘ W (Fig. 1). Apart from the noticeably high Mont Blanc massif (peaking at 4810 m a.s.l.), mountain ranges commonly peak between 3000 and 4000 m a.s.l. The lithology is heterogeneous across the region. The northern French Alps can be roughly divided into the west side, dominated by granite and gneiss (ranges of Mont Blanc, Belledonne, Écrins and Grandes Rousses), and east side, where ophiolites and schists are more common (ranges of Vanoise, Thabor and Mont Cenis). In the southern French Alps ophiolites, limestone and mica schists are the most common lithology (ranges of the Ubaye), while the crystalline range of Mercantour can be found at the southernmost end of the region. Dominant geology is described in the BRGM (2015) at 1∕1 000 000 scale, and the vectorial version of this map is used in this study to observe destabilization occurrence in relation to lithology.
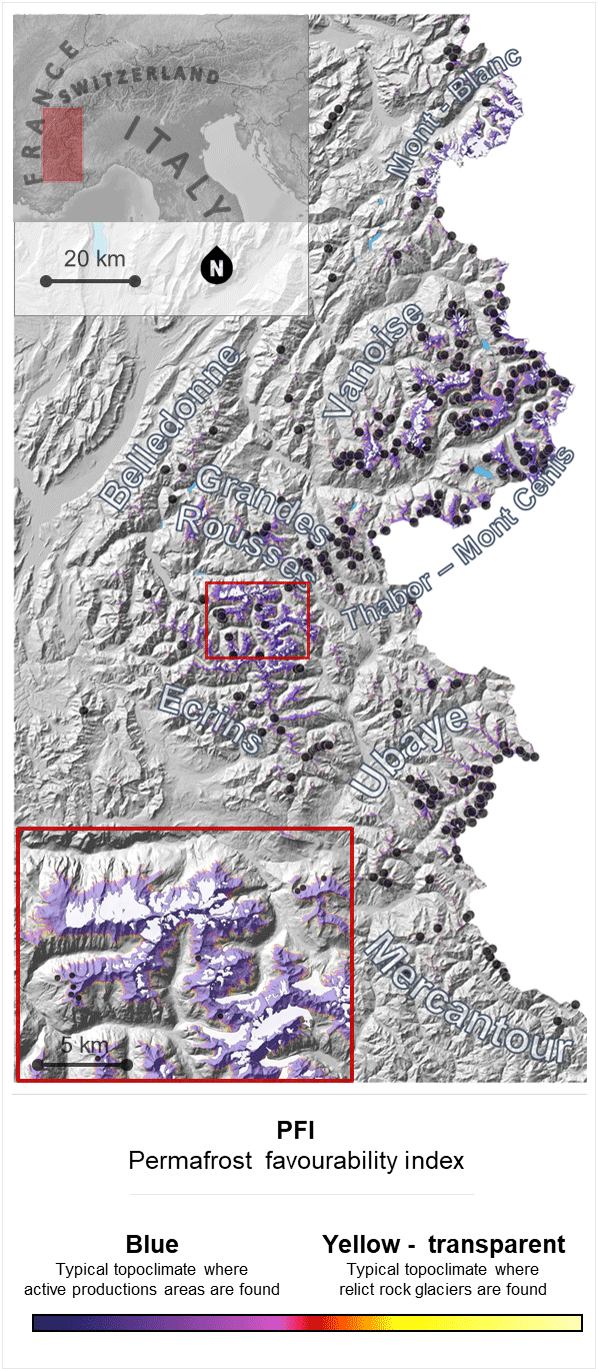
Figure 1Identification of the study area in the European Alps and overview of the periglacial environment. Permafrost distribution is represented by the PFI map (Marcer et al., 2017). Black dots identify active rock glacier locations (Marcer et al., 2017).
In this region permafrost was estimated to cover up to 770 km2 (Boeckli et al., 2012; Marcer et al., 2017). The 0 ∘C annual isotherm at the end of the 20th century ranged from 2500 m a.s.l. in the south to 2300 m a.s.l. in the north (Gottardi, 2009). The periglacial landforms of the region were inventoried by the “Office national des forêts” (ONF: the National Forest Office) (Roudnitska et al., 2016) and revealed the high presence of active rock glacier in the region (i.e. 493 mapped rock glaciers). This inventory was compiled between the years 2009 and 2016 by inspecting aerial imagery and revised by Marcer et al. (2017). This inventory was used in the present study to identify active rock glacier locations and to investigate the occurrence of destabilization.
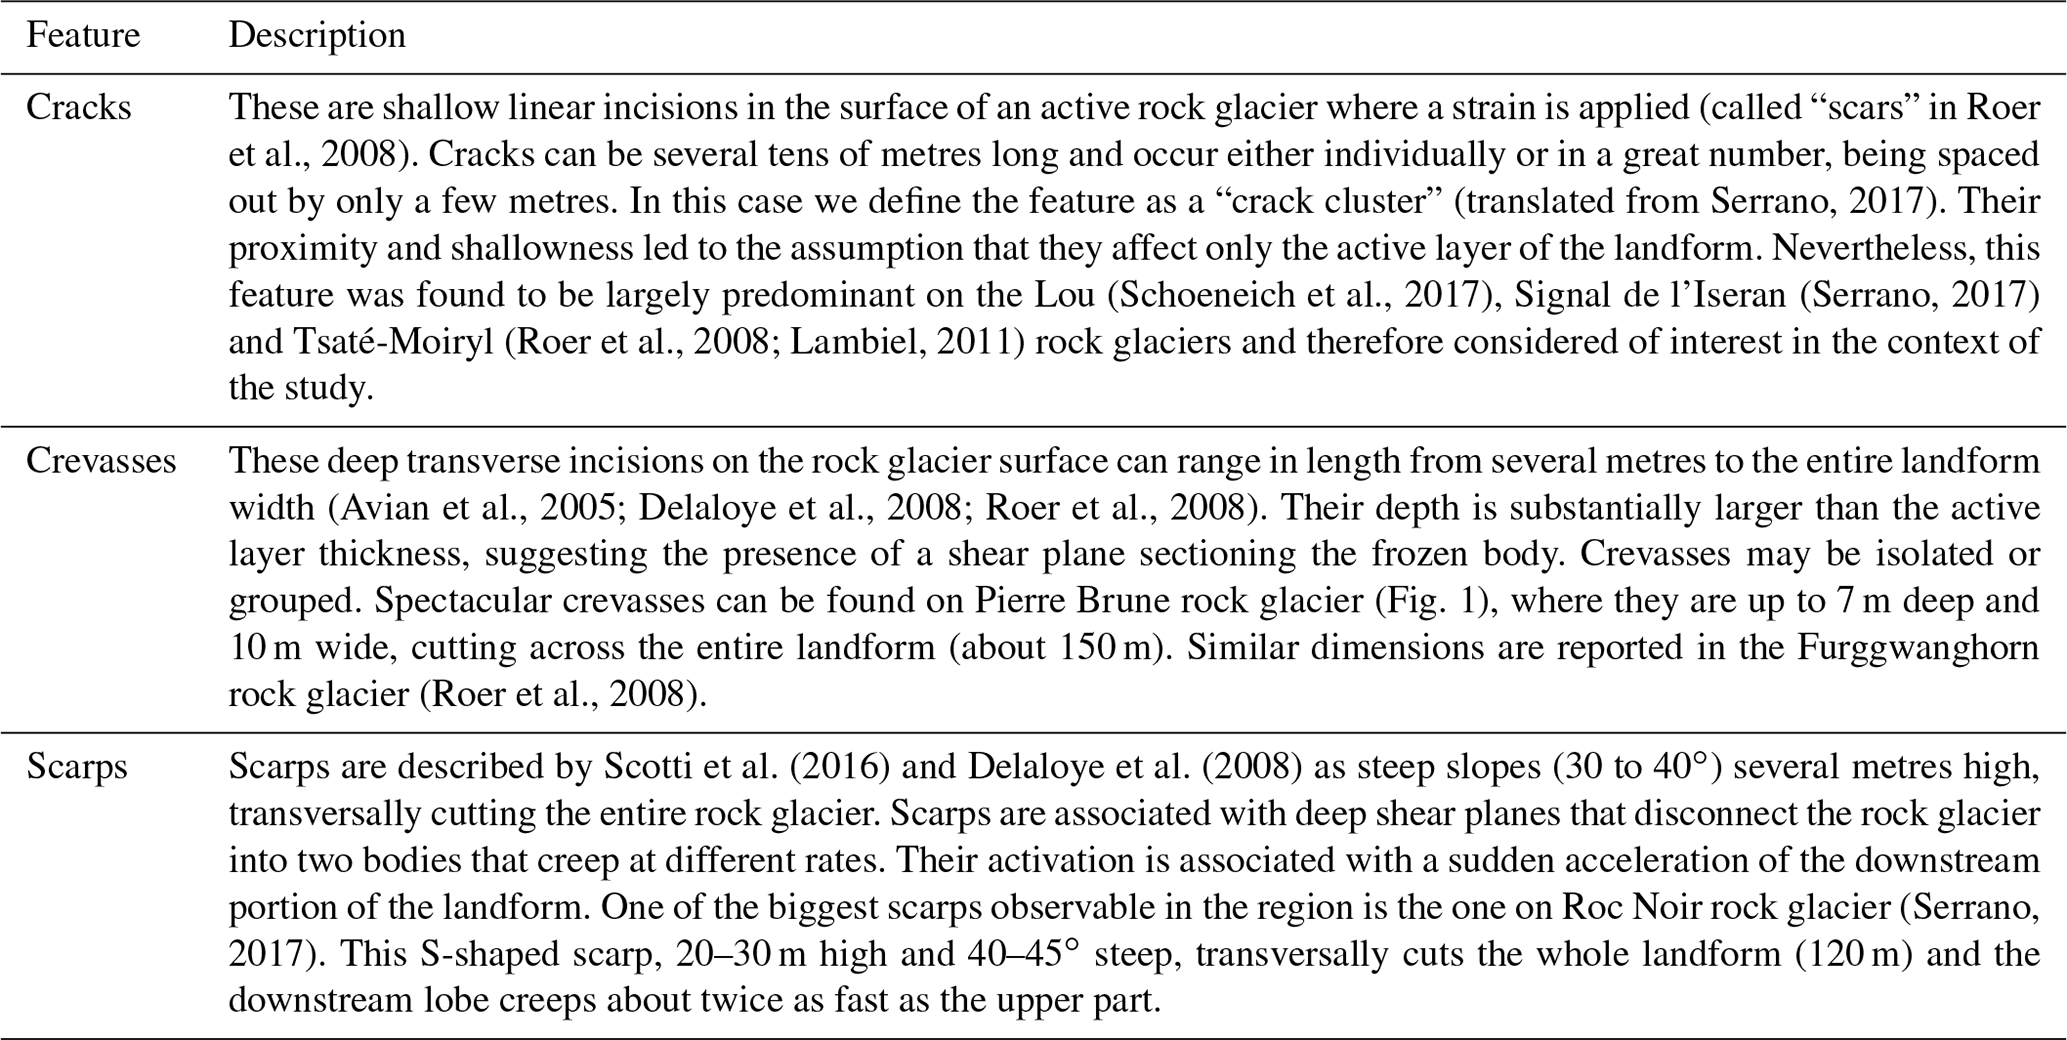
Roer et al., 2008Serrano, 2017(Schoeneich et al., 2017)(Serrano, 2017)(Lambiel, 2011; Roer et al., 2008)(Avian et al., 2005; Delaloye et al., 2008; Roer et al., 2008)(Roer et al., 2008)Scotti et al. (2016)Delaloye et al. (2008)(Serrano, 2017)Table 1Description of surface disturbance features that could be observed in the field or from orthoimagery to identify signs of rock glacier destabilization.
According to Auer et al. (2007), mean annual air temperature increased by up to 1.4 ∘C in the French Alps during the 20th century, and this rate has been increasing in recent decades. This climate warming is suspected to have caused some noticeable effects on the permafrost characteristics in the region. The only deep permafrost borehole in the region, located in the Écrins massif in temperate permafrost (−1.3 ∘C) with low ice content, showed a temperature increase rate of 0.04 ∘C decade−1 between 2010 and 2014 (Schoeneich et al., 2012), similar to other sites in Switzerland where data series are longer (PERMOS, 2016). Increasing air temperature was also addressed to be responsible for the acceleration since the late 1990s of the active Laurichard rock glacier located in the Combeynot massif of the French Alps (Bodin et al., 2009). Several cases of rock glacier destabilization, such as the collapsed Bérard rock glacier (Bodin et al., 2016) and the Pierre Brune rock glacier (Echelard, 2014), were also observed in the region. Serrano (2017) mapped destabilized rock glaciers in the Maurienne valley, Vanoise National Park and Ubaye valley, highlighting the high incidence of destabilized rock glaciers in these areas.
2.2 Mapping rock glacier destabilization
The first step to identify destabilized rock glaciers was mapping surface disturbances on rock glaciers. Previous studies that described destabilized rock glaciers showed that these landforms present a wide variety of geomorphological features (Roer et al., 2008). Here, we followed a methodology similar to that of Serrano (2017), which consisted of defining a catalogue of typical surface disturbances that can be found on destabilized rock glaciers. Surface disturbances on rock glaciers were classified in three distinct categories, depending on their morphology: cracks, crevasses and scarps. Surface disturbances are described in detail in Table 1 and illustrated in Fig. 2.
In this study, surface disturbances were mapped for the inventoried rock glaciers based on interpretation of a set of multi-temporal high-resolution aerial imagery for the French Alps. This orthoimagery collection was obtained from the Institut géographique national (IGN, National Institute of Geography), which is freely available from the official website (https://www.geoportail.gouv.fr/, last access: 10 December 2018) or can be accessed as a Web Map Service (IGN, 2011, 2013). The IGN orthoimagery collection consists of orthomosaics covering all of France for three different collection periods. The first orthomosaic is composed of images taken from 2000 to 2004, the second from 2008 to 2009 and the third from 2012 to 2013. All images are of high resolution: 50 cm × 50 cm for the most recent mosaic and slightly lower values (1 m × 1 m at its lowest) for the older mosaics, depending on the location. This resolution was sufficient to identify the smallest features to be mapped, i.e. the surface cracks (Fig. 2a). Nevertheless, several limitations during the mapping process, such as image distortion or illumination, were encountered and will be discussed in Sect. 4.4.1.
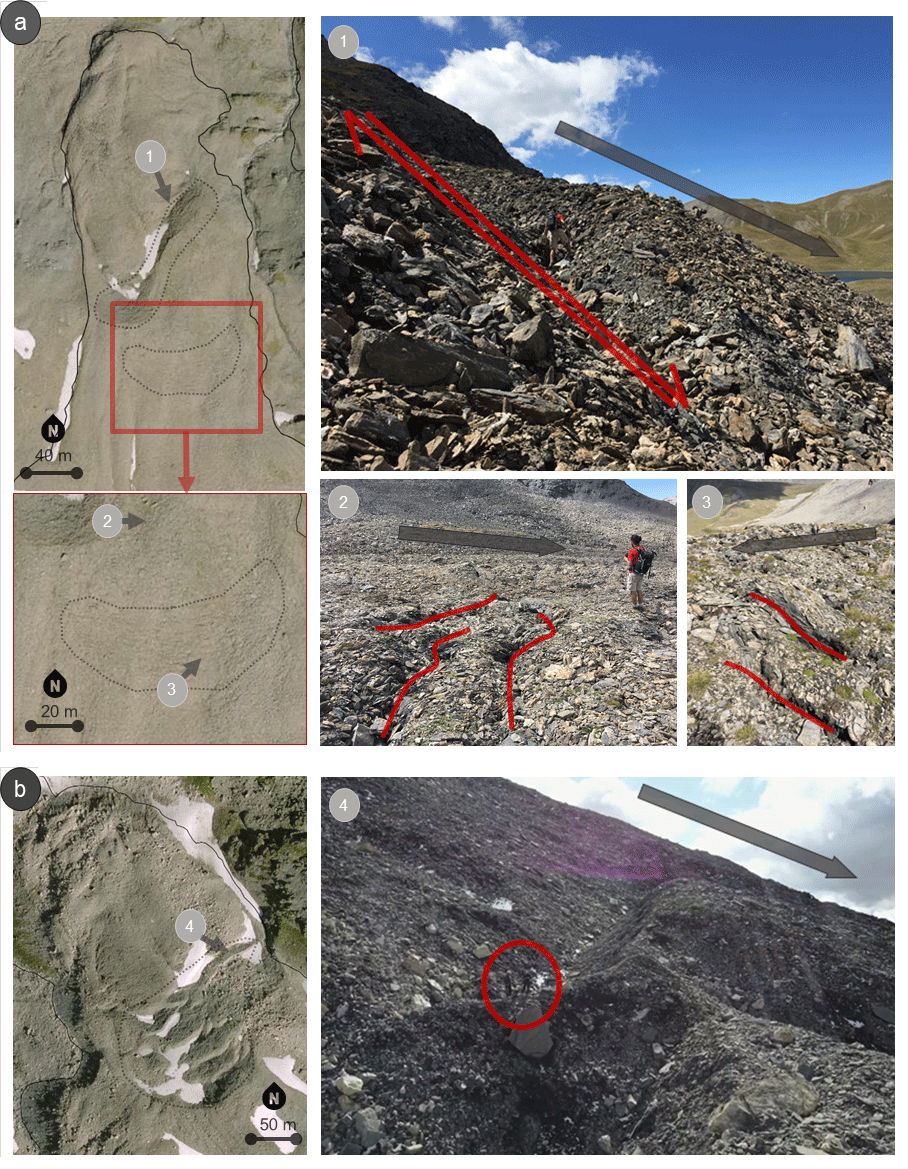
Figure 2Examples of surface disturbances observable in the available orthoimages of 2013 in comparison to field observations on (a) Roc Noir (Serrano, 2017) and (b) Pierre Brune (Echelard, 2014) destabilized rock glaciers. The black arrows indicate the rock glacier displacement direction. A scarp (1) and cracks (2, 3) have been observed on the Roc Noir rock glacier. Large crevasses (4) can be seen on the Pierre Brune rock glacier. The dotted black lines indicate how the surface disturbances were mapped on these orthoimages.
Using a single orthoimage to map surface disturbances can lead to misinterpretations in the case of poor illumination of the terrain and snow patches covering the ground (Serrano, 2017). Indeed, as the surface morphology of a rock glacier is naturally shaped according to spatially varying creep patterns, it is easy to mistake actual surface disturbances related to compression features, such as furrows, depending on image quality. Therefore, surface disturbances, i.e. those morphological features not related to the creeping of the ice-rich permafrost, were mapped using all three available orthoimages in order to check that actual strain occurred where surface disturbances were located and to overcome limitations related to poor quality of an individual image.
Rating the degree of destabilization
After the rock glacier surface disturbances were mapped, a rating of the degree of destabilization was assigned to each rock glacier. This rating was given not only to provide some insight into the observed levels of destabilization in the French Alps, but also to provide a confidence rating to describe a rock glacier as stable or unstable for the spatial distribution modelling of rock glacier destabilization.
Assigning a rating to quantify the degree of destabilization of a rock glacier required the definition of the characteristics of the “typical” destabilized rock glacier that can be observed in multiple orthoimages. To do so, we investigated the features of destabilized rock glaciers reported in the literature that could be observed by orthoimagery interpretation. At first, it was observed that the presence of surface disturbances was a necessary but not sufficient condition to the occurrence of destabilization, as rock glaciers may present surface disturbances but be stable for decades. For example, in the Pierre Brune, Roc Noir and Hinteres Langtalkar rock glaciers, although crevasses could be observed in aerial imagery since the 1940s to the 1960s, destabilization occurred only in the late 1990s (Echelard, 2014; Roer et al., 2008; Serrano, 2017). Second, the destabilization process can be linked to an increase in surface disturbance occurrence (see Fig. 3). Also, surface disturbances on destabilized landforms were observed to create a discontinuity in the creep pattern. For example, the Plator, Grosse Grabe and Gänder rock glaciers have gone through a sharp transition from displacement speeds on the order of 0.1–0.9 m yr−1 to displacements speeds of the order of several metres per year (Delaloye et al., 2008; Scotti et al., 2016). Finally, a high displacement rate may not be a necessary feature, as some destabilized rock glaciers, e.g. Lou and Furggwanghorn, moved at a “normal” rate of around 2 m yr−1 (Roer et al., 2008; Schoeneich et al., 2017).
These observations suggest that destabilization may be spotted in orthoimages if the landform has surface disturbances increasing over time time by frequency and/or magnitude, as well as if disturbances also create a strong discontinuity in the deformation pattern of the landform. Nevertheless, rock glaciers were observed to show a wide variety and combination of these features, making it unrealistic to construct a binary classification of stable versus destabilized landforms. In order to acknowledge this, we proposed a rock glacier destabilization rating based on four rates that varied from 0 (stable rock glaciers) to 3 (rock glaciers potentially destabilized), which is explained in more detail in Table 2. For each active rock glacier, a rating of the degree of destabilization was assigned by observing the combination of surface disturbances and a qualitative assessment of recent deformation patterns. This rating was applied using a standardized workflow (Fig. 4). A comparison of the available IGN multi-year orthoimagery was used to observe the temporal evolution of the surface disturbances and surface deformation patterns.
Table 2Rating classes used to describe rock glacier destabilization.
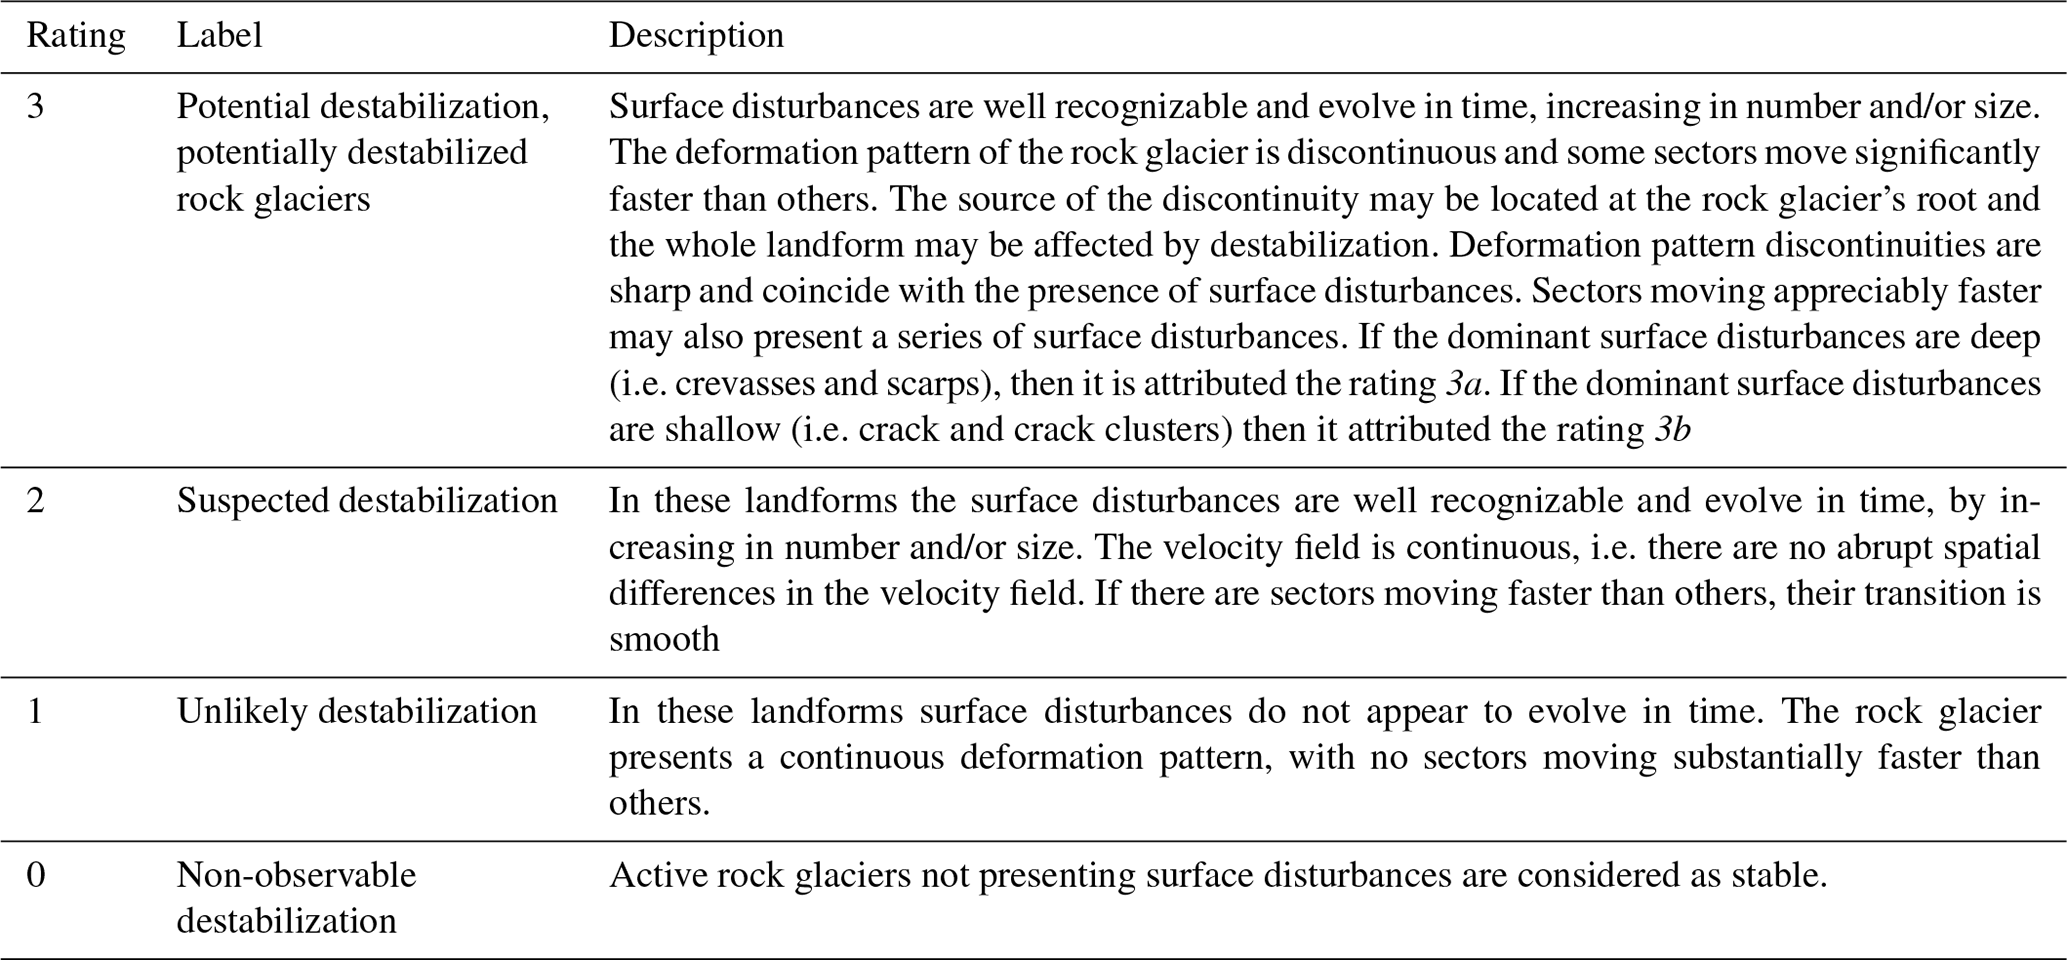
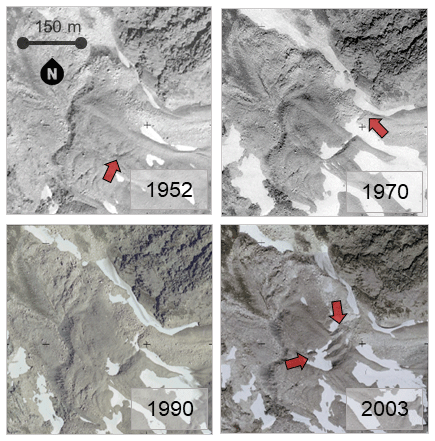
Figure 3The evolution of the destabilization of the Pierre Brune rock glacier. The destabilization evidence, in this case a crack observable since 1952, evolved to a crevasse, observable in 1970. Afterwards, the landform was stable for 20 years as destabilization evidence did not further evolve. Between 1990 and 2003 the rock glacier experienced severe destabilization with the formation of new crevasses and a scarp at the location of the 1952 crack.
Potentially destabilized rock glaciers were then classified into two different categories according to the type of surface disturbances observed. Most of the destabilization cases observed by previous studies described rock glaciers characterized by surface disturbances that may reach several metres of depth, i.e. crevasses and scarps, and therefore suggested splitting the permafrost body. These surface disturbances were mostly observed in coarsely grained (i.e. blocky; sensu Ikeda and Matsuoka, 2006) rock glaciers. Nevertheless, in the French Alps many active rock glaciers are finely grained, and some destabilization cases, e.g. the Lou (Schoeneich et al., 2017) and Iseran (Serrano, 2017) rock glaciers, were observed to be characterized by the presence of cracks only. These surface disturbances are shallower than crevasses and scarps and are therefore suggested to affect only the upper layer of the rock glacier. As these observations were relatively recent, at present there is still not enough knowledge concerning the significance of these shallow cracks in the context of rock glacier destabilization. We therefore decided to separate rock glaciers showing shallow surface disturbances from rock glaciers showing deep surface disturbances. This distinction was made to make the reader aware of this gap in knowledge.
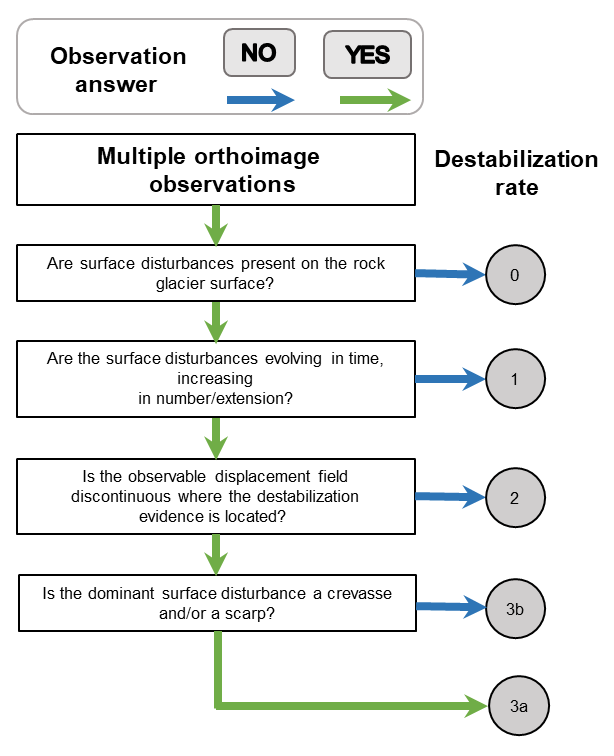
Figure 4General pipeline used to rate rock glacier destabilization by observing surface disturbances and the qualitative displacement field. Higher destabilization ratings indicate potentially unstable rock glaciers, while lower ratings indicate stable rock glaciers.
2.3 Modelling rock glacier stability
Modelling the rock glacier stability aims to identify the terrain attributes that may precondition rock glacier destabilization. The modelling followed a statistical approach similar to previous studies on landslides (Goetz et al., 2011) and arctic permafrost slope failures (Rudy et al., 2017) that used the GAM with logistic link function (R package “mgcv”). The GAM was selected because of its flexibility in modelling non-linear interactions between dependent and predictor variables. The logistic link function allows us to model the occurrence of a categorical response variable as a function of continuous variables (predictor variables). All numeric predictors were represented using spline-based smoothing, for which we chose a maximum basis dimension of 4 in order to limit their flexibility and reduce overfitting. The actual degree of smoothness of the splines was determined using a generalized cross-validation procedure (Wood, 2017).
In this study, rock glacier stability was hypothesized to be preconditioned by a series of local terrain attributes. In particular, rock glacier destabilization grouped by either presence or absence was used as the response variable, while terrain attributes describing local topography and climate were used as predictor variables. Multiple-variable models were computed using different combinations of predictor variables. Different models were compared using the Akaike information criterion (AIC), which is a measure of goodness of fit that penalizes more complex models. The best multiple variable model was selected by iterating a backward-and-forward stepwise variable selection, aimed at identifying which combination of predictors was better at describing the response variable by means of a lower AIC. Finally, the best model performance was estimated using the area under the receiver operating characteristic (AUROC) (Hosmer and Lemeshow, 2000). The AUROC estimates the ability of the model to discriminate stable and unstable areas.
The predictive power of the model was estimated with spatial cross-validation (R package sperrorest). The method selected was the k-means clustering, which consisted of dividing the mapped data in k spatially contiguous clusters (Ruß and Brenning, 2010a). All but one cluster were used to train the model, while the remaining cluster was used to test the predictive power of the model. This process was repeated until each cluster was used at least once in both training and test sets. Here, we divided the database into k=5 clusters of equal size per run and used 100 repetitions. Performance indicators were evaluated for the respective test sets, and the overall model performance was evaluated using the average and standard deviation over all partitioning clusters.
The variable importance was assessed using permutation-based variable importance embedded in the spatial cross-validation (Ruß and Brenning, 2010b). This method consisted of permutating the values of each predictor variable one at a time and calculating the reduction in model performance caused by the permutations. A total of 1000 permutations were performed for each spatial cross-validation repetition. Predictor variables causing higher deviations while permutated were considered the most important ones in the model.
2.3.1 Response variable
Surface disturbances of potentially destabilized rock glaciers were used as evidence of creeping permafrost destabilization. This was performed under the hypothesis that surface disturbances were the geomorphological expression of rock glacier destabilization. Although many surface disturbances could be observed on rock glaciers that were classified as unlikely destabilized or as suspected of destabilization, potentially destabilized rock glaciers could be observed to increase surface disturbances over time by number and size, creating a discontinuity in the deformation pattern, which provided stronger evidence of destabilization. Therefore, only surface disturbances located in potentially destabilized rock glaciers were considered to be solid evidence of rock glacier destabilization.
As surface disturbances were digitized as linear features, they were buffered and merged into an “unstable areas” polygon database. A buffer distance of 30 m was chosen. The model was found to be insensitive to changes in buffer size up to 90 m. All remaining areas within the polygons of stable and likely stable rock glaciers were used as “stable areas”. Polygons of both unstable and stable areas were sampled using a 25 m × 25 m point grid in order to assign the response variable to the modelling database. The point values were then used as binary response variables with values of 0 for stable areas of (likely) stable rock glaciers, while 1 was assigned for unstable areas of potentially destabilized rock glaciers in the modelling stage.
Since the rock glacier inventory counted a relatively small number of potentially destabilized cases (46 individuals), selecting only one point per rock glacier would have caused large uncertainty in the model outcome. Therefore, a simple exploratory analysis was performed to identify a suitable number of points per rock glacier to be used for modelling. Multiple points from one to 10 were randomly selected within each rock glacier perimeter and used to compute a model. This was repeated 10 times per point sample size to measure the variability in the model performance in relation to the point sample size. Since the model performances were found to stabilize for more than five points selected per rock glacier, the number of points randomly extracted per rock glacier used for modelling was five. Overall, the model was computed using 225 points with evidence of instability and 1785 points with evidence of stability.
2.3.2 Predictor variables
Terrain attributes used in modelling needed to be selected to act as proxies for processes that precondition destabilization. Although destabilization is found to occur in different conditions, some topographical features seem to be recurrent. Destabilization has been observed to occur on steep slopes, as high slope angles tend to increase the internal shear stress (Delaloye et al., 2013). Surface disturbances are often located in convex-shaped bedrock surfaces, which causes an extensive flow pattern and a thinning of the permafrost body (Delaloye et al., 2013). Solar exposure may also be significant in the destabilization occurrence since all known cases of destabilized rock glaciers in the French Alps are north facing. Solar exposure can also be a proxy of the snow cover duration, as north-facing slopes are more prone to conserve longer snow patches through the summer, making meltwater available through the summer. Elevation and mean annual air temperature can also be proxies of snow cover duration that have the possibility of affecting permafrost characteristics. Considering this, slope angle, profile curvature, potential incoming solar radiation (PISR) and elevation were tested as predictor variables.

Figure 5Map of potential thawing permafrost (PTP) distribution in the Mont Cenis range, indicating the extent of the permafrost zone not in equilibrium with the present climate (red coloured areas). Temperature warming to compute the map is evaluated using HISTALP data (Auer et al., 2007) between the end of the Little Ice Age (light blue shaded period in the temperature anomaly plot) and the current climate (red shaded period).
Terrain attributes were derived from the BD ALTI DEM, 25 m × 25 m spatial resolution (IGN, 2011). Slope angle and downslope curvature (Freeman, 1991) were evaluated using the Morphometry Toolbox in SAGA GIS (version 2.2.2). Negative values of curvature indicate concave topography, while positive values indicate convex topography. Also, PISR was calculated using the Terrain analysis toolbox in SAGA as the sum of the computed direct and diffusive components of the radiation (Wilson and Gallant, 2000). Clear-sky conditions, a transmittance of 70 % and absence of a snow cover were assumed in the calculation of the annual total PISR. Finally, it was decided to evaluate the relation between rock glacier destabilization and the spatial distribution of degrading permafrost in order to give insight into the significance of the warming climate with respect to the destabilization phenomena. The spatial distribution of degrading permafrost was evaluated following the method already presented by other studies (Damm and Felder, 2013; Hoelzle and Haeberli, 1995; Lambiel and Reynard, 2001), which consisted of artificially shifting a permafrost map proportionally to the estimated climate warming occurring between the period of validity of the map and the current climate. Here, we used a permafrost favourability index (PFI) map (Marcer et al., 2017) to act as a permafrost distribution map for the region. The PFI map was calibrated using active rock glaciers as evidence of permafrost occurrence, and it represents the permafrost conditions during the cold episodes of the Holocene, e.g. Little Ice Age (LIA). The climate warming between the years 1850–1920 and 1995–2005 was determined using the HISTALP database (Auer et al., 2007) over the region. A permafrost distribution map was then recomputed taking into account these temperature variations and represented the theoretical permafrost distribution in equilibrium with the current climate. By comparing this theoretical permafrost distribution and the PFI, a map of the potential thawing permafrost zone (PTP, i.e. the so-called “melting area” in Lambiel and Reynard, 2001) was obtained. In order to use the PTP as a predictor variable, it was represented by an index ranging between 0, i.e. no thaw expected, and 1, i.e. potential thaw.
It should be emphasized that PTP is only a proxy of permafrost degradation, which occurs at all the elevations, while the PTP zone consists of a belt of 250 to 300 m in elevation that affects about 50 % of the lower margins of the permafrost zone (Fig. 5). PTP is used under the hypothesis that degradation is more intense at the lower margins of the permafrost zone where permafrost conditions may be more temperate, richer in water and more sensitive to climate variations.
2.3.3 Susceptibility modelling
The model of rock glacier stability was also used to predict the occurrence of degrading permafrost over the French Alps by producing a susceptibility map (Goetz et al., 2011). This was carried out using the R package RSAGA and the raster images of the predictor variable maps, which allowed extrapolation of the relationships between rock glacier stability and terrain attributes at the landscape scale. We would like to highlight that since the model is constructed using data on destabilized rock glaciers, the susceptibility map applies mainly for processes relative to destabilization of ice-rich debris slopes. Therefore, in areas where creeping permafrost does not exist, the extrapolated susceptibility may have high uncertainty. The model predicted a DEFROST index, which was classified into five susceptibility zones using the 50, 75, 90 and 95 percentiles (Goetz et al., 2011; Rudy et al., 2017). These zones described very low (<50), low (50–75), medium (75–90), high (90–95) and very high (>95) susceptibility to permafrost destabilization.
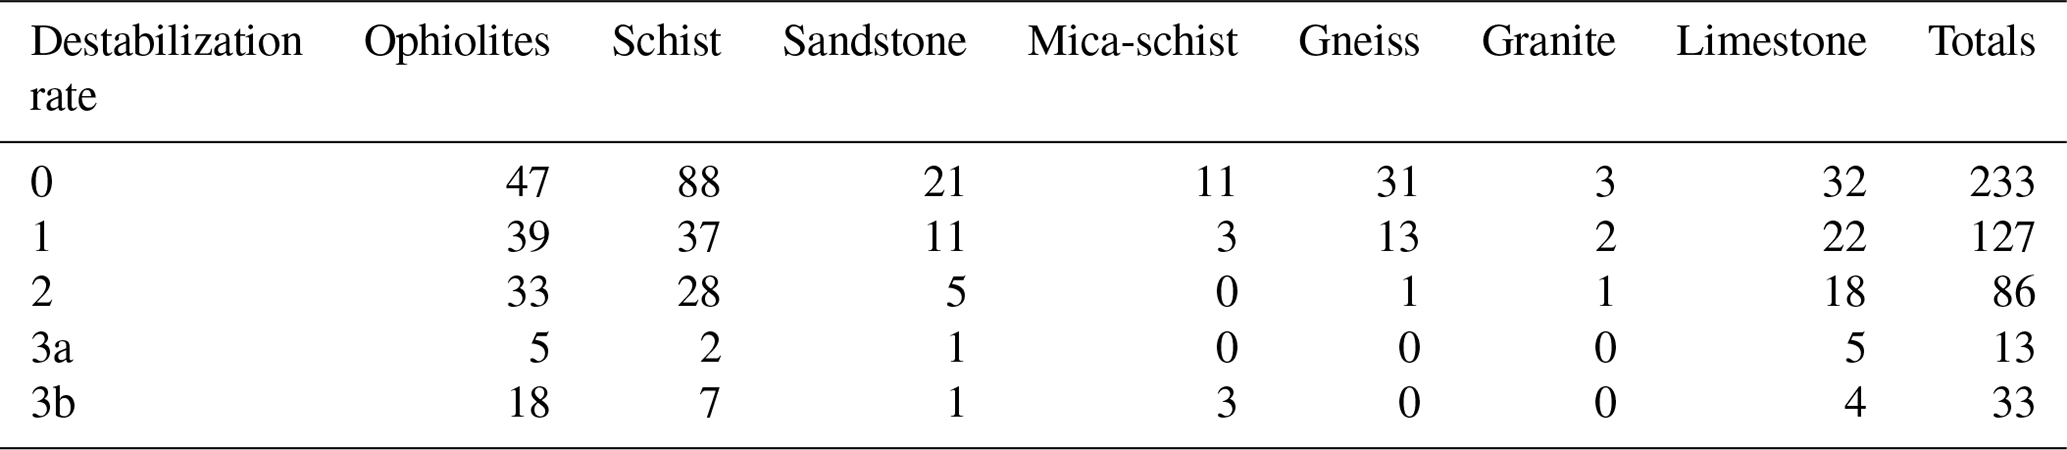
Table 3Number of rock glaciers per dominant lithology in relation to destabilization rate.
3.1 Destabilized rock glacier inventory
More than 1300 surface disturbances were digitized, involving 259 active rock glaciers (Fig. 6). Overall, more than the 50 % of the active rock glaciers may be affected by some degree of destabilization as 46 rock glaciers (9.7 %) showed potential destabilization, 86 (17.0 %) were suspected of destabilization and 127 (25.7 %) were unlikely destabilized. Only 13 potentially destabilized rock glaciers presented deep surface disturbances. Location and destabilization rate of each active rock glacier in the region is provided as a shapefile in the Supplement.
Potentially destabilized rock glaciers were mainly located in the Vanoise National Park and in the Queyras and Ubaye mountain ranges. In these areas, densely jointed lithologies (i.e. ophiolites and schists) dominate. Rock glaciers in crystalline lithologies (i.e. gneiss and granite) were found to have low destabilization ratings. That is, only two rock glaciers were rated as possibly destabilized over a population of 55 (Table 3).
The predominant surface disturbance observed was cracks, which were present in 187 of the active rock glaciers (Table 4). Crack clusters also had a high number of observed cases (152), while the deep surface disturbances occurred in about 15 % of all the examined rock glaciers. In general, the occurrences of surface disturbances were dependent on the destabilization rating. Scarps and crevasses were found in about 10 % of unlikely destabilized landforms. The observation of each surface disturbance was highest for potentially destabilized rock glaciers with deep surface disturbances, indicating that in these landforms multiple surface disturbances coexist.
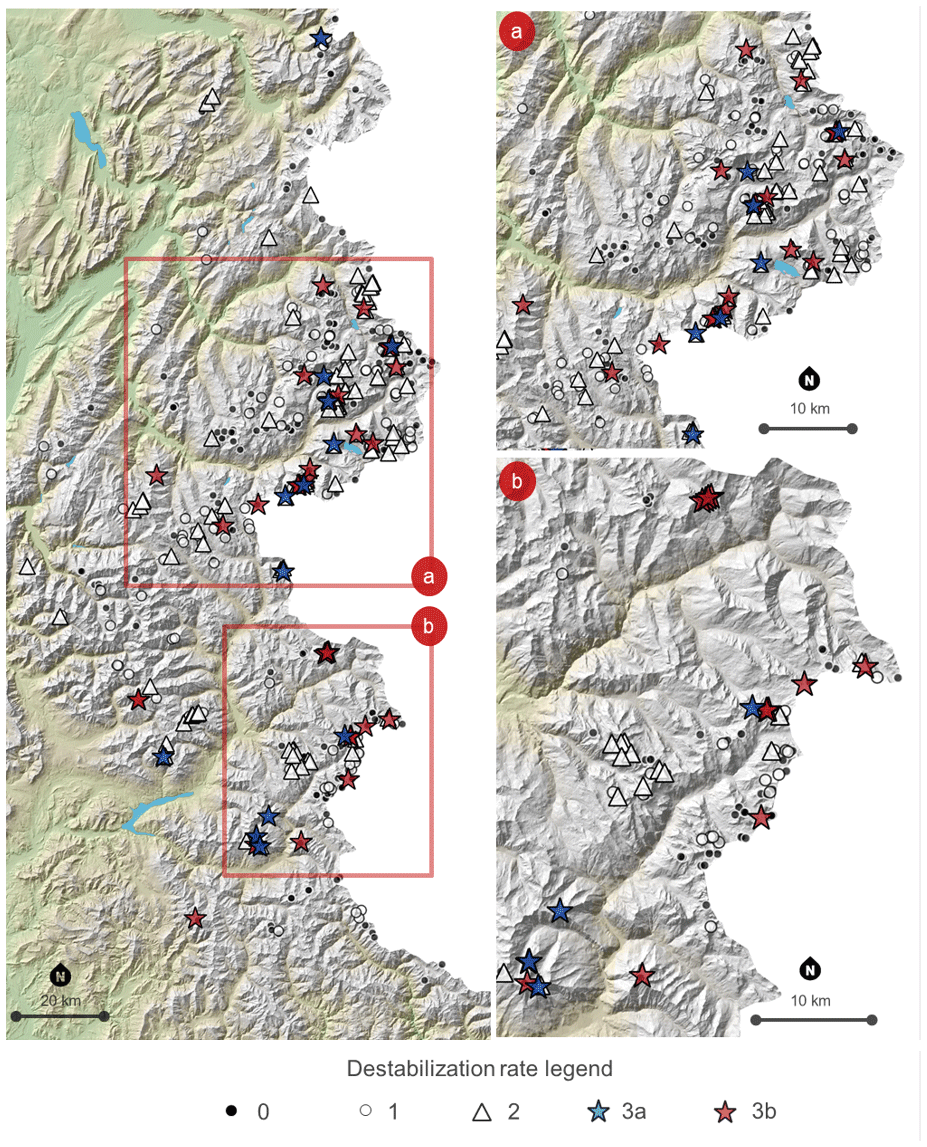
Figure 6Map of active rock glaciers in France by rock glacier destabilization rating, with focus on the (a) Vaonise–Mont Cenis and (b) Ubaye ranges as most of potentially destabilized landforms were observed in these areas.
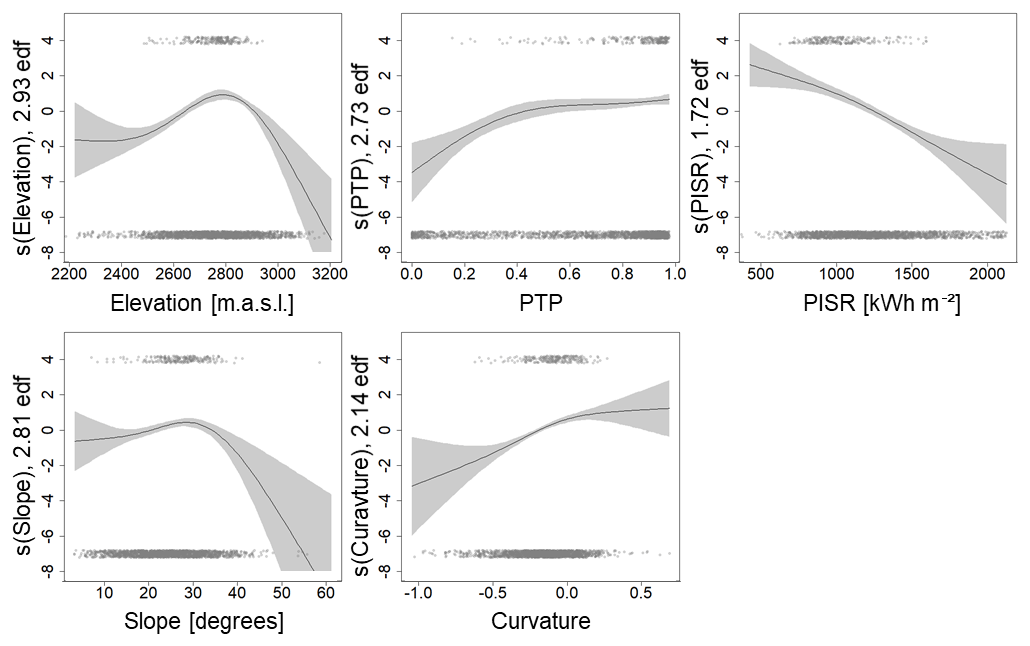
Figure 7Transformation function plots of the GAM model showing the relationship between each predictor variable and destabilization occurrence. The data distribution with respect to predictor variables is indicated with dots on top (destabilization evidence) and on the bottom (stability evidence) of the plots. The y axis represents the transformation of the predictor variable by the GAM's spline, indicated here by “s(predictor)”. The effective degrees of freedom are also reported. The PTP is presented here for explanatory purposes, although it was not included in the final model.
3.2 Modelling
Following a stepwise backward and forward selection, the chosen model included PISR, slope angle, elevation and curvature as predictors. The mean cross-validated AUROC was 0.76 on the test set, indicating a good performance (Hosmer and Lemeshow, 2000). The predictors having the most influence on the response variable were the PISR (AUROC change = 0.162), curvature (AUROC change = 0.068), slope angle (AUROC change = 0.031) and elevation (AUROC change = 0.018).
Table 4Number of rock glaciers per destabilization rating showing a specific surface disturbance.
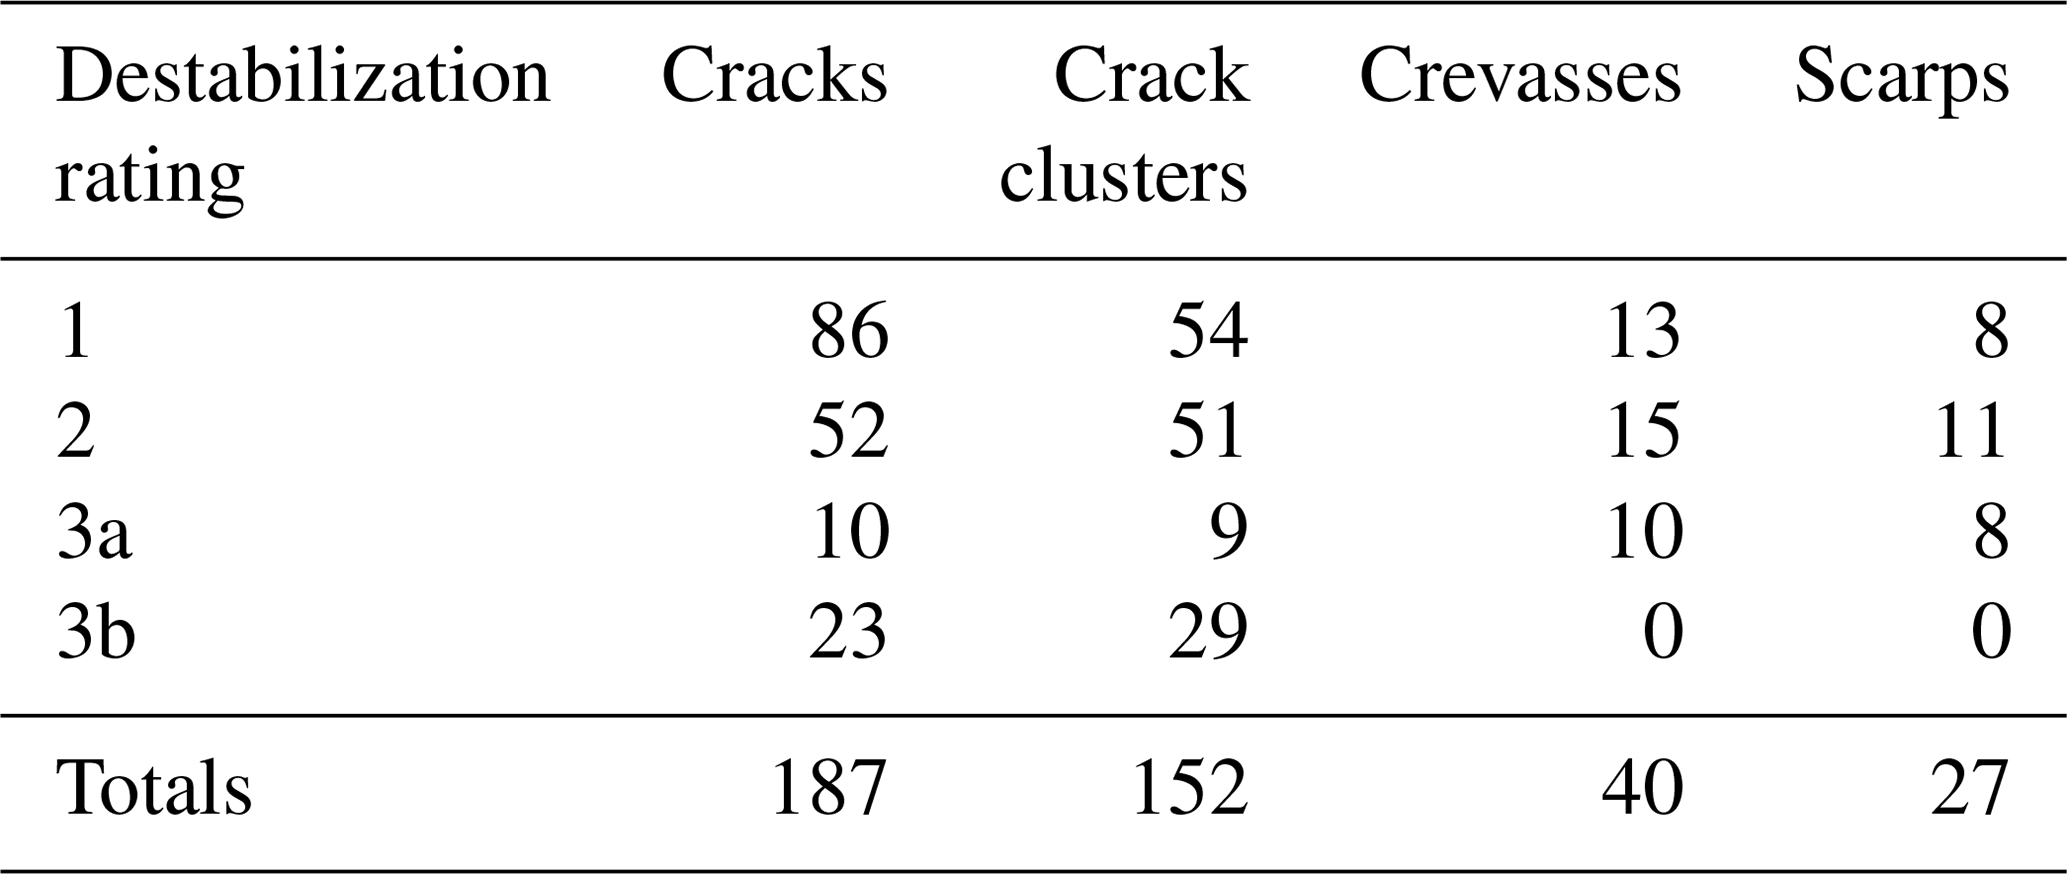
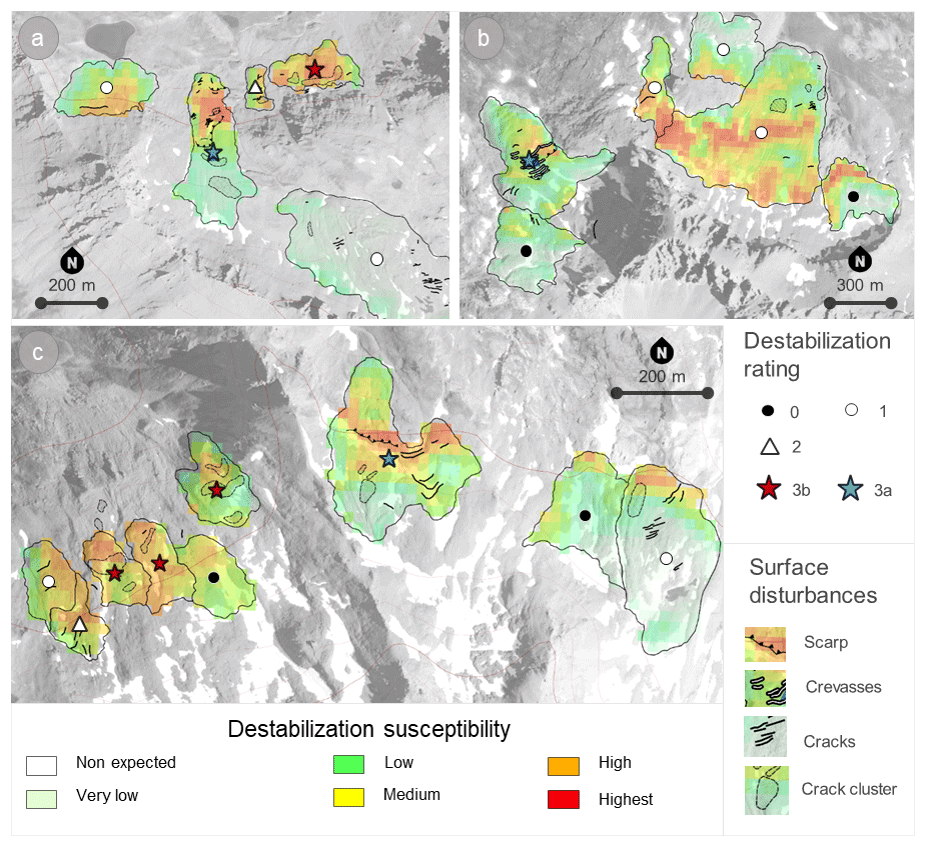
Figure 8Examples of the susceptibility map in (a) Roc Noir, (b) Pierre Brune, and (c) Iseran and neighbouring rock glaciers. The susceptibility map successfully identifies instabilities observed on the potentially destabilized rock glaciers. Nevertheless, some predicted instabilities were observed in areas that appear stable by observing the orthomosaics.
The model transformation functions revealed the relations between terrain attributes and rock glacier stability (Fig. 7). Higher predisposition to destabilization was more likely to occur in an altitudinal range between 2700 and 2900 m a.s.l. and slope angles ranging between 25 and 30∘. Slightly negative to positive curvature was also favourable to destabilization. PISR was negatively correlated with the destabilization probability, indicating that rock glacier destabilization was more likely to occur on north-facing slopes. The relation between PTP and destabilization was also explored by including this predictor variable in the model instead of elevation. Although the PTP caused lower model performance, it could be observed that the PTP was positively correlated with the destabilization.
3.3 Susceptibility map
The susceptibility map highlights creeping permafrost areas susceptible to destabilization based on regional-scale model predictions (examples shown in Fig. 8, and the full map is available in the Supplement). The susceptibility map reproduced the previously known cases of destabilization well. The destabilized areas of Iseran, Roc Noir and Pierre Brune were predicted to have a high susceptibility to destabilization, which matches field observations. In some cases, the susceptibility map predicted high destabilization susceptibility in areas belonging to stable rock glaciers.
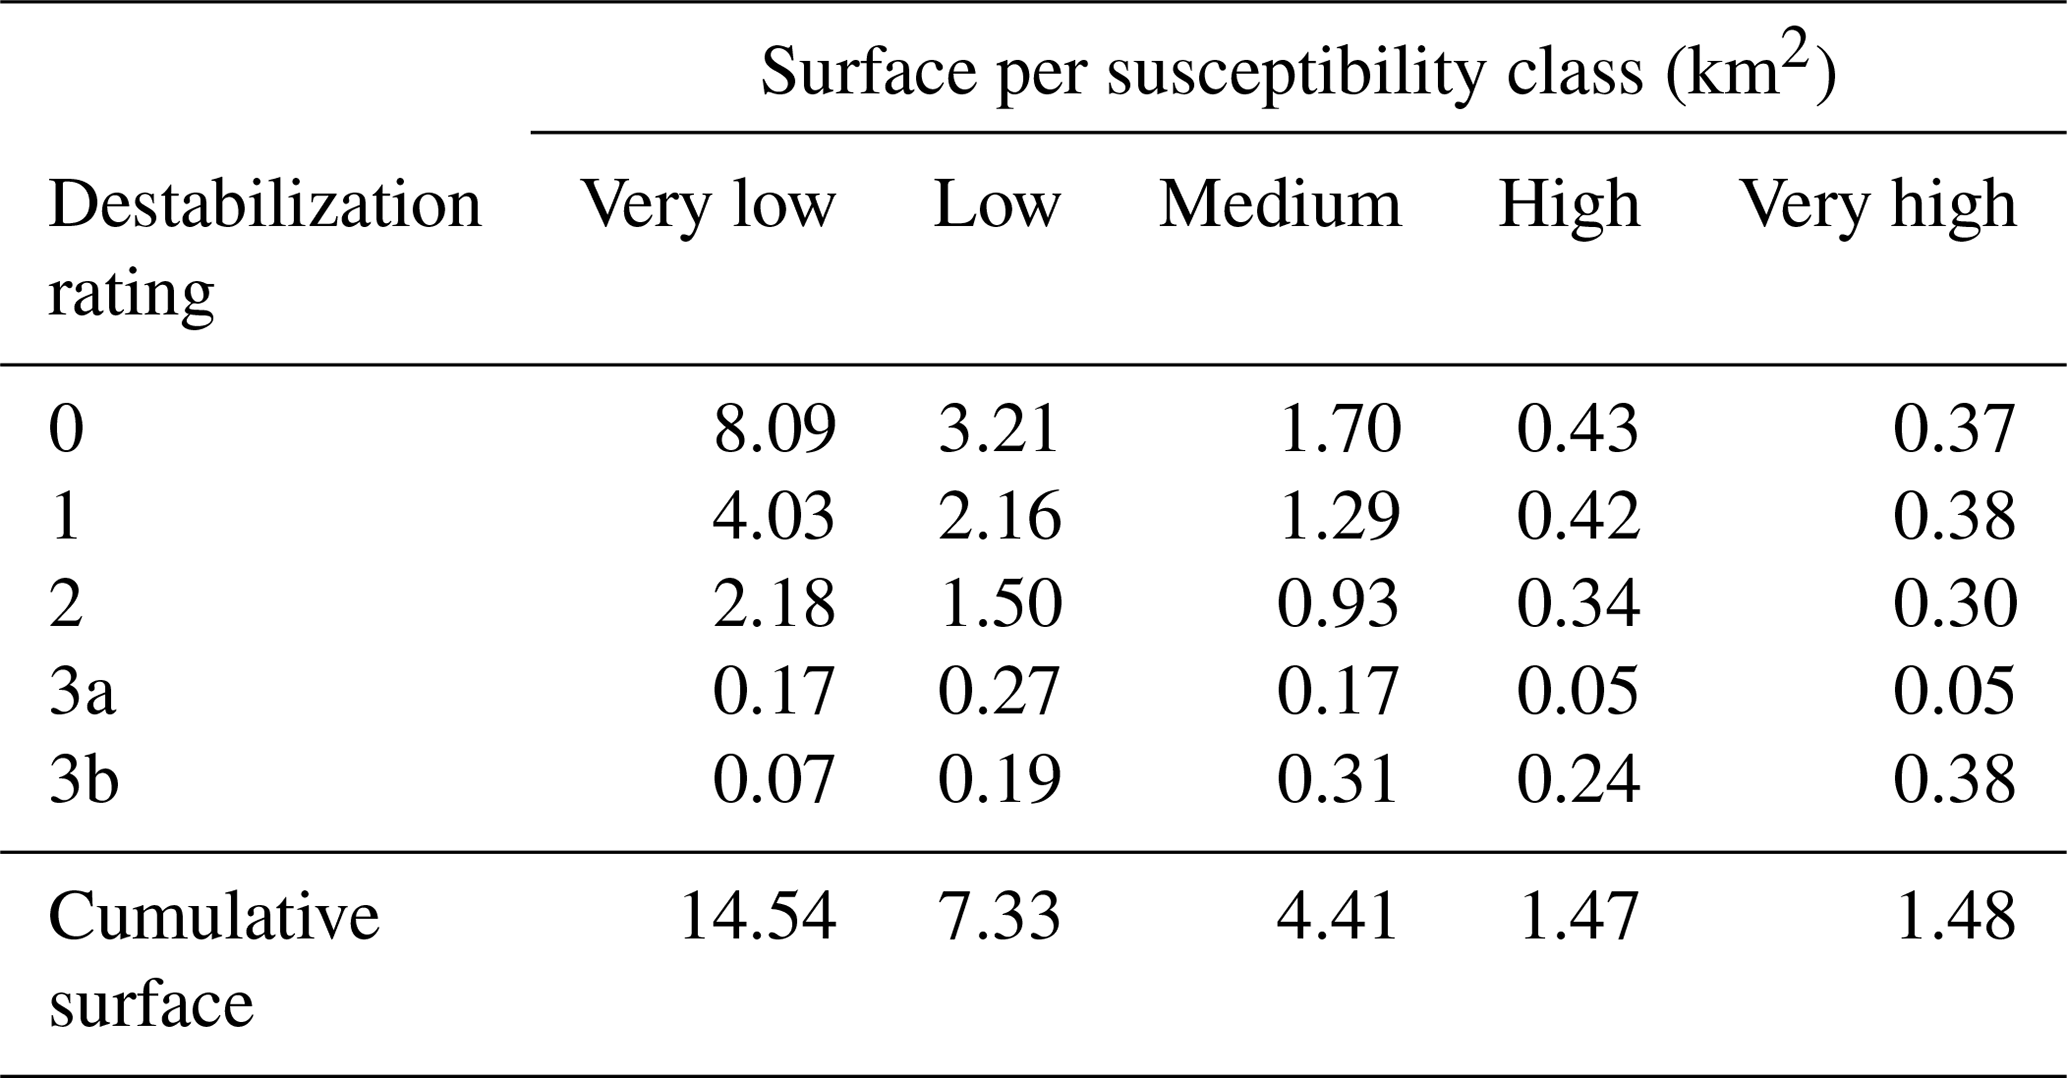
Rock glacier surfaces were investigated with respect to each susceptibility class (Table 5). About 75 % of the creeping permafrost was found at low or very low susceptibility to destabilization. Creeping permafrost at high and very high susceptibility to destabilization accounted for 10 % of the total creeping permafrost surface, i.e. 2.9 km2. While about one-third of this surface was located in potentially destabilized rock glaciers, more than 1.4 km2 of stable and unlikely destabilized rock glaciers was found at high and very high destabilization susceptibility.
4.1 Rating rock glacier destabilization
The present study provided the first comprehensive assessment of rock glacier destabilization for the French Alps and indicates the potentially high prevalence of this phenomenon. Destabilized rock glaciers were more likely located in the Vanoise, Queyras and Ubaye ranges. In these areas the densely jointed lithology was suspected to generate mainly pebbly rock glaciers (Ikeda and Matsuoka, 2006; Matsouka and Ikeda, 2001). This indicates that destabilization may be more likely to develop in pebbly rock glaciers, as observed in the Bérard, Roc Noir and Lou rock glaciers. Also, rock glaciers in crystalline lithology did not show signs of potential destabilization. However, recognizing surface disturbances on pebbly rock glaciers may be easier than in “blocky” rock glaciers, as smaller cracks are more evident. This may create a bias, which should be studied in more detail by investigating geomorphological features of destabilization occurring on blocky rock glaciers.
The majority of rock glaciers showing potential destabilization were characterized by shallow cracks (33 cases versus 13). Although this is suggested to be partially due to the high incidence of rock glaciers located in densely jointed lithology, there are a number of questions that still need to be answered in this context. At present, we are unsure about the significance of these surface disturbances in the context of destabilization. Cracks may be either “mild” evidence of destabilization as they affect only the upper layer of the landform, or a typical surface disturbance occurring on destabilized pebbly rock glaciers. In the first case, using cracks as destabilization evidence could lead to an over-interpretation of the destabilization severity of the landform. Conversely, it was observed that destabilization may occur when only these type of surface disturbances occurred (Schoeneich et al., 2017; Serrano, 2017). Concerning this issue, this study suggested that these landforms deserve more attention due to their high incidence in the regional territory.
Table 5Active rock glacier area per class of destabilization susceptibility.
Overall, rock glacier destabilization rating can be a relevant tool for the local authorities to focus monitoring efforts related to periglacial risk assessment, as we identified all rock glaciers presenting signs of destabilization in the region. The destabilization rating, if combined with an assessment of displacement rates and landform connectivity, could indicate the severity of the potential hazard and be used to help identify actions that should be undertaken to deal with the problem. In general rock glaciers with a low destabilization rating are currently evolving slowly or are stable, and consequently monitoring based on remote sensing may be sufficient. Suspected or potentially destabilized rock glaciers require more caution and in situ monitoring is recommended.
Uncertainties in rating rock glacier destabilization
A potential source of uncertainty in this study was the subjectivity that can occur while mapping surface disturbances and rating the degree of destabilization. These activities were based on expert knowledge; however, it is possible that mapping and rating results vary depending on the operator. For example, the operators in charge of the digitization process were requested to interpret surface features that in many cases have small dimensions with respect to the resolution of the orthoimages, making the identification challenging. Orthoimages can have varying illumination from one year to another, causing surface disturbances to change their appearance. Orthoimages may also be distorted, creating unrealistic deformation patterns of the rock glacier surface. Also, although surface disturbances were inventoried into the catalogue in an attempt to standardize the classification, destabilized rock glacier morphology is complex, and its identification requires intense training. In many cases the boundaries between the different typologies proposed were not sharp. Personal knowledge of the process evolved through the inventory compilation, requiring various iterations to review the work.
Another issue was that the operator's metrics of judgment were subjected to the “prevalence-induced concept change” (Levari et al., 2018), as the classification might become stricter (or looser) when the operator deals with a series of destabilized (or stable) rock glaciers. The ratings were compiled and revised by different operators in an attempt to mitigate these effects. Some cases were the subject of debate, highlighting significant individual biases. These biases can influence the resulting susceptibility model (Steger et al., 2016). It is therefore strongly recommended to integrate the inventory with in situ observations when possible and to maintain a critical attitude towards the data. Currently, France does not have a lidar-based high-resolution DEM covering the study region. Such data could be used to revise the inventory in the future in order to reduce errors due to poor quality of the orthophotos. In particular, having a high-resolution DEM could allow us to avoid issues related to the differentiation between isolated crack and crevasse, as the judgment based on orthoimages may vary depending on the lighting.
Although observing aerial orthoimagery or high-resolution DEMs could not replace the relevance of a proper in situ survey, it provides us with data and resulting insights that would normally not be possible with in situ surveys alone, a characteristic that fitted with the aim of the study. Additionally, the use of orthoimagery has been proven to be a useful approach for mapping rock glacier surface disturbances by Serrano (2017), who compared the results of field observation to observations from orthoimagery. Although Serrano (2017) investigated a limited number of sites, those results were encouraging, showing that the method was relevant. The use of multiple orthoimages was believed to successfully reduce issues related to subjectivity and poor image quality in most of the cases. Observing the movements of the landforms was a valuable decision support tool, as surface disturbances could be related or not to discontinuities in a pronounced displacement field. Also, the use of multiples orthoimages reduced potential errors due to bad lighting that may enhance features that may be unrelated to destabilization processes (Serrano, 2017).
4.2 Modelling the predisposition to rock glacier destabilization
Despite the various limitations of the data, the results were encouraging. The spatially cross-validated model had a good performance, suggesting that the method is valuable in the context of modelling rock glacier stability. The relationships with predictor variables were found to be consistent with topographic settings observed in known cases of destabilization. High slope angles are suggested to increase internal shear, making the landform more susceptible to destabilization (Schoeneich et al., 2015). Convex slopes cause an extensive flow pattern as creep velocity is higher downslope from the convexity (Delaloye et al., 2013). This suggests that a thinning of the permafrost body and the generation of traction forces may intensify the occurrence of surface disturbances.
PISR had the most importance in the model, suggesting that rock glacier destabilization was primarily more likely to occur on north-facing slopes. We cannot offer a convincing explanation of this phenomenon since, at the present state of the art, there is no systematic study comparing rock glacier characteristics in relation to their solar exposure. Nevertheless, we suggest that a possible explanation resides in the variability in meltwater input of the rock glaciers with respect to solar exposure. Ikeda et al. (2008) suggest that high water input can boost destabilization by reducing internal friction. Considering that snow patches tend to last longer on north-facing slopes, meltwater inputs may be more significant than on south-facing slopes.
Modelling rock glacier destabilization using PTP instead of elevation revealed that an increasing potential in permafrost thaw was linked to an increase in susceptibility to destabilization, indicating that destabilization was more likely to occur where the permafrost zone was expected to be thawing. This seems to be consistent with the relationship between destabilization and elevation, as potentially destabilized rock glaciers are more often located around 2800 m a.s.l., which roughly coincides with the lower margins of the regional permafrost zone.
4.3 Susceptibility map
Overall, permafrost destabilization was adequately described, as indicated by the cross-validated performance, in most of the observed cases of destabilization. Although cases of potential destabilization were inventoried, rock glaciers that have a low rating of destabilization and are located in areas with high susceptibility should be identified as having a high potential of future destabilization. Results indicated that these rock glaciers had a large area of high predisposition to destabilization, suggesting that there is a high potential for future destabilization in the region. The map may therefore be used to spot rock glaciers that present a predisposition to develop destabilization. In particular, the Laurichard rock glacier is a site currently under monitoring and was found to present a low to medium susceptibility to destabilization in this study (Bodin et al., 2008). The comparison of the future evolution of this landform with respect to the susceptibility map is therefore recommended.
The present study aimed to give insights into the extent of destabilizing rock glaciers in the French Alps. Mapping and modelling rock glacier destabilization in this region was conducted using an orthoimagery collection, a 25 m × 25 m resolution DEM and statistical modelling. This methodology carried several limitations, due to subjectivity and modelling issues. Therefore, absolute model performance and the appearance of the susceptibility map may not be exact, and further work is strongly encouraged. Integrating the observations with a high-resolution lidar DEM and with new field-observations could spot possible systematic biases in the destabilization rating attribution and significantly reduce uncertainty.
Despite the limitations of this methodology, the study contributes to the knowledge related to permafrost degradation in the French Alps. Rock glacier destabilization potentially involves 46 active landforms, uniquely located in non-crystalline lithologies, which are typically densely jointed as ophiolites and schist. Shallow surface disturbances (i.e. cracks) had the highest incidence in potentially destabilized rock glaciers. At present, there are several questions concerning the destabilization of pebbly rock glaciers presenting these shallow surface disturbances, as only a few studies tackled the subject. Therefore, considering the high incidence of these landforms in the region, it is suggested to dedicate more attention to these issues in the future.
The destabilization of creeping permafrost was found to be a widespread phenomenon that involves more than 10 % of the total surface of active rock glaciers, i.e. 3 km2. Only half of this surface was attributed to rock glaciers currently showing a relevant degree of destabilization, suggesting that several stable rock glaciers have a significant degree of susceptibility to experience destabilization in the future. Rock glacier destabilization was found to more likely occur at the lower margins of the permafrost zone, i.e. where permafrost thaw due to climate warming is expected to be more intense. This suggests that climate warming may have increased the predisposition of creeping permafrost to slope failure. In this context, the present study contributes by having mapped potentially destabilized rock glaciers and areas considered susceptible to destabilization, allowing us to focus future monitoring efforts. In this sense, we suggest that the modelling framework proposed is relevant and further efforts to better acknowledge the phenomena are strongly encouraged.
Shape files of destabilization ratings at rock glacier locations and destabilization susceptibility maps are available in the Supplement (.tiff format). Data are referenced in EPSG: 2154.
The supplement related to this article is available online at: https://doi.org/10.5194/tc-13-141-2019-supplement.
MM, CS, XB and PS conceived the project and collected and interpreted data. MM, AB and JG designed the modelling approach. MM wrote the paper. All authors contributed to discussion and editing. AB and JG provided feedback on the writing.
The authors declare that they have no conflict of interest.
The present study was funded by the region Auvergne-Rhône-Alpes through the
ARC-3 grant and by the European Regional Development Fund (POIA PA0004100)
grant. The Lanslebourg–Val Cenis municipality also contributed to the
present study by funding internships within the PERMARISK project. We would finally like to acknowledge the two anonymous reviewers for their
highly constructive feedback provided during the reviewing process.
Edited by: Moritz Langer
Reviewed by: two anonymous referees
Auer, I., Böhm, R., Jurkovic, A., Lipa, W., Orlik, A., Potzmann, R., Schöner, W., Ungersböck, M., Matulla, C., Briffa, K., Jones, P., Efthymiadis, D., Brunetti, M., Nanni, T., Maugeri, M., Mercalli, L., Mestre, O., Moisselin, J., Begert, M., Müller-Westermeiner, G., Kveton, V., Bochnicek, O., Stastny, P., Lapin, M., Szalai, S., Szentimrey, T., Cegnar, T., Dolinar, M., Gajic-Capka, M., Zaninovic, K., Majstorovic, Z., and Nieplova, E.: HISTALP – historical instrumental climatological surface time series of the Greater Alpine Region, Int. J. Climatol., 27, 17–46, https://doi.org/10.1002/joc.1377, 2007. a, b, c
Avian, M., Kaufmann, V., and Lieb, G. K.: Recent and Holocene dynamics of a rock glacier system: The example of Langtalkar (Central Alps, Austria), Norsk Geogr. Tidsskr., 59, 149–156, https://doi.org/10.1080/00291950510020637, 2005. a
Bodin, X., Schoeneich, P., and Jaillet, S.: High-Resolution DEM Extraction from Terrestrial LIDAR Topometry and Surface Kinematics of the Creeping Alpine Permafrost: The Laurichard Rock Glacier Case Study (Southern French Alps), in: Proceedings of the Ninth International Conference on Permafrost, Fiarbanks, Alaska, USA, 29 June–3 July 2008, 137–142, 2008. a
Bodin, X., Thibert, E., Fabre, D., Ribolini, A., Schoeneich, P., Francou, B., Reyanud, L., and Fort, M.: Two Decades of Responses (1986–2006) to Climate by the Laurichard Rock Glacier, French Alps, Permafrost Periglac., 344, 331–344, https://doi.org/10.1002/ppp.665, 2009. a, b
Bodin, X., Schoeneich, P., Deline, P., Ravanel, L., Magnin, F., Krysiecki, J. M., and Echelard, T.: Mountain permafrost and associated geomorphological processes: recent changes in the French Alps, Journal of Alpine Research, 103-2, https://doi.org/10.4000/rga.2885, 2015. a
Bodin, X., Krysiecki, J., Schoeneich, P., Roux, O., Lorier, L., Echelard, T., Peyron, M., and Walpersdorf, A.: The 2006 Collapse of the Bérard Rock Glacier (Southern French Alps), Permafrost Periglac., 28, 209–223, https://doi.org/10.1002/ppp.1887, 2016. a, b, c
Boeckli, L., Brenning, A., Gruber, S., and Noetzli, J.: Permafrost distribution in the European Alps: calculation and evaluation of an index map and summary statistics, The Cryosphere, 6, 807–820, https://doi.org/10.5194/tc-6-807-2012, 2012. a
BRGM: BD Million-Géol: Carte Géologique à 1∕1 000 000 Métropole, Image et Vecteur, avaiable at: http://www.brgm.fr/sites/default/files/plaquette_million_2015.pdf (last access: 2 May 2018), 2015. a
Damm, B. and Felderer, A.: Impact of atmospheric warming on permafrost degradation and debris flow initiation – a case study from the eastern European Alps, Quaternary Sci. J., 62, 136–149, https://doi.org/10.3285/eg.62.2.05, 2013. a
Davies, M. C. R., Hamza, O., and Harris, C.: The Effect of Rise in Mean Annual Temperature on the Stability of Rock Slopes Containing Ice-Filled Discontinuities, Permafrost Periglac., 12, 137–144, https://doi.org/10.1002/ppp.378, 2001. a
Delaloye, R., Perruchoud, E., Avian, M., Kaufmann, V., Bodin, X., Hausmann, H., Ikeda, A., and Kääb, A.,Kellerer-Pirkelbauer, A., Krainer, K., Lambiel, C., Mihajlovic, D., Staub, B., Roer, I., and Thibert, E.: Recent interannual variations of rock glacier creep in the European Alps, in: Proceedings of the 9th International Conference on Permafrost, Fairbanks, Alaska, USA, 28 June–3 July 2008, 1, 343–348, 2008. a, b, c, d, e
Delaloye, R., Morard, S., Barboux, C., Abbet, D., Gruber, V., Riedo, M., and Gachet, S.: Rapidly moving rock glaciers in Mattertal, Jahrestagung Der Schweizerischen Geomorphologischen Gesellschaft, 29 June–1 July 2011, St. Niklaus, Switzerland, i, 21–31, 2013. a, b, c, d, e, f, g
Echelard, T.: Contribution à l'étude de la dynamique des glaciers rocheux dans les Alpes françaises par interférométrie radar différentielle (D-InSAR), PhD Thesis, Laboratoires PACTE et GIPSA-lab, Université Joseph Fourier, Grenoble, France, 214 pp., 2014. a, b, c, d
Eriksen, H. Ø., Rouyet, L., Lauknes, T. R., Berthling, I., Isaksen, K., Hindberg, H., Larsen, Y., and Corner, G. D.: Recent acceleration of a rock glacier complex, Adjet, Norway, documented by 62 years of remote sensing observations, Geophys. Res. Lett., 45, 8314–8323, https://doi.org/10.1029/2018GL077605, 2018. a, b
Freeman, G. T.: Calculating catchment area with divergent flow based on a regular grid, Comput. Geosci., 17, 413–422, https://doi.org/10.1016/0098-3004(91)90048-I, 1991. a
Goetz, J. N., Guthrie, R. H., and Brenning, A.: Integrating physical and empirical landslide susceptibility models using generalized additive models, Geomorphology, 129, 376–386, https://doi.org/10.1016/j.geomorph.2011.03.001, 2011. a, b, c, d
Gottardi, F.: Estimation statistique et réanalyse des précipitations en montagne Utilisation d'ébauches par types de temps et assimilation de données d'enneigement Application aux grands massifs montagneux français, PhD Thesis, Institut National Polytechnique de Grenoble – INPG, Grenoble, France, 284 pp., 2009. a
Haeberli, W., Guodong, C., Gorbunov, A. P., and Harris, S. A.: Mountain Permafrost and Climatic Change, Permafrost Periglac., 4, 165–174, https://doi.org/10.1002/ppp.3430040208, 1993. a
Haeberli, W., Wegmann, M., and Vonder Muhll, D.: Slope stability problems related to glacier shrinkage and permafrost degradation in the Alps Slope stability problems related to glacier shrinkage and permafrost, Eclogae Geol. Helv., 90, 407–414, 1997. a
Haeberli, W., Noetzli, J., Arenson, L., Delaloye, R., Gärtner-Roer, I., Gruber, S., Isaksen, K., Kneisel, C., Krautblatter, M., and Phillips, M.: Mountain permafrost: Development and challenges of a young research field, J. Glaciol., 56, 1043–1058, https://doi.org/10.3189/002214311796406121, 2010. a, b
Harris, C. and Davies, M. E. B.: The assessment of potential geotechnical hazards associated with mountain permafrost in a warming global climate, Permafrost Periglac., 12, 145–156, https://doi.org/10.1002/ppp.376, 2001. a
Harris, C., Vonder Mühll, D., Isaken, K., Haeberli, W., Sollid, J. L., King, L., Holmund, P., Dramis, F., Guglielmin, F., and Palacios, D.: Warming permafrost in European mountains, Global Planet. Change, 39, 215–225, 2003. a
Hoelzle, M. and Haeberli, W.: Simulating the effects of mean annual air-temperature changes on permafrost distribution and glacier size: An example from the Upper Engadin, Swiss Alps, Ann. Glaciol., 21, 399–405, https://doi.org/10.3189/S026030550001613X, 1995. a
Hosmer, D. W. and Lemeshow, S.: Applied Logistic Regression, John Wiley & Sons, New York, USA, 2000. a, b
Huggel, C., Salzmann, N., Allen, S., Caplan- Auerbach, J., Fischer, L., Haeberli, W., and Wessels, R.: Recent and future warm extreme events and high-mountain slope stability, Philos. T. Roy. Soc., 368, 2435–2459, https://doi.org/10.1098/rsta.2010.0078, 2010. a
IGN: BD ALTI R, Version 2.0 – Descriptif de Contenu, available at: http://pro.ign.fr/sites/default/files/DC_BDALTIV2.pdf (last access: 26 December 2018), 2011. a, b
IGN: Les ortho-images, suivi des évolutions, available at: http://professionnels.ign.fr/doc/SE_BDORTHO_ORTHOHR.pdf (last access: 26 December 2018), 2013. a
Ikeda, A. and Matsuoka, N.: Pebbly versus bouldery rock glaciers: Morphology, structure and processes, Geomorphology, 73, 279–296, https://doi.org/10.1016/j.geomorph.2005.07.015, 2006. a, b
Ikeda, A., Matsuoka, N., and Kääb, A.: Fast deformation of perennially frozen debris in a warm rock glacier in the Swiss Alps: An effect of liquid water, J. Geophys. Res., 113, 1–12, https://doi.org/10.1029/2007JF000859, 2008. a, b, c
IPCC: Climate Change 2013: The Physical Science Basis, in: Contribution of Working Group I to the Fifth Assessment Report of the Intergovernmental Panel on Climate Change, edited by: Stocker, T. F., Qin, D., Plattner, G.-K., Tignor, M., Allen, S. K., Boschung, J., Nauels, A., Xia, Y., Bex, V., and Midgley, P. M., Cambridge University Press, Cambridge, UK and New York, NY, USA, 1535 pp., https://doi.org/10.1017/CBO9781107415324, 2013. a
Kellerer-Pirklbauer, A. and Kaufmann, V.: About the relationship between rock glacier velocity and climate parameters in central Austria, Austrian J. Earth Sc., 105, 94–112, 2012. a
Lambiel, C.: Le glacier rocheux déstabilisé de Tsaté-Moiry (VS): caractéristiques morphologiques et vitesses de déplacement, in: La Géomorphologie Alpine: Entre Patrimoine et Contrainte, 3–5 September 2009, Olivone, Switzerland, 211–224, 2011. a, b, c
Lambiel, C. and Reynard, E.: Regional modelling of present, past and future potential distribution of discontinuous permafrost based on a rock glacier inventory in the Bagnes-Hérémence area (Western Swiss Alps), Norsk Geogr. Tidsskr., 55, 219–223, https://doi.org/10.1080/00291950152746559, 2001. a, b
Levari, D. E., Gilbert, D. T., Wilson, T. D., Sievers, B., Amodio, D. M., and Wheatley, T.: Prevalence-induced concept change in human judgment, Psychology, 360, 1465–1467, https://doi.org/10.1126/science.aap8731, 2018. a
Marcer, M., Bodin, X., Brenning, A., Schoeneich, P., Charvet, R., and Gottardi, F.: Permafrost Favorability Index: Spatial Modeling in the French Alps Using a Rock Glacier Inventory, Front. Earth Sci., 5, 1–17, https://doi.org/10.3389/feart.2017.00105, 2017. a, b, c, d, e
Matsuoka, N. and Ikeda, A.: Geological control on the distribution and characteristics of talus-derived rock glaciers, Ann. Rep., Inst. Geosci., Univ. Tsukuba, 27, 11–16, 2001. a
Nater, P., Arenson, L., and Springman, S.: Choosing Geotechnical Parameters for Slope Stability Assessments in Alpine Permafrost Soils in Alpine Permafrost Soils, in: Proceedings of the Ninth International Conference on Permafrost, Fairbanks, Alaska, USA, 29 June–3 July 2008, 1261–1266, 2008. a
PERMOS: Permafrost in Switzerland 2010/2011 to 2013/2014, Glaciological Report Permafrost No. 12–15 of the Cryospheric Commission of the Swiss Academy of Sciences, edited by: Noetzli, J., Luethi, R., and Staub, B., Fribourg, Switzerland, 85 pp., 2016. a
Ravanel, L. and Deline, P.: Climate influence on rockfalls in high-Alpine steep rockwalls: the north side of the Aiguilles de Chamonix (Mont Blanc massif) since the end of the “Little Ice Age”, Holocene, 21, 357–365, https://doi.org/10.1177/0959683610374887, 2010. a
Roer, I., Kääb, A., and Dikau, R.: Rockglacier acceleration in the Turtmann Valley (Swiss Alps): Probable Controls, Norsk Geogr. Tidsskr., 59, 157–163, https://doi.org/10.1080/00291950510020655, 2005.
Roer, I., Haeberli, W., Avian, M., Kaufmann, V., Delaloye, R., Lambiel, C., and Kääb, A.: Observations And Considerations On Destabilizing Active Rock glaciers In The European Alps, in: Proceedings of the Ninth international conference on permafrost, Fairbanks, Alaska, USA, 29 June–3 July 2008, 1505–1510, 2008. a, b, c, d, e, f, g, h, i, j, k, l
Roudnitska, S., Charvet, R., Ribeyre, C., and Favreaux B. L.: Les Glaciers- Rocheux De Savoie: Inventaire, Cartographie Et Risques Associés – Rapport Provisoire, Office National des Forets, Service de Restauration des Terrains en Montagne, Chambéry, France, 84 pp., 2016. a
Rudy, A. C. A., Lamoureux, S. F., Treitz, P., Ewijk, K. Van, Bonnaventure, P. P., and Budkewitsch, P.: Terrain Controls and Landscape-Scale Susceptibility Modelling of Active-Layer Detachments, Sabine Peninsula, Melville Island, Nunavut, Permafrost Periglac., 28, 79–91, https://doi.org/10.1002/ppp.1900, 2017. a, b
Ruß, G. and Brenning, A.: Data mining in precision agriculture: Management of spatial information, in: Computational Intelligence for Knowledge-Based Systems Design, Springer, Berlin, Germany, 350–359, 2010a. a
Ruß, G. and Brenning, A.: Spatial Variable Importance Assessment for Yield Prediction in Precision Agriculture, in: Computational Intelligence for Knowledge-Based Systems Design, Springer, Berlin, Germany, 184–195, 2010b. a
Scapozza, C., Lambiel, C., Reynard, E., Fallot, J. M., Antognini, M., and Schoeneich, P.: Radiocarbon dating of fossil wood remains buried by the piancabella rock glacier, Blenio valley (Ticino, Southern Swiss Alps): Implications for rock glacier, treeline and climate history, Permafrost Periglac., 21, 90–96, https://doi.org/10.1002/ppp.673, 2010. a
Scherler, M., Hauck, C., Hoelzle, M., and Nadine, S.: Modeled sensitivity of two alpine permafrost sites to RCM-based climate scenarios climate scenarios, J. Geophys. Res., 118, 780–784, https://doi.org/10.1002/jgrf.20069, 2013. a
Schoeneich, P., Echelard, T., Krysiecki, J.-M., Kergomard, F., Lorier L., Mingrat, L., Darricau, C., Jugnet, P., Cotoni, T., Mellan L., Huwald, H., and Berton, F.: The borehole 2Alpes-3065 – a pilot installation for fiber optic DTS measurements in permafrost, in: Proceedings of the Tenth International Conference on Permafrost, 20–27 June 2012, Salekhard, Russia, 4/2, 507–508, 2012. a
Schoeneich, P., Bodin, X., Echelard, T., Kellerer-Pirklbauer, A., Krysiecki, J.-M., and Lieb, G. K.: Velocity Changes of Rock Glaciers and Induced Hazards, in: Engineering Geology for Society and Territory, edited by: Lollino, G., Manconi, A., Clague, J., Shan, W., and Chiarle, M., https://doi.org/10.1007/978-3-319-09300-0_42, 2015. a, b, c, d
Schoeneich, P., Ribeyre, C., Marcer, M., Bodin, X., and Brenguier, O.: Etude géomorphologique et géophysique du glacier rocheux du Col du Lou suite à la lave torrentielle du 14 août 2015, Technical report, Université Grenoble-Alpes, Grenoble, France, 42 pp., 2017. a, b, c, d, e
Scotti, R., Crosta, G. B., and Villa, A.: Destabilisation of Creeping Permafrost: The Plator Rock Glacier Case Study (Central Italian Alps), Permafrost Periglac., 28, 224–236, https://doi.org/10.1002/ppp.1917, 2016. a, b, c
Serrano, C.: Analyse géospatiale des glaciers rocheux déstabilisés en Haute Maurienne – Vanoise et en Ubaye, Master Thesis, University of Grenoble-Alpes, Department of Geography, Grenoble, France, 73 pp., 2017. a, b, c, d, e, f, g, h, i, j, k, l, m, n
Springman, S. M., Yamamoto, Y., Buchli, T., Hertich, M., Maurer, H., Merz, K., Gartner-Roer, I., and Seward, L.: Rock Glacier Degradation and Instabilities in the European Alps: A Characterisation and Monitoring Experiment in the Turtmanntal, CH, Landslide Science and Practice, 4, 329–333, https://doi.org/10.1007/978-3-642-31337-0_1, 2013. a
Steger, S., Brenning, A., Bell, R., and Glade, T.: The propagation of inventory-based positional errors into statistical landslide susceptibility models, Nat. Hazards Earth Syst. Sci., 16, 2729–2745, https://doi.org/10.5194/nhess-16-2729-2016, 2016. a
Wilson, J. P. and Gallant, J. C.: Terrain Analysis – Principles and Applications, John Wiley & Sons, Inc., New York, USA, 2000. a
Wood, S. N.: Generalized Additive Models: An Introduction with R (2nd edition), Chapman and Hall/CRC Press, Boca Raton, USA, 2017. a