the Creative Commons Attribution 4.0 License.
the Creative Commons Attribution 4.0 License.
 | 19 Jun 2018
Autonomous ice sheet surface mass balance measurements from cosmic rays
Ian M. Howat
Santiago de la Peña
Darin Desilets
Gary Womack
Observations of mass accumulation and net balance on glaciers and ice sheets are sparse due to the difficulty of acquiring manual measurements and the lack of a reliable remote-sensing method. The methodology for recording the water-equivalent accumulation of snowfall using the attenuation of fast neutrons generated by cosmic ray impacts was developed in the 1970s and has been employed in large-network snowpack monitoring but has yet to be applied to glaciers and ice sheets. In order to assess this potential method, we installed a cosmic ray neutron-sensing device at Summit Camp, Greenland, in April 2016. Hourly neutron count was recorded for ∼ 24 months and converted to water-equivalent thickness after correcting for variability in atmospheric pressure and incoming cosmic radiation. The daily accumulation estimates are analysed for noise level and compared to manual surface core and snow stake network measurements. Based on measurements of up to 56 cm of water equivalent, we estimate the sensor's precision to be better than 1 mm for water-equivalent thicknesses less than 14 cm and better than 1 cm in up to 140 cm, or approximately 0.7 %. Our observations agree with the surface core measurements to within their respective errors, with temporary biases that are explained by snow drifting, as supported by comparison to the snow stake network. Our observations reveal large temporal variability in accumulation on daily to monthly scales, but with similar annual totals. Based on these results, cosmic ray sensing represents a potentially transformative method for acquiring continuous in situ measurements of mass accumulation that may add constraint to glacier and ice sheet mass balance estimates from meteorological models and remote sensing.
- Article
(3308 KB) - Full-text XML
- BibTeX
- EndNote


Ice sheets and glaciers gain mass from the accumulation of snow and lose mass primarily from meltwater runoff and iceberg calving, with smaller amounts from sublimation and basal melting. Accurate measurements of these terms are necessary for assessing the contribution of land ice to rising sea levels. All methods for estimating glacier and ice sheet mass balance, with the exception of satellite gravimetry, require observations or model estimates of the mass accumulated per time. Multiple remote-sensing methods exist for measuring the volume of accumulation, including repeat satellite or airborne altimetry and snow-penetrating radar, but the density of the accumulation and therefore its mass are unknown. Mass accumulation rates are most commonly obtained through in situ sampling from snow pits and firn cores, typically with an annual resolution corresponding to identifiable seasonal layering. Such methods are laborious, logistically expensive and provide only a point measurement affected by local variability due to drifting and scouring. Active radar imaging of the upper snow surface has been employed successfully to measure mass accumulation, but the power and maintenance requirements of these systems, and their sensitivity to meltwater, make them currently impractical for long-term (> 1 year) autonomous deployment in remote locations. Other methods typically used to monitor seasonal mountain snowpacks, including snow pillows and mechanical scales, are ill suited to glaciers and ice sheets. Snow pillows require the transport or on-site generation of hundreds of kilograms of water and antifreeze to fill the pressure bladder, and they will still freeze at polar temperatures. Both methods require a large level surface for deployment, and they may underestimate mass due to stress bridging by strong layers in the snowpack.
Cosmic ray neutrons are generated through collision of cosmic rays, high-energy particles generated from supernova, with the Earth's atmosphere. The hydrogen in water attenuates such neutrons, with attenuation increasing predictably with the mass of water surrounding a measurement sensor. In a series of experiments, Kodama et al. (1975, 1979) and Kodama (1980) designed and deployed passive sensors that used the attenuation of cosmic ray neutrons by accumulating snowfall to estimate time series of snow-water-equivalent thickness of mountain snowpack. These sensors were able to measure daily water-equivalent (w.e.) thickness with an accuracy of 3–4 % (Kodama, 1980). Additionally, the sensor is sensitive to snowfall over relatively large area (tens of square meters), providing an aerially averaged estimate. Further, since the maximum limit of observable water thickness is determined by the minimum number of counts required to provide a statistically significant mean, the method could ostensibly work in water-equivalent thicknesses exceeding 10 m. While this method was further refined and adapted successfully to monitoring soil moisture (Kodama et al., 1985), it was not widely applied to measuring snowpack until 1998, when the French electric utility installed a network of 40 cosmic ray snow gauges for hydroelectric monitoring (Paquet and Laval, 2005, 2008). An extensive comparison between snow cores and cosmic ray neutron sensor (CRNS) estimates revealed accuracies in water-equivalent thickness between 12 and 20 %, with much of the discrepancy due to spatial variability in the snowpack between the cores and the sensors, as well as a significant uncertainty due to variations in the moisture of the underlying soil. Accounting for these differences resulted in hourly water-equivalent thickness estimated with accuracies better than 5 % (Paquet and Laval, 2008), consistent with the results of Kodama (1980).
Cosmic ray sensing therefore provides a potentially effective method for measuring mass balance in the accumulation zones of ice sheets and glaciers. Since the cosmic ray neutron count rate is only sensitive to the mass, and not the density, of the firn, it integrates the processes of snowfall, sublimation, deposition, and vertical vapour and meltwater fluxes into a single measurement of local mass balance. Glaciers and ice sheets are also particularly suitable to cosmic ray sensing because, firstly, neutron counts increase with altitude and latitude, due to decreasing atmospheric attenuation, which increases the accuracy and resolvable maximum thickness for a given temporal resolution. Secondly, unlike seasonal snowpack, there is no uncertainty associated with variable soil moisture or, in the case of cold polar ice sheets, horizontal water transport. Thirdly, the sensor's effective cone of measurement provides an aerial average that should be less sensitive to spatial variability caused by drifting. Fourthly, since the CRNS is passive and primarily consists of only polyethylene in a steel case, it is lightweight, compact and durable, and it has a low power requirement, providing ease of deployment in extreme polar environments. Finally, while cosmic ray neutron sensing only provides a local measurement of accumulation, continuous measurements from networks of sensors may be used to correct and validate ice-sheet-wide mass balance estimates from atmospheric models and satellite altimetry.
Here we assess the potential for cosmic ray neutron sensing of glacier and ice sheet surface mass balance through deployment of a CRNS at Summit Camp (72.57∘ N, 38.46∘ W), located 3216 m above sea level in the centre of the Greenland Ice Sheet. We describe the deployment setup, the characteristics of the raw neutron count data, and the correction and validation datasets, and we compare the raw to the corrected count data and water-equivalent accumulation estimate. We present our daily and monthly water-equivalent accumulation rates at Summit Camp and then compare those estimates to manual observations of surface accumulation for validation.
Summit Camp was chosen for its continuous power supply and climate-controlled instrumentation housing. These, and the year-round presence of support staff to troubleshoot if needed, simplified this initial deployment and reduced the risk of power or communications failure, allowing the focus to be only on assessment of the cosmic ray neutron counting methodology. Summit Camp personnel were also able to perform the validation surveys. Summit Camp has an annual water-equivalent accumulation of 24 cm and an average surface density of 0.28 g cm−3 (Alley et al., 1993; Montgomery et al., 2018). Snowfall occurs throughout the year, with some uncertainty about the seasonality of accumulation (Dibb and Fahnestock, 2004).
We installed a Hydroinnova SnowFox™ CRNS instrument at Summit Camp on 30 April 2016. The SnowFox™ is a 81 cm long and 20 cm diameter tube that was placed horizontally in a shallow trench in the firn so that the top of the SnowFox™ was ∼ 20 cm below the surface (Fig. 1). The trench was then allowed to fill with wind-blown snow, burying the sensor. A 100 m long power and communications cable connects the CRNS to a data logger, telemetry modem and continuous power supply housed in the climate-controlled Mobile Science Facility (MSF) at Summit Camp. The CRNS recorded hourly counts of neutron impacts, as well as hourly average barometric pressure and temperature.
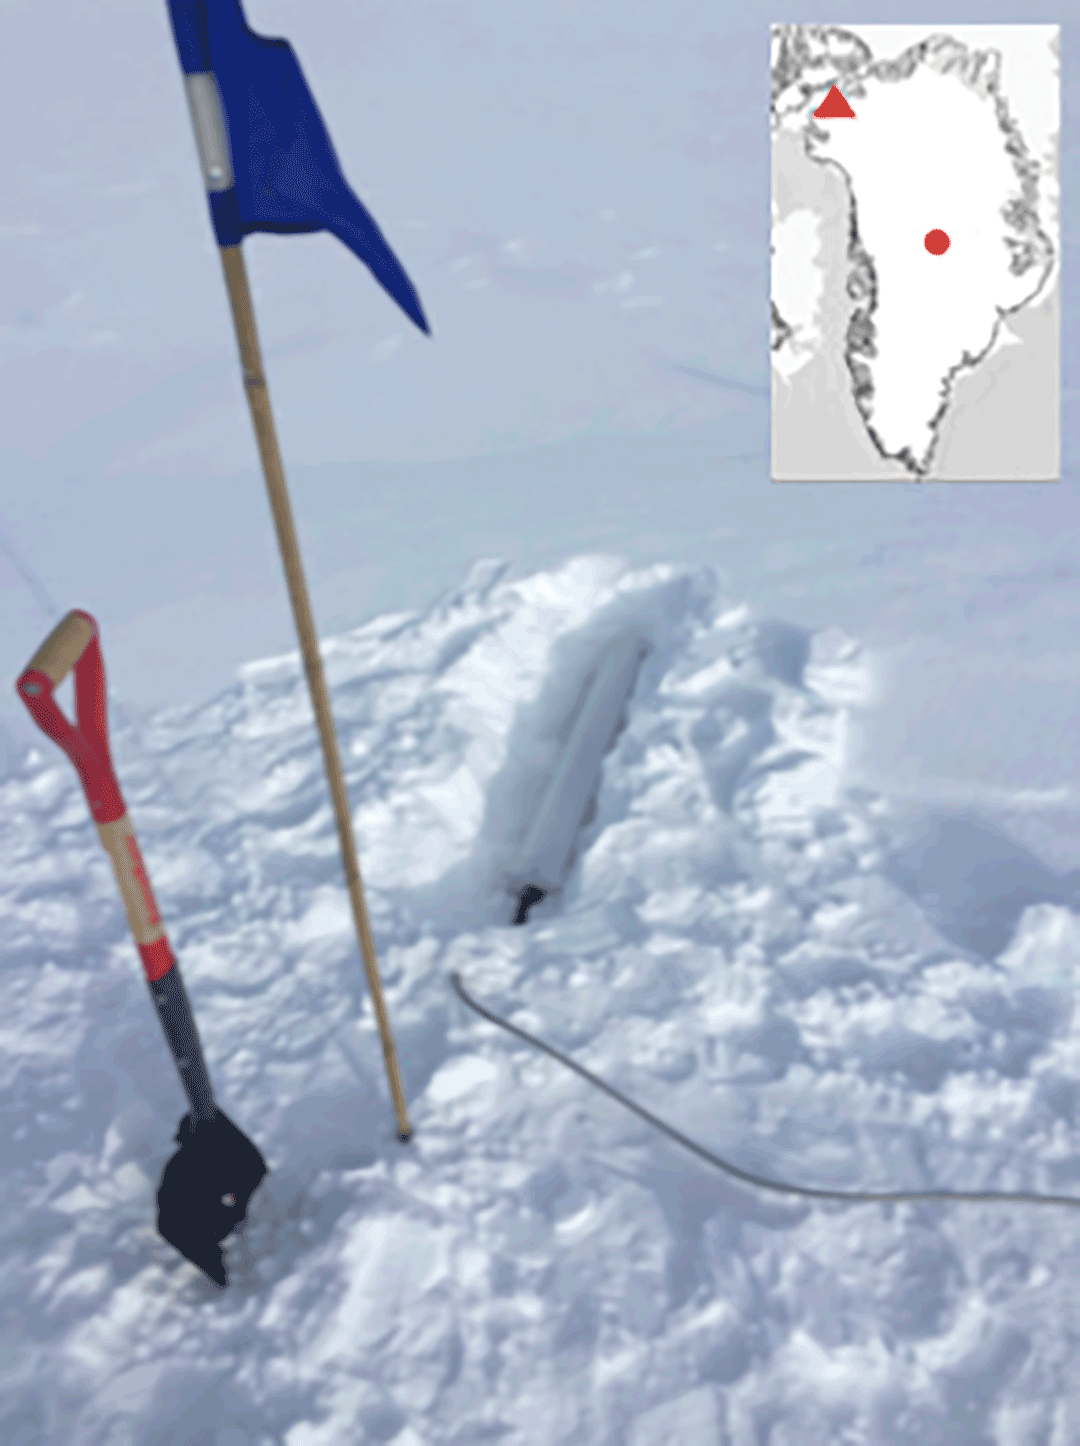
Figure 1Photograph of Hydroinnova SnowFox™ cosmic ray neutron sensor (CRNS) exposed in firn trench on the first day of deployment. Inset shows the location of Summit Camp on the Greenland Ice Sheet, as denoted by the red circle. The red triangle shows the location of the THUL reference neutron monitor maintained by the University of Delaware Bartol Institute.
To obtain an estimate of the water-equivalent thickness of snow accumulation, hw, from hourly counts of neutrons recorded by the CRNS, N, corrections must be applied to account for variability in barometric pressure and incoming cosmic radiation (Andreasen et al., 2017). We do not apply a correction for atmospheric water variability because nearly all fast neutrons impacting the sensor are produced in the snowpack, rather than the atmosphere.
A correction factor accounting for variations in incoming cosmic ray intensity is obtained from the atmospheric pressure-corrected counts observed simultaneously at a second reference neutron sensor located above the snow surface. If the corrected count rate at the reference sensor is Im, the correction factor, fi, is
where I0 is an arbitrary, time-invariant reference rate, such as the long-term mean, and β is a scaling parameter. For application to Summit Camp, we use the neutron monitor located at Thule (THUL), Greenland, operated by the Bartol Institute at the University of Delaware and distributed via the Neutron Monitor Database (http://www.nmdb.eu/nest/, last access: 20 May 2018). The unitless scaling parameter β accounts for differences in the magnitudes of solar-induced variations between the reference and local sensors due to differences in latitude and elevation, only the latter of which will be significant in this case (Hawdon et al., 2014). We use a value of β=1.19 based on regressions to the global neutron monitor dataset. While a single value produces unbiased corrections on weekly or longer timescales, we expect some errors associated with short-term variation, such as individual Forbush decrease events.
Following Zreda et al. (2012), the barometric pressure correction factor, fp, is obtained from
where P is the observed barometric pressure at the sensor at the time of the neutron count measurement and P0 is an arbitrary, time-invariant reference pressure. The mass attenuation length for high-energy neutrons, L, is 130 g cm−2 at the latitude of Summit Camp (Desilets et al., 2006). Applying the incoming cosmic ray intensity and barometric pressure correction factors to the raw counts at the sensor, N, gives the corrected count rate:
which is then smoothed with a daily moving average and divided by the solar and pressure-corrected count rate at the surface obtained prior to burial of the sensor to obtain the relative corrected count rate, N∗. The water-equivalent accumulation thickness, hw, is then obtained from the relative corrected count rate, N∗, as
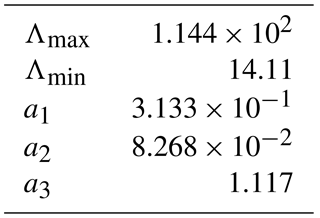
with
The empirical, location-independent parameters Λ and a are determined through calibration and field validation experiments by the CRNS manufacturer. Their values are listed in Table 1. The resulting relationship between hw and N∗ is plotted in Fig. 2a. There is a gradual increase in hw with decreasing N∗ to hw=34 cm at . Below this value for N∗, hw increases more steeply, rising to 200 cm at , 300 cm at and 490 cm at . Thus, the sensitivity of the CRNS to changes in water-equivalent thickness decreases non-linearly with increasing thickness. Figure 2b shows the change in hw versus the change in corrected count rate, Ncor, for zero water-equivalent thickness (hw=0) corrected count rates, , of 2000, 4000 and 8000 counts per hour (cph). The count rate is ∼ 25 times more sensitive to variations in hw at 10 than at 100 cm, and 50 more times sensitive than at 200 cm. The inverse of this sensitivity is the measurement resolution; the larger the change in hw per change in corrected count rate, Ncor, the coarser the resolution of the CRNS. There is, therefore, a corresponding, non-linear decrease in the resolution of hw with increasing hw, as well as a linear decrease with a decreasing . At hw=100 cm, the sensor resolutions are 0.50, 0.23 and 0.11 cm of hw per cph for of 2000, 4000 and 8000 cph, respectively. The resolution declines to a 1 cm change in hw per 1 cph change in Ncor near 400 cm for a of 4000 cph. However, the fractional change is such that the maximum resolution is better than 0.25 % of hw for hw between 5 and 350 cm. These are the maximum resolutions based only on the relationship between count rate and water-equivalent thickness in Eqs. (4) and (5). The actual uncertainty in hw will therefore be this resolution in addition to errors in the corrections for variability in incoming cosmic rays and barometric pressure, as well as sensor noise.
In order to validate the CRNS observations, water-equivalent accumulation was measured manually every ∼ 8 days beginning 17 March 2017 from a location approximately 10 m from the CRNS. The manual observations utilized the “snow board” method, in which a shallow rectangular pit is excavated and a piece of plywood is placed at the floor of the pit. The pit is then allowed to fill with snow and settle over a period of ∼ 2 weeks. A PVC tube is used to remove a core sample of the snow from the surface to the plywood, which serves as a depth reference for each subsequent sample. The sample is taken from a different location each time, as measured from flagged poles at the corner of the plywood, to provide an undisturbed sample. The surface snow core is then weighed to the nearest 0.1 g, the weight of the core tube is removed and the snow weight is divided by the cross-sectional area of the core to give a measurement of hw. For redundancy, the snow core sample is allowed to melt, and the water volume is recorded to the nearest millilitre. This volume is divided by the cross-sectional area of the core to give another measurement of hw. The difference between these two measurements provides a check on the accuracy of the sample. For the 54 observations, the water volume measurement averaged 0.20 cm water-equivalent thickness larger than the weight measurement, with a standard deviation (SD) of 1.48 cm. This SD is larger than the uncertainty predicted by the measurement precisions and, therefore, may be due to unconstrained errors in the measurement procedure. We therefore assume ±1.48 cm water as the error in hw obtained from the surface cores. We note that the mean density of the snow core sample is also recorded. However, the time-varying depth of the sample and the possible impact of the baseboard on the compaction, via effects on vertical heat and vapour fluxes, make the applicability of these density values uncertain.
We additionally compare CRNS hw estimates to ∼ weekly accumulation measured from a network of 120 stakes (i.e. the “bamboo forest”) at Summit Camp (Dibb and Fahnestock, 2004). The change in surface height measured through repeat snow stake measurements (here Δhs, SHC in Dibbs and Fahnestock, 2004) gives the integrated change due to surface mass balance processes and densification of the firn into which the stake is anchored (initially ∼ 1.2 m and increasing with burial). A major benefit of the snow stake measurements is that they provide an estimate of average variability over a relatively large area, as opposed to the point measurement provided by the surface core samples. This enables an assessment of the possible influence of spatial variability on surface core measurements relative to the CRNS.
The relationship between changes in snow-water-equivalent thickness, Δhw, as measured by the CRNS, and mean surface height measured by the snow stake network, Δhs, can be approximated by
where Δhf is the change snow or firn thickness from the stake bottom to previous measurement surface and ρ* is the ratio to water of the mean density of the mass either added to or subtracted from the surface (i.e. the surface density). We use mean monthly ρ* for the top 10 cm from the Surface Mass Balance and Snow on Sea Ice Working Group (SUMup) dataset (Montgomery et al., 2018). These range from a minimum density of 0.23 g cm−1 in August to a maximum of 0.33 g cm−1 in April, with an average SD of 0.06 g cm−1 or 20 %. The compaction term Δhf will also vary seasonally with snow temperature but has a much higher relative uncertainty due to inter-annual variability, variations in accumulation history and the changing depth of the stakes. Model estimates by Zwally and Li (2002) predict seasonal variations in compaction ranging from approximately 10 to 40 cm a−1, with a value of 18 cm a−1 obtained from mean temperatures and steady-state accumulation. Thus, for a ρ* of 0.28±0.06 g cm−1 and a Δhf of cm (18 cm a−1 over the average 8 days between measurements), and assuming ρ* and an Δhf are uncorrelated, an average Δhs of 1.70 cm yields an Δhw of 0.37±0.10 cm water, or an uncertainty of 26 %. While this error is small relative to the surface core measurements, these errors may be systematic, resulting in a larger cumulative error. Here we apply Eq. (6) using the average monthly SUMup densities and by adjusting Δhf to give the best fit between Δhw from the CRNS and Δhs, comparing the result to expected values of Δhf based on previous observations.
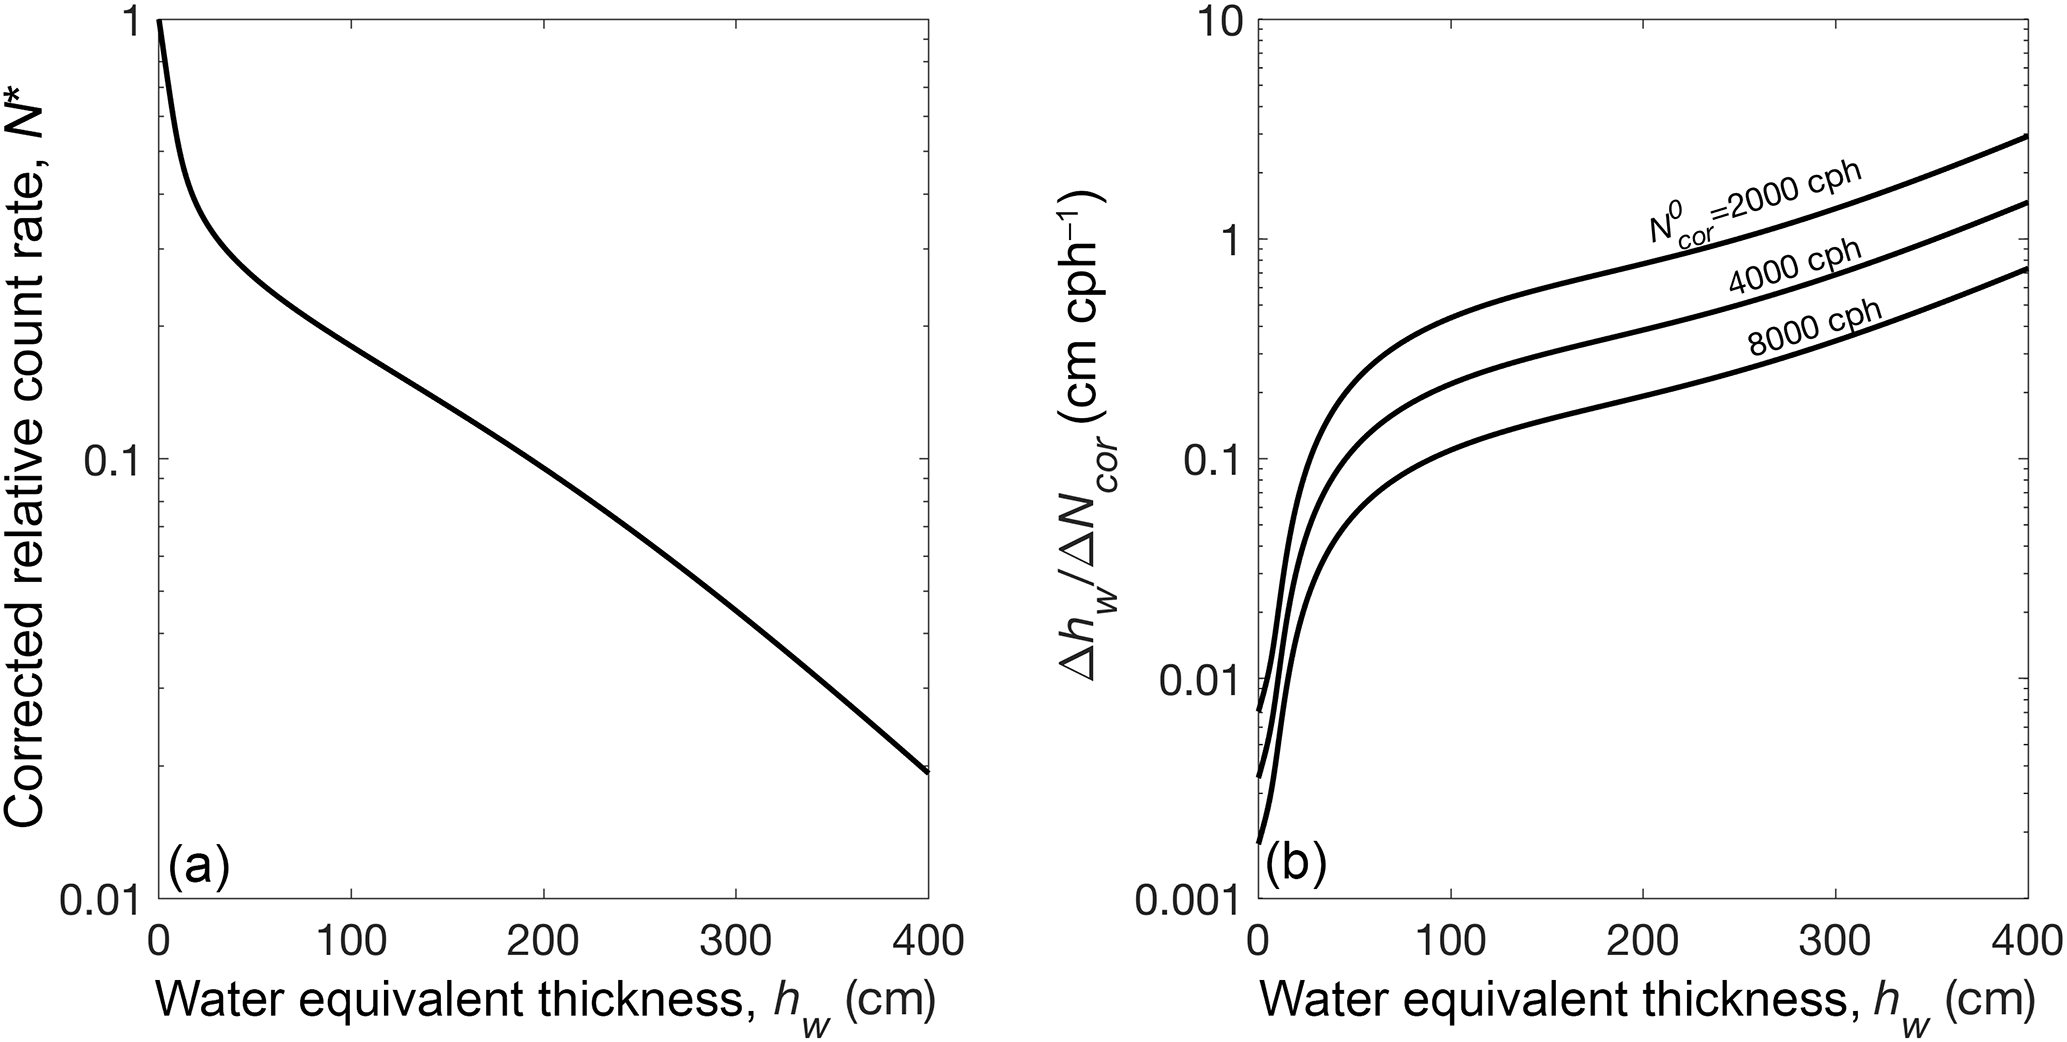
Figure 2(a) Relationship between water-equivalent thickness, hw, and the relative hourly corrected count rate, N∗, measured by the cosmic ray neutron sensor (CRNS), as obtained from Eqs. (4) and (5) and the parameters provided in Table 1. (b) The change in hw per change in hourly corrected count rate, Ncor, for count rates at hw=0 (i.e. the corrected count rate when no snow is covering the sensor, or of 2000, 4000 and 8000 counts per hour (cph).
Figure 3a plots the time series of uncorrected hourly neutron counts, N, recorded by the CRNS. Starting from N=7000 cph, when the sensor was exposed at the bottom of the firn trench, the count rate dropped to ∼ 4200 cph over 16 days as the trench filled with snow. The count rate then held above 3000 cph until March, when it dropped to 2200 cph by May. The rate then stayed between 2000 and 3000 cph through the end of the record.
Corrections for solar activity, fi, and atmospheric pressure, fp, are shown in Fig. 3b. Approximately weekly variations with an amplitude of ±0.02 are visible in fi with an overall decline of 0.11 over the observation period, punctuated by a 0.05 increase in July 2017. Relative variability, and thus the impact on count corrections, is larger for fp, with short-term (i.e. days) variability of up to ±0.1 and an annual cycle with an amplitude of ±0.12, with a maximum in July and minimum in January. Applying these corrections to the raw count data gives the corrected series shown in grey in Fig. 3a. The correction substantially smooths the variability in count rate and yields a more linear decline of ∼ 1000 cph between July 2017 and May 2018. The corrected count rate is then divided by the initial corrected count rate when the sensor is uncovered (8181 cph) to give the corrected relative count rate and snow-water-equivalent thickness, hw, shown in Fig. 3c. The initial, rapid 8 cm w.e. increase is consistent with infilling of the approximately 20 cm deep trench assuming a density of wind-packed snow of 0.4 g cm−3. From June to September 2016, hw remains near constant before increasing to 30 cm w.e. by the following spring. Another stable period of hw occurs in the summer 2017, followed by another 15 cm w.e. increase between October 2017 and May 2018, interrupted by a loss of 3 cm w.e. between 25 March and 4 April that was regained by 7 April. This abrupt change is visible as a spike in the raw count rate that is not corrected by fi or fp.

Figure 3(a) (black) Uncorrected, N, and (grey) corrected, Ncor, hourly neutron count rate measured at Summit Camp, Greenland, by a cosmic ray neutron sensor (CRNS) emplaced in the firn. (b) Count rate correction factors for (black) atmospheric pressure, fp, and (grey) solar activity, fi, as derived from Eqs. (1) and (2) in Sect. 3 of the text and the Thule (THUL) neutron monitor for reference. (c) (black) Relative corrected counts, N*, and resulting (grey) water-equivalent thickness, hw, from Eqs. (4) and (5) and the parameters in Table 1.
We expect the noise level in hw to increase as N∗ decreases (and hw increases) because the noise in N∗ becomes larger relative to the zero snow count rate and the signal-to-noise ratio, and therefore the measurement precision, decreases. This noise increase is visible in the curves in Fig. 3c. We assess the increase in noise, or loss of precision, by plotting the daily mean of hourly hw estimates against their SD, omitting the period of rapid trench infilling prior to 14 May 2016 (Fig. 4). The SD in water-equivalent thickness increases from under 0.1 at hw=15 cm to 0.5 at hw=50 cm. The best-fit line predicts a SD of 0.005 cm w.e. at hw=0, increasing by 0.007 cm per centimetre of hw, so that the SD would reach 1 cm by hw=140 cm. The lower range of daily SDs corresponds closely to the water-equivalent-thickness-dependent resolution of hourly hw measurements derived in Sect. 3. However, the best-fit line of daily mean hw and its SD is ∼ 10 times larger than the thickness-dependent resolution (Fig. 4), indicating that noise in the count rate is the dominant source of error. In relative terms, the SD drops below 1 % for hw larger than 5 cm w.e., declining to 0.7 % for hw greater than 30 cm w.e. The increasing noise, however, also decreases the precision of change measurements, given by the root of 2 times the squared deviations, or 0.01 cm w.e. per centimetre water equivalent of hw, assuming daily errors are uncorrelated. Thus the SD in daily change measurements is approximately ±1 % of hw.
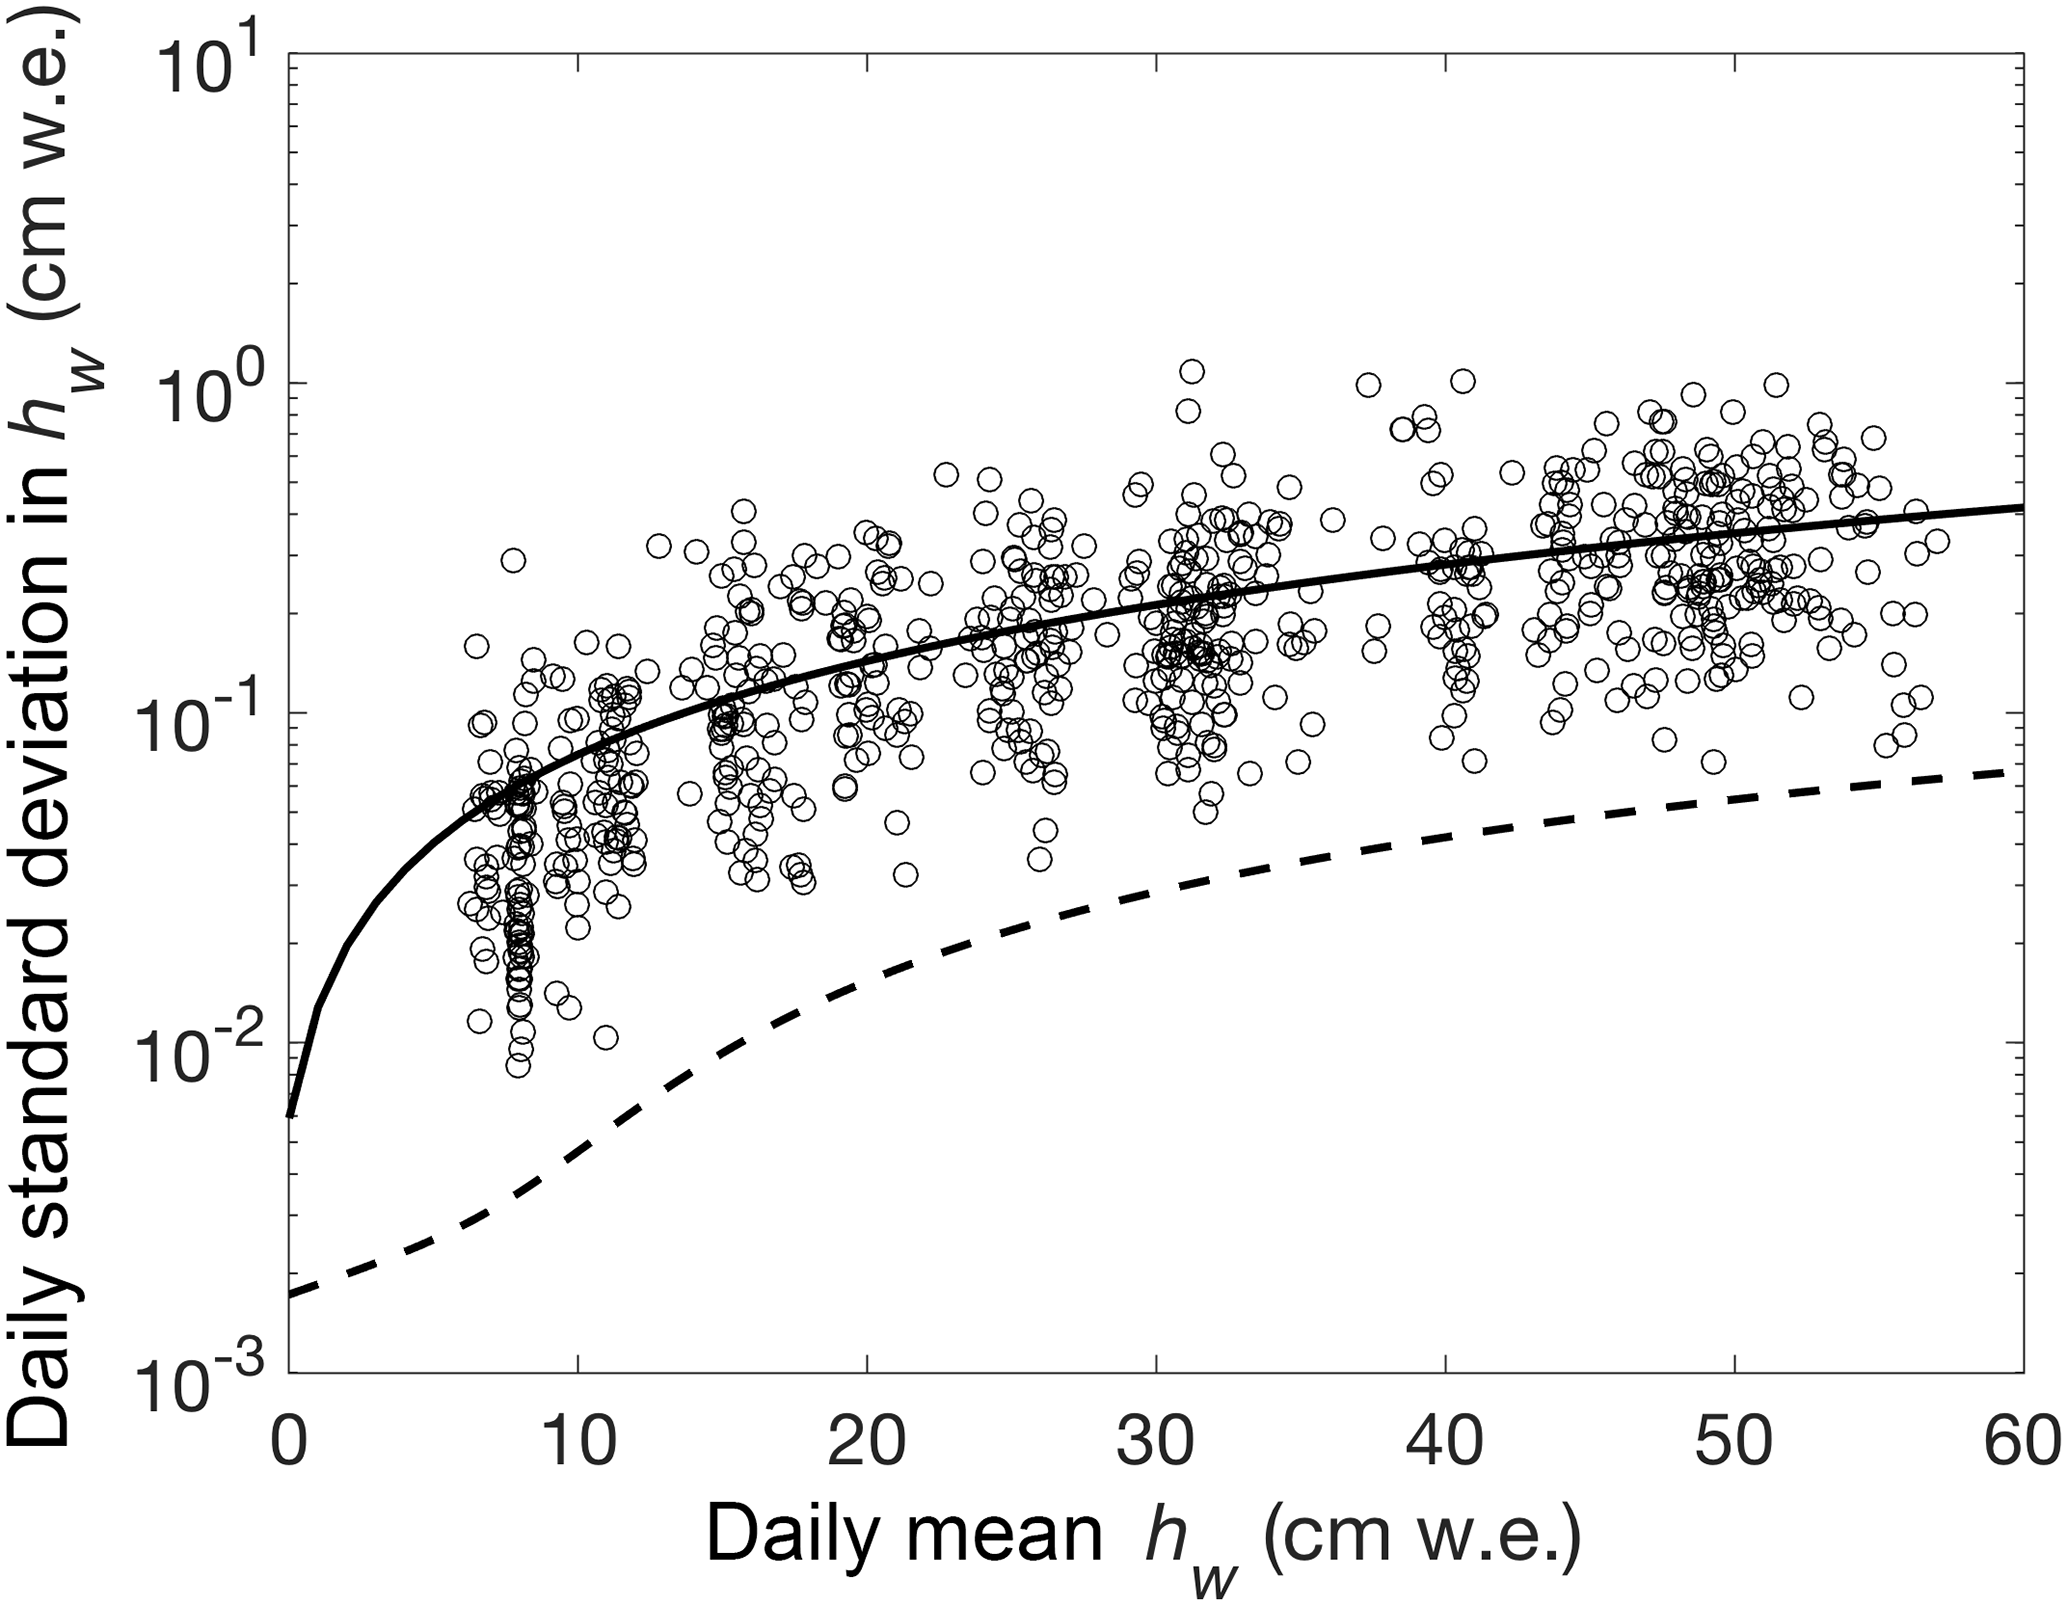
Figure 4Daily means of hourly water-equivalent (w.e.) thickness, hw, measured by the cosmic ray neutron sensor (CRNS), versus the daily SD in hourly measurements. Solid curve is the line of best fit, with a slope of 0.007 and a y intercept of 0.005 cm. Dashes are the change in hw per change in hourly relative corrected count rate, N∗, given by Eq. (4), which is the maximum resolution of the CRNS.
Differences between daily mean water-equivalent thickness, hw, are shown in Fig. 5a. The mean change in daily mean hw is 0.07 cm w.e. with a SD of 0.37 cm w.e. The maximum single day of accumulation was 2.2±0.3 cm w.e. on 15 September 2017, while the maximum negative accumulation (ablation) was cm w.e. on 25 February 2018. After the initial period of infilling of the trench, including 2 days with nearly 2 cm w.e. day−1 of accumulation on 14 and 15 May 2016, there was a sustained period of low deviation in daily rates from June to October 2016, followed by increasingly large scatter. We expect increasing noise in these data due to a declining relative neutron count rate with burial. Plotting the daily change in hw as a percentage of hw (Fig. 5b), we find a consistent magnitude of daily variability throughout the record, with a SD of ±1.2 %, similar to the ±1 % precision error determined from the daily SD of hourly measurements shown above. We would also expect variability to correspond with wind strength due to the effect of drifting and scouring. Some anomalously rapid changes in water-equivalent thickness, such as the 2.2 cm w.e. gain on 15 September 2017, occurred on days with high winds (Fig. 5c). Additionally, the loss of 3 cm w.e. between 25 March and 4 April occurred during a period of sustained high winds, including 3 days of > 10 m s−1 mean wind speed on 23, 25 and 26 March. Overall, however, the correlation between mean or maximum (not shown) daily wind speed and accumulation rate is not significant, indicating that much of the variability is due to noise and other factors.
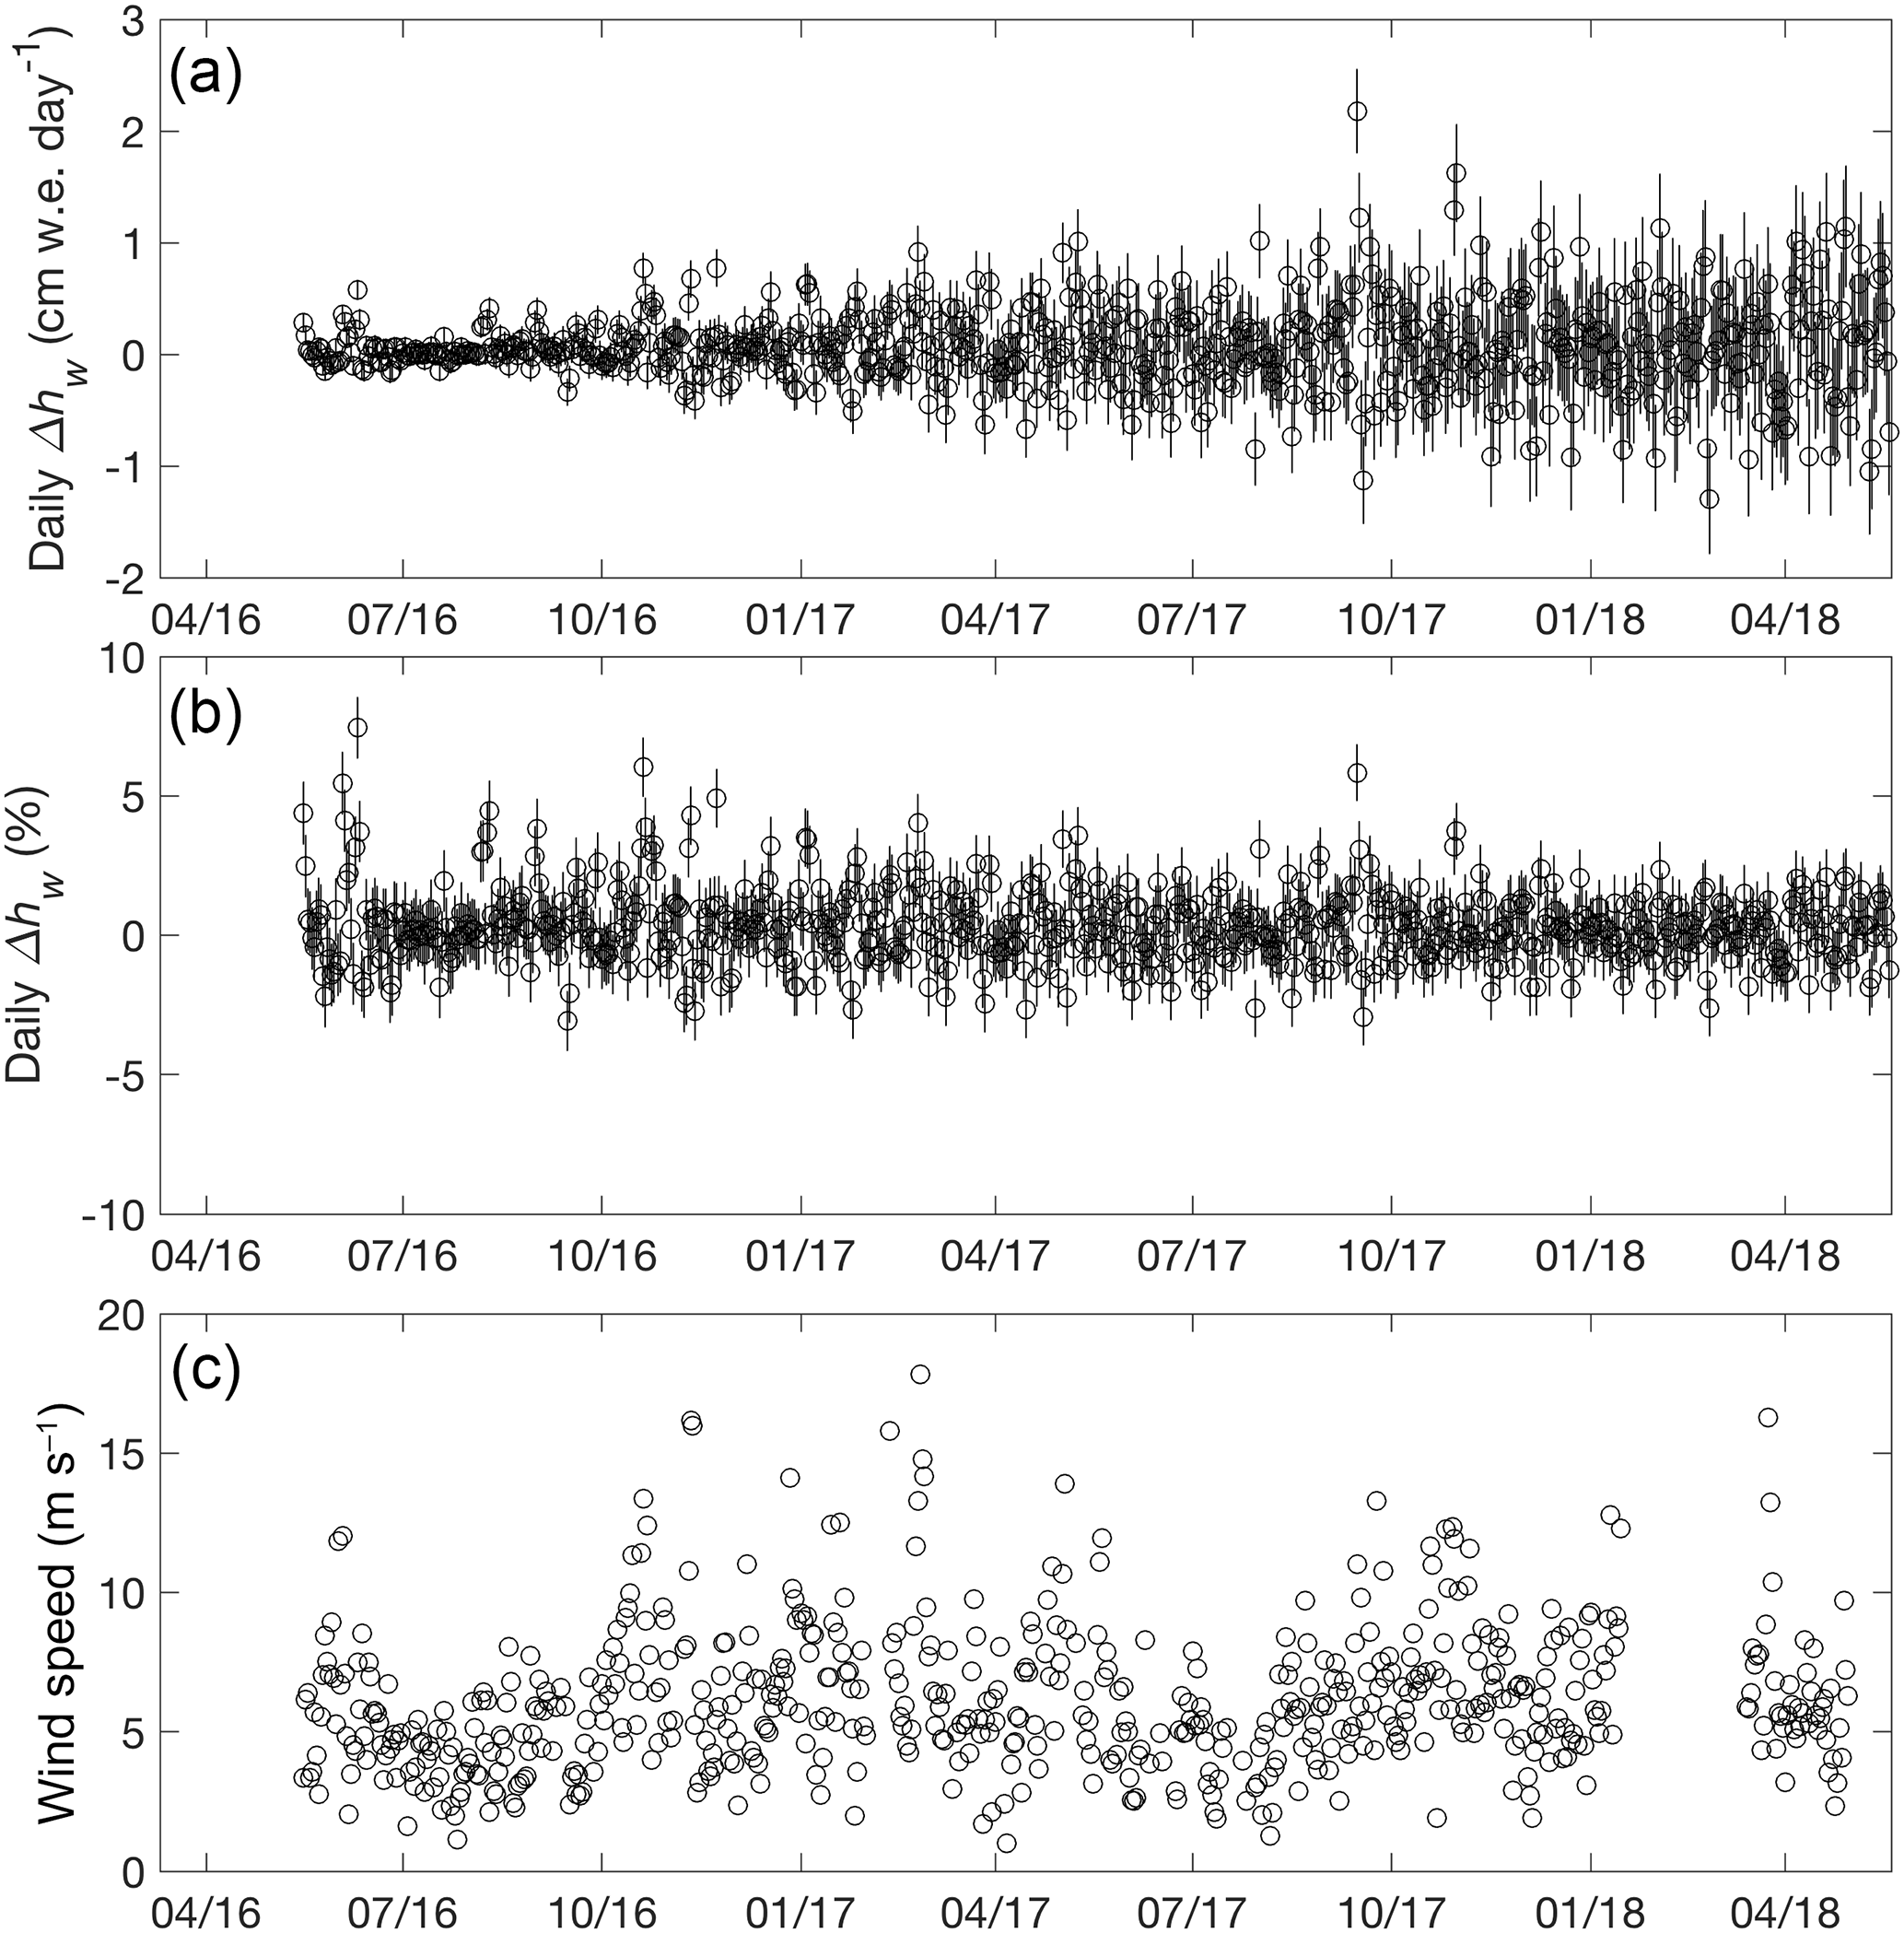
Figure 5(a) Daily change in water-equivalent (w.e.) thickness, hw, and (b) change as a percentage of hw at Summit Station, Greenland, measured by the cosmic ray neutron sensor (CRNS) with 1σ error bars estimated from the daily SDs in hourly measurements versus water-equivalent thickness (curve in Fig. 4.). (c) Summit Camp daily mean wind speed measured at the automatic weather station.
We plot the monthly accumulation rate, calculated as the change in monthly mean hw, normalized for days in each month, in Fig. 6. The monthly accumulation rate shows a high degree of variability, with a SD of 57 % of the 1.9 cm w.e. per 30-day mean. In both 2016 and 2017 the lowest accumulation rate was in July, with the July 2016 accumulation totalling only 0.2 cm w.e., or 11 % of the mean annual rate. November and October were the highest accumulation months in 2016 and 2017, respectively. For the 7 months (June through December) measured in both 2016 and 2017, those in 2017 had higher accumulation rates in all but August, with more than double the 2016 rates in October and November. Despite this large difference, total annual accumulations where similar for the 2 years. In the first year of the record, from 15 May 2016 (after infilling of the trench) to 14 May 2017, the total accumulation was 23.2±0.2 cm w.e. yr−1, while the total accumulation in the second year, between 16 May 2017 and 15 May 2018, was 24.1±0.5 cm w.e. yr−1.
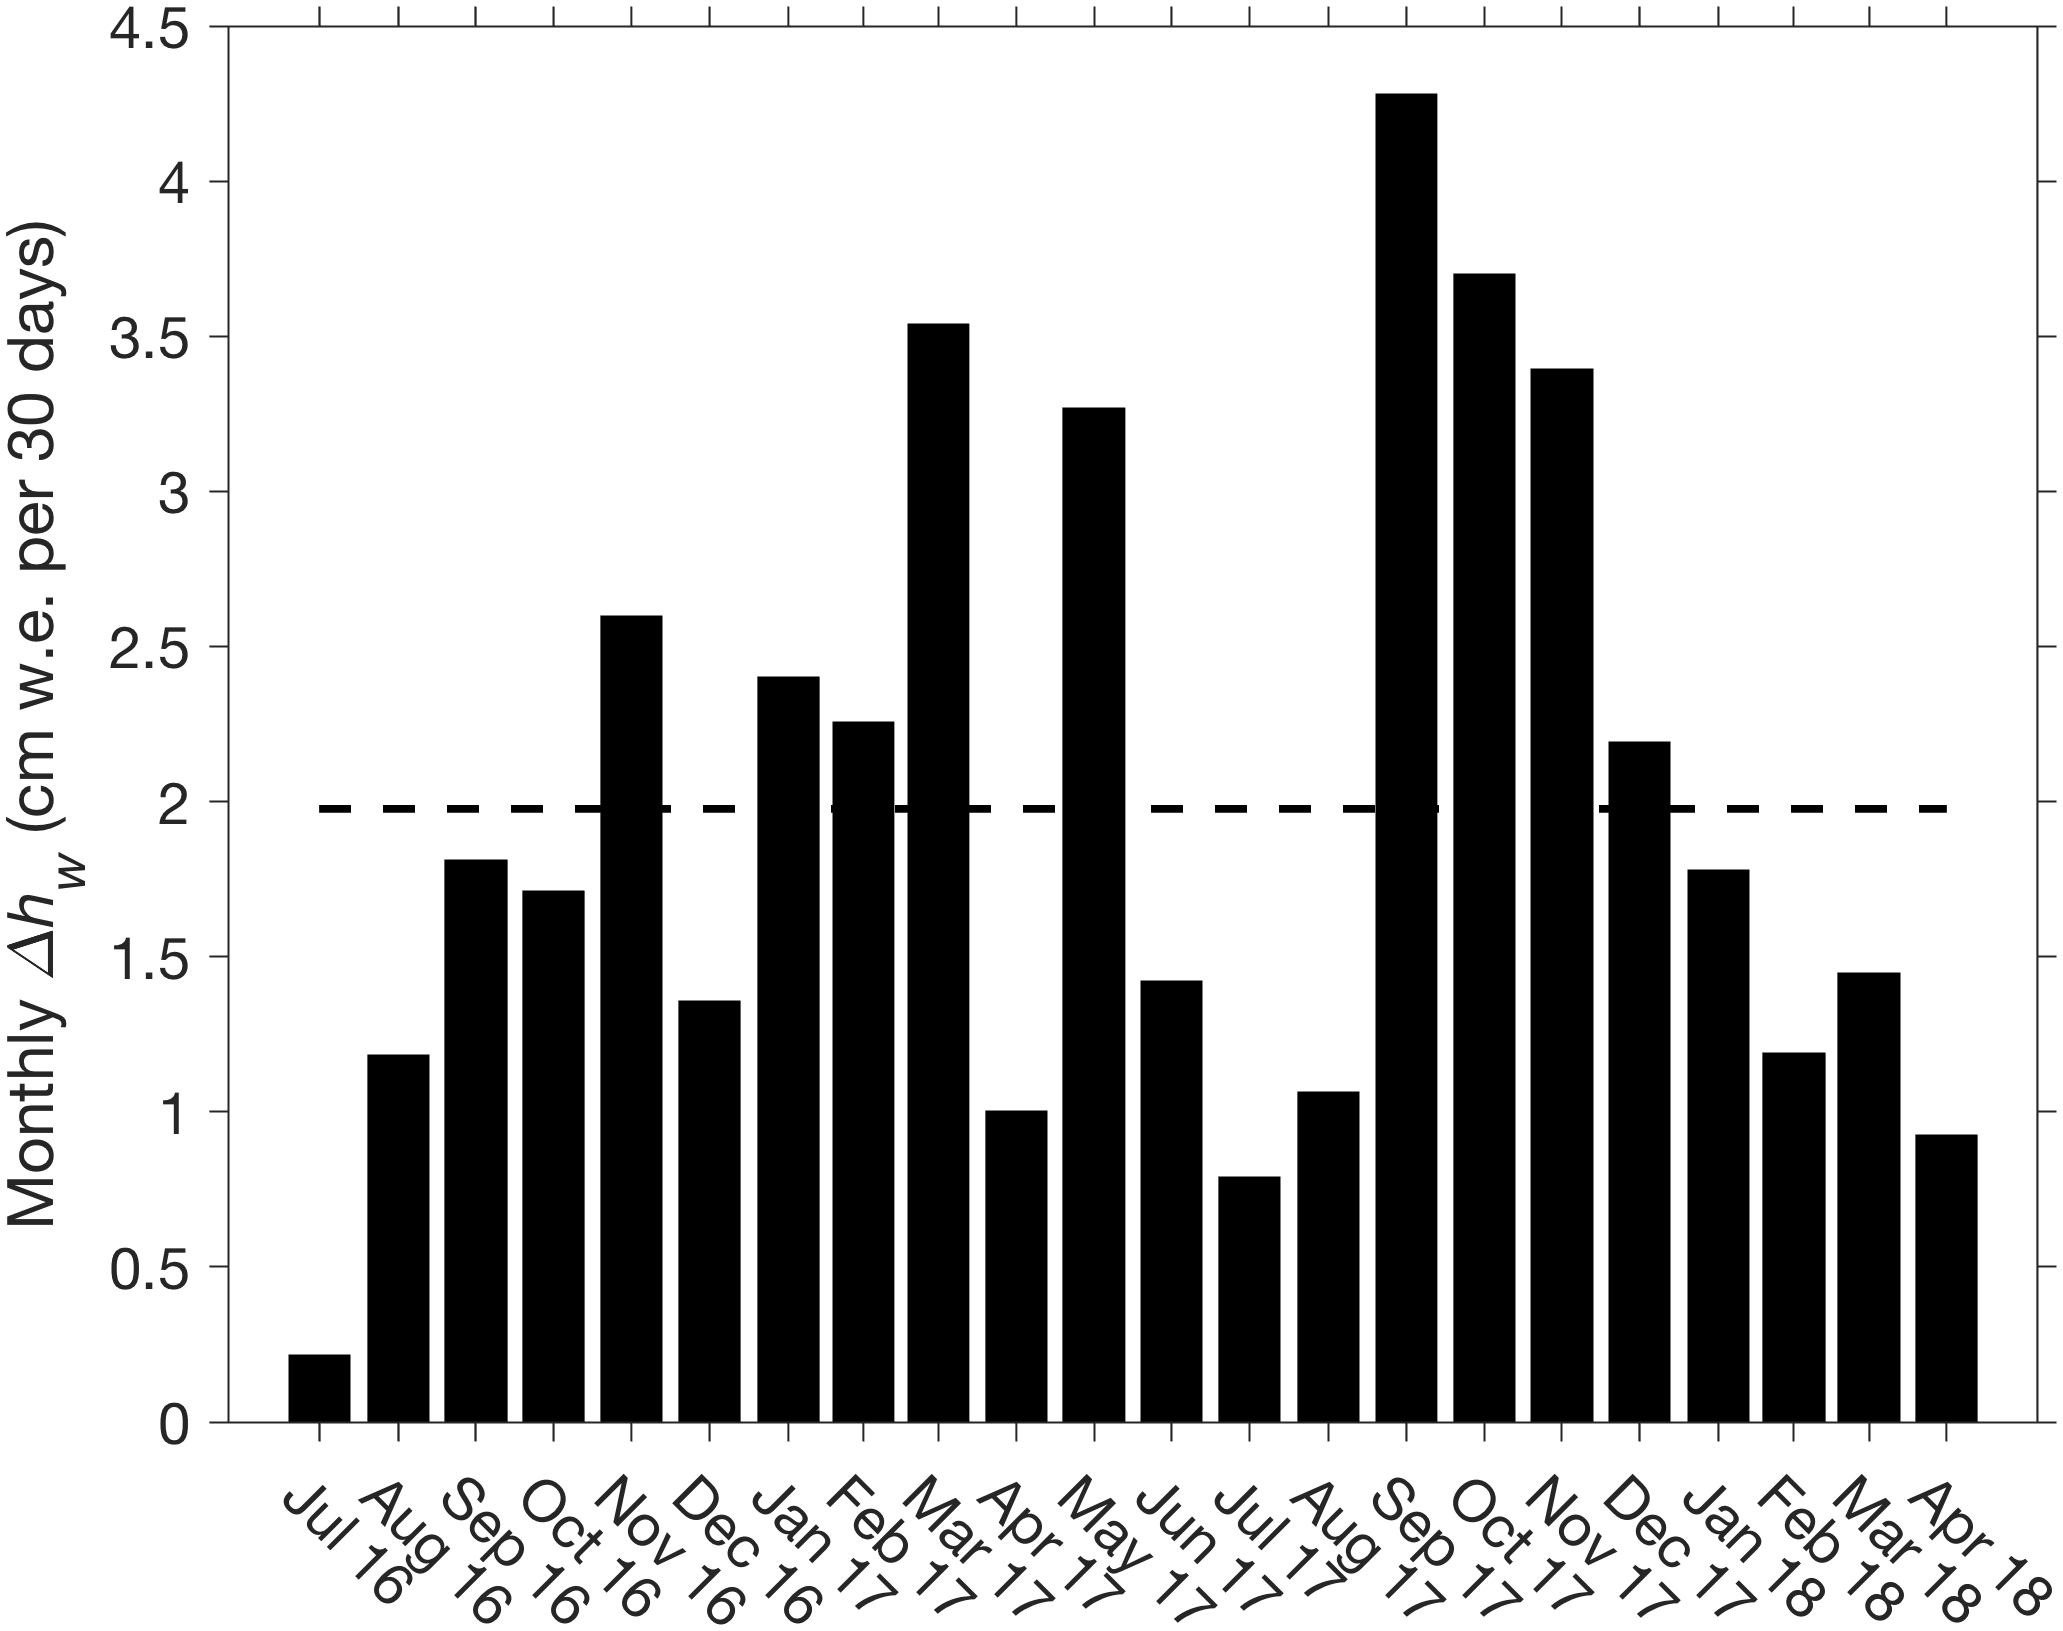
Figure 6Monthly (30 day) change in water-equivalent (w.e.) thickness (hw) at Summit Camp, Greenland, as measured by the cosmic ray neutron sensor (CRNS). Dashes are the average (1.9 cm w.e. per 30 days). The record begins with July 2016 because May is omitted due to infilling of the trench containing the sensor, so that the first difference is from June to July.
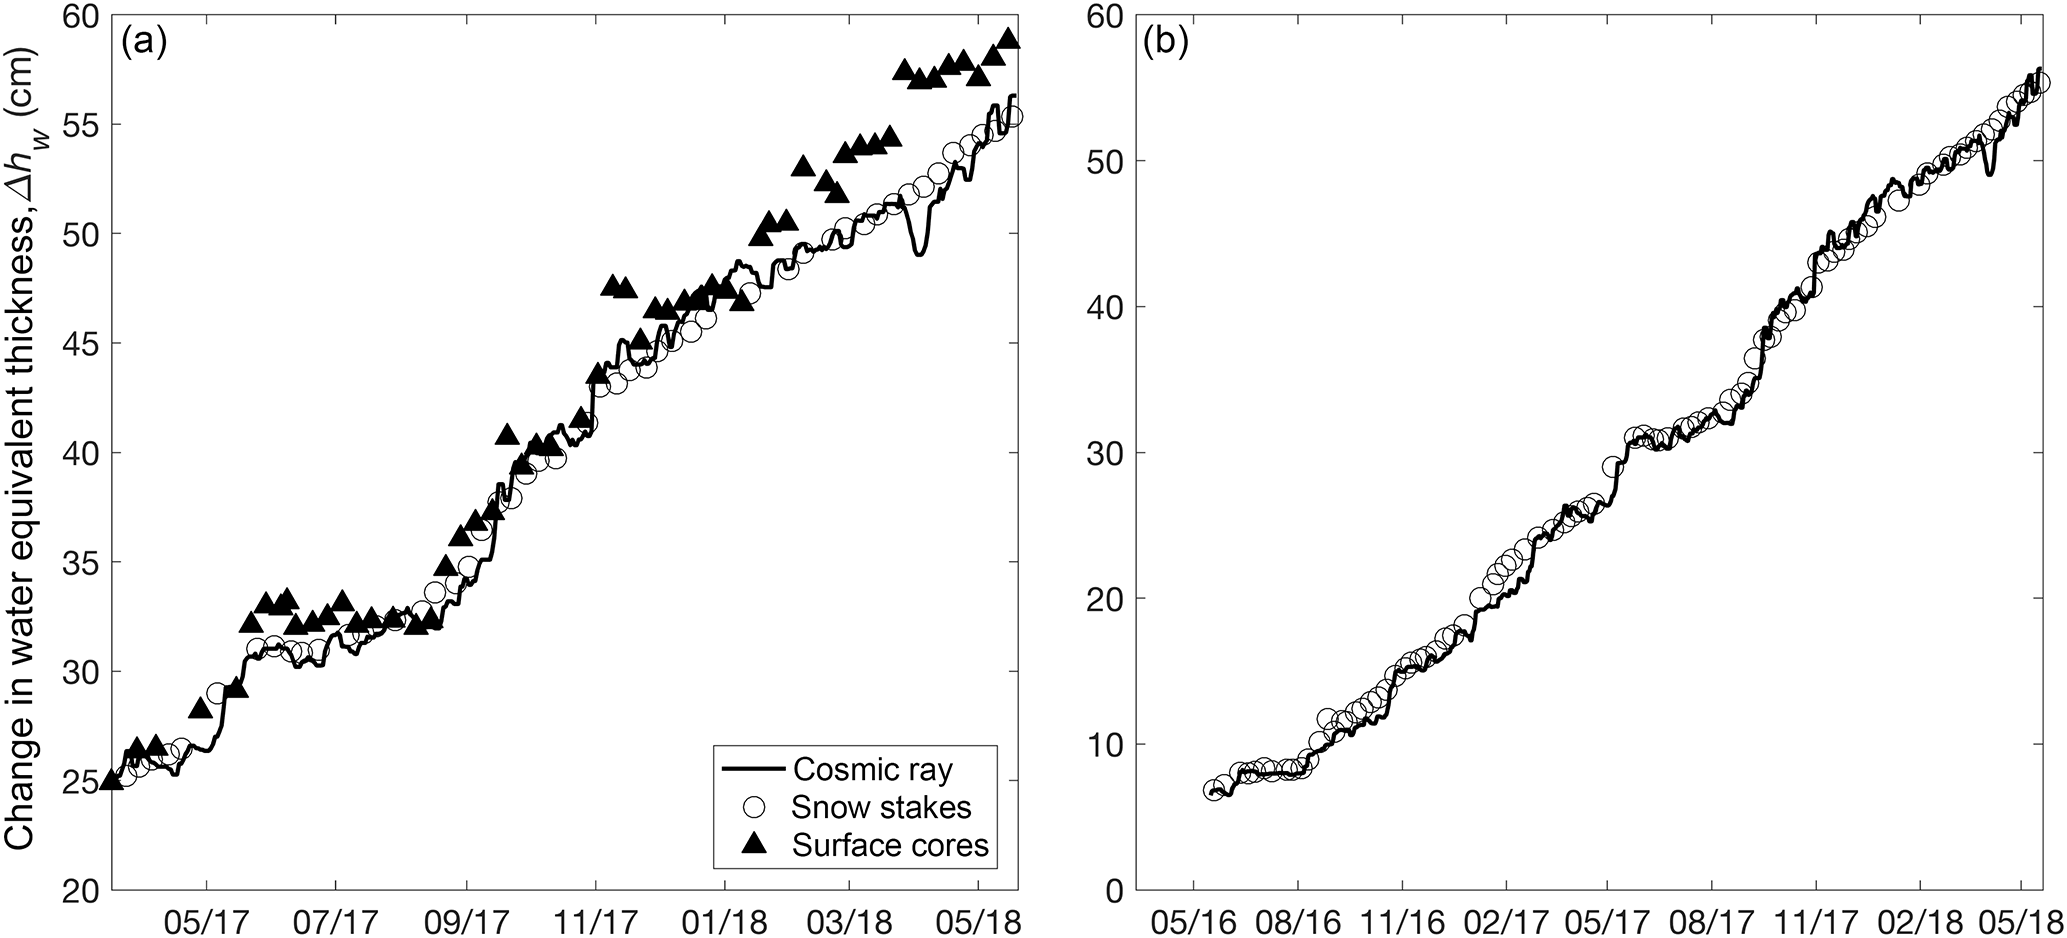
Figure 7(a) Time series of cumulative change in water-equivalent thickness, hw, at Summit Camp, Greenland, over the period of surface core sampling (17 March 2017 to 8 May 2018) from (solid curve) the cosmic ray neutron sensor (CRNS), (triangles) surface core samples and (circles) the “bamboo forest” snow stake network. Conversion of mean surface height change of the snow stakes to water-equivalent thickness is described in Sect. 4. Values for hw are the depth of the CRNS, with initial hw values for the surface core and snow stake set to the concurrent CRNS value.
While the analysis of short-term variability in accumulation presented above provides a constraint on the precision of the CRNS, the accuracy may be assessed only through validation. We compare the change in water-equivalent accumulation thickness, Δhw, estimated from the CRNS to surface core and snow stake observations (Fig. 7). Since both the surface core and snow stake observations have a 1-day timestamp, we compare these data to the daily means of the hourly cosmic ray estimates. On average, Δhw measurements obtained by differencing the ∼ 8-day surface core measurements are 0.04 cm w.e. greater than the cosmic ray estimates, with a standard devation of 1.72 cm w.e., which is less than the combined errors of the snow core difference measurements (±2.09 cm w.e.) and the CRNS (±0.30 m w.e.). The cumulative Δhw over the observation period averaged 1.68 cm w.e. greater for the surface cores, with a SD of 2.03 cm w.e. (Fig. 7a). More separation between the surface core and cosmic ray estimates is apparent after 30 January 2018, when the surface core recorded an increase of 2.5 cm w.e. by 7 February followed by a 3 cm w.e. increase between 20 and 27 March. This latter increase corresponds with a period of high winds, as mentioned above, and occurs immediately before the abrupt 3 cm w.e. decrease recorded by the CRNS. Prior to 30 January 2018, the three largest outliers occur on 19 September 2017, 9 November 2017 and 17 January 2018, all after large (> 2 cm w.e.) accumulations recorded by the surface core. The difference then goes to near or greater than zero in the next one or two core measurements. The CRNS estimated approximately 1 SD lower Δhw than the surface cores in June 2017, moving back to zero difference by the end of August. These large deviations, followed by gradual convergence, suggest spatial variability due to drifting, the effect of which may have increased after 30 January 2018. Prior to this, the positive bias in cumulative Δhw recorded by the surface core was only 0.76 cm with a SD of 1.19 cm w.e. The surface core Δhw had returned to within 2.24 cm w.e. of the CRNS estimate by the 8 May 2018 measurement.
We compare the measurements of changes in surface height at the network of snow stakes to estimates of water-equivalent thickness change from the CRNS using the conversion approach described in Sect. 4. Using the monthly SUMup density dataset (Montgomery et al., 2018), we obtain a consistently close fit between the snow stake and cosmic ray estimates by applying a compaction term (Δhf in Eq. 6) of 0 cm day−1 from the start of the record until 1 January 2017 and 0.05 cm day−1 (18.25 cm a−1) thereafter. The latter is close to the seasonal compaction rate (18 cm a−1) modelled by Zwally and Li (2002) and is 40–50 % larger than that estimated from 2 years of snow pits by Dibb and Fahnestock (2004). While zero compaction is not realistic, it could be explained by a lower-than-average surface density in 2016. Applying a 0.05 cm day−1 compaction rate throughout the record and uniformly decreasing the mean surface density by 25 % prior to 1 January 2017 gives nearly identical results.
On average, the Δhw estimated from the snow stake measurements is 0.01 cm w.e. less than the cosmic ray measurements for periods between stake measurements, with a SD of 0.98 cm w.e. Cumulatively, the snow stakes estimated an average Δhw 0.35 cm w.e. greater than the CRNS with a SD of 0.99 cm w.e. (Fig. 7b). The snow stake measurements, as with the cosmic ray measurements, tend to show smaller variability than the surface core measurements and do not show the large increases and decreases during the outlier events mentioned above, nor the large loss and rebound recorded by the CRNS between 25 March and 7 April 2018. This provides further evidence of the effect of drifting on the surface core and, possibly, CRNS relative to the large-area average provided by the snow stake network.
Cosmic ray neutron sensing offers a potential method for obtaining practical, autonomous in situ mass balance measurements on glaciers and ice sheets, providing continuous measurements of changes in surface mass, rather than volume. To test this potential, we deployed a cosmic ray neutron sensor (CRNS) at Summit Camp, Greenland, between April 2016 and May 2018. Based on the the daily scatter in hourly measurements, we obtain a 1σ error estimate of 0.005 cm water equivalent (w.e.) for 0 cm w.e., increasing with thickness at a rate of 0.007 cm w.e. per centimetre of water-equivalent thickness, giving errors of 0.1, 0.5 and 0.7 cm w.e. in depths of 10, 50 and 100 cm w.e., respectively, and daily-difference errors of approximately 1 % of the total depth. We observe single-day accumulation and ablation events of up to approximately 2.2 and −1.3 cm w.e. per day, respectively, with daily variability due to both increasing sensor noise with depth and wind drifting and scouring. Monthly accumulation rates show large month-to-month variability, exceeding 50 % of the mean, with a minimum accumulation in July of consecutive years and a maximum in autumn.
We validate CRNS measurements through comparison to repeated surface snow core and stake network measurements. We detect little or no bias in CRNS water-equivalent thickness change estimates for the ∼ 8-day periods between surface core and snow stake measurements, with the SD of the differences between estimates near or within the expected error range. Spatial variability due to drifting results in periods of divergence in the cumulative thickness change recorded by the surface core from both the CRNS and snow stake measurements. Divergence of cumulative thickness change between the CRNS and snow stakes estimates, particularly during one large event in March 2018, indicates that the CRNS is also susceptible to short-term (days to weeks) variability, due to either count correction errors or drifting that is not representative of the large surface area captured by the snow stake survey. Thus, a challenge to further validation will be obtaining validation observations that are of high enough accuracy and have similar spatial and temporal resolution to the CRNS.
Our test supports cosmic ray neutron sensing's potential as an effective and practical method for obtaining, for the first time, continuous and autonomous measurements of surface mass balance within accumulation zones (i.e. where annual snowfall exceeds ablation). The very high accuracy of the instrument, exceeding 1 mm per hour, opens up the possibility of acquiring mass balance measurements over the low-accumulation but vast interior of the Antarctic Ice Sheet, where few direct measurements of surface mass balance exist and which represents one of the largest sources of uncertainty in ice sheet mass balance measurements. These low-accumulation polar regions are also the most difficult to measure manually due to the limited precision of core samples and the lack of chronology in the upper firn. In areas with higher accumulation, the increase in noise and loss of resolution with depth can be mitigated by increasing the count period, so that the duration of autonomous sensor deployment would be most likely limited by the instrument power and communications (e.g. the height of the tower supporting the telemetry antenna and solar panels or the battery lifespan). This still could be several years in the regions of very high accumulation, or decades in the case of polar deserts. Finally, additional accuracy on short timescales (< 1 week) may be obtained by deploying a local reference sensor above the surface, reducing distance-dependent uncertainty in the count correction factors.
The portability, ease of deployment and low power of this passive sensor are ideal for measuring accumulation in remote locations, where manual measurements (i.e. cores and snow pits) are currently cost or logistically prohibitive. Combining the CRNS with observations commonly made by automated weather station observations – including temperature, wind speed and repeat measurements of surface height by echo sounder – would provide new information about the processes of wind redistribution and firn compaction, for which mass and density are currently unknown variables. This information is critical for obtaining ice sheet mass balance from repeat altimetry measurements, such as from the European Space Agency's CryoSat-2 and the US National Aeronautics and Space Administration's ICESat missions. Finally, these measurements would inform regional and ice-sheet-scale surface mass balance models for which direct water-equivalent accumulation and wind distribution observations are currently sparse or non-existent.
Since our implementation requires burial in the underlying firn, the CRNS is most applicable for measuring accumulation where meltwater infiltration is shallow enough that water does not infiltrate below the depth of the sensor. It is possible, however, that the sensor could be used to measure water transport at the surface or in the firn by observing the decrease in mass during periods of no precipitation, in a similar manner to that currently used for soil moisture measurements. Finally, borehole applications may exist for measurement of basal and englacial water transport.
Hourly cosmic ray neutron sensor data files are archived at ftp://ftp-bprc.mps.ohio-state.edu/downloads/gdg/snowfox_summit/ (last access: 18 June 2018). Summit Camp snow core data are maintained at ftp://isr.sri.com/pub/summit/ftp/science/snowfox/ (last access: 18 June 2018) and snow stake (”bamboo forest”) data are maintained at ftp://isr.sri.com/pub/summit/ftp/science/bamboo_forest/ (last access: 18 June 2018). Summit Camp automatic weather station data are at ftp://isr.sri.com/pub/summit/ftp/science/NOAA/ (last access: 18 June 2018).
The authors declare that they have no conflict of interest.
This work was supported by US National Aeronautics and Space Administration
grant NNX14AH90G and the Ohio State University Office of Research. The
authors thank the Summit Camp staff for their diligent maintenance of the
instrument and collection of validation observations.
Edited by: Valentina Radic
Reviewed by: two anonymous referees
Alley, R., Meese, D., Shuman, C., Gow, A., Taylor, K., Grootes, P., White, J., Ram, M., Waddington, E., Mayewski, P., and Zielinski, G.: Abrupt Increase in Greenland Snow Accumulation at the End of the Younger Dryas Event, Nature, 362, 527–529, https://doi.org/10.1038/362527a0, 1993.
Andreasen, M., Jensen, K. H., Desilets, D., Franz, T. E., Zreda, M., Bogena, H. R., and Looms, M. C.: Status and Perspectives on the Cosmic-Ray Neutron Method for Soil Moisture Estimation and Other Environmental Science Applications, Vadose Zone J., 16, 1–11, https://doi.org/10.2136/vzj2017.04.0086, 2017.
Desilets, D., Zreda, M., and Prabu, T.: Extended scaling factors for in situ cosmogenic nuclides: New measurements at low latitude, Earth Planet. Sci. Lett., 246, 265–276, https://doi.org/10.1016/j.epsl.2006.03.051, 2006.
Dibb, J. and Fahnestock, M.: Snow accumulation, surface height change, and firn densification at Summit, Greenland: Insights from 2 years of in situ observation, J. Geophys. Res.-Atmos., 109, D24113, https://doi.org/10.1029/2003JD004300, 2004.
Hawdon, A., McJannet, D., and Wallace, J.: Calibration and correction procedures for cosmic-ray neutron soil moisture probes located across Australia, Water Resour. Res., 50, 5029–5043, https://doi.org/10.1002/2013WR015138, 2014.
Kodama, M.: Continuous Monitoring of Snow Water Equivalent using Cosmic-Ray Neutrons, Cold Reg. Sci. Technol., 3, 295–303, https://doi.org/10.1016/0165-232X(80)90036-1, 1980.
Kodama, M., Kawasaki, S., and Wada, M.: A cosmic ray snow gauge, Inter. J. Appl. Radiat. Isotopes, 26, 774–775, 1975.
Kodama, M., Nakai, K., Kawasaki, S., and Wada, M.: Application of Cosmic-Ray Neutron Measurements to the Determination of the Snow-Water Equivalent, J. Hydrol., 41, 85–92, https://doi.org/10.1016/0022-1694(79)90107-0, 1979.
Kodama, M., Kudo, S., and Kosuge, T.: Application of Atmospheric Neutrons to Soil-Moisture Measurement, Soil Sci., 140, 237–242, https://doi.org/10.1097/00010694-198510000-00001, 1985.
Montgomery, L., Koenig, L., and Alexander, P.: The SUMup Dataset: Compiled measurements of surface mass balance components over ice sheets and sea ice with preliminary analysis over Greenland, Earth Syst. Sci. Data Discuss., https://doi.org/10.5194/essd-2018-21, in review, 2018.
Ohio State University: Cosmic Ray Neutron Sensor Hourly Data for Summit Camp, Greenland, available at:ftp://ftp-bprc.mps.ohio-state.edu/downloads/gdg/snowfox_summit/, last access: 18 June 2018.
Paquet, E. and Laval, M.: Operation feedback and prospects of EDF cosmic-ray snow sensors, Houille Blanche, 2, 113–119, https://doi.org/10.1051/lhb:200602015, 2005.
Paquet, E., Laval, M., Basalaev, L.M., Belov, A., Eroshenko, E., Kartyshov, V., Struminsky, A., and Yanke, V.: An Application of Cosmic-Ray Neutron Measurements to the Determination of the Snow Water Equivalent, Proceedings of the 30th International Cosmic Ray Conference, Merida, Mexico, 3–11 July, 2008.
U.S. National Oceanic and Atmospheric Administration: Automatic Weather Station Data for Summit Camp, Greenland available at: ftp://isr.sri.com/pub/summit/ftp/science/NOAA/, last access: 18 June.
U.S. National Science Foundation: Surface Core and Snow Stake Network (“Bamboo Forest”) Observations for Summit Camp, Greenland, respectively available at: ftp://isr.sri.com/pub/summit/ftp/science/snowfox/ and ftp://isr.sri.com/pub/summit/ftp/science/bamboo_forest/, last access: 18 June 2018.
Zreda, M., Shuttleworth, W. J., Zeng, X., Zweck, C., Desilets, D., Franz, T., and Rosolem, R.: COSMOS: the COsmic-ray Soil Moisture Observing System, Hydrol. Earth Syst. Sci., 16, 4079–4099, https://doi.org/10.5194/hess-16-4079-2012, 2012.
Zwally, H. J. and Li, J.: Seasonal and interannual variations of firn densification and ice-sheet surface elevation at the Greenland summit, J. Glaciol., 48, 199–207, 2002.