the Creative Commons Attribution 4.0 License.
the Creative Commons Attribution 4.0 License.
 | 24 May 2018
Landform partitioning and estimates of deep storage of soil organic matter in Zackenberg, Greenland
Stefanie Cable
Hanne H. Christiansen
Gustaf Hugelius
Peter Kuhry
Soils in the northern high latitudes are a key component in the global carbon cycle, with potential feedback on climate. This study aims to improve the previous soil organic carbon (SOC) and total nitrogen (TN) storage estimates for the Zackenberg area (NE Greenland) that were based on a land cover classification (LCC) approach, by using geomorphological upscaling. In addition, novel organic carbon (OC) estimates for deeper alluvial and deltaic deposits (down to 300 cm depth) are presented. We hypothesise that landforms will better represent the long-term slope and depositional processes that result in deep SOC burial in this type of mountain permafrost environments. The updated mean SOC storage for the 0–100 cm soil depth is 4.8 kg C m−2, which is 42 % lower than the previous estimate of 8.3 kg C m−2 based on land cover upscaling. Similarly, the mean soil TN storage in the 0–100 cm depth decreased with 44 % from 0.50 kg (± 0.1 CI) to 0.28 (±0.1 CI) kg TN m−2. We ascribe the differences to a previous areal overestimate of SOC- and TN-rich vegetated land cover classes. The landform-based approach more correctly constrains the depositional areas in alluvial fans and deltas with high SOC and TN storage. These are also areas of deep carbon storage with an additional 2.4 kg C m−2 in the 100–300 cm depth interval. This research emphasises the need to consider geomorphology when assessing SOC pools in mountain permafrost landscapes.
- Article
(1490 KB) - Full-text XML
- BibTeX
- EndNote


Permafrost soils in the northern circumpolar region are sensitive to climate change (Schuur et al., 2015). In addition, they store large amounts of soil organic carbon (SOC) that has accumulated under low ground temperatures over decadal to millennial timescales. In most northern circumpolar regions, permafrost temperatures have increased since the 1980s (Romanovsky et al., 2010) and increased global mean surface temperatures are projected to decrease the near-surface permafrost extent by 37 to 81 % (with RCP2.6 to RCP8.5, respectively) by the end of the 21st century (Slater and Lawrence, 2013; IPCC, 2013). The observed permafrost degradation could intensify microbial activity and increase decomposition of organic matter formerly stored in permafrost, releasing more greenhouse gases into the atmosphere and providing a positive feedback on global warming (Schuur et al., 2015). Over a decade ago, permafrost was identified as a major vulnerable terrestrial carbon pool (Gruber et al., 2004). In 2009, Tarnocai et al. linked circumpolar SOC data (e.g. Kuhry et al., 2002; Zimov et al., 2006; Tarnocai et al., 2007; Ping et al., 2008) and presented a new total estimate of 1674 petagram C (Pg C) stored in soils and deep deposits of the northern circumpolar permafrost region. Since then, availability of more data has constrained this estimate to ca. 1300±200 Pg C (Hugelius et al., 2014). However, substantial uncertainties and data gaps remain, particularly for High Arctic and mountainous landscapes. This limited knowledge on the spatial distribution of SOC in permafrost landscapes remains a strong constraint on the ability to predict the vulnerability of the permafrost SOC pools from local to landscape to pan-Arctic scales.
Most landscape to regional-scale estimates of permafrost SOC stocks have used thematic maps to stratify and scale point observations to full spatial coverage (Hugelius, 2012). There are numerous examples of studies applying land cover classifications (LCCs) for SOC upscaling in permafrost landscapes (e.g. Kuhry et al., 2002; Hugelius and Kuhry, 2009; Palmtag et al., 2015, 2016). In Palmtag et al. (2015), a LCC was applied for upscaling SOC for two lowland sites in northeastern Siberia and a mountainous site, Zackenberg valley, in northeastern Greenland. However, limitations have been pointed out especially for the mountainous Zackenberg valley site where the geomorphology and cryostratigraphy are highly heterogeneous (Cable et al., 2017, 2018). In this area, relatively shallow deposits occur on steeper slopes, while the foothills accumulate massive deposits over millennial timescales, involving carbon burial with syngenetic permafrost aggradation (Palmtag et al., 2015; Cable et al., 2018). Thus, the application of LCC-scaling for SOC upscaling in high relief landscapes can involve larger uncertainties, particularly when estimating deeper SOC of colluvial and alluvial deposits because the long-term depositional history, controlling SOC burial, cannot be captured by the current vegetation cover that is primarily reflected in LCC. Combining a geomorphology-based landscape classification (GLC), now available for the Zackenberg valley (Cable et al., 2017, 2018), with high-quality data from detailed field studies may, therefore, improve SOC upscaling in high relief permafrost landscapes.
The overall aim of this study is to improve the SOC and total nitrogen (TN) storage estimates for the Zackenberg area (NE Greenland). Specific objectives are (1) to use largely the same dataset as in Palmtag et al. (2015) to upscale SOC and TN at 0–100 cm depth to landscape scale, based on geomorphological mapping, (2) to compare the results with the previous LCC upscaling approach, (3) to present the first SOC estimates for deposits deeper than 1 m based on newly collected deep pedons, and (4) to evaluate the importance of geomorphology for assessing landscape level SOC storage.
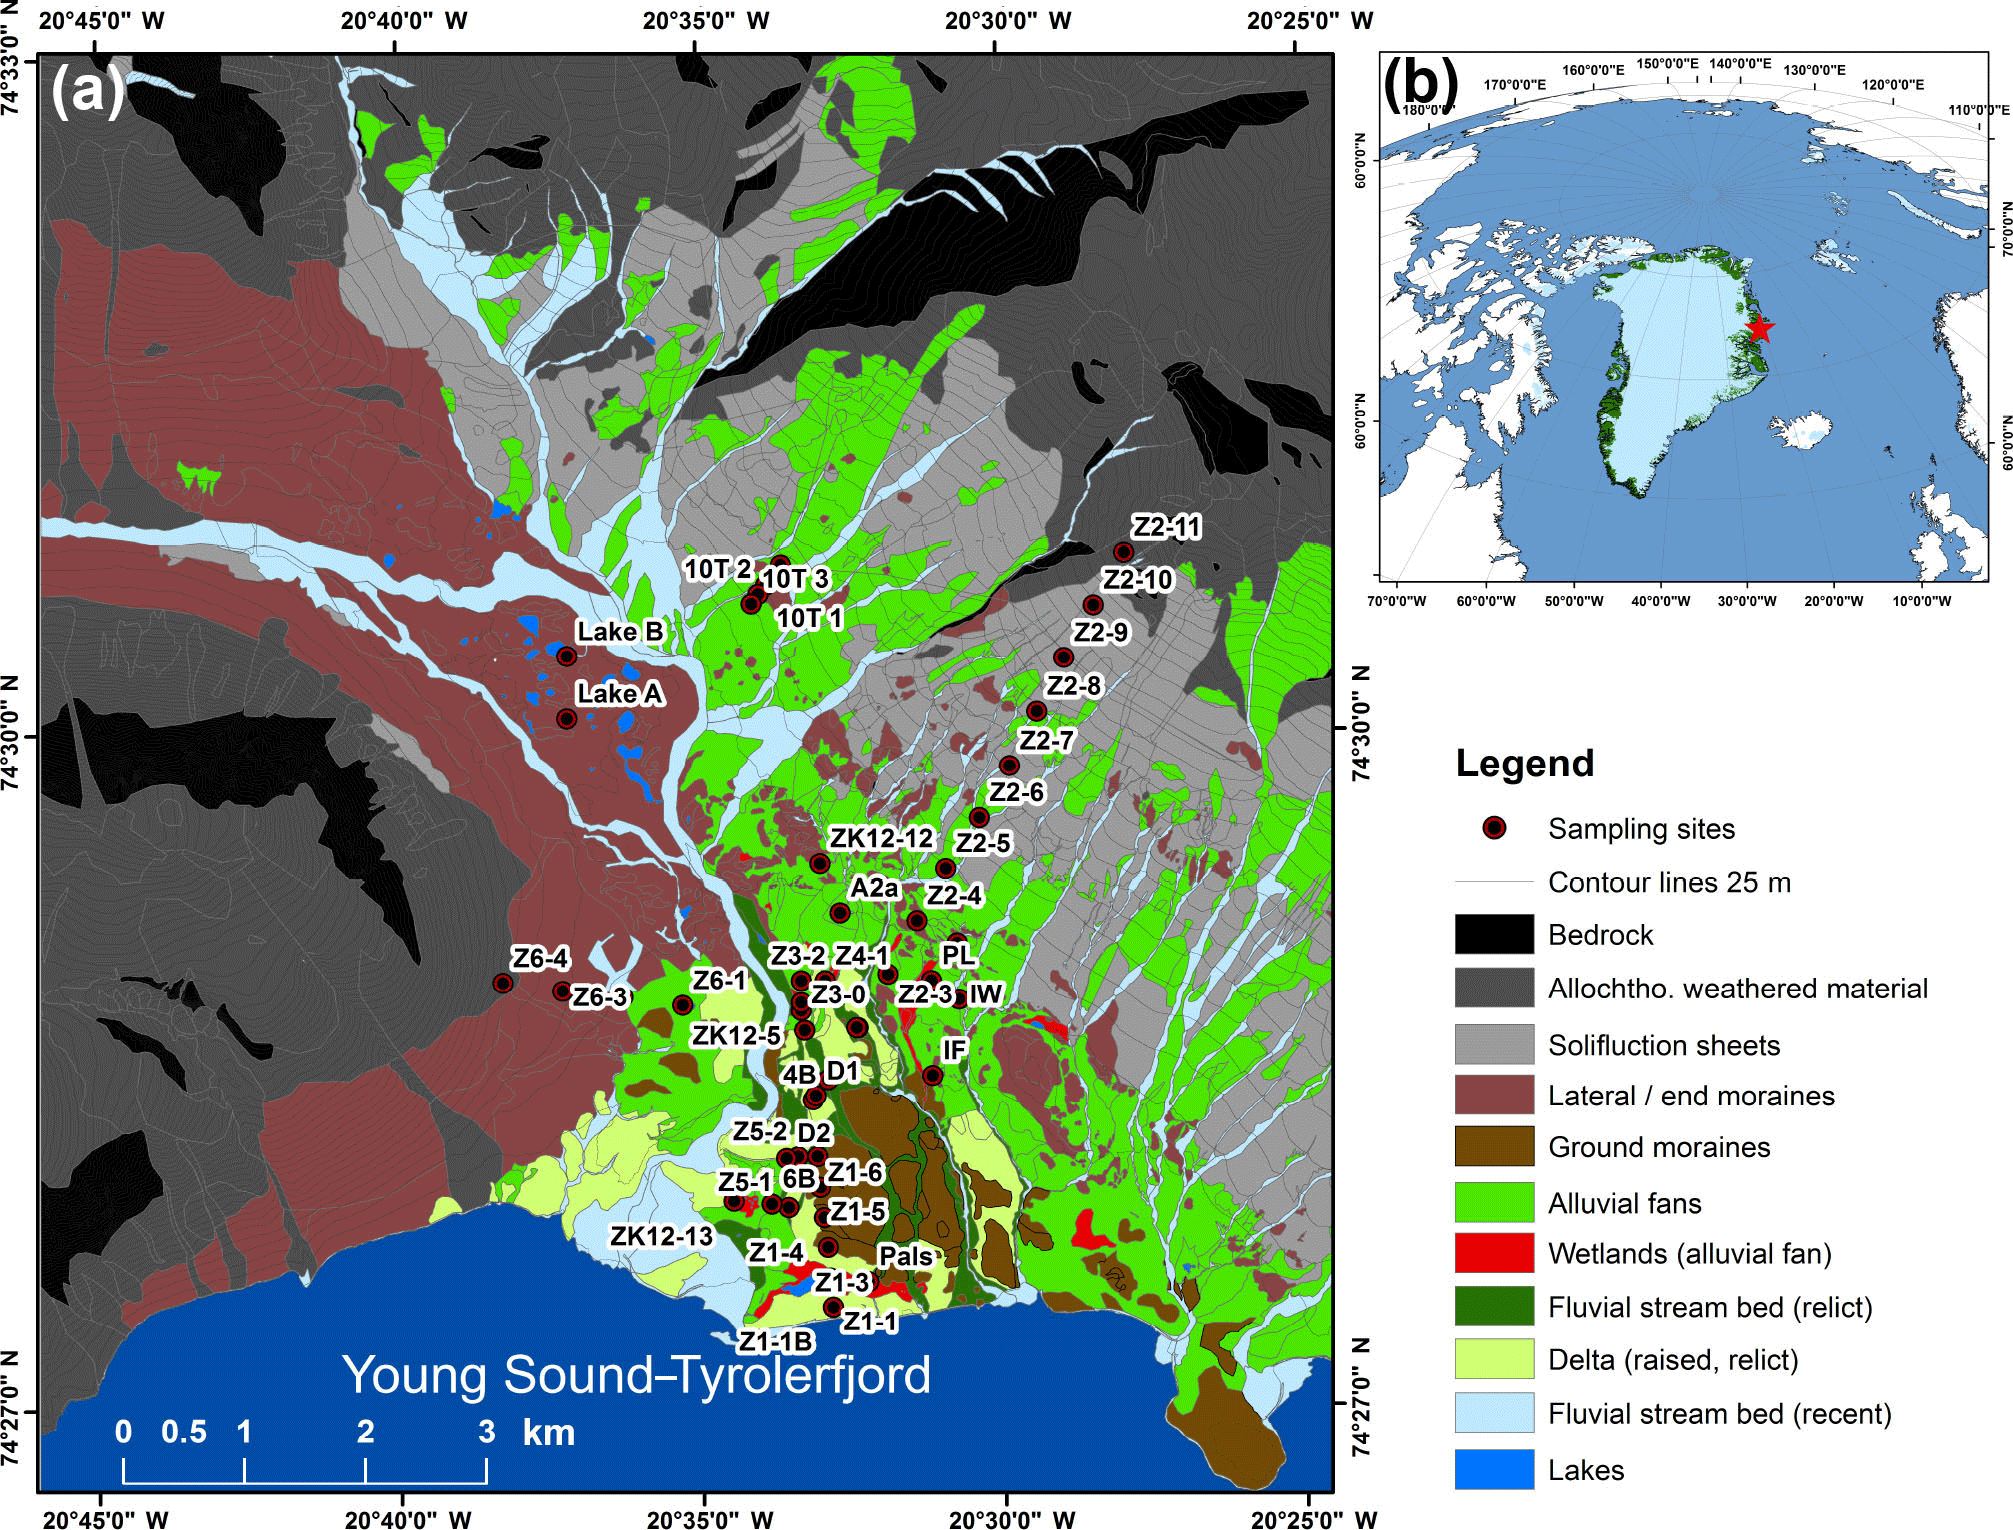
Figure 1(a) Simplified geomorphological landform map of the Zackenberg study area (based on Cable et al., 2017). (b) Location of Zackenberg in NE Greenland.
The Zackenberg valley (74∘28′ N, 20∘34′ W) is a mountainous High Arctic tundra area with a mean annual temperature of −9.2 ∘C located within the continuous permafrost zone of NE Greenland (Fig. 1). The mean annual precipitation is 261 mm of which 10 % falls as rain during the summer months from June to September (Hansen et al., 2008). The study area extends from sea level at the shores of the Young Sound up to 1372 m at the top of Zackenberg mountain. A large fault system divides the weathering resistant Caledonian gneiss and granite bedrock in the west from the Cretaceous–Tertiary sedimentary rocks in the east (Escher and Watt, 1976). According to Bennike et al. (2008), the valley deglaciated prior to 11 300 calendar years before present (cal yr BP). The parent material in the low-lying central valley is dominated mostly by glacial, periglacial, alluvial, fluvial and deltaic deposits, while on the slopes either boulder fields or colluvial sediment predominate (Christiansen et al., 2008; Cable et al., 2018). A weakly developed Typic Psammoturbel is the prevailing soil type of the central valley, with Gelorthents on the slopes (terminology following Soil Survey Staff, 2014). Small areas were occupied by peaty soils, mainly Histoturbels.
3.1 Soil sampling
Field work was conducted during late summer in 2009, 2012 and 2013. In 2009 and 2012, 38 sampling sites were selected using a semi-random, stratified transect sampling approach with predefined equidistant pedon intervals of 100 to 500 m using a handheld GPS device (accuracy of approximately 10 m). Mineral soil samples were collected using a steel pipe, manually hammered into the soil. A more detailed sampling procedure is described in Palmtag et al. (2015). In 2013, additional deeper core pedons (down to 455 cm) were sampled by drilling in alluvial fans (Cable et al., 2018), using a handheld motorised rotational Earth Auger (STIHL BT 121) with a 50 cm core barrel with outside diameter of 52 mm and a cutting edge. Out of the total of 48 sites used in this study (Fig. 1), 8 sites were sampled to depths of more than 200 cm, 19 sites to between 100 and 200 cm depth, and the remaining sites to less than 1 m depth, primarily due to shallow mineral soils overlying the bedrock. There were 648 samples collected in total throughout the three field seasons consisting of on average 10 cm long increments of organic layer, active layer and permafrost samples.
3.2 Soil chemical analyses and SOC/TN calculations
Each sample had a known field volume and was oven-dried at 70 ∘C for at least 24 h, weighed and sieved to determine the dry bulk density (DBD, g cm−3) and the amount of coarse fragments (CF, > 2 mm, %). Subsequently, each sample was individually homogenised and burned to obtain loss on ignition (LOI; Heiri et al., 2001) at 550 ∘C and, about every second sample, at 950 ∘C to determine, respectively, its organic matter and inorganic carbonate content through weight loss (for details, see Palmtag et al., 2015).
To determine total organic carbon and nitrogen (TOC/TN, %), ca. 70 % (n=284) of the samples (including all samples from fieldwork in 2009) across all sites and horizons were analysed using an EA 1110 Elemental Analyzer that measures % C and % N in the same runs (CE Instruments, Italy). To calculate the soil organic carbon content for the remaining samples, we used a fifth order polynomial regression (R2=0.97) between LOI at 550 ∘C and TOC values from the elemental analyser (see Eq. 1). This high order polynomial regression was necessary to correctly represent % C at very low LOI 550 ∘C.
Results for the inorganic carbon content were very low. The latter measurements were based on 297 samples with an average LOI 950 ∘C weight loss of only 0.994 %. Therefore, samples were not decarbonised and we did not calculate separately the contribution of inorganic carbonate in the samples.
The SOC and TN storage (kg m−2) was calculated for each collected sample using the available data on DBD (g cm−3), % C or % TN, 1–CF (the remaining proportion of the sample after excluding the coarse mineral fractions (> 2 mm)), thickness T (cm) of the sample, multiplied by 10 for unit conversion (see Eqs. 2 and 3):
Then, the total SOC and TN (kg m−2) storage was calculated by summing all the individual samples from the same profile to the different reference depths of 0–30, 0–100, 0–200 cm, etc. In cases when a sample was missing, the gap was interpolated from samples above and below by taking into account field notes on texture, ice content, coarse fraction and any presence of buried C-enriched soil layers. As too few TN values are available for the deeper deposits, the TN storage was calculated for the 0–100 cm depth interval only.
In total, we used 48 sampling sites to estimate SOC storage. If bedrock was hit at any point (n=8 within 0–100 cm depth; n=10 within 100–200 cm depth; n=5 within 200–300 cm depth), we used a SOC content of 0 kg C m−2 for the remaining bedrock part down to 300 cm depth. In the 25 remaining sites, we were able to reach about 300 cm in seven profiles. In 18 cases, sampling was stopped because of logistical constraints, such as length of steel pipe or encountering gravel. In six of these cases, we could extrapolate to the full 300 cm using SOC densities from the lower part of the same profiles. For the 12 profiles remaining, the SOC content was extrapolated to the full 200 or 300 cm depth intervals by applying default values of soil and deposit depths and their SOC densities from nearby sites.
Table 1Geomorphological landforms and their proportion of total surface area as presented in Cable et al. (2017), and the amalgamated larger landform classes used in this study (excluding Young Sound).
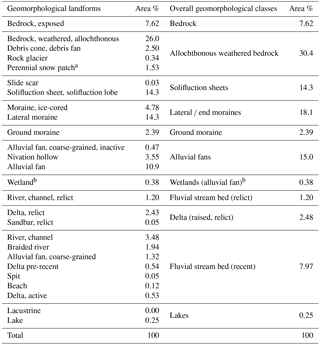
a Snow patches found at higher elevations among the other landform
units belonging to the same amalgamated landform.
b Wetland areas developed on top of alluvial fan deposits.
3.3 Upscaling procedure
The upscaling from the field measurements to landscape scale was performed in ArcGIS 10.2 (ESRI, Redlands, CA, USA) by multiplying arithmetic means of SOC from all sites belonging to the same landform class with the extent of that same class in the digital geomorphology map at a 1 : 10 000 scale from Cable et al. (2018). The geomorphological map is based on geomorphological mapping using orthorectified panchromatic aerial images of 0.2 m resolution (Tukiainen, 2001), and field validation. The 48 SOC sampling sites covered most, but not all of the originally recognised 28 landforms, however, 12 of these occupied only negligible areas of < 3 % of the total study area (Table 1). To achieve full coverage across the study area, the mapped landforms were merged into larger geomorphological classes based on topographic position and overall geomorphological characteristics. The adjusted map, consisting of 10 geomorphological classes, was then used for SOC upscaling. The map has a terrestrial coverage of 111 km2 with an additional 17 km2 of sea area (Young Sound–Tyrolerfjord), which is not included in the upscaling, but visible on the map (Fig. 1). The extent of this geomorphological map nearly completely overlaps with that of the LCC map used by Palmtag et al. (2015).
The arithmetic mean SOC storage with standard deviations (SD) for different depth intervals in the active layer and permafrost (and TN 0–100 cm storage) were calculated for each landform, based on all study sites in each landform. One landform (bedrock) consists of only one sampling site but, since SOC in rock walls is considered negligible, any assumed small within-class variability barely affects the SOC estimate at landscape scale. Subsequently, the landscape mean SOC storage for the whole study area was calculated from the mean values of each geomorphological class multiplied with the proportion of the area occupied by that class in the simplified geomorphological map.
3.4 Statistical analyses
To provide reasonable error estimates for landscape SOC, which vary naturally in the environment, a spatially weighted 95 % confidence interval (CI) was calculated following Thompson (1992). This CI is calculated to account for the relative spatial coverage, storage variability and degree of replication of each upscaling class using Eq. (4):
where “t” is the upper α∕2 of a normal distribution (1.96); “a” the percentage of the total area per class; “SD” the standard deviation of the storage estimate per class; “n” the number of replicates per class; and “i” refers to the specific land form classes. The applied upscaling procedure assumes that the available sample is sufficiently replicated to accurately reflect the natural variability within a class (Hugelius, 2012; Palmtag et al., 2016). It is important to note that the presented CI ranges do not account for any spatial errors in landform upscaling products. Error estimates for landscape SOC as well as the analyses of variances with means and SD were performed using the Microsoft Excel.
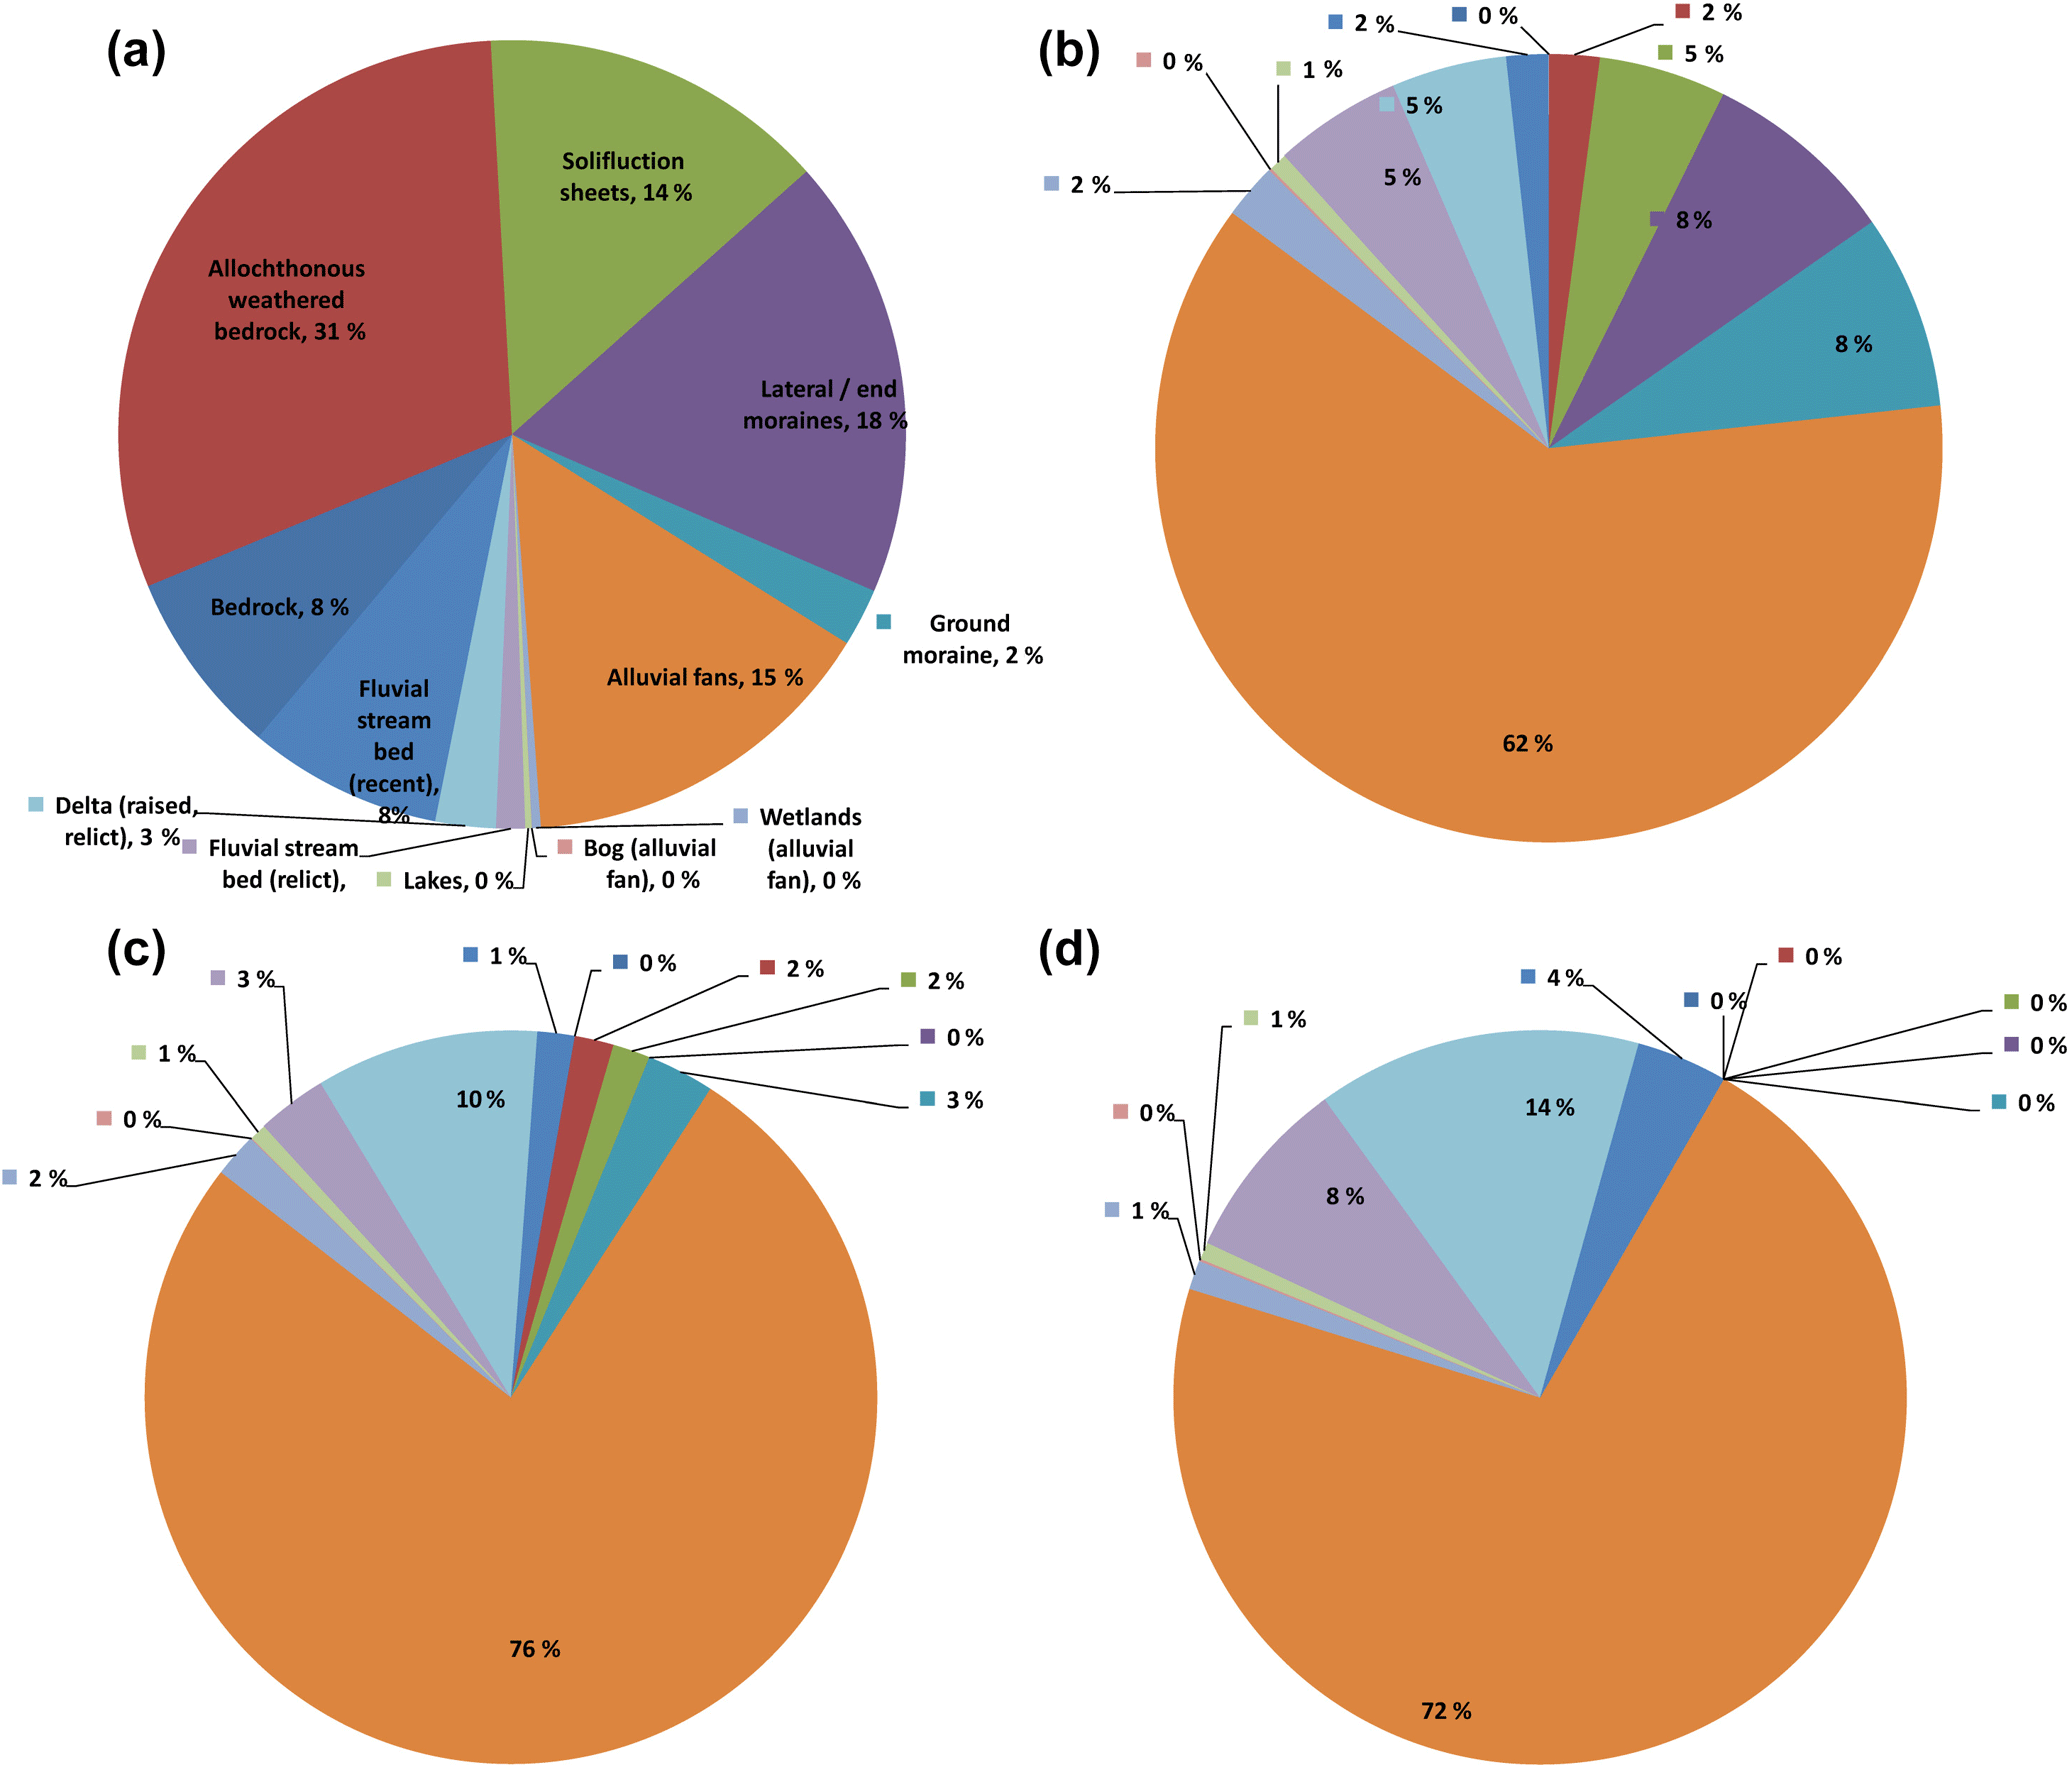
Figure 2Proportional contribution of each landform to the following variables: (a) Areal coverage of the total study area; (b) total SOC storage for 0–100 cm; (c) total SOC storage for 100–200 cm; and (d) total SOC storage for 200–300 cm. Landform and colours from (a) apply also to (b–d).
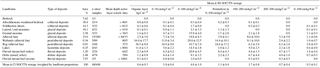
Table 2Mean SOC and TN estimates (kg m−2) for the Zackenberg study area by landforms.
The Zackenberg study area consists of several main geomorphological classes (Figs. 1 and 2). Exposed bedrock occupies about 8 % of the study area, containing negligible SOC storage (Fig. 2 and Table 2). The most widespread landform class (30 % of the study area) is “allochthonous weathered bedrock” (n=2). This class is predominantly located at higher elevation on steep hillslopes and consists of coarse-grained colluvium deposits with very little soil and vegetation development, deposited by either downslope creep and/or gravity depositional sorting. Only 7 % of the surface of this class is actually vegetated, leaving 93 % bare ground and exposed bedrock. This landform is rather active leading to relative shallow sediments with very low SOC content (Fig. 2 and Table 2).
The landform “solifluction sheets” (n=4) covers 14 % of the study area, is located on intermediate hillslopes and consists mainly of fine-grained colluvium deposits, in general loose unconsolidated weathered sediments deposited by slow downslope movement of water-saturated sediment due to recurrent freezing and thawing of the ground and driven by gravity. Only 18 % of the area is vegetated, with the remaining 82 % occupied by boulders. SOC content is low (Fig. 2 and Table 2).
The class “lateral and end moraines” (n=4) occupies 18 % of the area. More than 60 % of its surface area is occupied by boulders. This landform is inactive (not eroding or having sedimentation) but sparsely vegetated and consists largely of coarse diamicton with shallow soil depths (< 40 cm) and low SOC contents (Table 2). The “ground moraine” class occupies about 2 % of the study area in the lower parts of the central valley (Figs. 1 and 2). The surfaces have been stable since the early Holocene and are largely vegetated with only 1–5 % boulders. Soils have developed in the top metre, with signs of cryoturbation, leading to high SOC contents in the 0–100 cm depth interval (Table 2). Deposits below 100 cm depth in these two glacially deposited classes are considered tills, with very low SOC contents (Fig. 2 and Table 2).
Another widespread landform (15 % of the study area) is referred to as “alluvial fans” (n=15), with additional small areas of peaty fens (n=5) and bogs (n=3) on alluvial fans (0.4 %). These are areas of high SOC storage with, on average, 19.8, 29.8 and 42.7 kg C m−2 for the top 100 cm, respectively (Fig. 2 and Table 2). The alluvial fans are generally located in the foothills of the sedimentary northeastern slopes of the study area. Wetlands are common in the lowermost reaches of these foothills, where the slope decreases and water accumulates. Alluvial fan deposits have fine-grained sediments, often containing thin buried C-enriched layers, which sometimes reach depths of > 300 cm (maximum observed depth of 370 cm). As a result, this is the landform with some of the highest 100–200 and 200–300 cm SOC stocks (Fig. 2 and Table 2), contributing most to the deeper SOC storage in the study area. For calculation purposes bog hummocks (isolated palsas and pounus), with very high SOC stocks but occupying only 3 % of the total wetland area, were separated from peaty fen areas to not overestimate total SOC storage in this class. Furthermore, wetlands (including bogs) on alluvial fans occupy only 0.4 % of the total study area and their high SOC storage increases the weighed mean SOC storage for the entire study area by only 0.1 kg C m−2. The small area of freshwater lakes (< 1 %) has intermediate SOC values down to 300 cm of depth from sediment surface (Fig. 2 and Table 2).
Relict fluvial and (raised) deltaic landforms occupy about 4 % of the study area, in the lower reaches of the central Zackenberg valley. These landform classes have high SOC values down to depths of 300 cm and more, contributing substantially to the overall deep SOC storage in the study area. Recent fluvial stream beds occupy about 8 % of the area, but have low SOC storage values at all considered soil depth intervals (Fig. 2 and Table 2).
For the entire study area, the estimated weighed mean SOC storage is 4.8 kg C m−2 in the top 100 cm (Table 2). When comparing the mean SOC 0–100 cm distribution among different layers, 13 % is stored in the organic layer (87 % in the mineral part), with 77 % in the active layer (23 % in upper permafrost). From a SOC 0–100 cm storage perspective, the alluvial fan is the most important landform, occupying 15 % of the area with a mean SOC storage of 21.3 kg C m−2 and holding ∼ 60 % of the total SOC 0–100 cm in the study area (Fig. 2). In contrast, landforms at higher elevations (bedrock, allochthonous weathered bedrock, solifluction sheets and lateral or end moraine) occupy 70 % of the study area but store only 15 % of the total SOC 0–100 cm stocks, with mean SOC ranges between 0–2 kg C m−2.
This study provides first SOC estimates for the second and third metre depth intervals in the Zackenberg study area. However, estimates for deeper layers are based on fewer sites (see Sect. 3.2). Mean SOC storage from 100 to 200 cm depth decreased by 65 % compared to the top metre to 1.7 kg C m−2. The “alluvial fan class” is the dominant landform also regarding SOC at this depth, with 8.6 kg C m−2, contributing 76 % to the total SOC in the study area (Table 2 and Fig. 2). From 200 to 300 cm depth we estimated an additional SOC storage of 0.69 kg C m−2, with 71 % of the total SOC located in alluvial fans (Table 2 and Fig. 2). Thus, the estimated mean SOC storage for the top 300 cm soil depth is 7.2 kg C m−2. However, two of our sampling sites (alluvial fan and delta) had fine-grained deposits that were deeper than 300 cm, indicating that buried SOC is present beneath 300 cm depth (Cable et al., 2018). Additionally, Cable et al. (2018) report low C densities from two cores relatively close to the coast with 7 and 11 m thick deltaic sediments overlying glacial sediments.
The mean soil TN storage in the 0–100 cm depth interval in the Zackenberg study area is 0.28 kg TN m−2 according to the geomorphological upscaling. The highest values are found in the alluvial fans including the wetlands, with a mean storage of 1.1 kg N m−2 in alluvial fans and up to 2.9 kg N m−2 in bogs (Table 2). However, because of the small spatial extent occupied by wetlands, their contribution to the total TN storage is only 2.5 %, while alluvial fans are storing 59 % of the soil TN at 0–100 cm in the active layer and top permafrost in the study area.
This study presents new estimates of total storage and landscape partitioning of SOC and soil TN in the Zackenberg study area based on detailed geomorphological map upscaling. In comparison with the previous land cover classification (LCC) approach performed for the same area (Palmtag et al., 2015), the geomorphologically based upscaling shows a 42 % reduced weighed mean SOC 0–100 cm storage from 8.3 (±1.8 CI) to 4.8 (±1.0 CI) kg C m−2. While the SOC 0–100 cm estimates for the organic and permafrost layers deviated little in comparison with the estimates of the previous LCC approach, some deviation occurred within the mineral active layer. We estimate that 77 % of SOC 0–100 cm is located in the active layer. Likewise, the mean soil TN storage at 0–100 cm depth decreased with 44 % from 0.50 kg (±0.1 CI) to 0.28 (±0.1 CI) kg TN m−2.
Bartsch et al. (2016), who used a new approach based on synthetic aperture radar (SAR) which determined the values directly from backscatter intensity, reported SOC 0–100 cm values for the Zackenberg area of 15.0 kg C m−2 (based on points where pedon data (n=24) was available). In comparison, the Northern Circumpolar Soil Carbon Database (NCSCD) reports even higher values for this region of 17.8 kg C m−2 in the 0–100 cm depth interval. In contrast, Fuchs et al. (2015) reported a mean SOC 0–100 cm storage of 0.9 (±0.2 CI) kg C m−2 with 100 % located in seasonal frost and/or the active layer in a mountainous area of northern Sweden. The relatively large decrease in SOC (and TN) 0–100 cm storage for Zackenberg using the landform approach is mainly due to the important role of geomorphological processes in redistributing sediments in mountainous areas, which is to some extent neglected when using LCCs primarily based on vegetation cover classification from satellite observations. For example, in the LCC-upscaling (Palmtag et al., 2015) the SOC-rich vegetated classes “grasslands” and, to a lesser degree, “fens” occupied relatively large proportions of the total study area (20 and 3 % coverage, respectively). These included areas on slopes at mid-elevation with patchy grassland cover and wet areas along streambeds. However, most of the pedons for these classes were located in the foothills and central valley characterized by higher SOC and TN storage. This resulted in a pedon dataset that was not truly representative for its thematic class and a high-biased mean SOC and TN storage was applied to relatively large areas. The GLC-approach in the current study better identifies areas of high SOC and TN storage in depositional environments such as alluvial fans (including wetlands on alluvial fans) occupying more limited proportions of the total study area (15 and 0.4 %, respectively). Therefore, the substantial decrease of SOC and TN has occurred because the areal extent of the SOC- and TN-rich vegetated classes (grasslands 20 %, Salix snow bed 7 %, Dryas heath 6 %, Cassiope heath 4 % and fen 3 %) has been reduced from 40 % in the LCC to 22 % (alluvial fans 15.4 %, delta (raised, relict) 2.5 %, fluvial stream bed (relict) 1.2 % and ground moraine till 2.4 %) using the landform upscaling. Also in non-alpine environments, such as the Lena River delta, geomorphological setting better explained SOC variability than vegetation cover (Siewert et al., 2016).
When comparing the CI of the weighed mean SOC 0–100 cm estimates for the entire study area using LCC (8.3±1.8 kg C m−2) and GLC (4.8±1.0 kg C m−2) there is an absolute decrease in the uncertainty range, but in relative terms it remains similar (20 %, also for TN). Comparable results are obtained for the mean and SD of the dominant classes in both upscaling approaches (despite a marked difference in sample size), with “grasslands” (n=6) in the LCC (19.1±8.3 kg C m−2) and “alluvial fans” (n=15) in the GLC (19.8±9.3 kg C m−2), or a coefficient of variation of 45 % in both cases. This might point to the fact that there is an intrinsic variability in SOC storage within these classes, related to microtopography, drainage, plant productivity, SOC burial, coarse fraction content, active layer thickness and ground ice volume and type, among others.
The geomorphological approach is particularly important in identifying areas of deep SOC storage related to depositional environments such as alluvial, fluvial and deltaic landforms, for which the (cryo)stratigraphy (including excess ground ice) should be taken into account. Alluvial fans can consist of up to several metres (≤ 4 m) of thick fine-grained laminated deposits accumulated during the Holocene due to the downslope sediment transport of materials and their subsequent deposition in the foothills by nivation processes (Christiansen, 1998; Cable et al., 2018). Intercalated SOC-enriched layers up to 8600 cal yr BP old (Cable et al., 2018) indicate the repeated burial of stable vegetated surfaces and/or organic material eroded by nival meltwater higher up. Radiocarbon dates of SOC-enriched material in the central valley were on average between 3929 and 7748 cal yr BP at depths of 50–80 cm. While the current fens had shallow fen deposits with young basal peat dates varying between 375 and 2021 cal yr BP (n=5) (Palmtag et al., 2015). Relict deltaic areas in the lower central valley are another area of deep SOC storage, with deltaic deposits OSL-dated to 11–13 ka reaching depths of 7–11 m overlying a glacial till unit (Gilbert et al., 2017).
This study includes the first SOC storage estimates down to 300 cm depth with quantitative uncertainty ranges for the Zackenberg study area. We estimate that 1.7±0.8 and 0.7±0.4 kg C m−2 is being stored in the second and third metre of deposits, respectively. This is a considerable amount, representing an additional 50 % SOC compared to the storage in the top metre, mainly located in alluvial fan deposits. Deltaic deposits further contribute to the 100–300 cm SOC storage but locally reach depths of at least 13 m. The low carbon densities of these deepest deposits are similar to those reported for the 100–300 cm depth interval (Cable et al., 2018), assuming these deltaic deposits have the same areal extent as today (2.48 %) and a mean depth of 8 m based on new data published in Gilbert et al. (2017). Using the low carbon densities reported above, we can arrive at a preliminary additional storage in deltaic deposits > 300 cm of 32 kg C m−2, which would increase the study area weighed mean by a further 0.8 kg C m−2. However, additional work is required to increase the accuracy of these values.
This study presents new and improved estimates of SOC and TN from 0 to 100 cm depth in Zackenberg (NE Greenland), based on upscaling using geomorphological landforms. Moreover, we first report SOC estimates to a depth of 300 cm. Following our listed aims from the introductory section, we conclude the following: (1) the updated weighed landscape-level mean SOC and TN 0–100 cm storage in the Zackenberg study area based on geomorphological mapping are 4.8 kg C m−2 and 0.28 kg TN m−2, respectively. (1) The new mean SOC and TN estimates to 100 cm depth are 44 and 42 % less than previously reported estimates of 8.3 kg C m−2 and 0.50 kg TN m−2, when using a LCC upscaling approach. (3) Our deep pedon dataset indicates that an additional 1.7 and 0.7 kg C m−2 are stored in the second and third metre depth, respectively. (4) A previous areal overestimate of SOC-rich vegetated land cover classes on slopes was the main reason for this large difference in SOC storage. Downslope creep constantly transport material downslope resulting in relatively shallow soil depths and low SOC storage. Slope materials have accumulated at the foot of the slopes in alluvial fans during the entire Holocene, primarily by nivation processes creating thick, fine-grained deposits with buried SOC-enriched layers throughout their depth. Whereas the LCC recognised vegetated SOC-rich classes on the slopes, in the foothills and in the central valley, the GLC upscaling more correctly restricts the SOC-rich classes to areas with deposition. The use of LCC upscaling in these mountainous settings can introduce large uncertainties since it is based on recent land cover and vegetation only that do not necessarily reflect the long-term geomorphic processes leading to SOC burial. To the contrary, the landform-based approach identifies hotspots of SOC burial in the landscape such as alluvial fans and (to a minor extent) deltas. The GLC approach is, therefore, also highly relevant when identifying areas of deep carbon storage (between 100–300 cm, and more). Deltaic deposits extend below 300 cm depth, which implies that there are additional SOC stocks at greater depth but these remain poorly constrained at this time. The results emphasise the importance of geomorphology, rather than land cover, controlling SOC storage in high relief permafrost environments.
At the moment the research data are being compiled and will be made publicly available as soon as possible. If needed before they are made available, please contact the author and we will gladly share the data.
The authors declare that they have no conflict of interest.
This article is part of the special issue “Changing Permafrost in the Arctic and its Global Effects in the 21st Century (PAGE21) (BG/ESSD/GMD/TC inter-journal SI)”. It is not associated with a conference.
Fieldwork in Zackenberg was financed through the Nordforsk Nordic Centre of
Excellence DEFROST project (grant number 23001), the EU FP7 PAGE21 project
(grant number 282700) and the ESF CryoCARB project (Swedish Research Council
project to Peter Kuhry). Additional funding for fieldwork in 2013 and
subsequent core analyses were supported by the University Centre in Svalbard
(UNIS) and the Centre for Permafrost (CENPERM) at the University of
Copenhagen, funded by the Danish National Research Foundation (CENPERM
DNRF100). We gratefully acknowledge the support with drilling and core
analyses by co-leader Bo Elberling (CENPERM, University of
Copenhagen) and students participating in the UNIS course AG-833 “High
Arctic Permafrost Landscape Dynamics in Svalbard and Greenland” in 2013,
funded by the University Centre in Svalbard (UNIS), the Norden Perma-Nordnet
project and the Centre for Permafrost (CENPERM), University of Copenhagen.
We would like to thank the GeoBasis Programme of the Zackenberg research
station for providing data (overview map and DEM data).
The article processing charges for this open-access
publication were covered by Stockholm University.
Edited by: Julia Boike
Reviewed by: Jens Strauss and one anonymous referee
Bartsch, A., Widhalm, B., Kuhry, P., Hugelius, G., Palmtag, J., and Siewert, M. B.: Can C-band synthetic aperture radar be used to estimate soil organic carbon storage in tundra?, Biogeosciences, 13, 5453–5470, https://doi.org/10.5194/bg-13-5453-2016, 2016.
Bennike, O., Sörensen, M., Fredskild, B., Jacobsen, B. H., Böcher, J., Amsinck, S. L., Jeppesen, E., Andreasen, C., Christiansen, H. H., and Humlum, O.: Late Quaternary environment and cultural changes in the Wollaston Forland region, northeast Greenland, Adv. Ecol. Res., 40, 45–79, https://doi.org/10.1016/S0065-2504(07)00003-7, 2008.
Cable, S., Christiansen, H. H, Westergaard-Nielsen, A., Kroon, A., and Elberling, B.: Geomorphological and geocryological maps of the Zackenberg Valley, NE Greenland (ArCGIS Map Package), PANGAEA, Supplement to: Cable et al., 2017, https://doi.org/10.1594/PANGAEA.883484, 2017.
Cable, S., Christiansen, H. H., Westergaard-Nielsen, A., Kroon, A., and Elberling, B.: Geomorphological and cryostratigraphical analyses of the Zackenberg Valley, NE Greenland and significance of Holocene alluvial fans, Geomorphology, 303, 504–523, https://doi.org/10.1016/j.geomorph.2017.11.003, 2018.
Christiansen, H. H.: Nivation forms and processes in unconsolidated sediments, NE Greenland, Earth Surf. Proc. Land., 23, 751–760, https://doi.org/10.1002/(SICI)1096-9837(199808)23:8<751::AID-ESP886>3.0.CO;2-A, 1998.
Christiansen, H. H., Sigsgaard, C., Humlum, O., Rasch, M., and Hansen, B. U.: Permafrost and periglacial geomorphology at Zackenberg, Adv. Ecol. Res., 40, 151–174, https://doi.org/10.1016/S0065-2504(07)00007-4, 2008.
Escher, A. and Watt, W. S.: The geology of Greenland, The Geological Survey of Greenland, 603 p., 1976.
Fuchs, M., Kuhry, P., and Hugelius, G.: Low below-ground organic carbon storage in a subarctic Alpine permafrost environment, The Cryosphere, 9, 427–438, https://doi.org/10.5194/tc-9-427-2015, 2015.
Gilbert, G. L., Cable, S., Thiel, C., Christiansen, H. H., and Elberling, B.: Cryostratigraphy, sedimentology, and the late Quaternary evolution of the Zackenberg River delta, northeast Greenland, The Cryosphere, 11, 1265–1282, https://doi.org/10.5194/tc-11-1265-2017, 2017.
Gruber, N, Friedlingstein, P., Field, C. B., Valentini, R., Heimann, M., Richey, J. E., Romero-Lankao, P., Schulze, D., and Chen, C.-T. A.: The vulnerability of the carbon cycle in the 21st century: An assessment of carbon-climate-human interactions, in: The Global Carbon Cycle, Integrating Humans, Climate and the Natural World, edited by: Field, C. and Raupach, M., Island Press, Washington D.C., 45–76, 2004.
Hansen, B. U., Sigsgaard, C., Rasmussen, L., Cappelen, J., Hinkler, J., Mernild, S. H., Petersen, D., Tamstorf, M. P., Rasch, M., and Hasholt, B.: Present-day climate at Zackenberg, Adv. Ecol. Res., 40, 111–149, https://doi.org/10.1016/S0065-2504(07)00006-2, 2008.
Heiri, O., Lotter, A. F., and Lemcke, G.: Loss on ignition as a method for estimating organic carbon and carbonate content in sediments: reproduction and comparability of results, J. Paleolimnol., 25, 101–110, https://doi.org/10.1023/a:1008119611481, 2001.
Hugelius, G.: Spatial upscaling using thematic maps: An analysis of uncertainties in permafrost soil carbon estimates, Global Biogeochem. Cy., 26, GB2026, https://doi.org/10.1029/2011GB004154, 2012.
Hugelius, G. and Kuhry, P.: Landscape partitioning and environmental gradient analyses of soil organic carbon in a permafrost environment, Global Biogeochem. Cy., 23, GB3006, https://doi.org/10.1029/2008GB003419, 2009.
Hugelius, G., Strauss, J., Zubrzycki, S., Harden, J. W., Schuur, E. A. G., Ping, C.-L., Schirrmeister, L., Grosse, G., Michaelson, G. J., Koven, C. D., O'Donnell, J. A., Elberling, B., Mishra, U., Camill, P., Yu, Z., Palmtag, J., and Kuhry, P.: Estimated stocks of circumpolar permafrost carbon with quantified uncertainty ranges and identified data gaps, Biogeosciences, 11, 6573–6593, https://doi.org/10.5194/bg-11-6573-2014, 2014.
IPCC: Summary for Policymakers, in: Climate Change 2013: The Physical Science Basis. Contribution of Working Group I to the Fifth Assessment Report of the Intergovernmental Panel on Climate Change, edited by: Stocker, T. F., Qin, D., Plattner, G.-K., Tignor, M., Allen, S. K., Boschung, J., Nauels, A., Xia, Y., Bex, V., and Midgley, P. M., Cambridge University Press, Cambridge, United Kingdom and New York, NY, USA, 2013.
Kuhry, P., Mazhitova, G. G., Forest, P.-A., Deneva, S. V., Virtanen, T., and Kultti, S.: Upscaling soil organic carbon estimates for the Usa Basin (Northeast European Russia) using GIS-based landcover and soil classification schemes, Danish Journal of Geography, 102, 11–25, 2002.
Palmtag, J., Hugelius, G., Lashchinskiy, N., Tamstorf, M. P., Richter, A., Elberling, B., and Kuhry, P.: Storage, landscape distribution and burial history of soil organic matter in contrasting areas of continuous permafrost, Arct. Antarct. Alp. Res., 47, 71–88, https://doi.org/10.1657/AAAR0014-027, 2015.
Palmtag, J., Ramage, J., Hugelius, G., Gentsch, N., Lashchinskiy, N., Richter, A., and Kuhry, P.: Controls on the storage of organic carbon in permafrost soils in northern Siberia, Eur. J. Soil Sci., 67, 478–491, https://doi.org/10.1111/ejss.12357, 2016.
Ping, C.-L., Michaelson, G. J., Jorgenson, M. T., Kimble, J. M., Epstein, H., Romanovsky, V. E., and Walker, D. A.: High stocks of soil organic carbon in North American Arctic region, Nat. Geosci., 1, 615–619, https://doi.org/10.1038/ngeo284, 2008.
Romanovsky, V. E., Smith, S. L., and Christiansen, H. H.: Permafrost thermal state in the polar Northern Hemisphere during the international polar year 2007–2009: a synthesis, Permafrost Periglac., 21, 106–116, https://doi.org/10.1002/ppp.689, 2010.
Schuur, E. A. G., McGuire, A. D., Schädel, C., Grosse, G., Harden, J. W., Hayes D. J., Hugelius, G., Koven, C. D., Kuhry, P., Lawrence, D. M., Natali, S. M., Olefeldt, D., Romanovsky, V. E., Schaefer, K., Turetsky, M. R., Treat, C. C., and Vonk, J. E.: Climate change and the permafrost carbon feedback, Nature, 20, 171–179, https://doi.org/10.1038/nature14338, 2015.
Siewert, M. B., Hugelius, G., Heim, B., and Faucherre, S.: Landscape controls and vertical variability of soil organic carbon storage in permafrost-affected soils of the Lena River Delta, CATENA, 147, 725–741, https://doi.org/10.1016/j.catena.2016.07.048, 2016.
Slater, A. G. and Lawrence, D. M.: Diagnosing Present and Future Permafrost from Climate Models, J. Climate, 26, 5608–5623, https://doi.org/10.1175/JCLI-D-12-00341.1, 2013.
Soil Survey Staff: Keys to Soil Taxonomy, Twelfth Edition, USDA-Natural Resources Conservation Service, Washington, D.C., 2014.
Tarnocai, C., Swanson, D., Kimble, J., and Broll, G.: Northern Circumpolar Soil Carbon Database, Digital Database, Research Branch, Agriculture and Agri-Food Canada, Ottawa, Canada, 2007.
Tarnocai, C., Canadell, J. G., Schuur, E. A. G., Kuhry, P., Mazhitova, G., and Zimov, S.: Soil organic carbon pools in the northern circumpolar permafrost region, Global Biogeochem. Cy., 23, GB2023, https://doi.org/10.1029/2008GB003327, 2009.
Thompson, S. K.: Sampling, John Wiley, New York, 343 p., 1992.
Tukiainen, T.: Projects MINEO and HyperGreen: airborne hyperspectral data acquisition in East Greenland for environmental monitoring and mineral exploration, Geology of Greenland Survey Bulletin, 189, 122–126, 2001.
Zimov, S. A., Schuur, E. A. G., and Chapin III, F. S.: Permafrost and the global carbon budget, Science, 312, 1612–1613, https://doi.org/10.1126/science.1128908, 2006.