the Creative Commons Attribution 4.0 License.
the Creative Commons Attribution 4.0 License.
 | 19 Feb 2025
Reconstructed glacier area and volume changes in the European Alps since the Little Ice Age
Johannes Reinthaler
Frank Paul
Glaciers in the European Alps have experienced drastic area and volume loss since the end of the Little Ice Age (LIA) around the year 1850. How large these losses were is only poorly known, as published estimates of area loss are mostly based on simple upscaling and Alpine-wide reconstructions of LIA glacier surfaces are lacking. For this study, we compiled all digitally available LIA glacier extents for the Alps and added missing outlines for glaciers >0.1 km2 by manual digitising. This was based on geomorphologic interpretation of moraines and trimlines on very high-resolution images in combination with historic topographic maps and modern glacier outlines. Glacier area changes are determined for all glaciers with LIA extents at a regional scale. Glacier surface reconstruction with a geographic information system (GIS) was applied to calculate (a) glacier volume changes for the entire region from the LIA until around 2015 and (b) total LIA glacier volume in combination with a reconstructed glacier bed. The glacier area shrunk from 4244 km2 at the LIA maximum to 1806 km2 in 2015 (−57 %), and volume was reduced from about 280 ± 43 km3 around 1850 to 100 ± 17 km3 (−64 %) in 2015, roughly in line with previous estimates. On average, glacier surfaces lowered by −43.6 m until 2015 (−0.26 m a−1), which is 3 times less than observed over the 2000 to 2015 period (−0.82 m a−1). Many glaciers now have only remnants of their former coverage left, and at least 1938 glaciers melted away completely, which led to deglaciation of entire catchments. The new datasets should support a wide range of studies related to the determination of climate change impacts in the Alps, e.g. future glacier evolution, hydrology, land cover change, plant succession, and emerging hazards.
- Article
(6529 KB) - Full-text XML
-
Supplement
(32354 KB) - BibTeX
- EndNote


Glaciers in the European Alps are among the most intensely studied worldwide. During recent decades, increasing temperatures caused accelerated glacier retreat and down-wasting, impacting water supplies during dry periods, glacier forefield ecosystems, slope stability, and tourism (Brunner et al., 2019; Cannone et al., 2008; Haeberli et al., 2007; Oppikofer et al., 2008). While it is crucial to determine the future evolution of glaciers and its consequences, reconstructing past glacier extents and changes allows us to put possible future developments into perspective. Direct observation of glacier extents (including pictorial evidence) and first measurements of front variations in the Alps date back to pre-industrial times (e.g. Zumbühl and Nussbaumer, 2018), whereas first topographic maps with glacier extents were published in the 19th century for different Alpine regions (Table S1 in the Supplement). The large body of literature presenting outlines from historic glacier extents in the Alps and elsewhere (e.g. Grove, 2001) in printed (analogue) form is a highly valuable source of information, but it is hard to use in today's digital world and thus needs to be digitised and geocoded first.
As an alternative, very high-resolution satellite or aerial images allow us to identify and delineate terminal and lateral moraines or trimlines (separating regions with a different density of vegetation cover) to reconstruct Little Ice Age (LIA) glacier extents (e.g. Reinthaler and Paul, 2023; Lee et al., 2021). For the Alps, numerous studies have already created LIA inventories for specific regions or countries (e.g. Colucci and Žebre, 2016; Fischer et al., 2015; Gardent, 2014; Knoll et al., 2009; Lucchesi et al., 2014; Maisch et al., 2000; Nigrelli et al., 2015; Scotti and Brardinoni, 2018; Zanoner et al., 2017), and LIA outlines from Switzerland and Austria are freely available in open repositories or in the Global Land Ice Measurements from Space (GLIMS) glacier database (Raup et al., 2007) (further details are listed in Table S2). However, for some regions in the Alps (3 % of all glacier area according to the Randolph Glacier Inventory v7.0; RGI Consortium, 2023), digitised LIA glacier extents were not available and have been newly digitised in this study (Fig. 1, Table S3). While reconstructions of glacier extent and surfaces for the LIA maximum have been compiled and published for many regions around the world, e.g. for Patagonia by Glasser et al. (2011), for Greenland's peripheral glaciers by Carrivick et al. (2023), for the Himalayas by Lee et al. (2021), and for New Zealand by Carrivick et al. (2020), this information was so far not available for the entire European Alps.
In the Alps, glaciers reached near-maximum extents several times between 1250 and 1850/60, with the exact timing varying by glacier (e.g. Zumbühl and Holzhauser, 1988; Nussbaumer et al., 2011; Nicolussi et al., 2022). Especially for smaller glaciers, the LIA maximum extent could have been reached at any of the LIA advance periods (e.g. 1350, 1600, 1820, 1850). Extent differences between the different maximum stages were generally small, with older advances sometimes being slightly larger (Le Roy et al., 2024). More specifically, most glaciers in the Italian and Western Alps reached their last maximum extent around 1820 but re-advanced to almost the same position around 1850 (Solomina et al., 2015). In contrast, Austrian glaciers reached their last maximum in the 1850s to 1860s (Ivy-Ochs et al., 2009). However, only the moraines and trimlines from the last maximum extent (around 1850) are sufficiently complete and have thus been used for digitising. In most regions of the Alps, later re-advances took place in the 1890s, 1920s, and 1970s to 1980s. Terminal and partly also lateral moraines from these re-advances can still be seen in several glacier forefields (e.g. Paul and Bolch, 2019). The study by Zemp et al. (2008) suggests a glacier area reduction of almost 50 % between 1850 (4474 km2) and 2000 (2272 km2) based on a size-dependent extrapolation scheme to obtain Alpine-wide extents for 1850. The study by Hoelzle et al. (2003) used parameterisation schemes (e.g. to derive mass balance from length changes), whereas Colucci and Žebre (2016) used volume–area scaling to derive former glacier volume for the Julian Alps. However, only by reconstructing the former glacier surface directly can distributed glacier thicknesses and elevation changes be derived.
This study presents a first complete compilation of LIA maximum glacier extents from around 1850 along with a reconstruction of their surfaces and calculation of their volumes for all glaciers in the Alps larger than 0.1 km2. Furthermore, we quantify changes in glacier area, volume, and elevation between the LIA and around the year 2000 and analyse related spatial variations at the regional scale.
2.1 Study regions
For the regional-scale calculations, we have adopted the International Standardized Mountain Subdivision of the Alps (Marazzi, 2004), which was previously also used by Sommer et al. (2020) to regionally aggregate recent glacier mass changes. The dataset consists of a main division into the Eastern and Western Alps and 14 subdivisions into smaller regions (Fig. 1). Regions with a very small glacier coverage (<5 km2) were merged with neighbouring regions (the Maritime Alps with the Cottian Alps and a combined region for the northeastern Alps). Glacier area and volume changes were also calculated per country and for four major river basins (Rhine, Rhône, Danube, Po), as well as for the combined basins of the SE Alps.
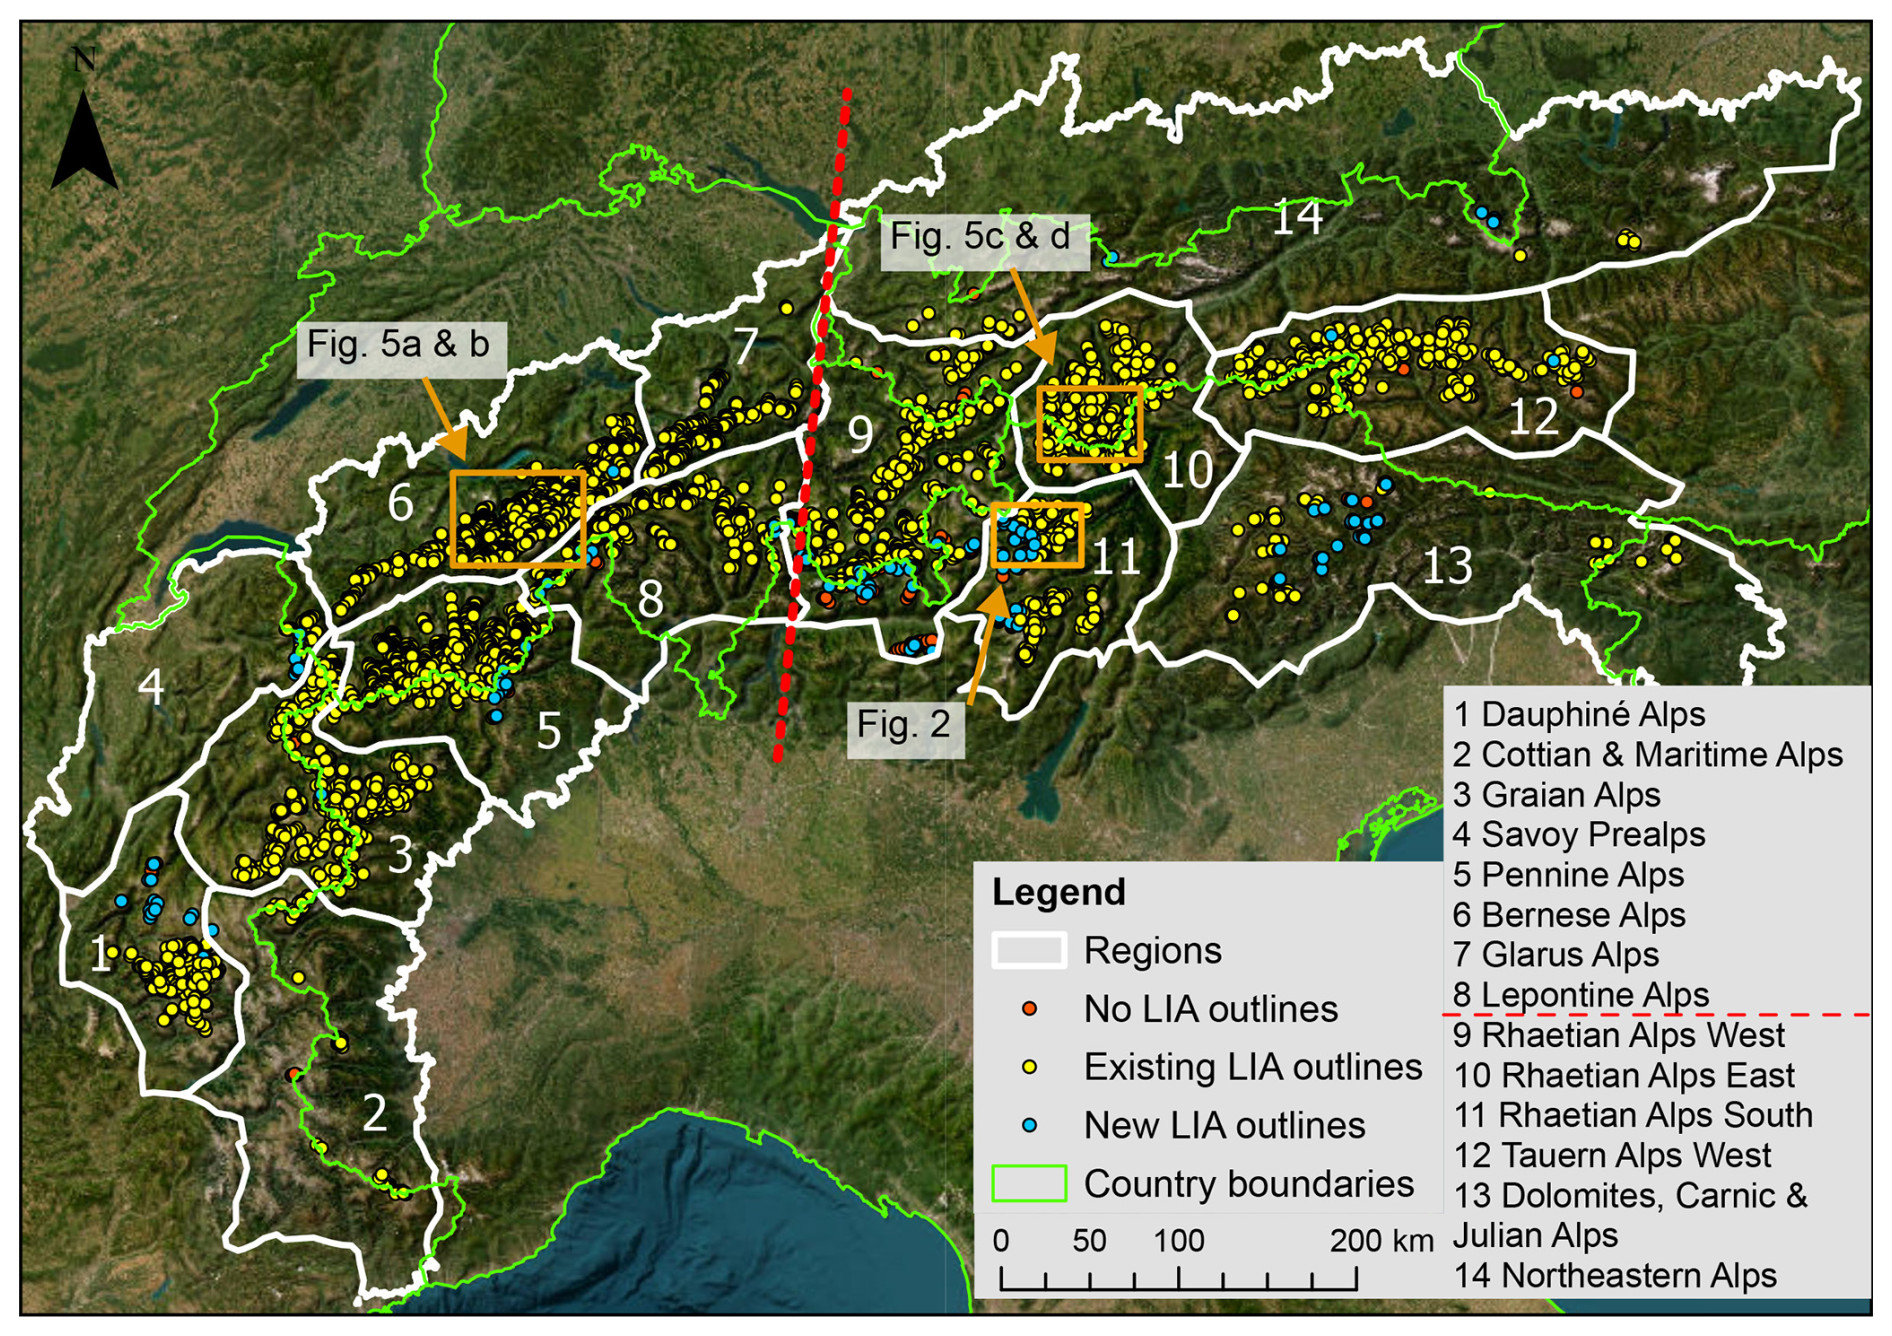
Figure 1The study region of the European Alps. The 14 sub-regions are in white, the existing LIA glacier outlines (3891 km2) from various sources (see Table S2) are in yellow, the new LIA glacier outlines (329 km2) are in blue, and the glaciers of the RGI v7.0 (<0.1 km2) without an LIA equivalent (6.8 km2) are in red. The orange squares denote the locations of the sub-regions shown in Figs. 2 and 5. The dashed red line marks the division between the Eastern and Western Alps. Background image: ESRI (2023b).
2.2 Glacier outlines
We have used glacier outlines representing maximum LIA extents from various sources (see Table S2), a second dataset from the year 2003 compiled by Paul et al. (2011) and available from RGI v7.0, and a third dataset from around 2015/16 described by Paul et al. (2020) and available from GLIMS. The 2003 inventory was derived from Landsat 5 images, and the 2015/16 inventory was derived from Sentinel-2 images; both datasets were taken as is and not modified. Due to differences in the interpretation of glacier extents by different analysts for the two datasets, we will only present glacier changes at a regional scale rather than per glacier. Missing LIA extents were digitised for important individual glaciers and for glaciers larger than 0.1 km2 in RGI v7.0 based on the geomorphological interpretation of trimlines and of frontal and lateral moraines as visible on very high-resolution (up to 0.5 m) images (Fig. 2). These images were provided by web map services from ESRI (World Imagery standard and clarity (ESRI, 2023b); Google (https://earth.google.com/web/, last access: 1 May 2024) and Bing (https://www.bing.com/maps, last access: 1 May 2024)) and used in combination with roughly geocoded historical maps (see Table S1 for details) to aid in the interpretation. For the LIA outline digitising, we reshaped outlines from 1967–1971 for France (according to Vivian, 1975) and the RGI v7.0 from 2003 for the other regions (RGI Consortium, 2023).
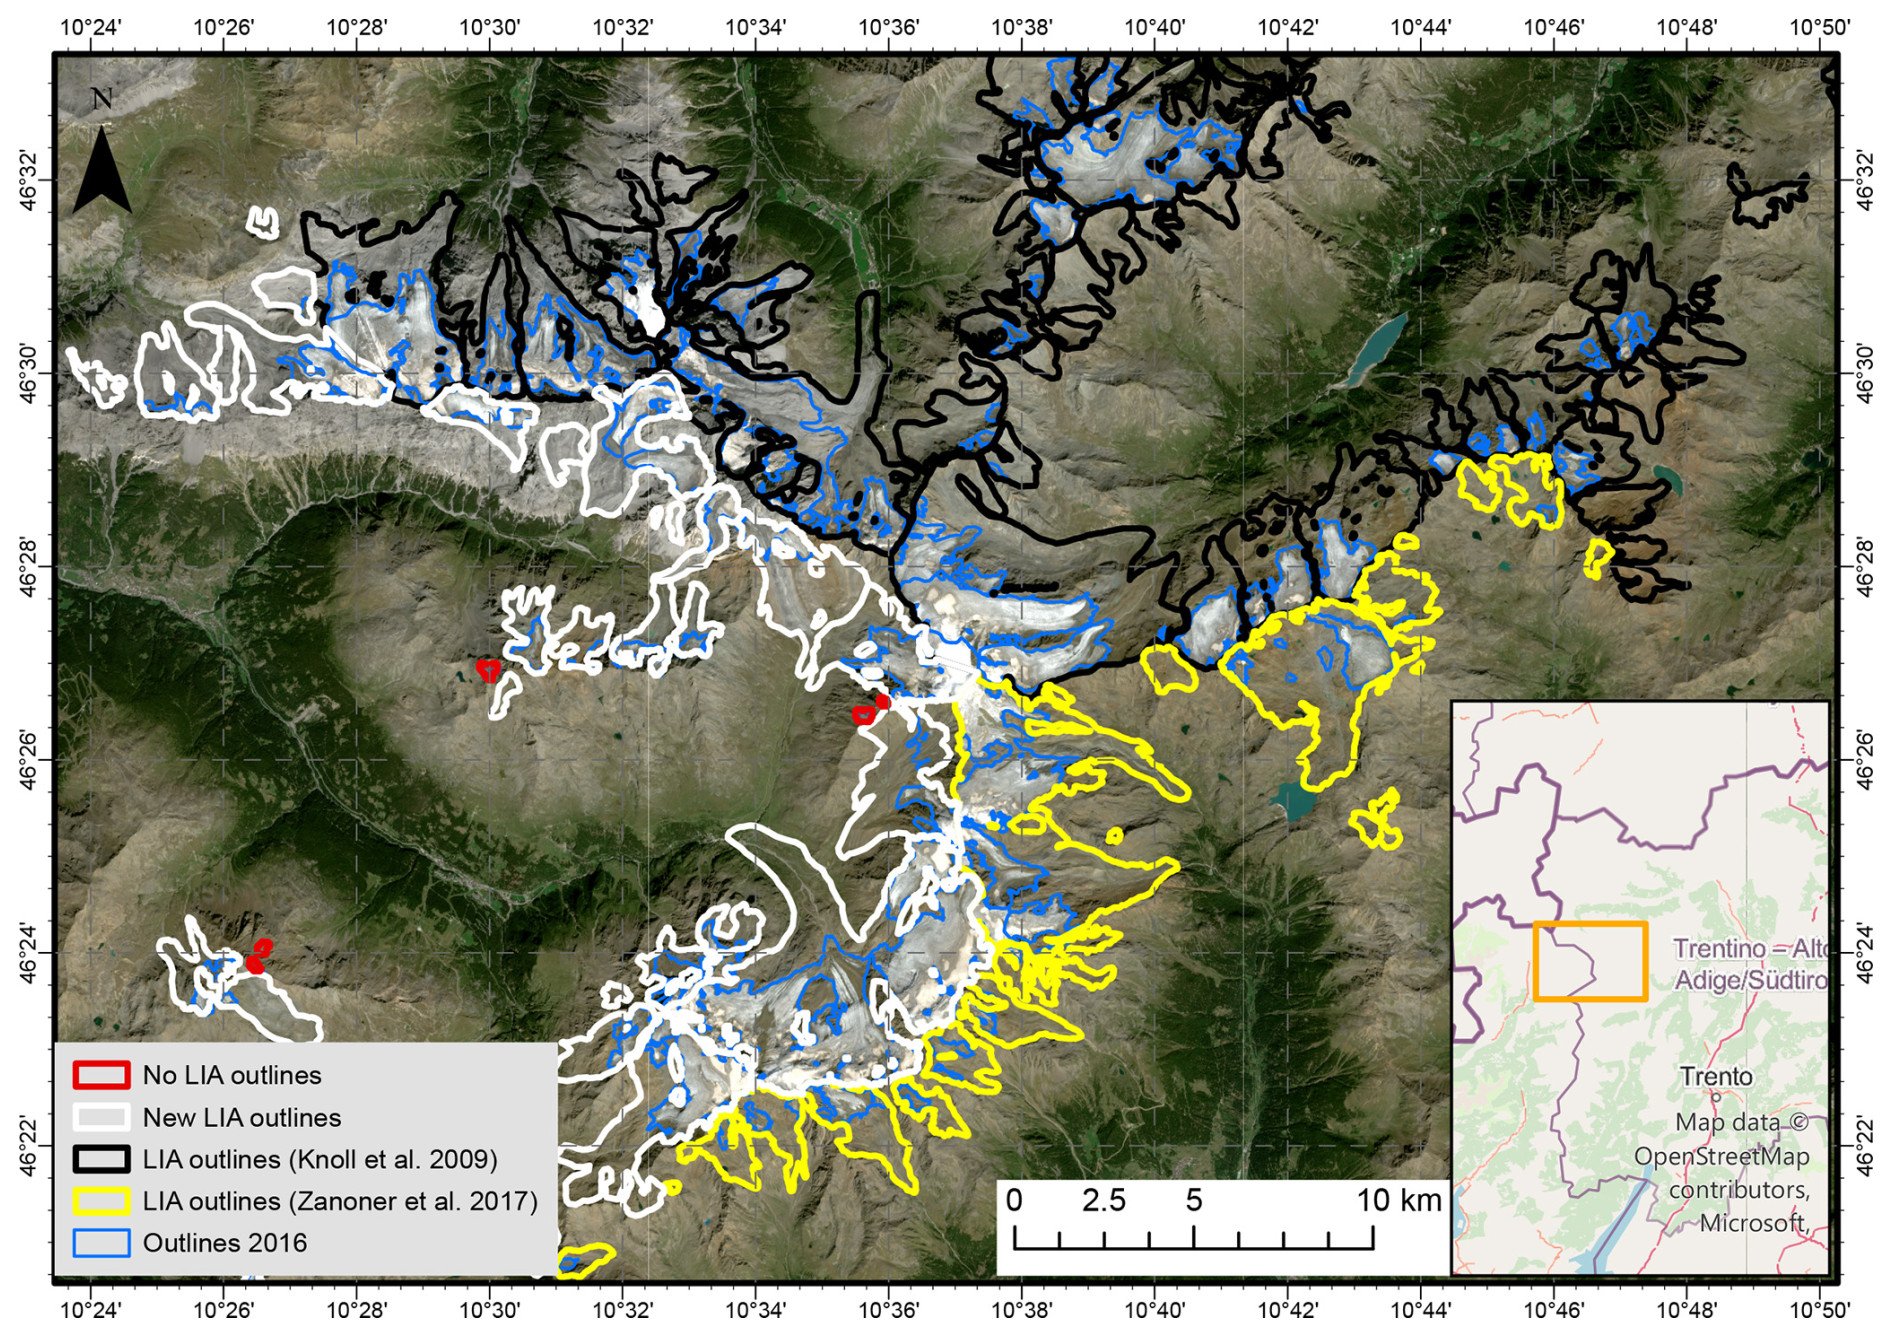
Figure 2For the example region of the Ortler Alps, we show the new (white) and existing (yellow and black) LIA outlines and glaciers smaller than 0.1 km2 without LIA outlines (red). Background image: Sentinel-2 true colour, acquired on 24 August 2022; source: Copernicus Sentinel data 2022.
The largest regions without available LIA outlines were the Italian parts of the Pennine Alps, the Western Rhaetian Alps, and the Southern Rhaetian Alps, along with the Dauphiné Alps (see Table S3 for a list of regions with previously missing LIA glacier extents). Some research was done in the Rhaetian Alps (e.g. Scotti et al., 2014; Hagg et al., 2017), but not all outlines were digitally available. For glaciers in Germany, published maps (Hirtlreiter, 1992) were combined with late-19th-century outlines (available from http://www.bayerische-gletscher.de, last access: 1 May 2024) and extended to visible moraines. In total, around 471 glaciers (in RGI v7.0) did not have an LIA equivalent, of which 218 now have one (147 glaciers at LIA). The remaining 253 unconsidered glaciers are generally small (<0.1 km2) and are not expected to change the area and volume change calculation substantially on a regional scale (they have a total area of 7.7 km2) when neglecting them. The existing and new LIA datasets combined cover 99.6 % of the 2003 glacier area in RGI v7.0 (Fig. 1). Glaciers that melted away before 2003 would lower this number by a few decimals.
2.3 GIS-based surface reconstruction
The reconstruction of glacier surfaces is based on elevation information along the LIA outlines and interpolation of the area in between. The modern elevation was extracted from the 10 m resolution Copernicus Digital Elevation Model (DEM) acquired by TanDEM-X between 2011 and 2015 (ESA, 2019) along points on the outlines with 100 m equidistance. The interpolation of the glacier surface is based on the upscaling approach presented by Reinthaler and Paul (2024) that uses the pattern of recent elevation change rates for each glacier (Hugonnet et al., 2021) to calculate glacier-specific elevation change gradients from bilinear interpolation through all points. The method calculates a scaling factor by dividing the gradient by the LIA elevation change (from interpolating outline points only using natural-neighbour interpolation). The resulting scaling factor (median per region; Fig. S1) is then applied to the gradient to shift the modern DEM to the LIA elevation of the glacier. The surface for the area between the modern and the LIA outline was interpolated using the Topo to Raster tool based on the ANUDEM method that has been optimised for point input data to derive hydrologically correct DEMs (Hutchinson, 1989). For glaciers where no relationship between elevation change and elevation was found, i.e. no elevation change gradient, only the outline points were interpolated. The output result is a 30 m resolution DEM of LIA glacier surfaces for nearly all glaciers in the Alps. From this DEM, topographic properties (e.g. median, minimum elevation, slope) were extracted for each glacier.
2.4 Volume reconstruction and change assessment
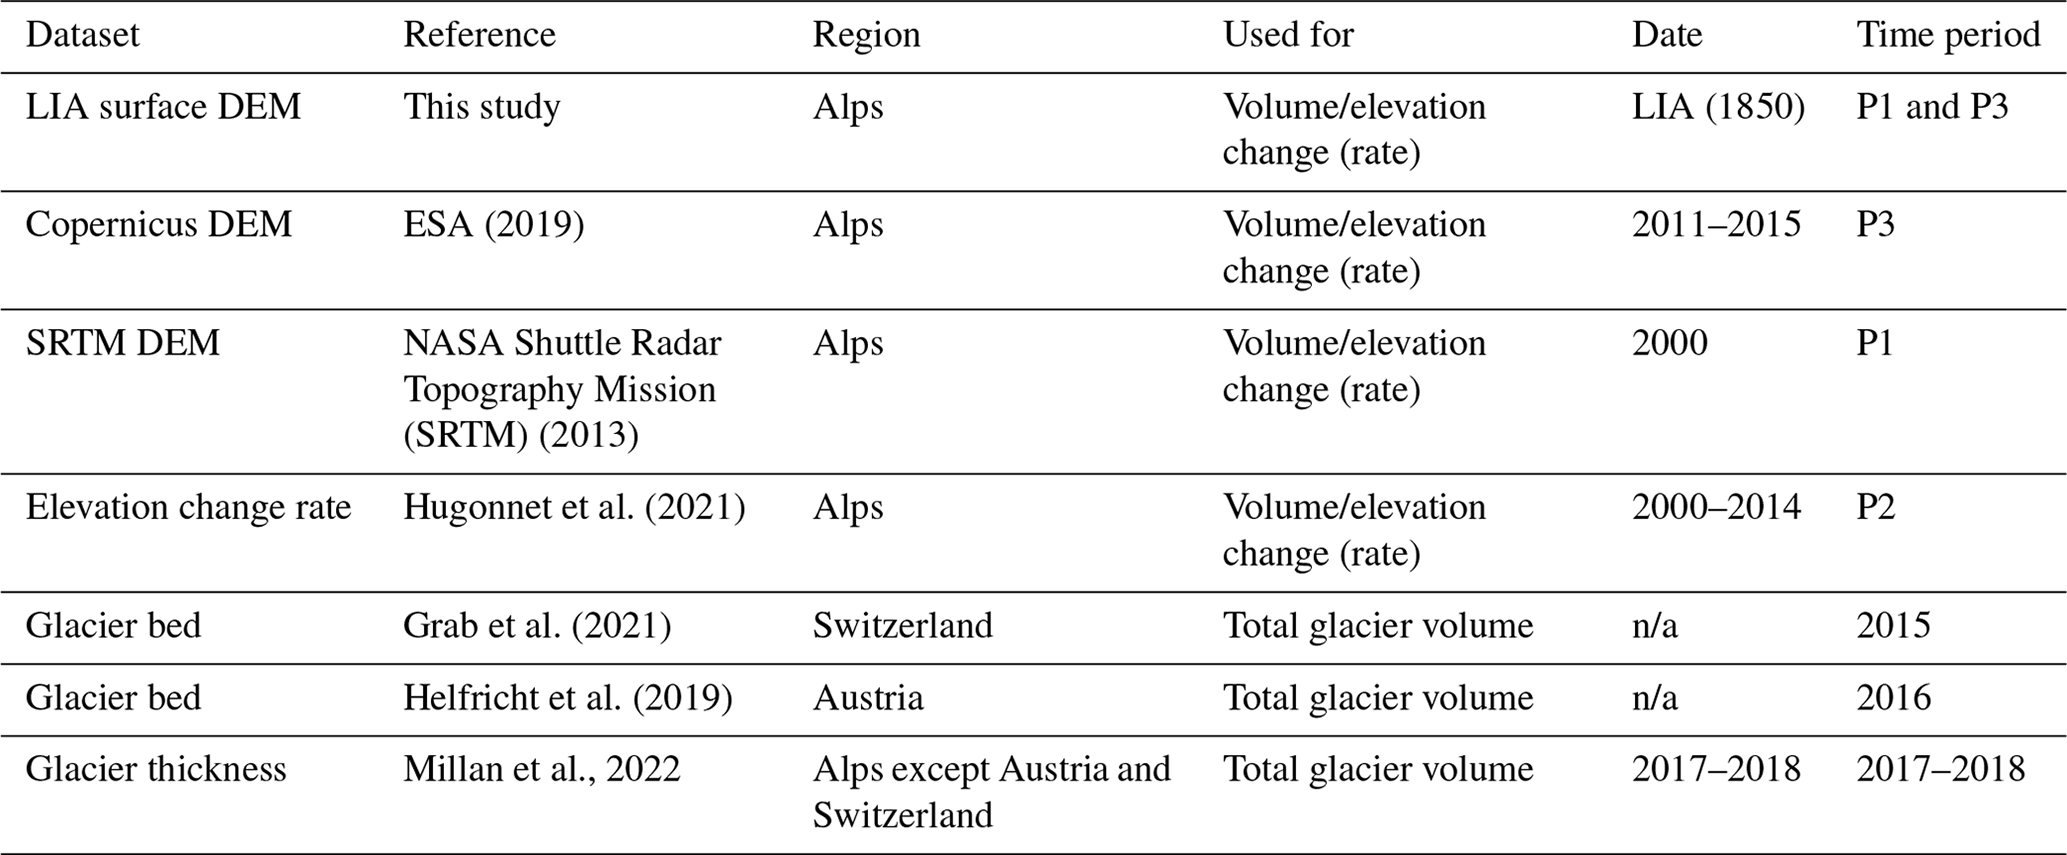
In Table 1, the raster datasets used for the volume reconstruction and change assessment are listed. Calibrated glacier bed datasets were used to calculate the contemporary total glacier volume for Switzerland (Grab et al., 2021) and Austria (Helfricht et al., 2019). For the remaining regions, the glacier bed that was inverted from modelled glacier thickness data by Millan et al. (2022) combined with the Copernicus DEM was used. All glacier bed datasets were clipped to the 2015 glacier extent. Area, elevation, and volume changes were calculated since the LIA until around the year 2000 (DEM from 2000; outlines from 2003) and around 2015 (change rates from Hugonnet et al. (2021) between 2000 and 2014; DEM and outlines from 2015/16). To simplify the presentation of changes, we refer to the time periods P1 (LIA-2000), P2 (2000-2015/16), and P3 (LIA-2015/16), even though outlines, DEMs, and change rates refer to slightly different years. Similarly, we have used the year 1850 as the date of the end of the last LIA maximum extent from which the change rates were calculated, even though individual glaciers started receding from this position at different times. For glacier changes for time periods between the LIA and 2000, results for Switzerland were compared to Mannerfelt et al. (2022). Glacier change values from more local studies (e.g. Abermann et al., 2009) were not considered due to differences in the sample and input datasets.
The void-filled NASA Shuttle Radar Topography Mission (SRTM) DEM (3 arcsec) and the Copernicus DEM were used as the year 2000 and 2015 glacier surfaces to calculate volume and elevation changes for P1 and P3, respectively (ESA, 2019; SRTM, 2013). Elevation change rates for P2 were taken from Hugonnet et al. (2021), as they are widely used and because issues with radar penetration of the SRTM and Copernicus DEMs are much more prominent over the much shorter time period (e.g. Dehecq et al., 2016). This probably resulted in positive elevation changes in several accumulation areas (Fig. S6).
Table 1Raster datasets used for the glacier change assessment. P1 refers to the time period LIA to 2000, P2 is from around 2000 to around 2015, and P3 is from the LIA to around 2015. The time periods for the glacier bed and thickness datasets refer to the time of DEM acquisition and velocity calculation, respectively. Note that “n/a” stands for non-applicable.
2.5 Uncertainty assessment
We applied a simplified approach to quantify all relevant sources of uncertainty on the total LIA volume and volume changes rather than a glacier or cell-specific uncertainty assessment as used by Martín-Español et al. (2016). The main reasons for this approach are the highly variable input datasets, the focus on regional rather than glacier-specific changes, and the use of uncertainties calculated by other studies. Glacier volume (V) can be calculated as , where A is the area and Hmean is the mean glacier thickness. As our LIA glacier volume calculation has three independent uncertainty components (for area and surface/bed elevation), we substitute Hmean by s−b, where s is the surface elevation and b is the bed elevation. This gives the three error terms ε for glacier area εA, surface elevation εs, and bed elevation εb. As they add up, the relative volume uncertainty () can then be calculated using the root sum of squares (RSS):
For the area uncertainty εA, we only have the relative uncertainty () that was taken from the study by Reinthaler and Paul (2023). They performed several multiple-digitising experiments resulting in a mean deviation of 1.9 % and a standard deviation of 5.1 %, which we are using here as the overall relative area uncertainty. However, it has to be noted that this uncertainty is area-dependent and is lower for larger glaciers and higher for smaller glaciers (Paul et al., 2013). The surface uncertainty εs is taken from a case study in the Bernese Alps by Reinthaler and Paul (2024). They obtained a mean vertical error εs of 4.6 m in comparison to a dataset derived by Paul (2010) from digitised historic contour lines with 100 m equidistance. Applied to the dataset of this study, changing the mean thickness (Hmean) of 65.9 m by this amount would lead to a relative uncertainty in the LIA surface elevation () of 7.0 %. The relative uncertainty in the bed elevation () was taken from the studies publishing the related datasets (see Supplement for details) and ranges from around ±5 % (Grab et al., 2021; Helfricht et al., 2019) to ±30 % (Millan et al., 2022). Weighted by dataset proportions, the relative uncertainty in the bed elevation for the entire dataset is ±12.7 %. The combination of these uncertainties gives and results in an overall relative volume uncertainty of 15.3 %.
Excluding the glaciers without a reconstructed extent and the missing glaciers leads to a systematic underestimation of the volume and volume change calculations; i.e. this introduces a bias. For the already existing LIA outline datasets, almost all LIA glacier extents were digitised in the related studies (independent of their size), including those that have since melted away. For the glaciers >0.1 km2 in RGI v7.0 that do not have LIA extents (total area of 7.7 km2), we extrapolated their LIA area from the mean relative change in the size class smaller than 1 to 24.9 km2 with an estimated total volume of 0.17 km3 when using the parameterisation scheme by Haeberli and Hoelzle (1995) and a constant mean ice thickness. For glaciers that have already disappeared and were not mapped, the quantification of area and volume is more challenging. According to Parkes and Marzeion (2018), disappeared glaciers globally accounted for 4.4 mm (lower bound) of sea level rise compared to 89.1 mm for all glaciers in RGI v5.0 (4.9 %). Using the lower bound (as many disappeared glaciers were mapped in the Alps) would give a total underestimation of the volume of around 13.3 km3 (4.8 %). However, as this is rather speculative and only determined here to estimate a possible upper limit of the total LIA volume of the Alps, we have not included it in the further discussion of mean and regional values.
3.1 Glacier area changes
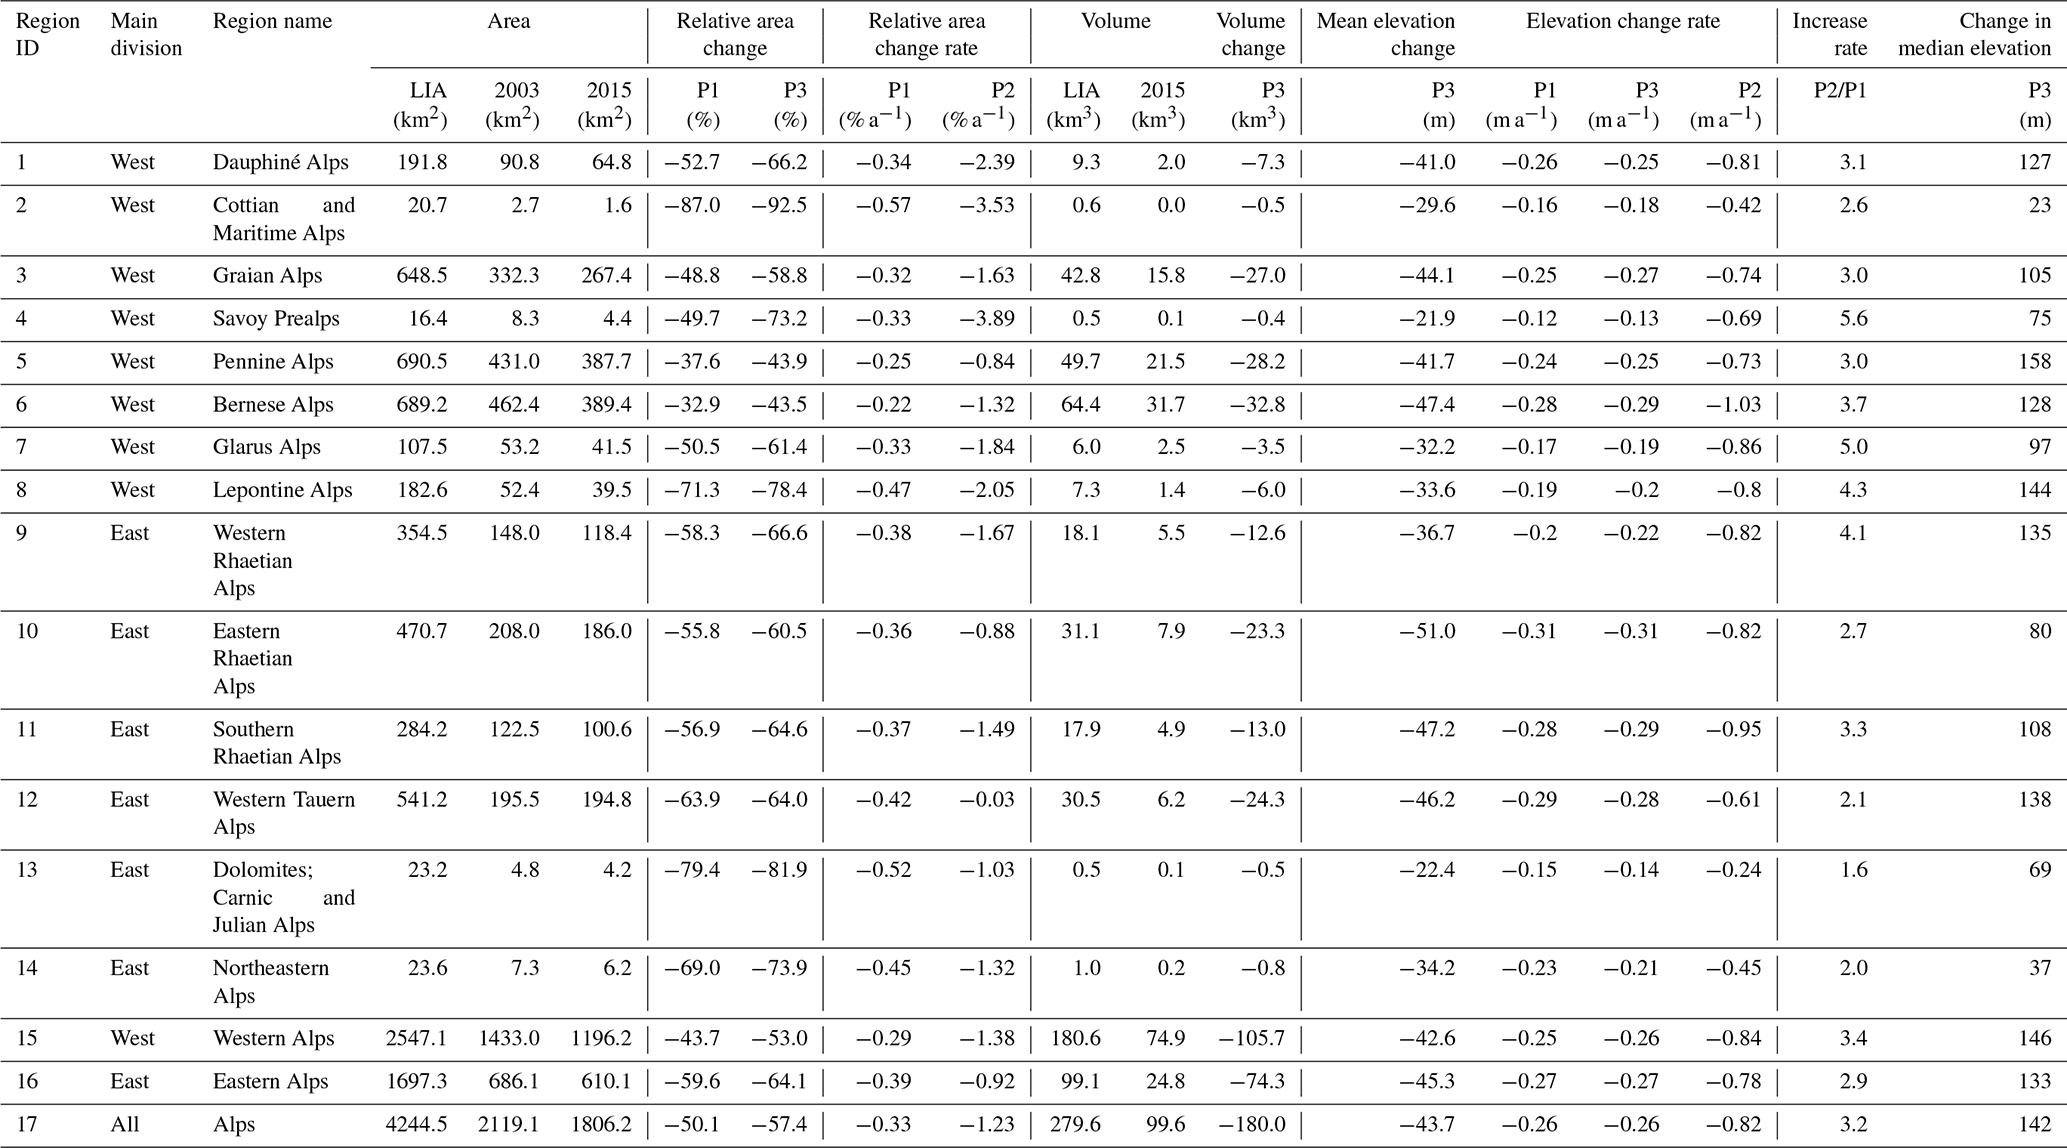
The total LIA glacier area of the Alps was estimated at 4244 ± 214 km2, of which 2119 km2 remained in 2003 (−50 % or −0.33 % a−1) and 1806 km2 remained in 2015 (−57 % or −0.35 % a−1). This is a loss of 313 km2 or 15 % (−1.2 % a−1) for P2. In the Eastern Alps (regions 9–14), the relative area loss for P3 is −64 % compared to −53 % for the Western Alps. Highest area losses are found in the Cottian Alps and Maritime Alps (Region 2) with −92.5 %; the Dolomites, Carnic Alps, and Julian Alps (Region 13) with −82 %; and the Lepontine Alps (Region 8) with −78 %. The least affected regions are the Pennine Alps (Region 5) and the Bernese Alps (Region 6), both with −44 % (see Table 2 and Fig. 3a; the changes per country are listed in Table S4). At least to some extent, the larger glaciers in regions 5 and 6 caused the smaller relative area changes, but, in absolute terms, they are higher (Fig. 3a). The size dependency is also reflected by the glacier area changes per size class, where small glaciers have higher relative area losses than large glaciers (Fig. S11). Glaciers smaller than 1 km2 (in 1850) lost 74 % of their area until 2015, whereas glaciers between 5 and 10 km2 lost 46 % and the two glaciers larger than 50 km2 lost 20 % of their area. For P2, the total glacier area shrank by 15 % (−1.22 % a−1), but many of the mostly very small glaciers (287) had a larger area in 2015 than in 2003. This is caused by differences in interpretation from different analysts, sensor resolutions (Landsat vs. Sentinel-2), and mapping conditions (snow, clouds, and shadow) rather than by growing glaciers (see Paul et al., 2020). The given 2003 to 2015 area change rate should be regarded as a lower bound, as correcting the 2015 outlines to the 2003 interpretation would have led to an even larger area loss.
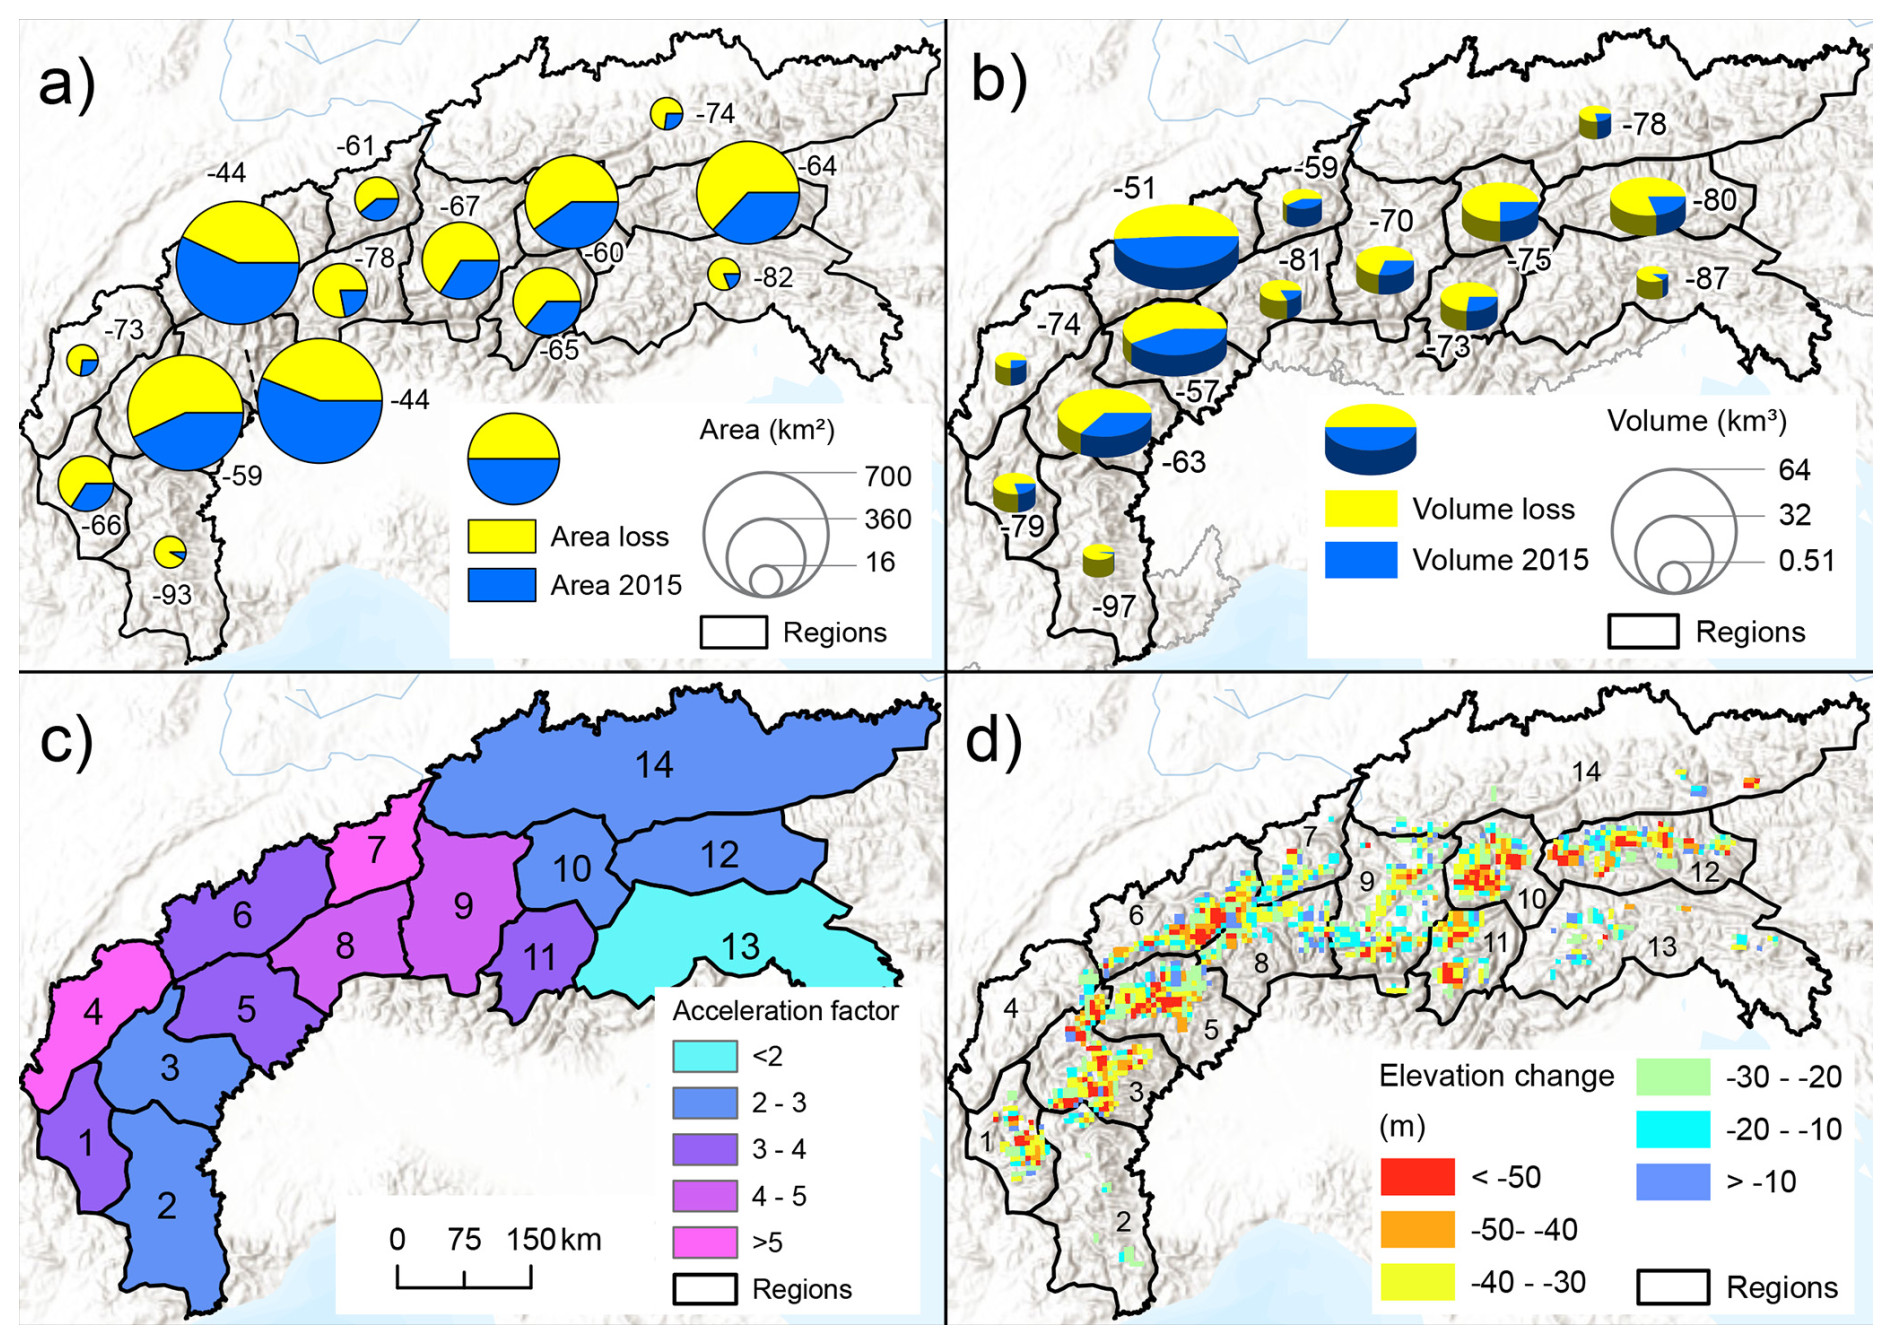
Figure 3Glacier change measures averaged per sub-region (a–c) and as a raster product (d). The panels show (a) relative area changes (%) in relation to total LIA area for P3, (b) volume changes (%) in relation to total LIA volume for P3, (c) acceleration of volume change rates for P1 compared to P2 (Hugonnet et al., 2021), and (d) rasterised (4 km) elevation changes for P3. All background images: ESRI (2023a).
3.2 Glacier elevation changes
Glaciers in the entire Alps experienced severe volume losses since the LIA (Fig. 3d). The mean elevation change for P3 over the entire Alps was −43.7 m (regionally between −21.9 and −51.0 m) without a significant difference between the Eastern and the Western Alps (−45.3 m vs. −42.6 m). The highest thinning was observed in the Eastern (Region 10; −51.0 m) and Southern (Region 11; −47.2 m) Rhaetian Alps and in the Bernese Alps (Region 6; −47.4 m). Generally, elevation changes for P3 were largest at an elevation of around 1650 m (−105 m), dominated by Region 6 (Western Alps) and decreasing towards higher elevations (Fig. 4). For P2, the maximum has shifted upward to 1750 m. The smaller elevation changes at the lowest elevations can be explained by the smaller ice thickness during the LIA and thus less ice available for melting. In the Eastern Alps, elevation changes for P3 were largest at 2250 m (−65 m) (Fig. 4b) with a shift down to 2050 m for P2. The east–west difference can be explained by glaciers in the Eastern Alps not reaching as far down as in the Western Alps. The lowering of the point of highest elevation change for P2 in the Eastern Alps could be related to artefacts, since very little glacier area is present at this elevation. At elevations between 2150 and 3950 m, elevation changes were very similar in the Eastern and Western Alps.
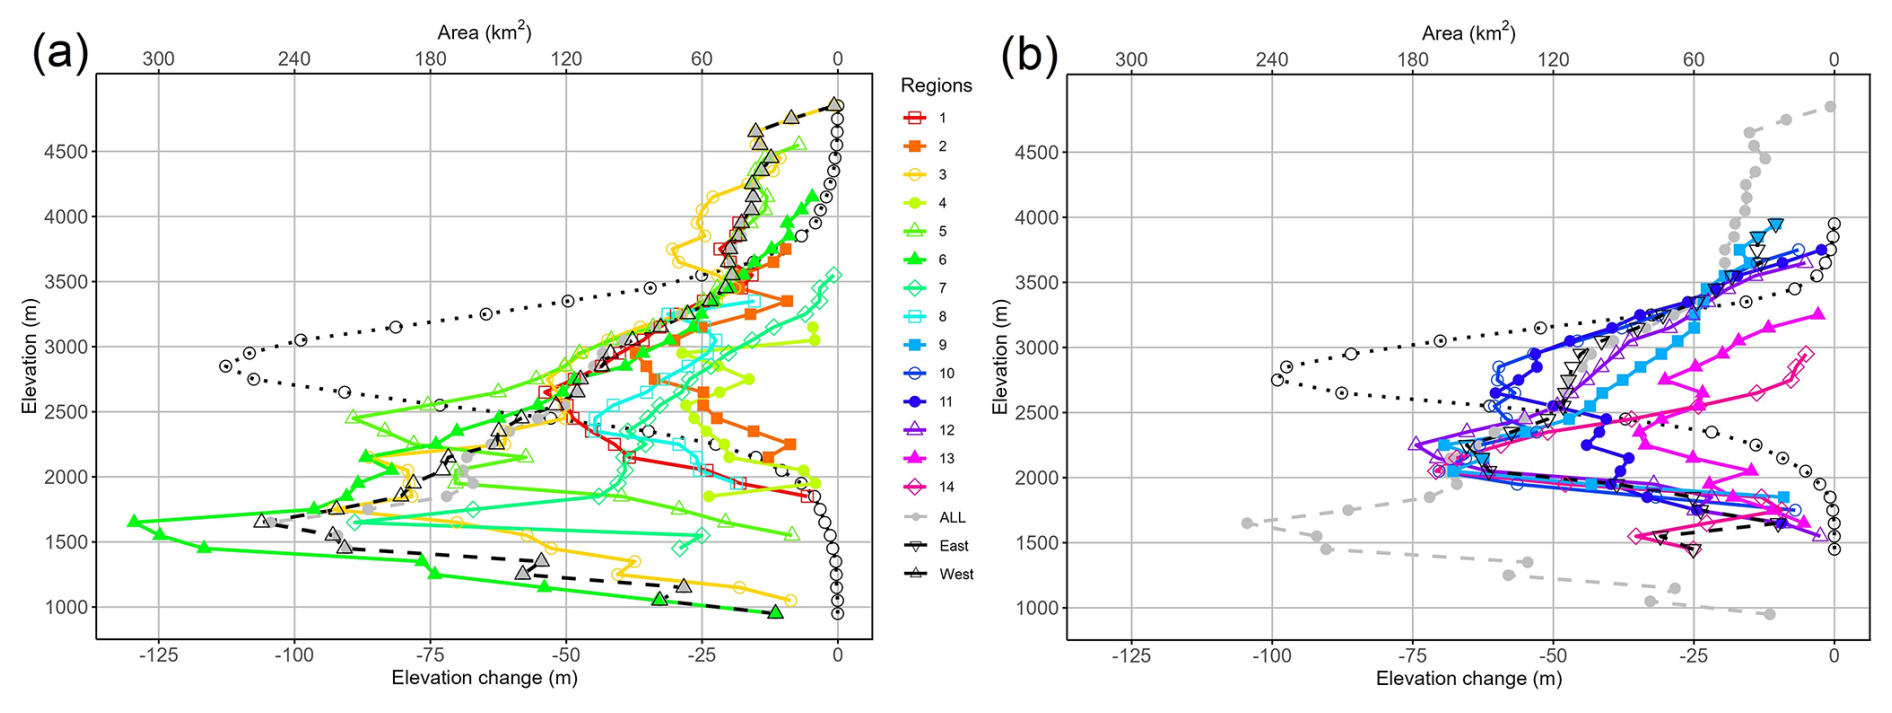
Figure 4Elevation changes for P3 with elevation per sub-region for (a) the Western Alps (sub-regions 1–8) and (b) the Eastern Alps (sub-regions 9–14). The regional means are shown in black, and the mean of the entire Alps is in grey. The dotted black line indicates the LIA area (secondary x axis) for the specific elevation band.
3.3 Glacier volume changes
The total glacier volume of the Alps at their LIA maximum extent is calculated as 280 ± 43 km3 of which 99.6 ± 17 km3 remained in 2015 (−180.0 ± 39 km3 or −64 %). Considering the uncertainty (15.3 %) and a possible underestimation due to missing glaciers of 4.8 %, the LIA volume could range from 237 to 336 km3. Thereby, the Western Alps lost 105.7 ± 23 km3 (−58.5 %), whereas the Eastern Alps lost 75.1 ± 16 km3 (−75.0 %). The total volume change was highest in regions 3, 5, 6 (Western Alps), 10, and 12 (Eastern Alps), i.e. the regions with the largest glaciers (Fig. 3a). Relative volume change was highest in regions 1 (−78.9 %), 2 (−96.6 %), 4 (−75.0 %), and 8 (−81.4 %) in the Western Alps and regions 12 (−79.7 %), 13 (−87.4 %), and 14 (−78.1 %) in the Eastern Alps, i.e. apart from Region 12, those with the smallest glaciers (Fig. 3b; values per country are listed in Table S4). Overall, volume change was highest in the altitude range between 2500 and 3000 m (Fig. S2), i.e. the elevation range with the largest area. This compensates for the lower mean elevation change at this altitude. Oblique perspective views generated from a DEM and a hillshade of it are visualised for the LIA and modern glacier surface in Figs. S15–S18.
3.4 Increase in glacier area, elevation, and volume change rates
Area, elevation, and volume change rates were much higher in P2 compared to P1. The glacier area change rate was nearly 4 times higher for P2 (−1.23 % a−1) compared to P1 (−0.33 % a−1) (Table 2, Fig. S3). Thereby, the increase in the Western Alps (4.8×) is 2 times larger compared to the Eastern Alps (2.4×). In Region 12 (Western Tauern Alps), the area change rates for P2 almost did not change, beyond mapping uncertainties. In Region 4 (Savoy Prealps), fast-melting glaciers led to the largest area change rate increase (12×), whereas Region 6 (Bernese Alps) experienced the lowest area change rate until 2000 (−0.22 % a−1) but is also showing a recent strong increase (6.1×). Overall, elevation change rates were 3.2 times higher for P2, as derived by Hugonnet et al. (2021), compared to P1. Here, the increase was a bit larger in the Western (3.4×) than in the Eastern (2.9×) Alps. Regionally, the increase was largest in regions 4 (5.6×), 7 (5.0×), 8 (4.3×), and 9 (4.1×) (Fig. 3c). The change is also dependent on the elevation, with the elevation loss rate decreasing towards higher elevations (Figs. S4 and S5). Notable is the small increase in Region 13, which could be explained by the presence of mostly small glaciers (partly only remnants left) with short response times that now experience only small changes. When calculating the change rates for P2 with the data from Sommer et al. (2020) (−0.65 m a−1) and the DEM difference between the Copernicus DEM and the SRTM DEM (−0.59 m a−1) (Figs. S6 and S7), the regional variability is similar, but the increase in the elevation change rate is lower compared to the dataset from Hugonnet et al. (2021) (−0.82 m a−1) . Further research is necessary to investigate what causes the differences among the available datasets. More detailed views of elevation change patterns before and after the year 2000 are shown in Figs. 5 and S10.
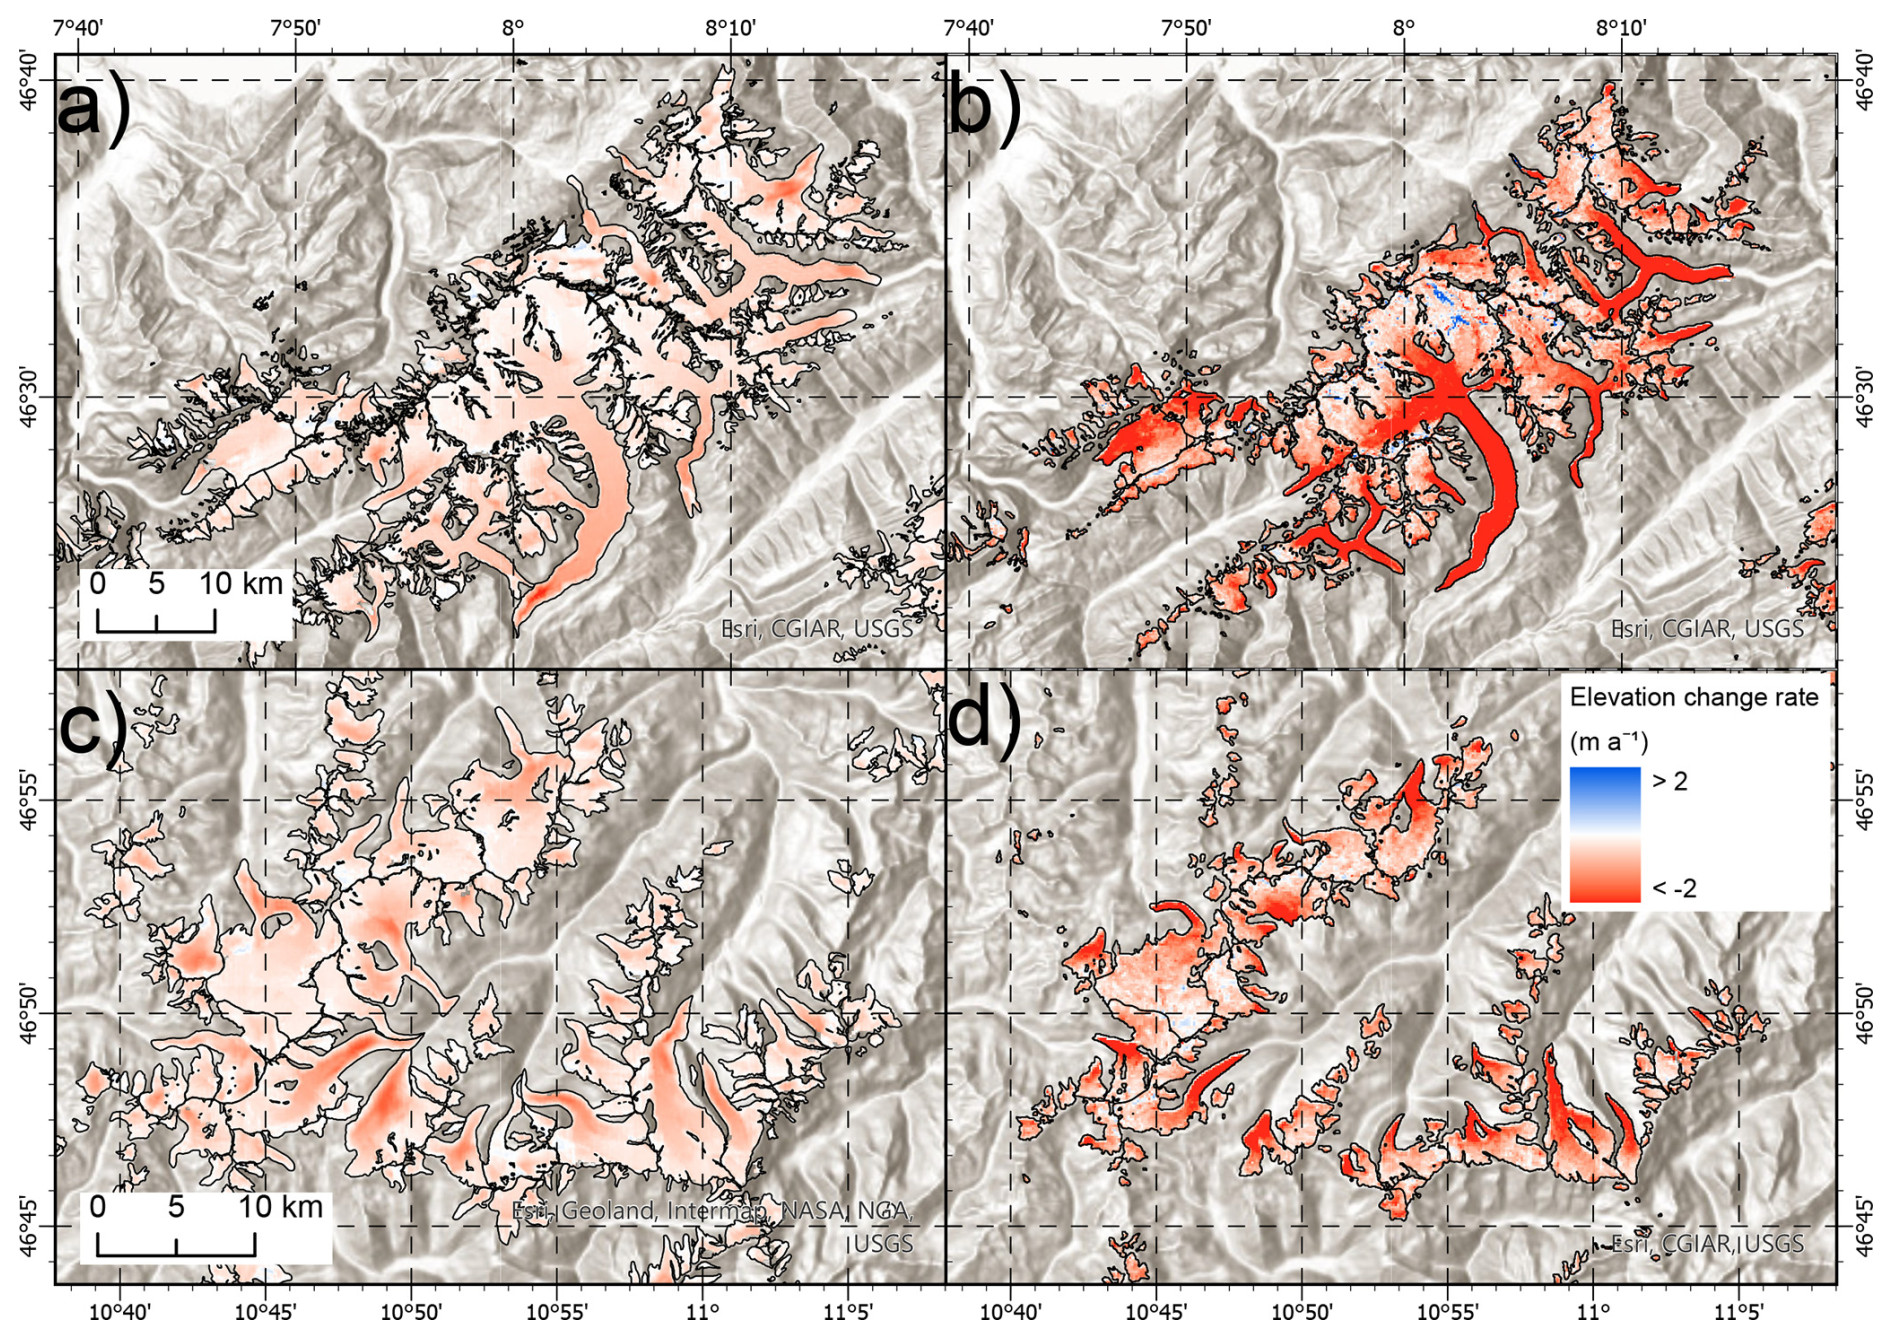
Figure 5Examples of elevation change rates between the LIA and 2000 (a and c) and 2000–2014 (b and d) after Hugonnet et al. (2021) for the Bernese Alps (a and b) and the Ötztal Alps (c and d) using the same colour legend for both periods. All background images: ESRI (2023a).
The absolute volume change rates increased by 42 % in P2 (from Hugonnet et al., 2021) compared to P1. Interestingly, while the Western Alps experienced a strong increase in the volume change (52 %), the Eastern Alps experienced only a slight increase (18 %). Nevertheless, some regions have shown a lower volume loss rate for P2 compared to P1 (regions 2, 12, 13, and 14). The volume change rates for larger river basins increased by 55 % for the Rhine and 54 % for the Rhône. The other basins have about constant volume loss rates, even slightly decreasing after 2000 (−17 %) in the southeastern Alps (Adige, Piave, Brenta, Tagliamento, and Soča). A table of country- and basin-specific area and volume changes can be found in Tables S4 and S5.
3.5 Glaciers that melted away
Temperature increase caused at least 1938 glaciers with an LIA area of 309 km2 to melt away by 2015. This is a lower-bound estimate because several glaciers that were not mapped in 2003 or 2015 were also not mapped with their LIA extent. Most of the lost glaciers can be found in regions 5 (Pennine Alps) and 6 (Bernese Alps), with 324 and 295 glaciers, respectively. The largest area loss of glaciers that completely melted away by 2015 was found in regions 3 (Graian Alps) and 9 (Western Rhaetian Alps), with 44.06 and 54.48 km2, respectively (see Fig. S14 for the glacier count and area for all regions). These regional differences have uncertainties because different studies have likely worked along a different rule set for the mapping LIA extents and thus might not have included all disappeared glaciers (this also applies to the newly digitised LIA glaciers). Nevertheless, some formerly glacierised catchments, such as large parts of the Engadin (Val Chamuera, Switzerland, and Val Spöl, Switzerland/Italy) and Samnaun Valley (Switzerland/Austria), parts of the Italian Dolomites (e.g. Val Gardena), and the German Alps (e.g. Rhine Valley), are now basically ice-free (Fig. S8).
3.6 Change in topographic parameters
The median glacier elevation, which can be used as a proxy for the balanced-budget ELA0 (Braithwaite and Raper, 2009), increased from 2898 m during the LIA to 3040 m in 2015 (+142 m). The Western Alps experienced a slightly higher increase (146 m) than the Eastern Alps (133 m). The change was largest in the Pennine Alps (Region 5; 158 m) and the Lepontine Alps (Region 8; 144 m). The smallest changes were observed in the Cottian Alps and the Maritime Alps (Region 2; 23 m) and in the northeastern Alps (Region 14; 37 m).
Table 2Glacier area, volume, and elevation changes for each region and the total areas and volumes. Also listed are long-term and recent change rates. P1 stands for the period LIA to around 2000, P2 stands for 2000 to 2015, and P3 stands for LIA to 2015. Elevation change rates for P2 are taken from Hugonnet et al. (2021).
4.1 Influence of methods on glacier volume change and comparison with other studies
Our estimate of the LIA glacier area is 229.6 km2 (5.1 %) smaller than the value estimated by Zemp et al. (2008) and thus outside our uncertainty range, even when including glaciers that have already disappeared and are not digitised. It could thus be said that the extrapolation method applied by Zemp et al. (2008) gives areas for the LIA that are slightly too large. This is reasonable when considering that the area change rates they used for extrapolation have recently strongly increased. Applying them backwards with this method would result in areas that are too large.
Comparing the reconstructed volumes with the geographic information system (GIS)-based method applied here, with values calculated with the parameterisation scheme by Haeberli and Hoelzle (1995), a large difference is visible. In total, the parameterisation scheme results in a 25 % lower total glacier volume for the LIA (224 km3 vs. 280 ± 43 km3 in our study). This is also visible on a regional scale, where the parameterisation scheme is lower in all but three regions (9, 13, and 14). Regions 3 and 6, where some of the largest glaciers in the Alps are located, had 41 % and 26 % lower volumes with the parameterisations scheme. However, for 2015, the volume differences are only 1.2 km3 (or 1.2 %) smaller with the parameterisation scheme (99.6 ± 17 vs 98.4 km3). Although this could lead to the conclusion that the GIS-based surface reconstruction overestimates LIA glacier volumes, we speculate that the approach by Haeberli and Hoelzle (1995) rather underestimates LIA volumes. For example, the mean slope of the glaciers might have increased so that mean glacier thickness decreased. It also needs to be considered that the parameterisation scheme has its limitations and works best if glacier extents are in balance with climatic conditions (which is certainly not the case in 2015). When the GIS-based surface reconstruction overestimates glacier volumes, this also applies to the calculated volume change rates, and the recent acceleration of volume loss rates found here would be even larger.
Recently published elevation and volume changes since 1931 by Mannerfelt et al. (2022) showed that, in regions 6 (Bernese Alps) and 7 (Glarus Alps), the mean elevation change (rate) was −49.2 m (−0.57 m a−1) and −46.5 m (−0.54 m a−1), respectively. In this study, we found a lower mean elevation change (rate) since the LIA, with −47.4 m (−0.28 m a−1) and −32.2 m (−0.17 m a−1) for both regions, respectively. Volume change values indicate that most of the melt occurred after 1931, with −29.4 and −3.8 km3 reported by Mannerfelt et al. (2022) compared to −32.8 and −3.5 km3 observed in this study. Higher elevation change rates were generally observed by Mannerfelt et al. (2022) at lower elevation, especially at some large glacier tongues (e.g. Great Aletsch Glacier, Unteraarglacier, and Rhône Glacier). At higher elevations, the estimate in this study gives slightly higher elevation change rate values, which could mean that our reconstructed LIA surfaces still are too high in these regions (Fig. S12).
When analysing glaciers with long observation periods, the volume changes published by GLAMOS (2022) for the period 1850–1900 (digitised from historic maps) are of some use. For most of them, volume changes are in good agreement with our estimate (e.g. Great Aletsch Glacier: −6.8 km3 (1880–2017) vs. −6.6 km3 in P3). However, outliers also exist, for example, the Lower Grindelwald Glacier. Here, GLAMOS (2022) estimated the volume change between 1861 and 2012 to be −0.44 km3, whereas our calculations resulted in −1.2 km3 and the parameterisation scheme in −0.57 km3. The Lower Grindelwald Glacier is a glacier where the bilinear elevation change gradient could not be calculated due to the low correlation between elevation and elevation change rate; thus the surface was only reconstructed using the outline points, leading to an overestimation of the LIA surface elevation, especially in the (comparably large) accumulation area. However, as the differences could be positive or negative, we would argue that, at the granularity of the regional aggregation shown in Fig. 1 and Table 2, the volume changes obtained here are likely accurate (within 5 % of the real value), but at the scale of individual glaciers, deviations might reach 50 % or more, depending on the specific characteristics of a glacier (see details in Reinthaler and Paul, 2024).
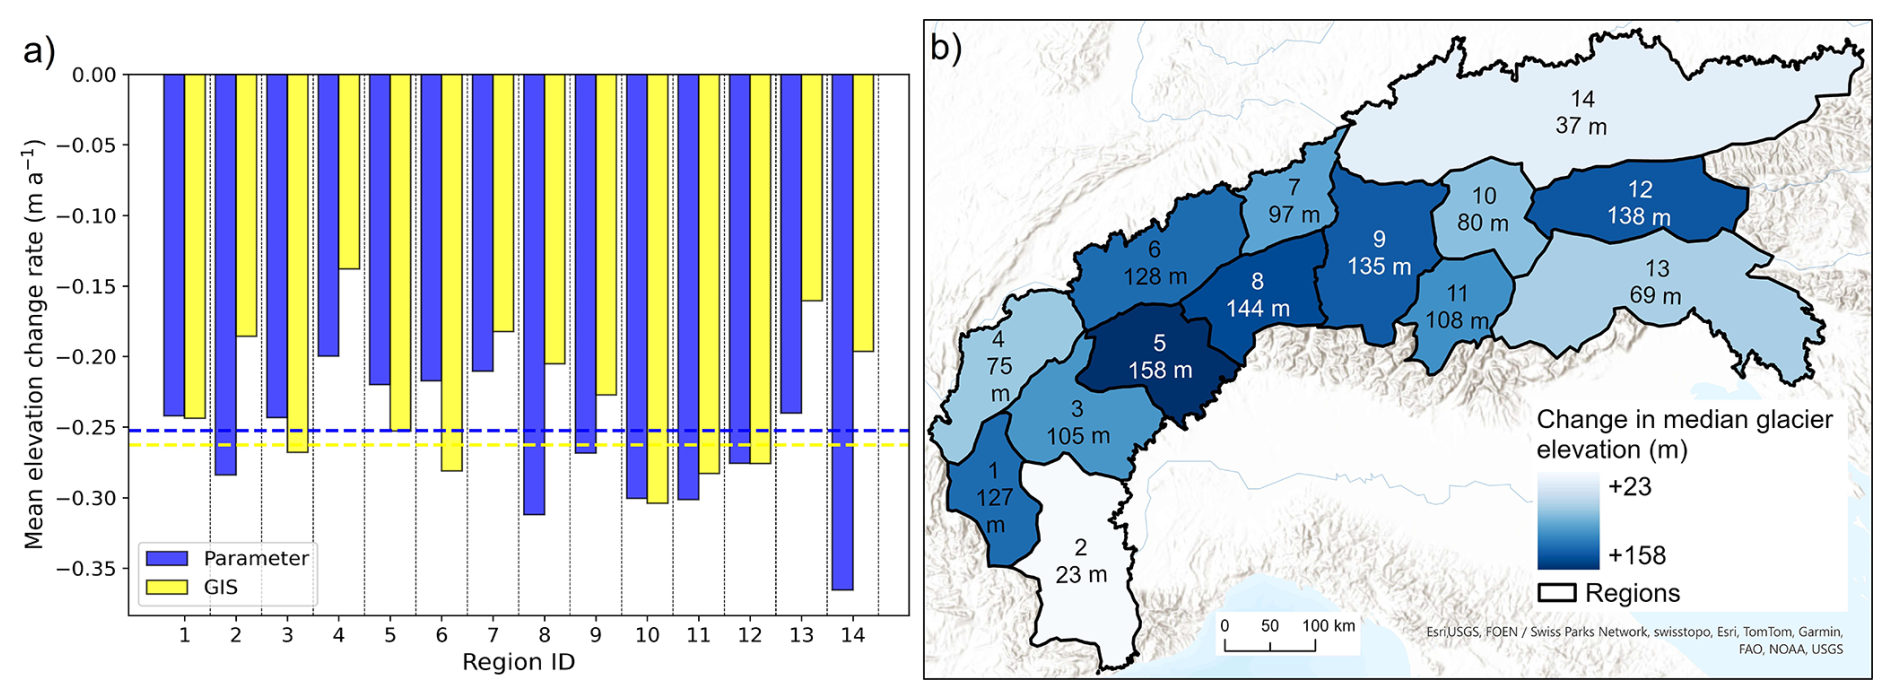
Figure 6(a) Mean elevation change rate for each region as calculated from the parameterisation (blue) and the GIS approach (yellow). Dashed lines indicate the Alpine-wide mean rate. (b) Region ID and regional lowering of the median glacier elevation between the LIA and 2015. Background image: ESRI (2023a).
The difference in the LIA volumes between the parameterisation scheme and the GIS-based reconstruction increases with increasing glacier area and decreases with mean slope (Fig. S9). Therefore, for large, flat glaciers like those found in regions 3 and 6, the difference is greatest. The parameterisation scheme uses only mean slope (derived from glacier length and elevation range) to determine mean ice thickness and might thus underestimate volumes for large and bottom-heavy glaciers such as Aletsch, Unteraar, or Gorner, where a large part of the volume is stored in the lower, flat part. Also, Lüthi et al. (2010) found that the volume at the end of the LIA was larger relative to the length of the glaciers, confirming that the parameterisation scheme by Haeberli and Hoelzle (1995) might underestimate glacier volume and thus provide a minimum estimate of LIA glacier volumes. On the other hand, the parameterisation scheme and GIS-based reconstruction gave very similar results for the thickness change rate. The mean elevation change rate for P3 using the GIS-based reconstruction is −0.26 m a−1, whereas it is −0.25 m a−1 with the parameterisation scheme. Regionally, the difference between the methods can be much larger, with the rate from the GIS-based method being 44 % higher in Region 13 (−0.24 m a−1 vs. −0.14 m a−1) and 33 % lower in Region 6 (−0.22 m a−1 vs. 0.29 m a−1) compared to the parameterisation scheme (Fig. 6). Results published by Hoelzle et al. (2003) also using the parameterisation scheme are in line with our results, giving −0.11 m w.e. a−1 for small glaciers and −0.25 m w.e. a−1 for large glaciers between 1850 and 1996 for the Swiss Alps.
4.2 Influence of timing on glacier change rates
The change rates since the LIA also depend on the date of the LIA maximum. Since this is a bit different for each glacier and only known for some of them, an approximate regional average of 1850 has been used. To assess the impact of the LIA maximum date on the calculated change rates, 20-year upper and lower bounds were applied. The area change rates would decrease from −0.35 % a−1 for 1850 to −0.31 % a−1 when using 1830 and increase to −0.40 % a−1 when starting in 1870. Similarly, the elevation change rates would decrease from −0.26 to −0.24 and −0.3 m a−1, respectively. Thereby, the impact of the LIA starting date on elevation change rates is not linear but increases towards a smaller date range (Fig. S12). More details on the impact of the date on change rates can be found in Reinthaler and Paul (2023). Finally, since P1 is much longer than P2, the rates have to be interpreted with caution. Between the LIA maximum and the year 2000, most glaciers in the Alps experienced at least two periods with glacier stagnation or even re-advances (1920s and 1980s), which results in a lower overall change rate compared to a period with a constant decrease; i.e. glaciers in the Alps have basically retreated and lost mass continuously since the year 2000.
4.3 Climatic and hydrological implications
The observed change in median elevation of 142 m would translate to a temperature increase of 0.84 to 1.43 °C, depending on the atmospheric lapse rate applied (Haeberli et al., 2019; Kuhn, 1989; Rolland, 2003; Zemp et al., 2007). This is lower than the 1.5 and 1.6 °C temperature increase determined by Begert and Frei (2018) and Auer et al. (2007) for Switzerland and the Alps, respectively. In the Eastern Alps, the median elevation change (and thus temperature increase) was slightly lower (133 m; 0.78–1.33 °C) compared to the Eastern Alps (147 m; 0.86–1.46 °C). Precipitation trends since the 19th century are inconclusive, but the Alpine region has become somewhat drier and sunnier since the 1990s (Auer et al., 2007), enhancing glacier melt. However, as glaciers are not in balance with the current climate, their ablation regions will continue shrinking, thus shifting the median elevation further upwards. For the large glaciers with flat tongues, this effect is somewhat compensated for by the ongoing surface lowering.
The impact of long-term ice loss extends beyond the immediate glacierised landscape, affecting glacier runoff and water availability. The excess melt (imbalance) of the glacier adds to the overall runoff with its usual seasonal variations. Our calculations reveal that the absolute volume loss rate in the Eastern Alps has only slightly increased in P2 (18 %), indicating that the peak of the imbalance contribution is near. Indeed, some regions in the Eastern Alps (regions 12–14) experienced a decreasing imbalance contribution, implying that peak water in those regions might have occurred already. Moreover, the rivers in the southeastern Alps flowing into the Adriatic Sea also experienced a decreasing glacier imbalance contribution, and the basins draining into the Po and Danube rivers showed stagnating volume loss rates, indicating that peak water might be reached in the near future. Similarly, Huss and Hock (2018) suggest that European basins may have already reached or be on the brink of reaching peak water. On the other hand, the volume loss rates continued to increase dramatically until at least 2015 in the Western Alps (except in Region 2). Nevertheless, according to Huss et al. (2008), the peak runoff in highly glacierised basins in the Western Alps will be reached in the coming decades.
This study has calculated the massive glacier area and volume loss in the European Alps since the end of the Little Ice Age. After the compilation of existing and manual digitising of missing LIA glacier outlines, we obtained a 99 % areal coverage. For all glaciers, the total area was 57 % smaller in 2015 (1806 km2) compared to the LIA maximum (4244 ± 214 km2). The LIA glacier surface reconstruction with a GIS-based approach resulted in an estimated volume loss of 180 ± 39 km3 or 64 % of the original 280 ± 43 km3. Despite the strongly reduced glacier area by the year 2003, the post-2000 period (P2) witnessed rates of elevation loss about 3 times higher than in the mean for the LIA to 2000 period (P1), indicating an increasing impact of climate forcing. At the same time, the runoff contribution by glacier imbalance decreased after 2000 in some regions of the Eastern Alps while still increasing in the Western Alps.
Due to the temperature increase, at least 1938 glaciers melted away, with numerous others diminished to small remnants of their previous extent. The median glacier elevation was 142 m higher in 2015 than at the end of the LIA and will further increase, as most glaciers have not yet adjusted their geometry to current climatic conditions. The resulting deglaciation of entire mountain catchments with related effects on the Alpine landscape will thus also continue. This has far-reaching implications for water resources, runoff, ecosystems, hydropower production, and tourism in the Alpine region and requires timely consideration. The dataset presented here will certainly help in assessing the impacts of climate change on mountain landscapes in further detail.
LIA surface elevations and LIA outlines can be accessed at https://doi.org/10.5281/zenodo.14336826 (Reinthaler, 2024). The LIA outlines compiled for this study will also be made available in the GLIMS glacier database (https://www.glims.org/, GLIMS, 2024).
The supplement related to this article is available online at https://doi.org/10.5194/tc-19-753-2025-supplement.
JR led the study and the writing of the paper and performed both the glacier surface reconstruction and all data analysis. FP provided ideas and comments and contributed to the writing of the paper and to the digitising of outlines.
The contact author has declared that neither of the authors has any competing interests.
Publisher’s note: Copernicus Publications remains neutral with regard to jurisdictional claims made in the text, published maps, institutional affiliations, or any other geographical representation in this paper. While Copernicus Publications makes every effort to include appropriate place names, the final responsibility lies with the authors.
The work of Johannes Reinthaler is supported by PROTECT. This project has received funding from the European Union's Horizon 2020 research and innovation programme under grant no. 869304, PROTECT contribution no. 139. The work of Frank Paul has been performed in the framework of the ESA project Glaciers_cci+ (4000127593/19/I-NB). We thank the editor and reviewers for their careful reading and constructive comments which helped to improve the clarity of the paper. We also thank Melaine Le Roy, Riccardo Scotti, and Renato R. Colucci for pointing us to unconsidered datasets which have been integrated.
This research has been supported by the EU Horizon 2020 research and innovation programme (grant no. 869304) and the European Space Agency (grant no. 4000127593/19/I-NB).
This paper was edited by Johannes J. Fürst and reviewed by Arindan Mandal and one anonymous referee.
Abermann, J., Lambrecht, A., Fischer, A., and Kuhn, M.: Quantifying changes and trends in glacier area and volume in the Austrian Ötztal Alps (1969-1997-2006), The Cryosphere, 3, 205–215, https://doi.org/10.5194/tc-3-205-2009, 2009.
Auer, I., Böhm, R., Jurkovic, A., Lipa, W., Orlik, A., Potzmann, R., Schöner, W., Ungersböck, M., Matulla, C., Briffa, K., Jones, P., Efthymiadis, D., Brunetti, M., Nanni, T., Maugeri, M., Mercalli, L., Mestre, O., Moisselin, J. M., Begert, M., Müller-Westermeier, G., Kveton, V., Bochnicek, O., Stastny, P., Lapin, M., Szalai, S., Szentimrey, T., Cegnar, T., Dolinar, M., Gajic-Capka, M., Zaninovic, K., Majstorovic, Z., and Nieplova, E.: HISTALP – Historical instrumental climatological surface time series of the Greater Alpine Region, Int. J. Climatol., 27, 17–46, https://doi.org/10.1002/joc.1377, 2007.
Begert, M. and Frei, C.: Long-term area-mean temperature series for Switzerland – Combining homogenized station data and high resolution grid data, Int. J. Climatol., 38, 2792–2807, https://doi.org/10.1002/joc.5460, 2018.
Braithwaite, R. J. and Raper, S. C. B.: Estimating equilibrium-line altitude (ELA) from glacier inventory data, Ann. Glaciol, 50, 127–132, https://doi.org/10.3189/172756410790595930, 2009.
Brunner, M. I., Farinotti, D., Zekollari, H., Huss, M., and Zappa, M.: Future shifts in extreme flow regimes in Alpine regions, Hydrol. Earth Syst. Sci., 23, 4471–4489, https://doi.org/10.5194/hess-23-4471-2019, 2019.
Cannone, N., Diolaiuti, G., Guglielmin, M., and Smiraglia, C.: Accelerating climate change impacts on alpine glacier forefield ecosystems in the European Alps, Ecol. Appl., 18, 637–648, https://doi.org/10.1890/07-1188.1, 2008.
Carrivick, J. L., James, W. H. M., Grimes, M., Sutherland, J. L., and Lorrey, A. M.: Ice thickness and volume changes across the Southern Alps, New Zealand, from the Little Ice Age to present, Sci. Rep., 10, 13392, https://doi.org/10.1038/s41598-020-70276-8, 2020.
Carrivick, J. L., Boston, C. M., Sutherland, J. L., Pearce, D., Armstrong, H., Bjørk, A., Kjeldsen, K. K., Abermann, J., Oien, R. P., Grimes, M., James, W. H. M., and Smith, M. W.: Mass Loss of Glaciers and Ice Caps Across Greenland Since the Little Ice Age, Geophys. Res. Lett., 50, e2023GL103950, https://doi.org/10.1029/2023GL103950, 2023.
Colucci, R. R. and Žebre, M.: Late Holocene evolution of glaciers in the southeastern Alps, J. Maps, 12, 289–299, https://doi.org/10.1080/17445647.2016.1203216, 2016.
Dehecq, A., Millan, R., Berthier, E., Gourmelen, N., Trouvé, E., and Vionnet, V.: Elevation Changes Inferred from TanDEM-X Data over the Mont-Blanc Area: Impact of the X-Band Interferometric Bias, IEEE J. Sel. Top. Appl., 9, 3870–3882, https://doi.org/10.1109/JSTARS.2016.2581482, 2016.
ESA: Copernicus DEM EEA-10, ESA [data set], https://doi.org/10.5270/ESA-c5d3d65, 2019.
ESRI: World Topographic Map, ESRI [data set], https://www.arcgis.com/home/item.html?id=30e5fe3149c34df1ba922e6f5bbf808f (last access: 1 May 2024), 2023a.
ESRI: World imagery vivid, ESRI [data set], https://www.arcgis.com/home/item.html?id=10df2279f9684e4a9f6a7f08febac2a9(last access: 1 May 2024), 2023b.
Fischer, M., Huss, M., and Hoelzle, M.: Surface elevation and mass changes of all Swiss glaciers 1980–2010, The Cryosphere, 9, 525–540, https://doi.org/10.5194/tc-9-525-2015, 2015.
Gardent, M.: Inventaire et retrait des glaciers dans les Alpes françaises depuis la fin du Petit Age Glaciaire, Université de Savoie, 444 pp., https://theses.hal.science/tel-01062226 (last access: 1 May 2024), 2014.
GLAMOS: Swiss Glacier Volume Change, https://doi.glamos.ch/data/volumechange/volumechange_2022_r2022.html (last access: 1 May 2024), 2022.
Glasser, N. F., Harrison, S., Jansson, K. N., Anderson, K., and Cowley, A.: Global sea-level contribution from the Patagonian Icefields since the Little Ice Age maximum, Nat. Geosci., 4, 303–307, https://doi.org/10.1038/ngeo1122, 2011.
GLIMS: Global Land Ice Measurements from Space Monitoring the World's Changing Glaciers, https://www.glims.org/, last access: 1 May 2024.
Grab, M., Mattea, E., Bauder, A., Huss, M., Rabenstein, L., Hodel, E., Linsbauer, A., Langhammer, L., Schmid, L., Church, G., Hellmann, S., Deleze, K., Schaer, P., Lathion, P., Farinotti, D., and Maurer, H.: Ice thickness distribution of all Swiss glaciers based on extended ground-penetrating radar data and glaciological modeling, J. Glaciol., 67, 1074–1092, https://doi.org/10.1017/jog.2021.55, 2021.
Grove, A. T.: The “Little Ice Age” and its geomorphological consequences in Mediterranean Europe, Climatic Change, 48, 121–136, https://doi.org/10.1023/A:1005610804390, 2001.
Haeberli, W. and Hoelzle, M.: Application of inventory data for estimating characteristics of and regional climate-change effects on mountain glaciers: a pilot study with the European Alps, Ann. Glaciol., 21, 206–212, https://doi.org/10.3189/s0260305500015834, 1995.
Haeberli, W., Hoelzle, M., Paul, F., and Zemp, M.: Integrated monitoring of mountain glacier as key indicators of global climate change: The European Alps, J. Glaciol., 46, 150–160, https://doi.org/10.3189/172756407782871512, 2007.
Haeberli, W., Oerlemans, J., and Zemp, M.: The Future of Alpine Glaciers and Beyond, Oxford Research Encyclopedia of Climate Science, https://doi.org/10.1093/acrefore/9780190228620.013.769, 2019.
Hagg, W., Scotti, R., Villa, F., Mayer, E., Heilig, A., Mayer, C., Tamm, W., and Hock, T.: Evolution of two cirque glaciers in lombardy and their relation to climatic factors (1962-2016), Geogr. Ann. A, 99, 371–386, https://doi.org/10.1080/04353676.2017.1368834, 2017.
Helfricht, K., Huss, M., Fischer, A., and Otto, J. C.: Calibrated ice thickness estimate for all glaciers in Austria, Front Earth Sci (Lausanne), 7, https://doi.org/10.3389/feart.2019.00068, 2019.
Hirtlreiter, G.: Spät- und postglaziale Gletscherschwankungen im Wettersteingebirge und seiner Umgebung, Münchner Geographische Abhandlungen B, 15, Munich, 153 pp., ISBN 392530875X, 1992.
Hoelzle, M., Haeberli, W., Dischl, M., and Peschke, W.: Secular glacier mass balances derived from cumulative glacier length changes, Global Planet. Change, 36, 295–306, https://doi.org/10.1016/S0921-8181(02)00223-0, 2003.
Hugonnet, R., McNabb, R., Berthier, E., Menounos, B., Nuth, C., Girod, L., Farinotti, D., Huss, M., Dussaillant, I., Brun, F., and Kääb, A.: Accelerated global glacier mass loss in the early twenty-first century, Nature, 592, 726–731, https://doi.org/10.1038/s41586-021-03436-z, 2021.
Huss, M. and Hock, R.: Global-scale hydrological response to future glacier mass loss, Nat. Clim. Change, 8, 135–140, https://doi.org/10.1038/s41558-017-0049-x, 2018.
Huss, M., Farinotti, D., Bauder, A., and Funk, M.: Modelling runoff from highly glacierized alpine drainage basins in a changing climate, Hydrol. Process., 22, 3888–3902, https://doi.org/10.1002/hyp.7055 Modelling, 2008.
Hutchinson, M. F.: A new procedure for gridding elevation and stream line data with automatic removal of spurious pits, J. Hydrol., 106, 211–232, https://doi.org/10.1016/0022-1694(89)90073-5, 1989.
Ivy-Ochs, S., Kerschner, H., Maisch, M., Christl, M., Kubik, P. W., and Schlüchter, C.: Latest Pleistocene and Holocene glacier variations in the European Alps, Quat. Sci. Rev., 28, 2137–2149, https://doi.org/10.1016/j.quascirev.2009.03.009, 2009.
Knoll, C., Kerschner, H., Heller, A., and Rastner, P.: A GIS-based reconstruction of little ice age glacier maximum extents for South Tyrol, Italy, T. GIS, 13, 449–463, https://doi.org/10.1111/j.1467-9671.2009.01173.x, 2009.
Kuhn, M.: The Response of the Equilibrium Line Altitude to Climate Fluctuations: Theory and Observations, in: Glacier fluctuations and climatic change, edited by: Oerlemans, J., Kluwer, Dodreach, 407–417, https://doi.org/10.1007/978-94-015-7823-3_26, 1989.
Lee, E., Carrivick, J. L., Quincey, D. J., Cook, S. J., James, W. H. M., and Brown, L. E.: Accelerated mass loss of Himalayan glaciers since the Little Ice Age, Sci. Rep., 11, 24284, https://doi.org/10.1038/s41598-021-03805-8, 2021.
Le Roy, M., Ivy-Ochs, S., Nicolussi, K., Monegato, G., Reitner, J. M., Colucci, R. R., Ribolini, A., Spagnolo, M., and Stoffel, M.: Holocene glacier variations in the Alps, in: European Glacial Landscapes – The Holocene, edited by: Palacios, D., Hughes, P. D., Jomelli, V., and Tanarro, L. M., Elsevier, 367–418, https://doi.org/10.1016/b978-0-323-99712-6.00018-0, 2024.
Lucchesi, S., Fioraso, G., Bertotto, S., and Chiarle, M.: Little Ice Age and contemporary glacier extent in the Western and South-Western Piedmont Alps (North-Western Italy), J. Maps, 10, 409–423, https://doi.org/10.1080/17445647.2014.880226, 2014.
Lüthi, M. P., Bauder, A., and Funk, M.: Volume change reconstruction of Swiss glaciers from length change data, J. Geophys. Res., 115, F04022, https://doi.org/10.1029/2010JF001695, 2010.
Maisch, M., Wipf, A., Denneler, B., Battaglia, J., and Benz, C.: Die Gletscher der Schweizer Alpen: Gletscherhochstand 1850, aktuelle Vergletscherung, Gletscherschwundszenarien, in: Schlussbericht NFP 31, second edn., Hochschulverlag ETH Zurich, Zurich, 373 pp., ISBN 3728127337, 2000.
Mannerfelt, E. S., Dehecq, A., Hugonnet, R., Hodel, E., Huss, M., Bauder, A., and Farinotti, D.: Halving of Swiss glacier volume since 1931 observed from terrestrial image photogrammetry, The Cryosphere, 16, 3249–3268, https://doi.org/10.5194/tc-16-3249-2022, 2022.
Marazzi, S.: Die Orographischen Einteilungen der Alpen und die “IVOEA”. Ein konkreter Vorschlag für die Standardisierung., in: Die Gebirgsgruppen der Alpen. Ansichten, Systematiken und Methoden zur Einteilung der Alpen, Herausgeber:innnen: Grimm, P. und Mattmüller, C. R., München, Wissenschaftliche Alpenvereinshefte, Nr. 39, 69–96, ISBN 3-937530-06-1, 2004.
Martín-Español, A., Lapazaran, J. J., Otero, J., and Navarro, F. J.: On the errors involved in ice-thickness estimates III: Error in volume, J. Glaciol., 62, 1030–1036, https://doi.org/10.1017/jog.2016.95, 2016.
Millan, R., Mouginot, J., Rabatel, A., and Morlighem, M.: Ice velocity and thickness of the world's glaciers, Nat. Geosci., 15, 124–129, https://doi.org/10.1038/s41561-021-00885-z, 2022.
NASA Shuttle Radar Topography Mission (SRTM): Shuttle Radar Topography Mission (SRTM) Global, Open Topography [data set], https://doi.org/10.5069/G9445JDF, 2013.
Nicolussi, K., Roy, M. Le, Schlüchter, C., Stoffel, M., and Wacker, L.: The glacier advance at the onset of the Little Ice Age in the Alps: New evidence from Mont Miné and Morteratsch glaciers, Holocene, 32, 624–638, https://doi.org/10.1177/09596836221088247, 2022.
Nigrelli, G., Lucchesi, S., Bertotto, S., Fioraso, G., and Chiarle, M.: Climate variability and Alpine glaciers evolution in Northwestern Italy from the Little Ice Age to the 2010s, Theor. Appl. Climatol., 122, 595–608, https://doi.org/10.1007/s00704-014-1313-x, 2015.
Nussbaumer, S. U., Steinhilber, F., Trachsel, M., Breitenmoser, P., Beer, J., Blass, A., Grosjean, M., Hafner, A., Holzhauser, H., Wanner, H., and Zumbühl, H. J.: Alpine climate during the Holocene: A comparison between records of glaciers, lake sediments and solar activity, J. Quaternary Sci., 26, 703–713, https://doi.org/10.1002/jqs.1495, 2011.
Oppikofer, T., Jaboyedoff, M., and Keusen, H. R.: Collapse at the eastern Eiger flank in the Swiss Alps, Nat. Geosci., 1, 531–535, https://doi.org/10.1038/ngeo258, 2008.
Parkes, D. and Marzeion, B.: Twentieth-century contribution to sea-level rise from uncharted glaciers, Nature, 563, 551–554, https://doi.org/10.1038/s41586-018-0687-9, 2018.
Paul, F.: The influence of changes in glacier extent and surface elevation on modeled mass balance, The Cryosphere, 4, 569–581, https://doi.org/10.5194/tc-4-569-2010, 2010.
Paul, F. and Bolch, T.: Glacier changes since the Little Ice Age. in: Geomorphology of Proglacial Systems, Geography of the Physical Environment, edited by: Heckmann, T. and Morche, D., Springer Nature, 23–42, https://doi.org/10.1007/978-3-319-94184-4_2, 2019.
Paul, F., Frey, H., and Bris, R. Le: A new glacier inventory for the European Alps from Landsat TM scenes of 2003: Challenges and results, Ann. Glaciol., 52, 144–152, https://doi.org/10.3189/172756411799096295, 2011.
Paul, F., Barrand, N. E., Baumann, S., Berthier, E., Bolch, T., Casey, K., Frey, H., Joshi, S. P., Konovalov, V., Le Bris, R., Mölg, N., Nosenko, G., Nuth, C., Pope, A., Racoviteanu, A., Rastner, P., Raup, B., Scharrer, K., Steffen, S., and Winsvold, S.: On the accuracy of glacier outlines derived from remote-sensing data, Ann. Glaciol., 54, 171–182, https://doi.org/10.3189/2013AoG63A296, 2013.
Paul, F., Rastner, P., Azzoni, R. S., Diolaiuti, G., Fugazza, D., Le Bris, R., Nemec, J., Rabatel, A., Ramusovic, M., Schwaizer, G., and Smiraglia, C.: Glacier shrinkage in the Alps continues unabated as revealed by a new glacier inventory from Sentinel-2, Earth Syst. Sci. Data, 12, 1805–1821, https://doi.org/10.5194/essd-12-1805-2020, 2020.
Raup, B. H., Racoviteanu, A., Khalsa, S. J. S., Helm, C., Armstrong, R., and Arnaud, Y.: The GLIMS geospatial glacier database: A new tool for studying glacier change, Global Planet. Change, 56, 101–110, https://doi.org/10.1016/j.gloplacha.2006.07.018, 2007.
Reinthaler, J. and Paul, F.: Using a Web Map Service to map Little Ice Age glacier extents at regional scales, Ann. Glaciol., 64, 206–224, https://doi.org/10.1017/aog.2023.39, 2023.
Reinthaler, J.: Reconstructed glacier area and volume changes in the European Alps since the Little Ice Age, Zenodo [data set], https://doi.org/10.5281/zenodo.14336826, 2024.
Reinthaler, J. and Paul, F.: Assessment of methods for reconstructing Little Ice Age glacier surfaces on the examples of Novaya Zemlya and the Swiss Alps, Geomorphology, 461, 109321, https://doi.org/10.1016/j.geomorph.2024.109321, 2024.
RGI Consortium: Randolph Glacier Inventory – A Dataset of Global Glacier Outlines, Version 7.0, RGI Consortium [data set], https://doi.org/10.5067/f6jmovy5navz, 2023.
Rolland, C.: Spatial and seasonal variations of air temperature lapse rates in alpine regions, J. Climate, 16, 1032–1046, https://doi.org/10.1175/1520-0442(2003)016<1032:SASVOA>2.0.CO;2, 2003.
Scotti, R. and Brardinoni, F.: Evaluating millennial to contemporary time scales of glacier change in Val Viola, Central Italian Alps, Geogr. Ann. A, 100, 319–339, https://doi.org/10.1080/04353676.2018.1491312, 2018.
Scotti, R., Brardinoni, F., and Crosta, G. B.: Post-LIA glacier changes along a latitudinal transect in the Central Italian Alps, The Cryosphere, 8, 2235–2252, https://doi.org/10.5194/tc-8-2235-2014, 2014.
Solomina, O. N., Bradley, R. S., Hodgson, D. A., Ivy-Ochs, S., Jomelli, V., Mackintosh, A. N., Nesje, A., Owen, L. A., Wanner, H., Wiles, G. C., and Young, N. E.: Holocene glacier fluctuations, Quaternary Sci. Rev., 111, 9–34, https://doi.org/10.1016/j.quascirev.2014.11.018, 2015.
Sommer, C., Malz, P., Seehaus, T. C., Lippl, S., Zemp, M., and Braun, M. H.: Rapid glacier retreat and downwasting throughout the European Alps in the early 21st century, Nat. Commun., 11, 3209, https://doi.org/10.1038/s41467-020-16818-0, 2020.
Vivian, R.: Les glacier des Alpes occidentales, Thése, Université Joseph Fourier-Grenoble, éd. Imprimerie Allier, Grenoble, 513 pp., 1975.
Zanoner, T., Carton, A., Seppi, R., Carturan, L., Baroni, C., Salvatore, M. C., and Zumiani, M.: Little Ice Age mapping as a tool for identifying hazard in the paraglacial environment: The case study of Trentino (Eastern Italian Alps), Geomorphology, 295, 551–562, https://doi.org/10.1016/j.geomorph.2017.08.014, 2017.
Zemp, M., Hoelzle, M., and Haeberli, W.: Distributed modelling of the regional climatic equilibrium line altitude of glaciers in the European Alps, Global Planet. Change, 56, 83–100, https://doi.org/10.1016/j.gloplacha.2006.07.002, 2007.
Zemp, M., Paul, F., Hoelzle, M., and Haeberli, W.: Glacier Fluctuations in the European Alps 1850–2000: an overview and spatio-temporal analysis of available data, in: Darkening Peaks: Glacier Retreat, Science, and Society, edited by: Orlove, B., Wiegandt, E., and Luckman, B., University of California Press, Berkeley, 152–167, ISBN 978-0-520-25305-6, 2008.
Zumbühl, H. J. and Holzhauser, H.: Alpengletscher in der Kleinen Eiszeit, Die Alpen, Sonderheft zum 125 jährigen Jubiläum des SAC, 65, 129–322, 1988.
Zumbühl, H. J. and Nussbaumer, S. U.: Little ice age glacier history of the central and western Alps from pictorial documents, Geographical Research Letters, 44, 115–136, https://doi.org/10.18172/cig.3363, 2018.