the Creative Commons Attribution 4.0 License.
the Creative Commons Attribution 4.0 License.
 | 13 Feb 2025
Amundsen Sea Embayment accumulation variability measured with global navigation satellite system interferometric reflectometry
Andrew O. Hoffman
Michelle L. Maclennan
Jan Lenaerts
Kristine M. Larson
Knut Christianson
Understanding how water vapor is transported to Antarctica and leads to snowfall is crucial for improving ice-sheet mass balance projections and interpreting ice-core records. Global navigation satellite system (GNSS) receivers distributed across Antarctica to monitor ice velocity and solid Earth motion can be used to understand accumulation, ablation, and snow redistribution at the ice-sheet surface on sub-daily timescales. Here, we present a forward model for reflector height change between the GNSS antenna phase center and the snow surface and an inverse framework to determine accumulation rate and near-surface firn densification from the reflector height time series. We use this model to determine accumulation at three long-term GNSS sites located in the Amundsen Sea Embayment (ASE) and at an array of GNSS receivers deployed in the 2007–2008 and 2008–2009 austral summers. From the GNSS interferometric reflectometry (IR) accumulation time series, we find that extreme precipitation (i.e., the 90th percentile of accumulation events) dominates total precipitation and that extreme event frequency varies seasonally. We use our GNSS-IR accumulation time series together with reanalysis products to characterize the atmospheric conditions that promote extreme snowfall in the ASE. The blocking pressure systems that promote extreme accumulation on Thwaites Glacier are facilitated by tropical teleconnections, specifically convection that promotes Rossby wave trains from the western Pacific, Indian, and Atlantic oceans to the Amundsen and Bellingshausen seas.
- Article
(14559 KB) - Full-text XML
-
Supplement
(11059 KB) - BibTeX
- EndNote


The mass balance of ice sheets and glaciers is defined as the difference between ice discharge, surface mass balance (the sum of surface melt, sublimation, and snow accumulation), and grounded ice basal melt or accretion. Currently, the Antarctic Ice Sheet is losing mass at an accelerating pace due to changes primarily in West Antarctic ice discharge driven by oceanic warming and submarine ice-shelf melt (Velicogna et al., 2020; Smith et al., 2020). These changes in ice discharge have partially been offset by an increase in surface mass balance over much of the Antarctic Ice Sheet since the early 19th century due to a net increase in vapor moisture transport to the poles (Kaspari et al., 2004; Frezzotti et al., 2013; Thomas et al., 2015; Medley and Thomas, 2019). The positive trend in surface mass balance is estimated to have mitigated sea-level rise by up to ∼10 mm in the 20th century (Medley and Thomas, 2019).
Positive trends in surface accumulation may be particularly important in the Amundsen Sea Embayment (ASE), where enhanced accumulation may have the potential to mitigate ASE glacier mass loss due to ocean melt (Davison et al., 2023). Observations from shallow ice cores (e.g., Steig et al., 2005) and climate reanalysis (e.g., Davison et al., 2023) suggest that accumulation has increased in the Amundsen Sea Embayment over the last century and that accumulation is strongly linked to spatial patterns of geopotential height in the Amundsen and Bellingshausen Sea sectors (Thomas et al., 2015). Regional variations in geopotential height have been linked to interactions between strong westerly circumpolar flow and ASE topography (Baines and Fraedrich, 1989; Walsh et al., 2000; Lachlan‐Cope et al., 2001) and global tropical teleconnections (Connolley, 1997; Renwick, 2002; Lachlan-Cope and Connolley, 2006; Ding et al., 2012; Turner et al., 2013; Li et al., 2014, 2015, 2021). These interactions combine to form a persistent low-pressure system known as the Amundsen Sea Low (ASL; Raphael, 2004; Turner et al., 2013). The ASL is one of three low-pressure systems distributed along the circumpolar trough (Connolley, 1997; Lachlan‐Cope et al., 2001; Raphael, 2004) and exhibits a seasonal cycle in location and depth moving between the Amundsen and Bellingshausen Sea sectors between austral summer and austral winter (Fogt et al., 2012; Hosking et al., 2013; Turner et al., 2013). Changes in the position of this low-pressure system drive seasonal changes in moisture transport to the Antarctic interior in climate reanalysis (Hosking et al., 2013; Maclennan and Lenaerts, 2021). On average, precipitation in West Antarctica increases in the austral winter when the ASL depth is greatest and the center of the low shifts southeastward closer to the ASE. Precipitation decreases in the summer when the low is weakest and shifts northwestward to the Amundsen–Ross sector (Fogt et al., 2012; Hosking et al., 2013; Turner et al., 2013).
The Amundsen and Bellingshausen Sea sectors are also characterized by large interannual geopotential height variability (Connolley, 1997; Renwick, 2002; Lachlan-Cope and Connolley, 2006; Ding et al., 2012; Turner et al., 2013). The same mechanisms that combine to form the ASL also promote long-lived high-pressure anticyclonic blocking systems (Sinclair, 1996; Renwick, 1998, 2005; Emanuelsson et al., 2018). Interannual blocking variability has been linked to marine air intrusion and accumulation variability recorded in the Roosevelt Island ice core, West Antarctica (Emanuelsson et al., 2018); however, these processes are less well studied in the Amundsen Sea Embayment, where coastal weather station observations of accumulation are limited (Lazzara et al., 2012). Deep and shallow ice cores in the ASE region, though well suited to characterize West Antarctic accumulation variability on interannual and longer timescales (Kaspari et al., 2004), cannot resolve individual snowfall events. Single snowfall events do not directly impact the long-term behavior of polar ice sheets, because each event represents only a small fraction of the integrated decadal to millennial surface mass balance forcing required to convey surface mass balance anomalies to the coast and drive marine outlet glacier advance or retreat (Christian et al., 2020; Robel et al., 2018). Single snowfall events can be used to understand and link snowfall to moisture transport mechanisms that represent the characteristic state of the atmosphere recorded in the snow deposited at the surface. By diagnosing composites of the atmosphere during precipitation events, we aim to increase understanding of the atmospheric dynamics that promote accumulation – particularly extreme accumulation (90th percentile of events) that represent the majority of accumulation in the ASE (Turner et al., 2019; Maclennan and Lenaerts, 2021; Chittella et al., 2022).
GNSS interferometric reflectometry (GNSS-IR) offers an exciting method to determine accumulation rates with high temporal resolution in remote and undersampled regions of the West Antarctic interior. GNSS positioning uses coded signals transmitted by GNSS satellites at different L-band frequencies to determine three-dimensional position estimates of GNSS receiver antenna locations. The timing of received GNSS signals provides range information important for establishing antenna positions, but it is distorted by electromagnetic wave interactions with the neutral atmosphere, the ionosphere, and reflections off nearby surfaces before the wave reaches the antenna (i.e., multipath reflections).
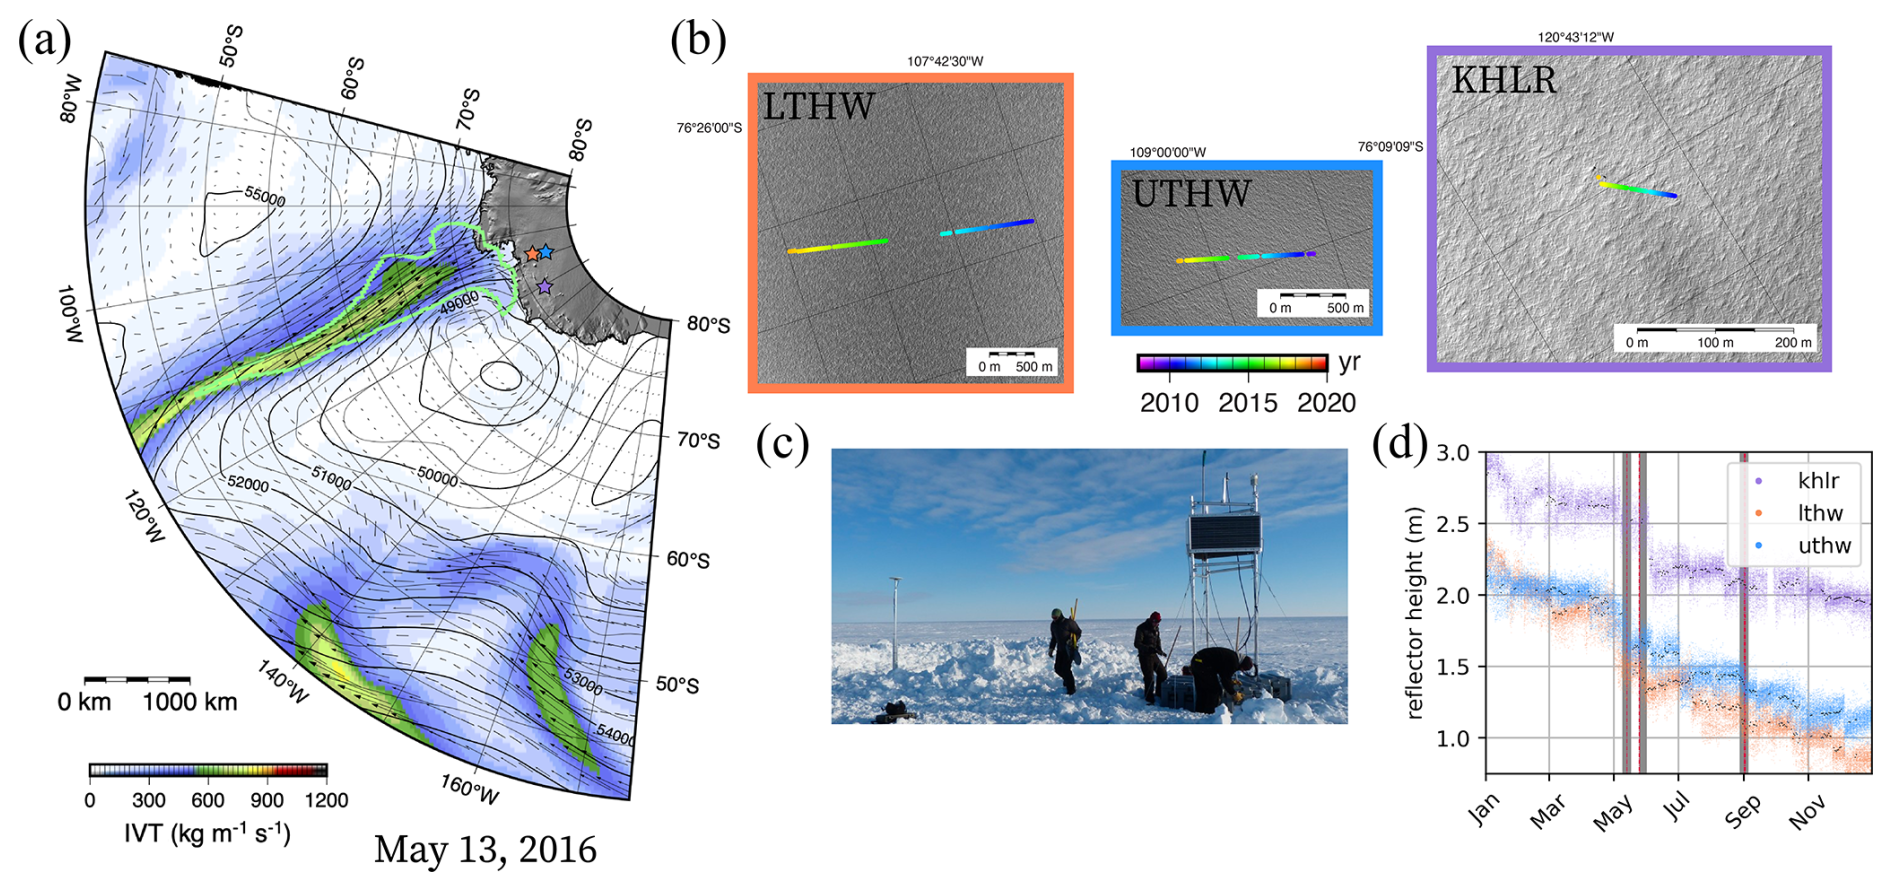
Figure 1(a) Overview map of long-term GNSS-IR sites (LTHW in orange, KHLR in purple, and UTHW in blue), integrated vapor transport calculated between 300 and 900 hPa pressure levels, the 500 hPa geopotential height (contours), and an atmospheric river event detected on 13 May 2016. (b) Subpanels show the receiver position as a function of time. (c) Photo of the LTHW receiver and power system (credit: POLENET team). (d) Reflector height change in 2016 for all three long-term GNSS sites. Station-matched colors demark reflector heights observed at each station, and black points are the daily median used as input to the accumulation inverse algorithm. Gray bars indicate the timing of atmospheric river events that made landfall in the ASE identified using methods described in the Appendix corroborated by the catalog developed by Wille et al. (2021).
The distorted travel times associated with multipath reflections have conventionally been treated as noise and informed early GNSS antenna gain pattern designs, which minimized multipath signals at high satellite elevation angles. Larson et al. (2009) established that multipath signals embedded in the signal-to-noise ratio (SNR) of GNSS positioning data contain useful information about the reflection surface geometry (i.e., the height of the antenna above the surface) and the dielectric properties of the surface. Many subsequent studies have shown that the distance between the reflection interface and the antenna phase center can be calculated and monitored over time from the SNR recorded at the GNSS antenna in order to understand local surface evolution (Larson et al., 2015; Siegfried et al., 2017; Shean et al., 2017; Larson et al., 2020; Pinat et al., 2021).
Despite the proven effectiveness of GNSS-IR methods to measure surface height and reflector amplitude changes associated with snow deposition, only two studies (Larson et al., 2015; Siegfried et al., 2017) have used GNSS-IR to link surface height changes to multi-year precipitation and climate variability on ice sheets. This is largely due to the logistical challenges associated with supporting multi-year on-ice GNSS receiver networks, where stations must be raised regularly (every 1–3 years) to prevent burial due to snow accumulation. Over the past 15 years, GNSS receivers located in the ASE (Figs. 1 and 2) have been maintained to support several different projects investigating ice flow (e.g., Hoffman et al., 2020) and the interaction between glacial isostatic adjustment and solid Earth deformation (e.g., Barletta et al., 2018). Through the application of GNSS-IR, more than 10 years of nearly continuous GNSS operation also offers a unique opportunity to explore atmospheric dynamics that promote and control precipitation and accumulation in the ASE.
We use GNSS-IR SNR data from three long-term sites deployed and maintained in the Amundsen Sea Embayment, as well as GNSS campaign arrays that were deployed across Thwaites Glacier as part of geophysical surveys in the austral summers of 2007–2008 and 2008–2009 to link extreme precipitation events and synoptic-scale atmospheric rivers observed in reanalysis to highly localized accumulation records at individual GNSS sites (Figs. 1, 2). Using our unique GNSS-IR records, we quantify the seasonal cycle of precipitation and elevation dependence of accumulation in the ASE. We also verify that extreme precipitation events supply the majority of the total accumulation in the ASE. We then use the GNSS-IR records of extreme accumulation events to composite near-surface temperature, atmospheric pressure, and integrated vapor moisture transport simulated in reanalysis in order to better understand the drivers of extreme precipitation in the ASE. We use these composites to understand the synoptic conditions and global teleconnections that promote extreme snowfall in the ASE. Our results suggest that extreme snowfall events observed in the ASE are coincident with blocking conditions in the Bellingshausen Sea.
Here we report on multi-year deployments for three on-ice GNSS sites in West Antarctica's Amundsen Sea Embayment: two along the trunk of Thwaites Glacier (upper Thwaites, UTHW, and lower Thwaites, LTHW) and one on the nearby Kohler Glacier (KHLR). The UTHW site was deployed in the 2008–2009 austral summer. The LTHW and KHLR sites were deployed in the 2009–2010 austral summer. Although there are intermittent data gaps due to power loss, all three sites have been regularly maintained and remain active today. In addition to the long-term sites, we also apply GNSS-IR to GNSS sites that were deployed on Thwaites Glacier during the 2007–2008 and 2009–2009 austral summers. During the 2007–2008 and 2008–2009 austral summers, 17 sites were deployed along two flowlines, which aimed to measure short-timescale (minutes to days) ice-velocity fluctuations from the coast towards the West Antarctic Ice Sheet central ice divide and Bentley Subglacial Trough. When possible, GNSS monuments installed in the 2007–2008 austral summer were reoccupied in the 2008–2009 austral summer; if a monument could not be found, the GNSS site was deployed at the position of the 2007–2008 monument as calculated from satellite ice-velocity data (Joughin et al., 2009). The 2007–2008 array was operational in January 2008. The 2008–2009 array was operational in December 2008 and January 2009. All GNSS site locations are plotted in Fig. 2a.
Reflector height time series were calculated using the workflow described by Roesler and Larson (2018), which is based on the earlier work of Larson et al. (2015). Daily solutions for receiver position were calculated kinematically relative to the sites of nearby base stations (TF01 and WAIS for the campaign sites; permanent GNSS sites at Backer Island and Howard Island for the long-term sites) using differential carrier-phase positioning estimates from the TRACK software (Chen, 1998; King, 2004; Hoffman et al., 2020). Daily averaged position solutions for the base station sites were determined in GAMIT/GLOBK following standard GNSS processing methods for glaciological applications (King, 2004). The reflector height was calculated from the signal-to-noise ratio (SNR) data assuming a planar reflector surface geometry. After direct signal effects are removed, the SNR data for a single satellite and receiver can be modeled as
where A is the amplitude, which depends on the transmitted GNSS signal power, the satellite elevation angle above the horizon, the surface dielectric constant, and its roughness; HR is the reflector height; λ is the wavelength of the transmitted GNSS signal; and ϕ is a phase constant. This representation means a periodogram can be used to estimate HR from the dominant frequency:
To resolve this frequency, the antenna must be at least two wavelengths above the surface (0.4–0.5 m, for GPS L1 and L2 frequencies). The elevation and azimuth angles were calculated from the broadcast GPS ephemeris. The dominant SNR frequency was determined using a Lomb–Scargle periodogram. On average, this results in ∼70 estimates of SNR frequency every day, which can be related to reflector height using Eq. (2).
We eliminated weak signals for each time increment that are 0.3 m from the median reflector height for that time increment. Longer sample intervals for calculating reflector heights provide a more robust result due to the larger number of samples in the increment. For the long-term sites, we used daily averaged reflector heights to determine daily accumulation rates. See Table S1 in the Supplement for a chart detailing the days when we have snowfall observations from GNSS, with previous observations from acoustic depth gauges available from the Automatic Weather Station project (Lazzara et al., 2012). We used 3 h estimates of reflector height to snow accumulation moving across the campaign GNSS array because station spacing was sufficient to map storms that moved up Thwaites Glacier (Video supplement; Hoffman, 2023). The mean and standard deviation of the filtered signals were used to derive accumulation records using the inverse method described in the following section.
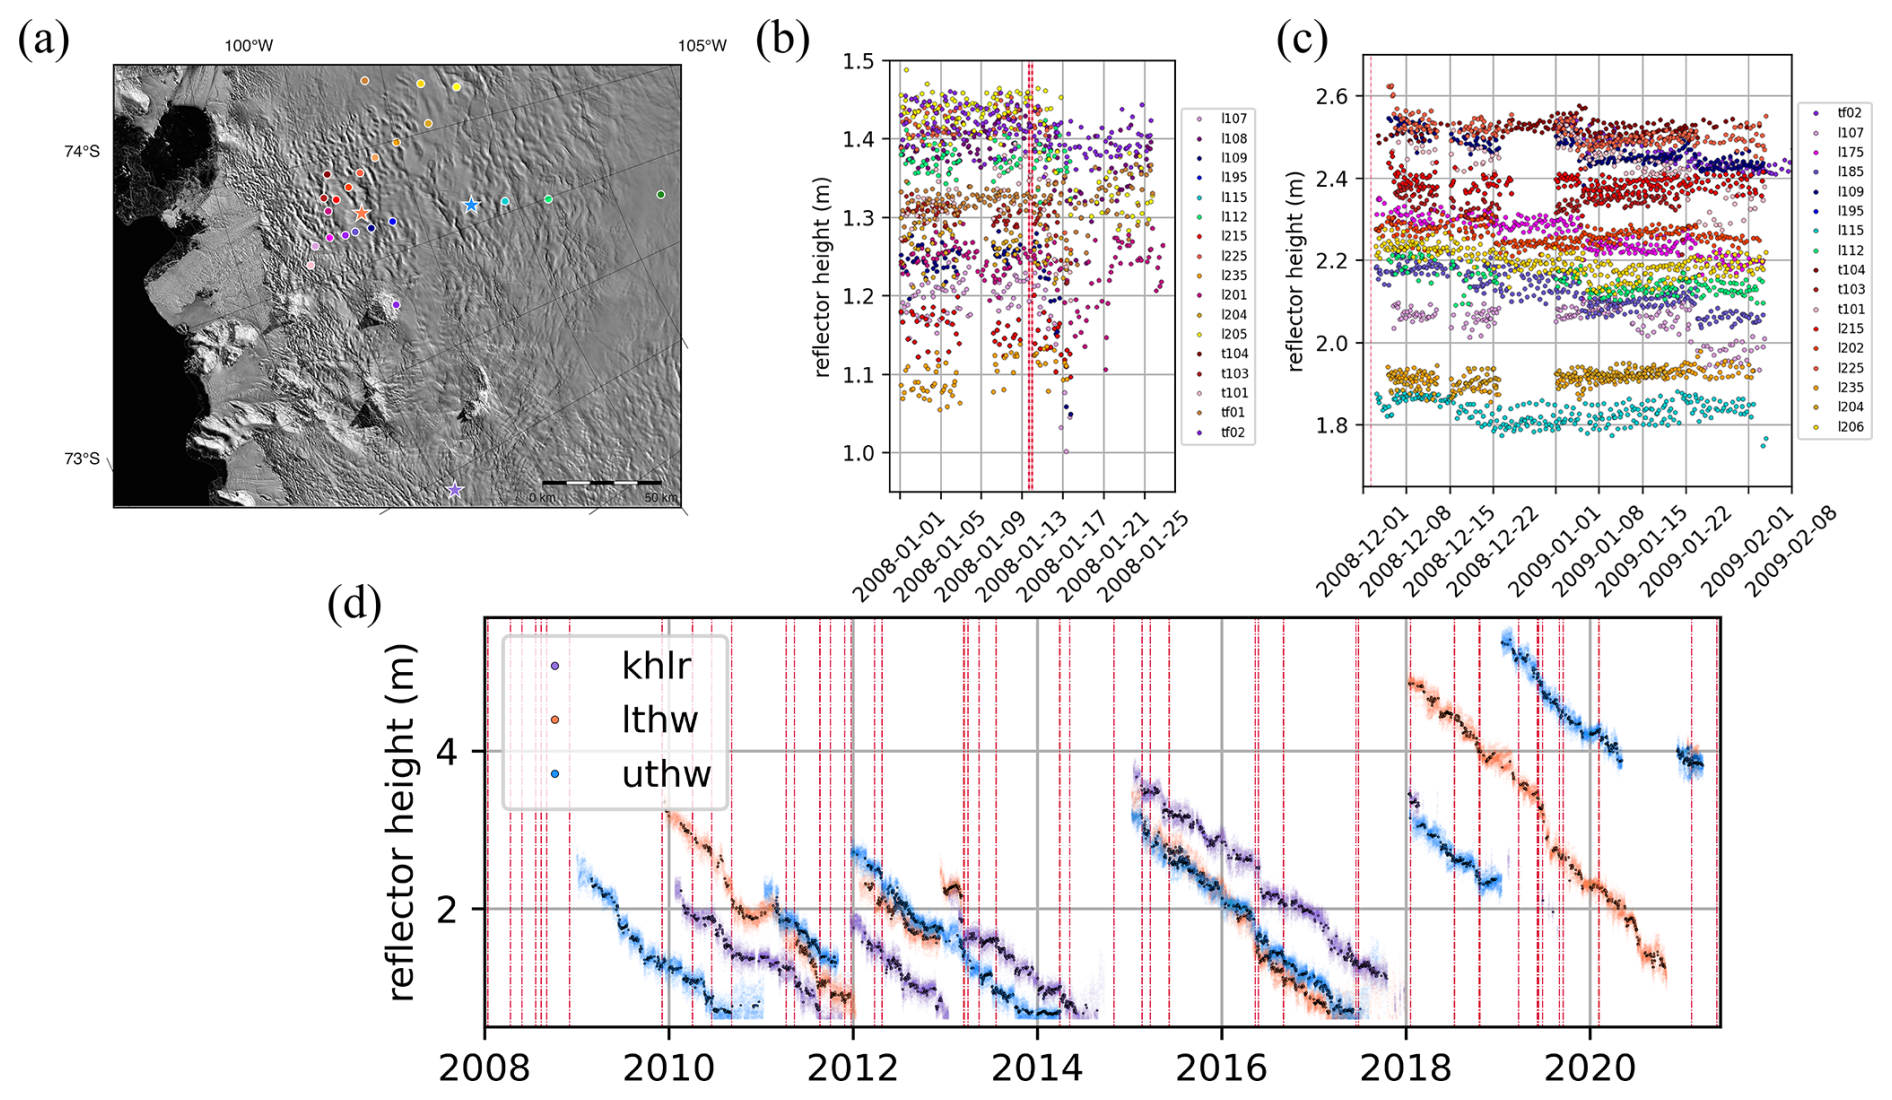
Figure 2(a) Locations of all the GNSS sites (long-term sites indicated with stars and campaign sites indicated with circles) with reflector height observations from the (b) 2007–2008 array, (c) 2008–2009 array, and (d) long-term GNSS sites. For the long-term records, all reflection heights are shown with daily median reflectors in bold. Atmospheric river events are marked with dashed red vertical bands (see Appendix A2 for more details on event detection methods).
3.1 Accumulation and densification forward model
To determine the accumulation record from observations of reflector height, we use an inverse method (Metropolis–Hastings algorithm) that requires a forward model that translates the parameters of interest (in our case, an accumulation and densification time series) into observables (reflector height time series). Our forward reflector height model for on-ice GNSS sites represents one-dimensional multi-layer snow compaction and grain settling from the surface to the depth of the GNSS antenna monument base. Each snow layer in the model is described by its thickness and density. Layers evolve following the compaction constitutive relation:
where ϵi is the layer strain, η is the snow viscosity, and σi is the overburden stress of the layers above (Fig. 3). The vertical stress of the overlying layers is computed for each layer, i, as
where θ is the local surface slope; g is the terrestrial gravitational constant; and ρi and hi are the layer density and thickness, respectively. The snow viscosity, η, which describes how efficiently stress is transmitted through the column, has been linked to snow temperature, liquid water content, and snow grain geometry. Without in situ observations of snow properties, we fix the viscosity for the duration of each reflector height experiment.
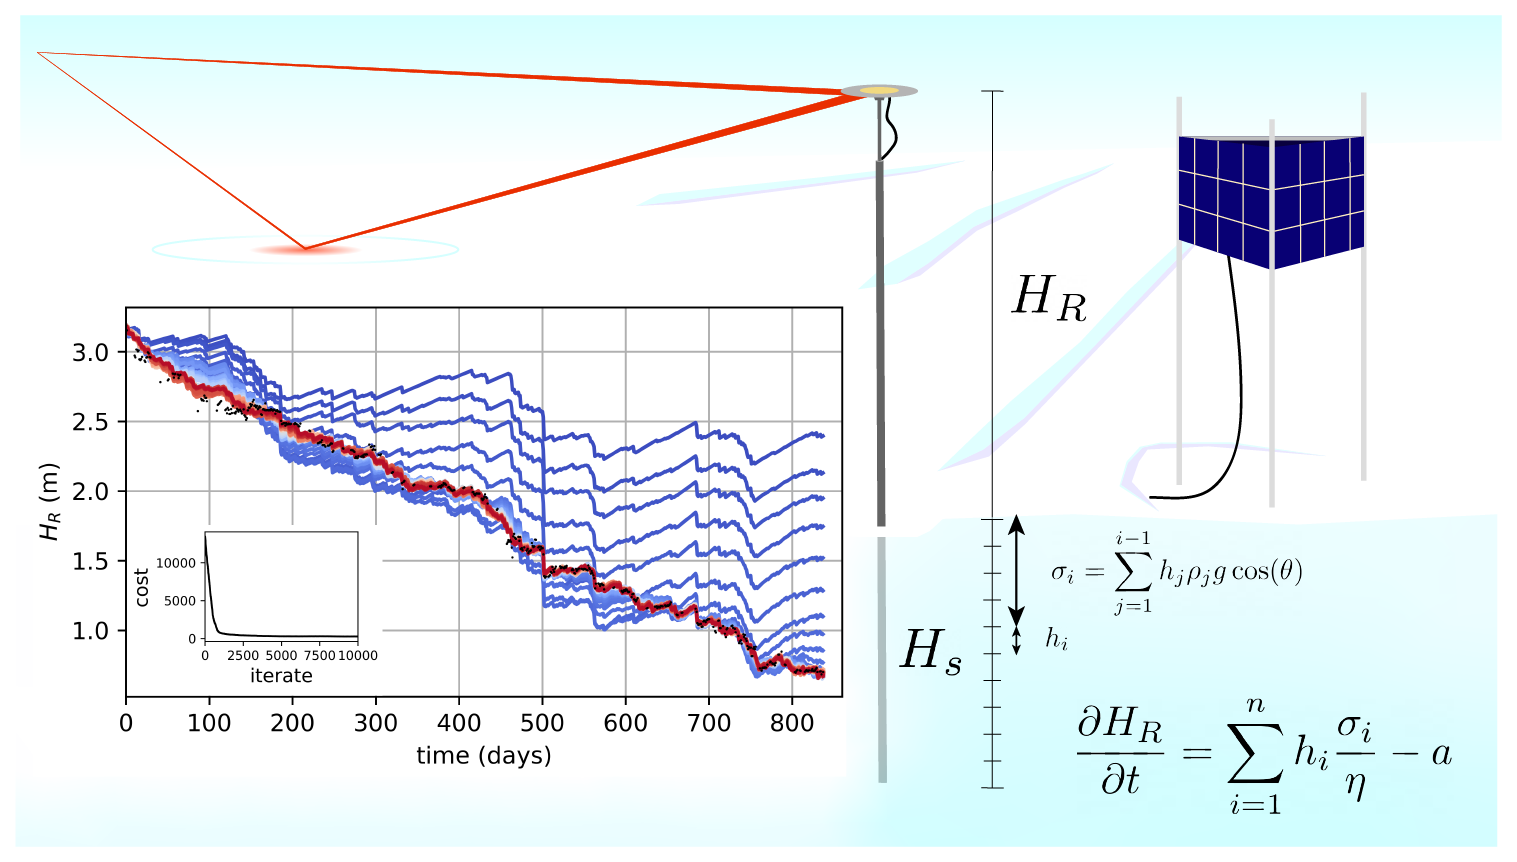
Figure 3The model schematic and convergence pattern of the Metropolis–Hastings algorithm used to produce an accumulation time series. In the main plot, we show the convergence of the modeled RH (colored lines) and the observed reflector height time series (black points) as a function of model iterate. The objective function we use to score solutions is shown as an inset plot. The misfit of the model compared to observations decreases and converges as a function of iteration in the inverse procedure.
3.2 Reflector height inverse method
The number of unknown parameters in our model scales with the length of the reflector height record. We reset the inference of accumulation, viscosity, and initial snow density each time the antenna mast is raised (quasi-annually). We use Bayes' theorem to compute the distributions of accumulation at each time step and specify a likelihood model, assuming that observations of reflector height are independent in time and normally distributed around the true value at each data point with variance . The objective functional defined by the least-squares difference between observed, , and modeled, , reflector heights for each increment, k, in the time series when observations are available is described by
We use this objective functional to define the likelihood of the modeled reflector heights, given the observations:
The priors for the accumulation record are modeled with Gaussian distributions with parameters listed in Table S3. The Gaussian distributions for the snow accumulation are centered on an initial estimate of mean snow accumulation that takes the maximum of the difference of snow surface height divided by the mean snow density (300 kg m−3) and a prior of no snowfall (). With a likelihood model and a prior estimate of the model parameters, we use Monte Carlo methods to sample and thereby estimate the posterior distribution of the accumulation, density, and snow viscosity, and we evaluate the statistical properties of the samples as a proxy for the joint posterior distribution of the model parameters. We use the Metropolis–Hastings algorithm to build estimates of the posterior distribution, map model degeneracy, and understand parameter uncertainty. The Metropolis–Hastings algorithm samples the prior estimate of each model parameter and independently updates each parameter at each iteration by randomly drawing a sample from the proposed distribution. If the sampled posterior probability is greater for the proposed distribution than the current distribution, the new parameter value is accepted. Otherwise, it is accepted with probability (Paccept) proportional to the ratio of the current probability (p(mi)) and that of the proposed value (p(mi+1)).
Here B is a tunable regularization parameter to facilitate convergence. We use these time series to explore possible drivers of precipitation by connecting the events we observed using GNSS-IR to extreme precipitation events in reanalysis.
3.3 Reanalysis composites
Following many previous studies, we use MERRA-2, RACMO2, and ERA5 reanalysis products to contextualize our observations of local surface height change from GNSS with large-scale circulation (Gelaro et al., 2017; van Wessem et al., 2018; Hersbach et al., 2020). We chose to focus on ERA5 because past studies have shown that observed snow accumulation from GNSS-IR agreed better with ERA5 snow accumulation records than with MERRA-2 and RACMO2 snow accumulation records (Fig. S1; Table S3 in the Supplement; Maclennan et al., 2022). ERA5 is the newest global atmospheric reanalysis product from the European Centre for Medium-Range Weather Forecasts (ECMWF) and has 0.25° latitude (28 km) by 0.25° longitude (∼7 km2) resolution (Hersbach et al., 2020). We focus our study on the southern Pacific but include reanalysis data from tropical latitudes (20° N to 90° S) to evaluate the possibility of tropical teleconnections that have been suggested to affect precipitation variability in accumulation records preserved in firn and ice cores.
Using the GNSS-IR time series, extreme precipitation was classified using a seasonally corrected 90th percentile threshold of daily accumulation rates for the lower Thwaites and upper Thwaites site accumulation events. The union of these two indices was used to create a Thwaites Glacier catchment extreme accumulation event dataset. The results do not change substantially when the Kohler Glacier site is included in this index; however, because of the observed offset in the accumulation seasonality, we exclude Kohler from the merged index of the sites on Thwaites Glacier. The GNSS-IR catalog of extreme accumulation events was used to calculate composite maps of geopotential height and wind anomalies at the 500 hPa pressure level, blocking anomalies calculated from anomalies of geopotential height at the same pressure level, surface temperature anomalies (2 m), near-surface wind anomalies (10 m), integrated vapor moisture transport (IVT) anomalies, and Rossby source anomalies using ERA5 daily averages. Rossby source anomalies were calculated from 200 hPa winds following the methods described by Trenberth et al. (1998) and Holton (2004), as implemented by Dawson (2016). Daily average outgoing longwave radiation (OLR) anomaly composites and sea surface temperature anomalies were calculated from NOAA SST data and OLR satellite data (Liebmann and Smith, 1996). Composites were calculated for the 10 d preceding the onset of extreme precipitation and corrected for anomalies calculated relative to seasonal mean conditions. The interval of 10 d was chosen to evaluate the importance of both proximal atmospheric dynamics near the Amundsen Sea and tropical and extratropical teleconnections that precede changes in the ASE by up to 10 d (Li et al., 2015, 2021). As part of this analysis, we also built catalogs of blocking events and the atmospheric rivers that made landfall in the ASE, both of which have been connected to extreme precipitation and changes in the surface elevation of the West Antarctic Ice Sheet (Adusumilli et al., 2021). More information on the methods used to create these catalogs can be found in Appendix A1.
4.1 GNSS-IR accumulation time series
Using GNSS-IR, we created the first ∼10-year time series of snow accumulation at three sites in one of the most remote areas of West Antarctica: the Amundsen Sea Embayment (Fig. 4). Currently, all precipitation on Thwaites Glacier at the GNSS sites falls as snow with no discernible rain events recorded in reanalysis or GNSS-IR surface reflection amplitude. The seasonal accumulation climatology is significant for all sites (p value <0.001; see Supplement). On Thwaites, precipitation is most frequent and intense in the austral winter (June, July, and August; JJA), with peak accumulation in August that tapers into the austral summer to a minimum in January (Fig. 5). At LTHW, precipitation is ∼50 % higher in austral winter than in austral summer. The seasonal signal is more muted at UTHW, with only a ∼30 % difference between seasons. At the KHLR site, we observe peak accumulation in March and minimum accumulation in November. The interannual variability and the seasonal cycle are driven primarily by changes in the frequency of extreme precipitation events. Extreme events account for over half the total accumulation at all three long-term GNSS sites and explain 80 % of the snow accumulation variability in reanalysis. These events also change seasonally (Fig. 5). Over the observation time period (2009–2020), extreme precipitation events occur on 13 % of wintertime days (96 d), 6.2 % of summertime days (45 d), 10.4 % of springtime days (71 d), and 10.2 % of fall days (82 d).
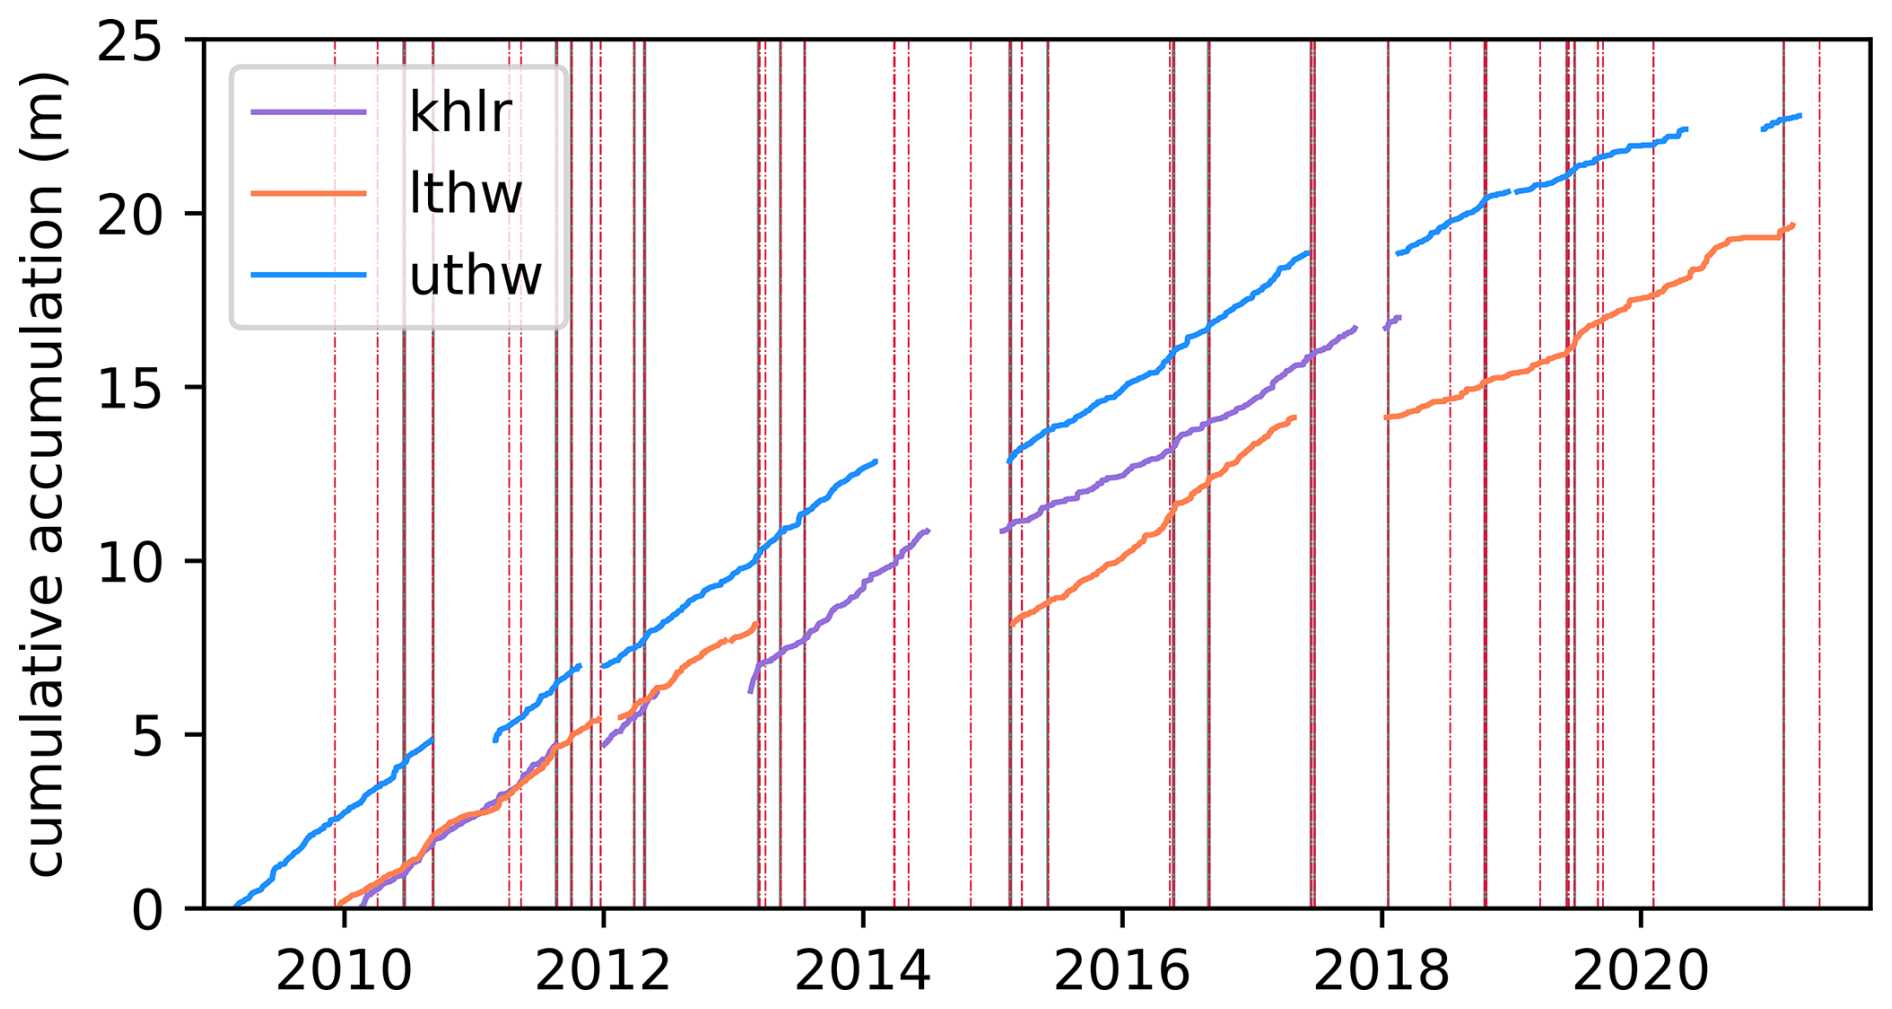
Figure 4Observed cumulative accumulation at the LTHW, UTHW, and KHLR receiver sites with the timing of atmospheric river events that made landfall in the ASE (dashed red vertical lines) and the extreme accumulation events measured with GNSS-IR that occur within 2 d of the atmospheric river events (gray vertical lines).
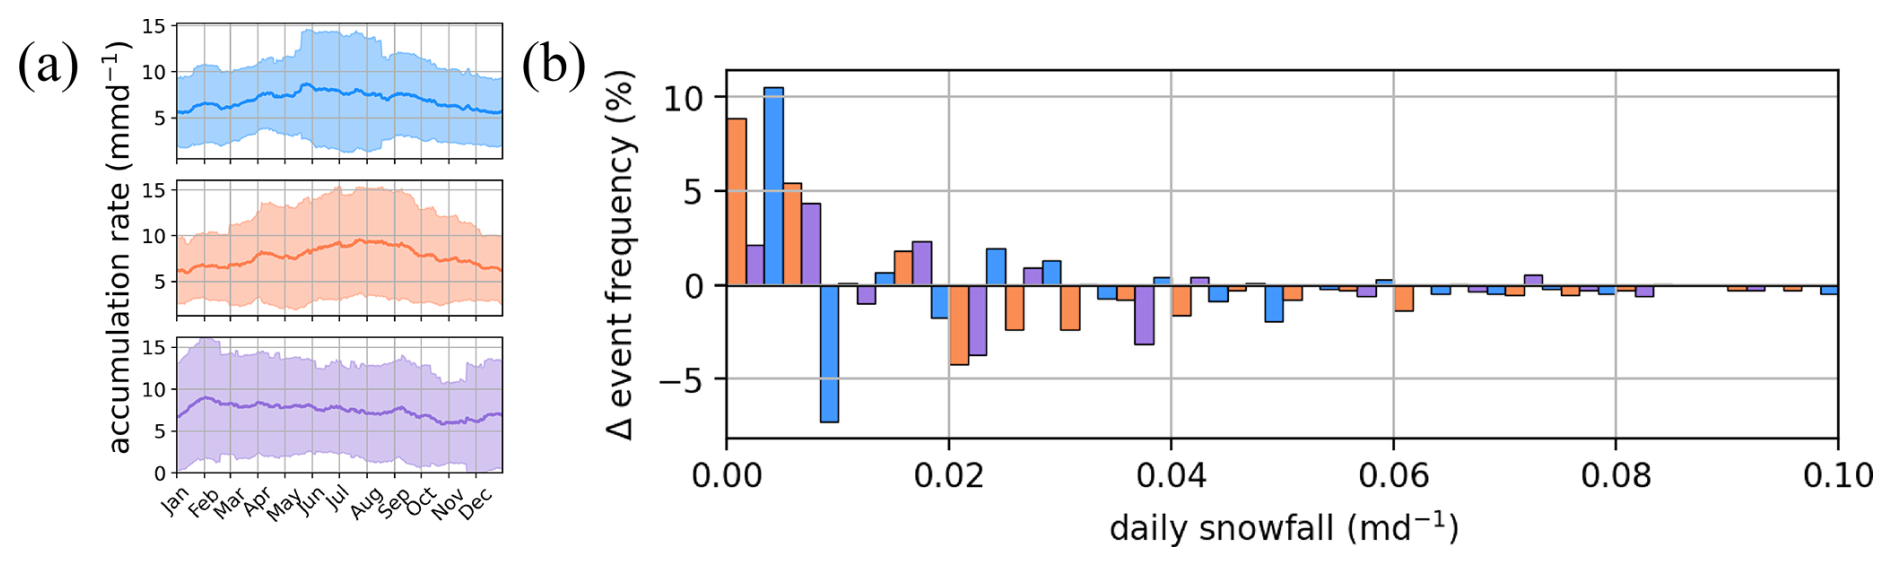
Figure 5(a) The seasonal accumulation cycle at LTHW, UTHW, and KHLR GNSS sites. (b) Distribution of the difference between seasonally high accumulation event frequency and low accumulation event frequency at the upper and lower Thwaites Glacier (DJF–JJA) and Kohler Glacier (SON–MAM).
Using the short-duration GNSS arrays that were deployed for 1 month in the 2007–2008 austral summer and 2 months in the 2008–2009 austral summers, we also document the distributed patterns of snowfall across 17 stations in the ASE (Figs. 2, 6). During these short-duration campaigns, we observed seven extreme precipitation events during these two summers (Fig. 6). Across the short-term arrays in both summers, we find that it snows 2–4 times more at lower Thwaites (800 m above sea level) than in the higher-elevation regions of the catchment (1200 m above sea level) during extreme events (Fig. 6). Elevation gradients in accumulation are less strong on days when we do not observe extreme events.
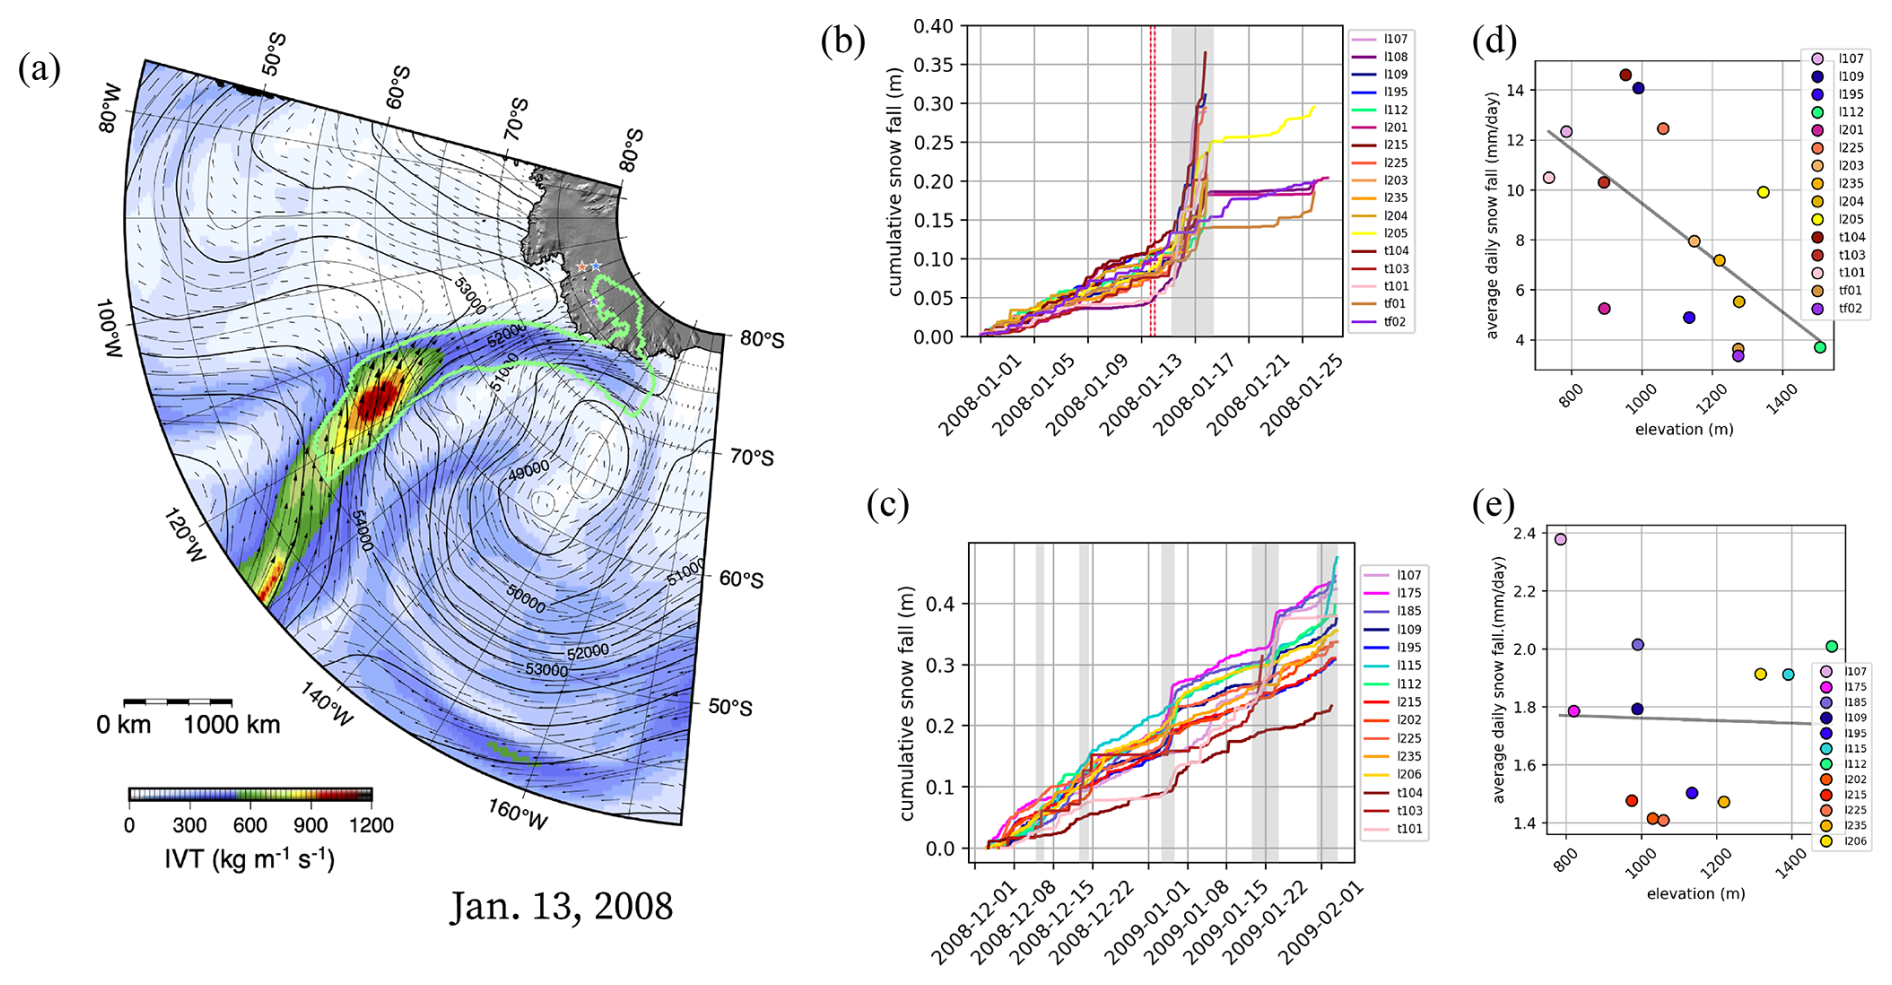
Figure 6(a) The guiding 500 hPa geopotential height (gray contours) and the integrated vapor transport for the 2007–2008 array atmospheric river event with the cumulative accumulation at the site of each receiver deployed as part of the (b) 2007–2008 and (c) 2008–2009 GNSS arrays. Red lines indicate the timing of atmospheric rivers that make landfall in the ASE. Gray shading indicates the timing and duration of extreme precipitation events determined from all array GNSS sites. Average daily snowfall as a function of elevation for the (d) 2007–2008 and (e) 2008–2009 austral summers.
4.2 Composite investigation of reanalysis
Summer and winter time blocking in the Amundsen and Bellingshausen seas
The mean blocking conditions from the days preceding the onset of observed extreme accumulation at the GNSS sites for summer (DJF) and winter (JJA) events are illustrated in Fig. 7. We found that between 2 d prior to (day −2) and the onset of snowfall (day 0) blocking is present in the Bellingshausen and Amundsen seas (defined by bounds 55° S, 75° S, 120° W, and 45° W) during 42 % of winter extreme precipitation events and 37% of summer extreme precipitation events. Snowfall events with atmospheric blocking also have statistically higher mean precipitation rates than those without blocking.
The blocking frequency anomalies associated with both summer and wintertime extreme precipitation events reveal significant blocking of the westerly flow in the Bellingshausen and Amundsen seas before and during extreme snowfall events (Fig. 7). The composites of 500 hPa winds are also consistent with blocking over large areas of the Bellingshausen Sea during extreme snowfall events. During the summer extreme precipitation events, blocking frequency anomalies are higher (note the difference in color scale) compared to wintertime blocking anomalies associated with extreme wintertime precipitation (Fig. 7). Austral summer blocking anomalies also cover a significantly larger area than the austral winter anomalies and extend westward to much of the Amundsen Sea. In the austral winter, anomalously negative blocking frequency is observed closer to the Thwaites Glacier catchment. This low-pressure austral winter anomaly drives anonymous northerly mid-level winds that impinge on the coast of West Antarctica and appear to strengthen along the eastern flank of the anticyclone.
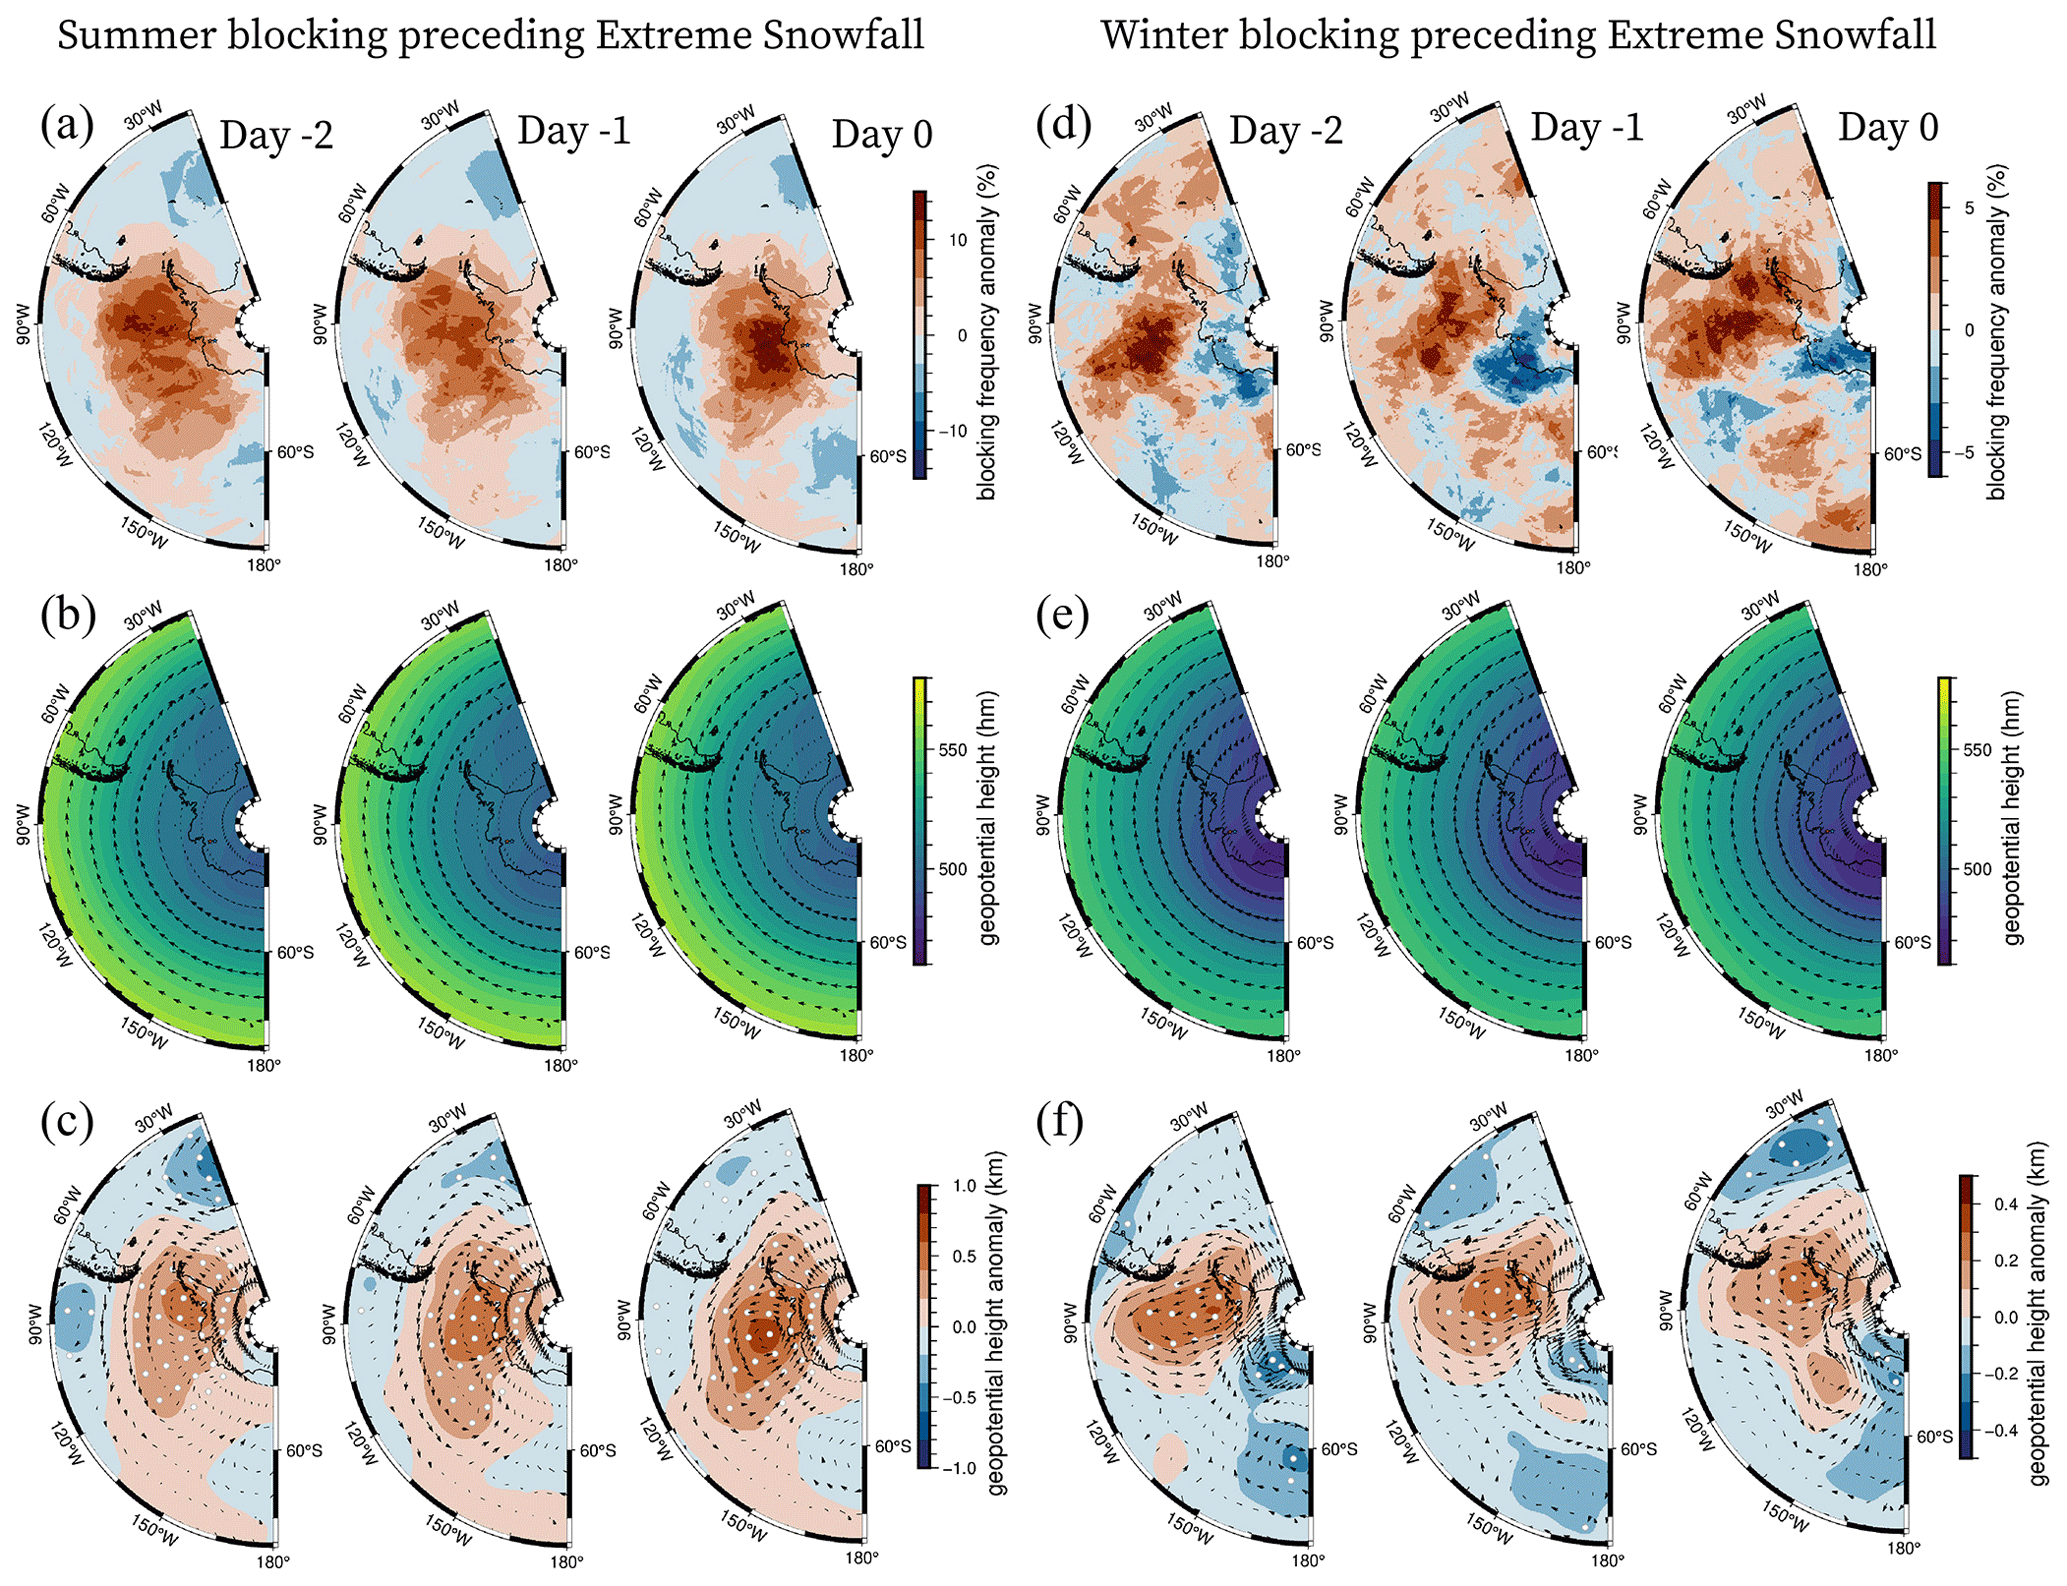
Figure 7(a) Blocking frequency anomaly, (b) 500 hPa geopotential height shown with vectors of the 500 hPa winds, and (c) 500 hPa geopotential height anomaly and wind anomaly for extreme precipitation events observed during the austral summer (DJF). (d) Blocking frequency anomaly, (e) 500 hPa geopotential height and winds, and (f) 500 hPa geopotential height and wind anomaly observed during the austral winter (JJA). The day indices are relative to the day of precipitation onset at the GNSS receivers. Stippling of anomalies indicates significance at 95 % confidence.
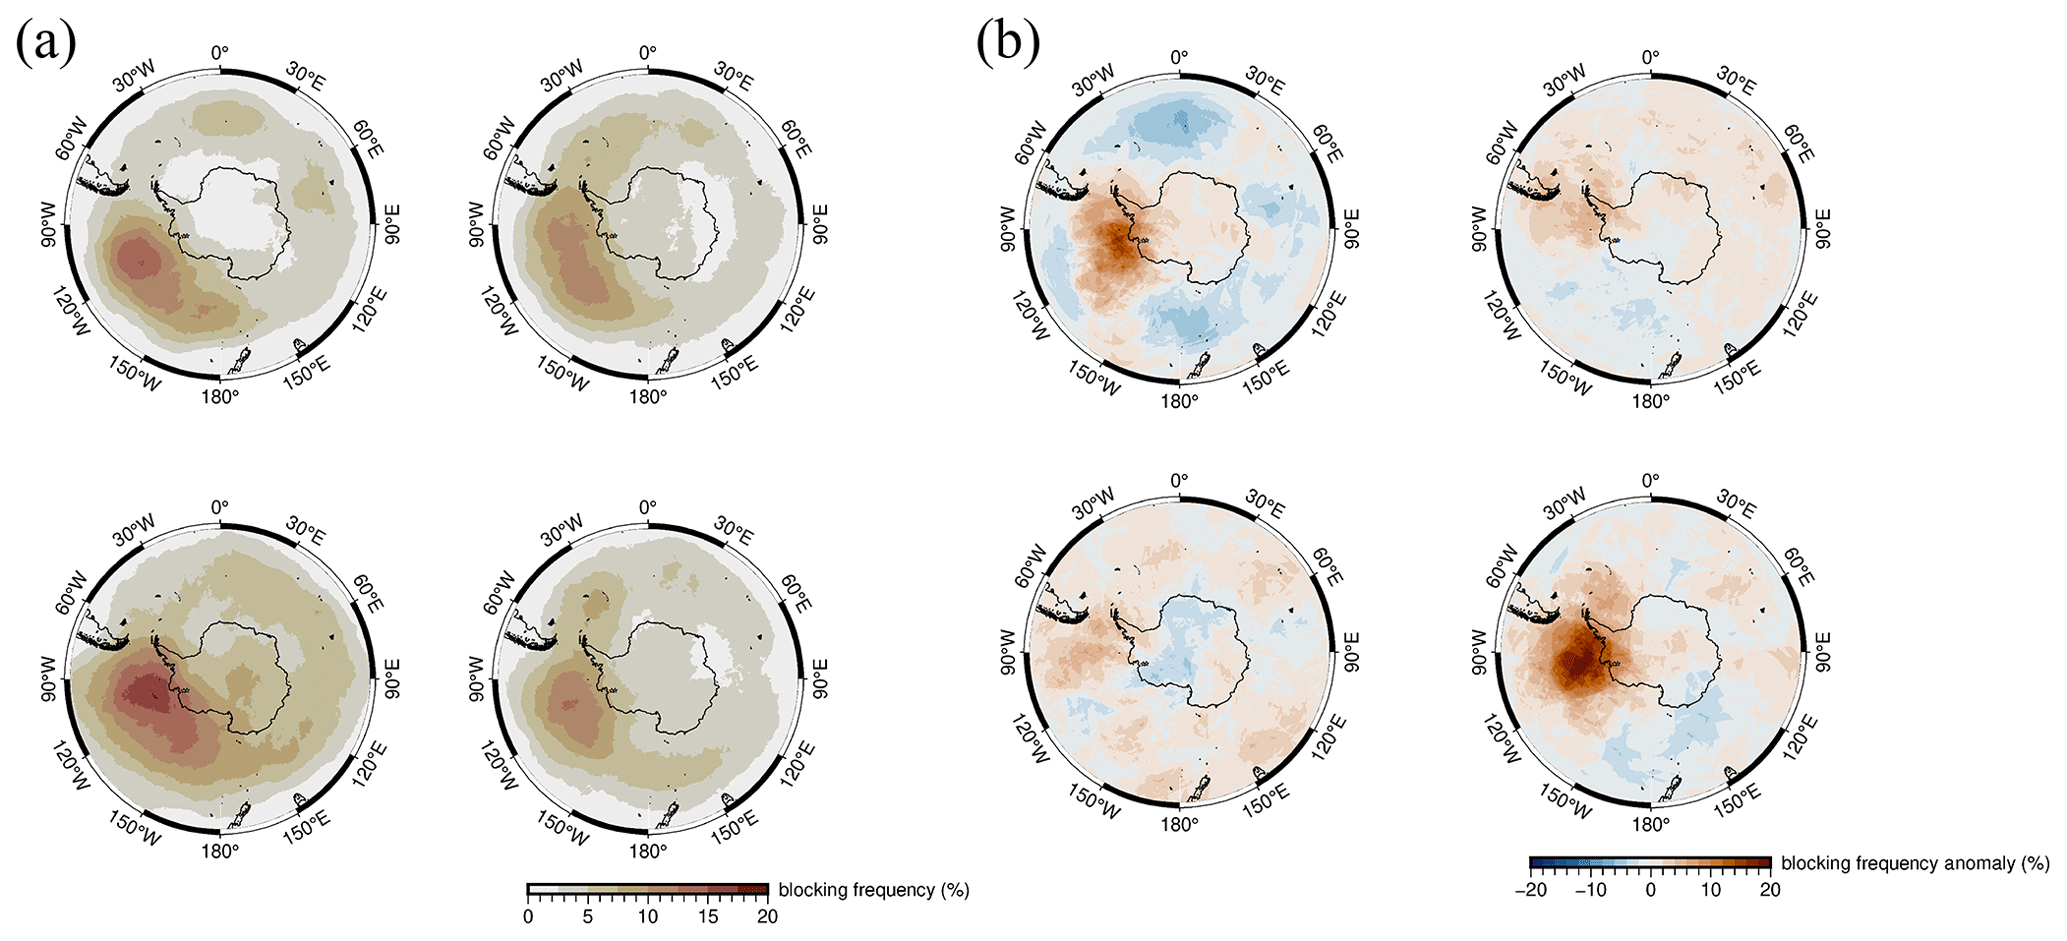
Figure 8(a) Seasonal blocking frequency cycle and the (b) blocking frequency anomalies associated with extreme precipitation on Thwaites Glacier.
The mean blocking frequency (2009–2020, Fig. 8) across all seasons in the Southern Ocean is largest in the Amundsen and Bellingshausen seas. Blocking frequency in this region increases and shifts zonally from the Amundsen Sea in the summer to the Bellingshausen Sea in the winter. The amplitude of blocking frequency change also increases with a maximum in winter and a minimum in the preceding fall. The blocking frequency anomalies associated with extreme accumulation events over the period of observations are highest during summer and spring when the total frequency of blocking is low. This clear pattern in blocking frequency anomaly suggests that blocking of moist mid-latitude westerly flow north of the Amundsen and Bellingshausen seas in summer and spring drives significant summer and spring precipitation. In the next section, we use composites of near-surface temperature and integrated vapor moisture transport to explore these relationships further.
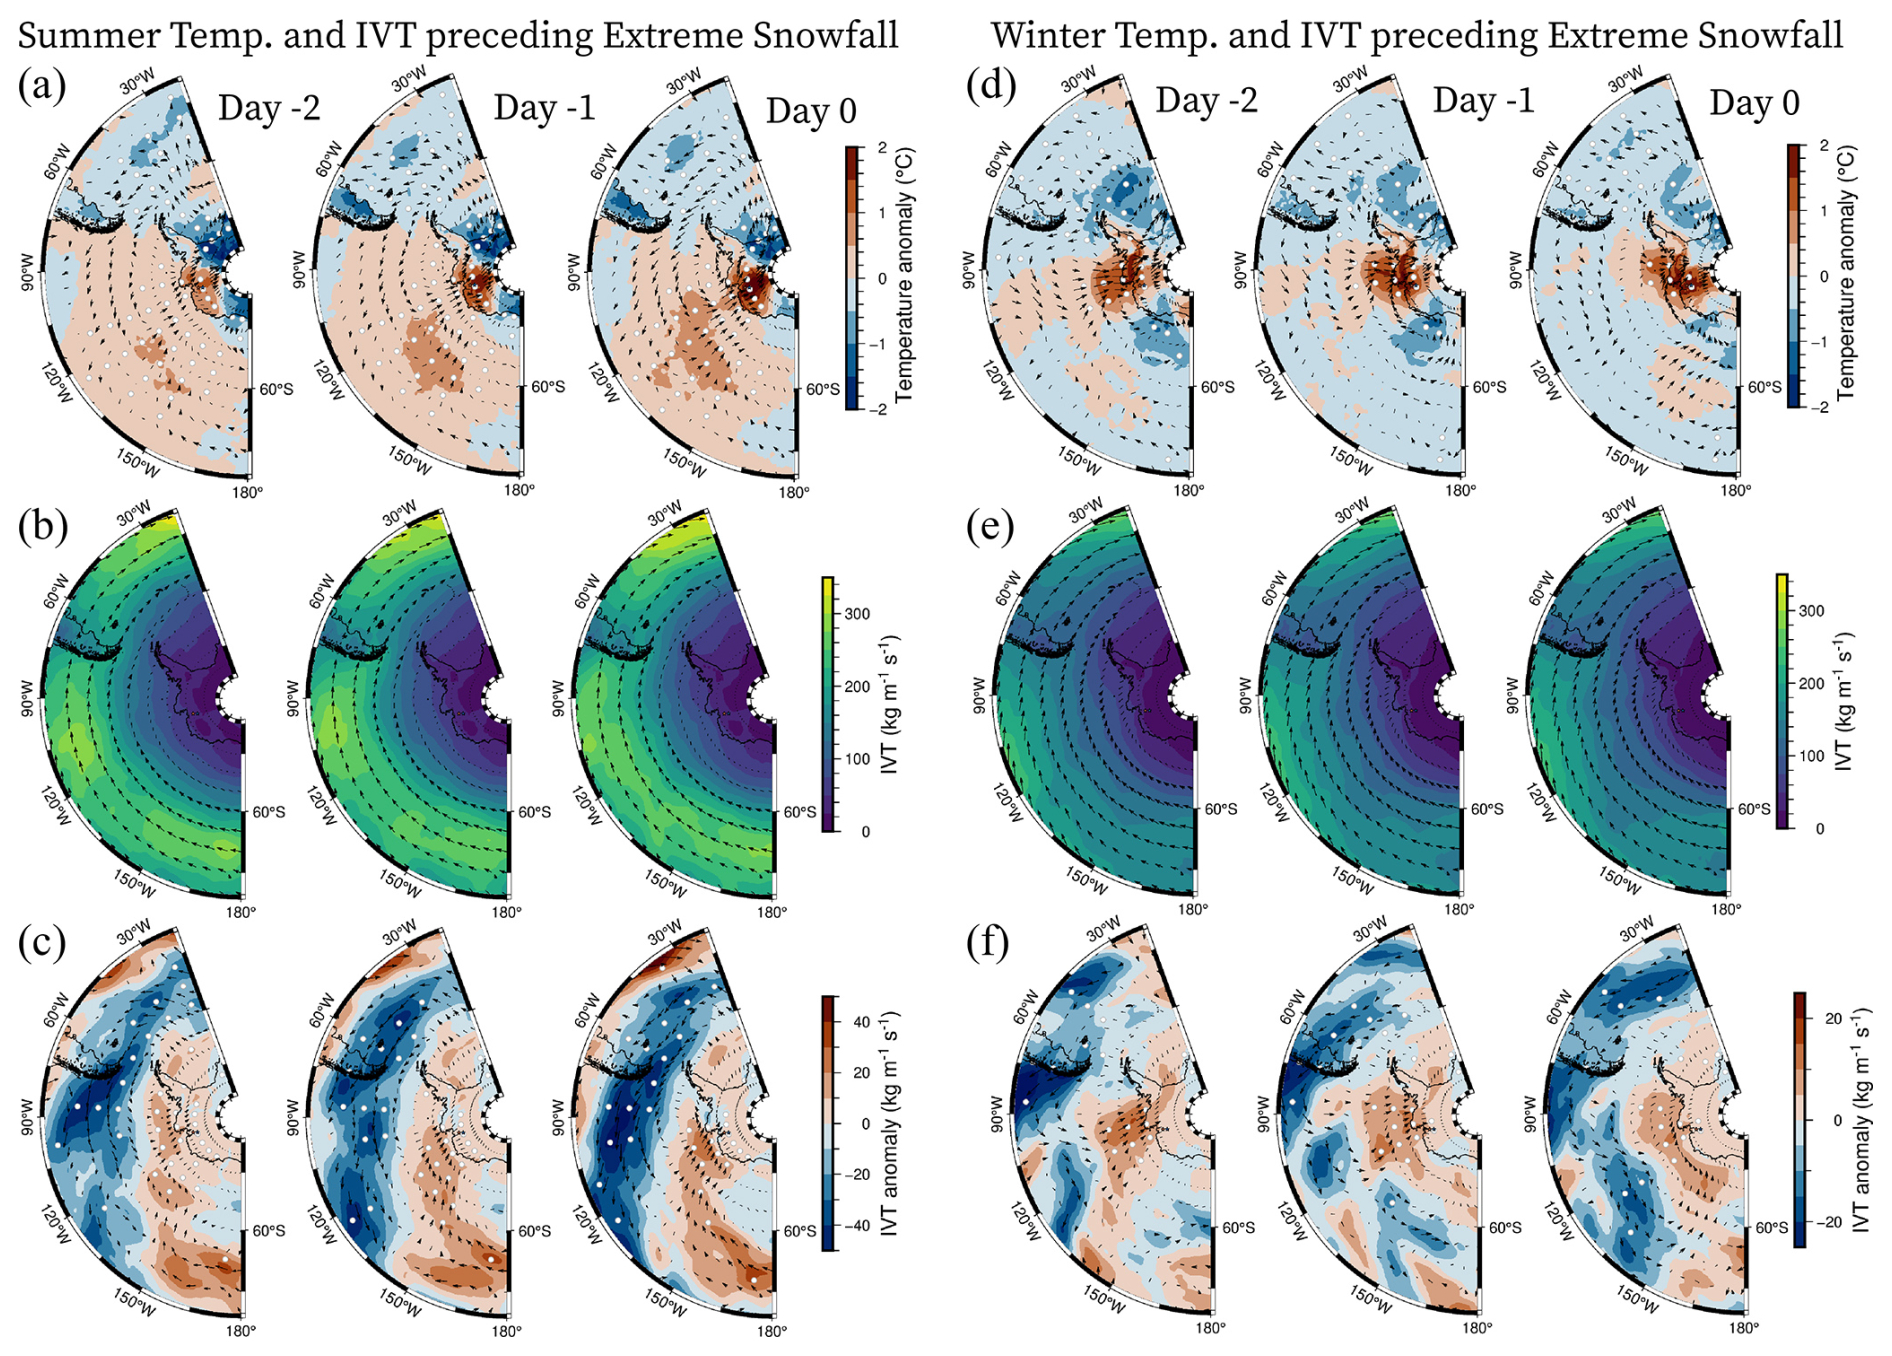
Figure 9(a) Near-surface (2 m) temperature anomaly, (b) mean integrated vapor moisture transport, and (c) integrated moisture transport anomaly for extreme precipitation events during the austral summer (DJF). (d) Near-surface temperature anomaly, (e) mean integrated vapor moisture transport, and (f) integrated vapor moisture transport anomaly for extreme precipitation events during the austral winter (JJA). The day indices are relative to the day of precipitation onset at the GNSS receivers. Stippling of anomalies indicates significance at 95 % confidence.
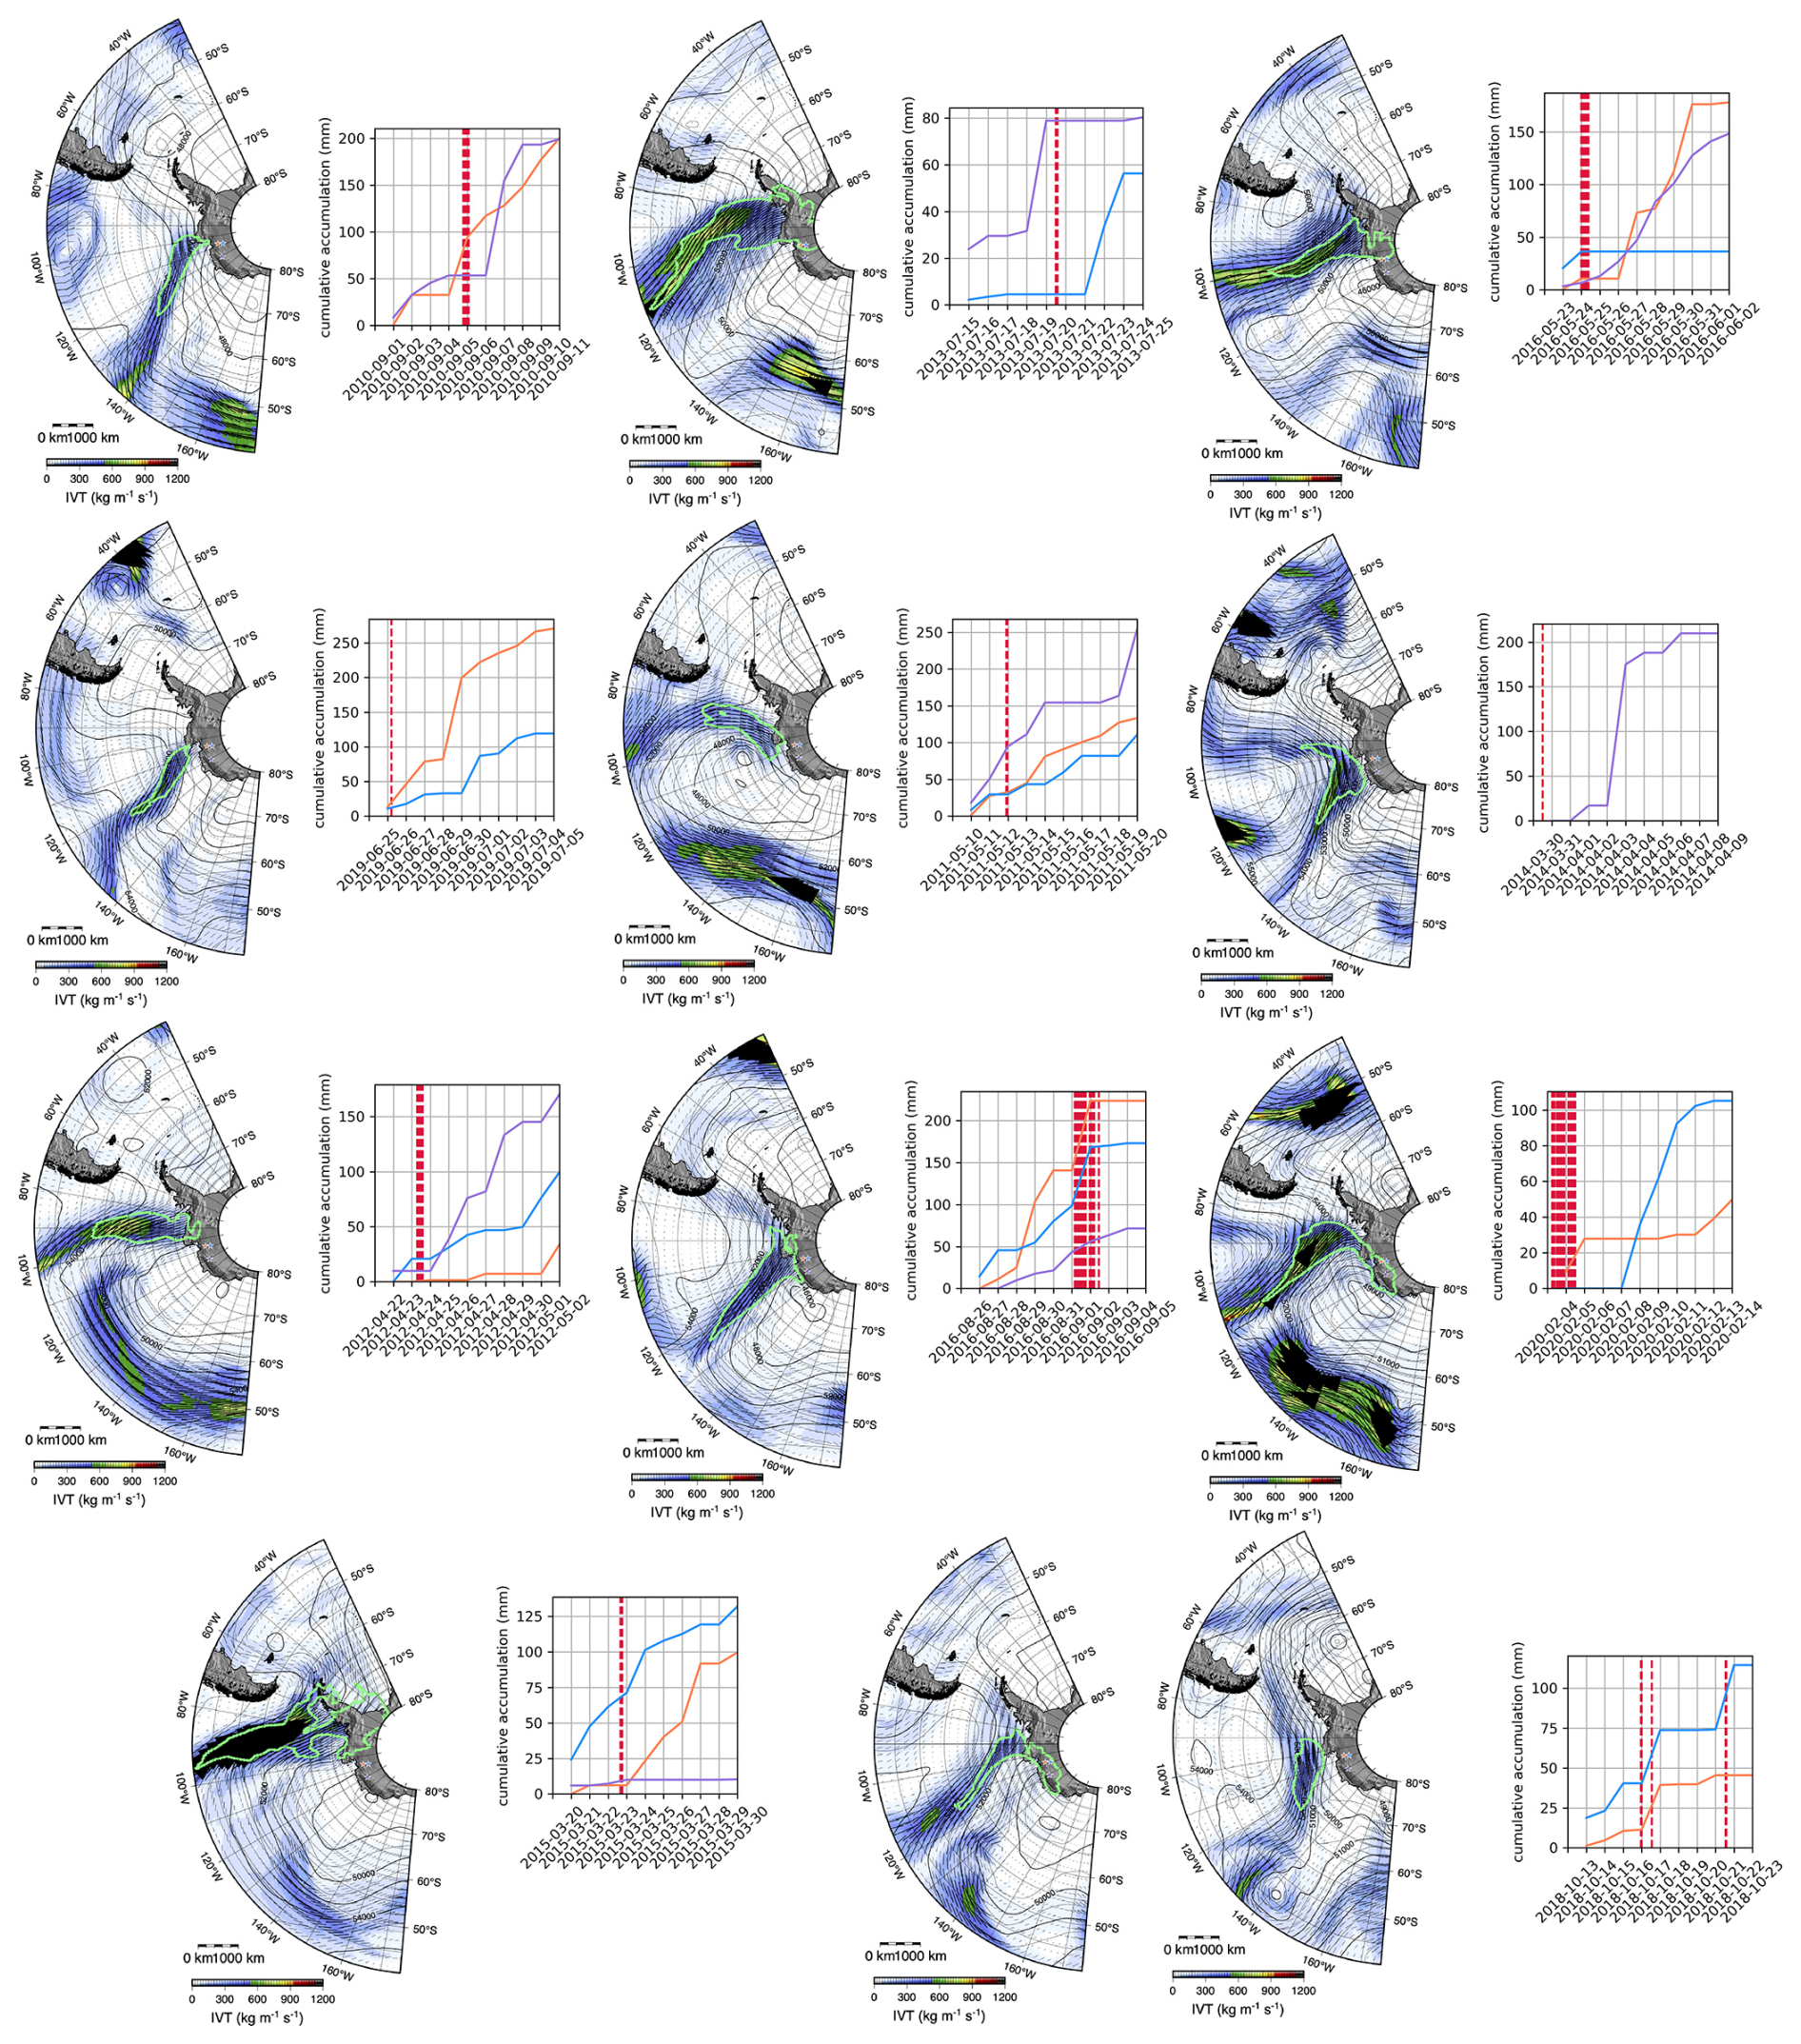
Figure 10The detected atmospheric rivers (cyan-green contour) with the guiding 500 hPa geopotential height (gray contours) and the integrated vapor transport for the events (color map) that occur within 3 d of the 95th percentile of height changes observed with GNSS-IR. Graphs to the right of each figure show the accumulation determined using GNSS-IR reflector height change during each event. Red vertical lines indicate the timing of atmospheric river landfall.
4.3 Summer and winter time vapor transport in the Amundsen Sea
The mean surface temperature and vapor transport conditions on the days preceding the onset of extreme precipitation events we observe with GNSS-IR are illustrated in Fig. 9. Positive near-surface temperature anomalies are present across the Amundsen Sea and the southern Pacific 2 d before extreme precipitation is observed on Thwaites Glacier. These temperatures steadily increase and peak on the day of the extreme event with positive temperature anomalies exceeding 1.5 °C (Fig. 9). During austral summer (DJF), these near-surface temperature and wind anomalies appear to come from the northwest. During the austral winter (JJA), anomalously high near-surface temperatures increase in the Amundsen Sea from the northeast (Fig. 9a, d).
The mean integrated vapor transport (IVT) associated with these events also shows enhanced values in the Amundsen and Ross seas. The circum-Antarctic jet that transports the majority of high-latitude moisture in the Southern Hemisphere is diverted southward expressed as a negative easterly IVT anomaly where IVT is highest (Fig. 9b, e, c, f). This negative moisture anomaly is coherent with a positive westerly and northerly IVT anomaly at higher latitudes that extends into the West Antarctic interior (Fig. 9c, f). In austral summer, the positive IVT anomalies are more uniform and diverted to higher latitudes by similarly uniform negative westward IVT anomalies. In austral winter, IVT anomalies integrated over the area of the entire Pacific are stronger than in austral summer; however, the spatial structure of the anomalies is more heterogeneous and insignificant at 95 % confidence.
Atmospheric river event frequency also varies seasonally, with larger events making landfall in austral winter months. These events make up only a small fraction of the extreme events that appear to control precipitation on Thwaites. Similar to the conclusions of other studies (i.e., Maclennan and Lenaerts, 2021), we find that atmospheric rivers account for 8 % of the total accumulation measured at the sites of the long-term GNSS receivers over the 10 years of available observations. In total, we identify 12 atmospheric river events, defined as continuous periods (multiple hours to multiple days), when rivers make landfall within 5 d of an extreme accumulation event observed with GNSS-IR (90th percentile). The 12 distinct events are shown in Fig. 10 with the accumulation that we observe at the inland GNSS-IR sites.
4.4 Summer and winter teleconnections
Composite sea surface temperature and 500 hPa geopotential height anomalies were analyzed across the Southern Hemisphere to test the significance of tropical teleconnections that may drive extreme winter and summertime precipitation in the Amundsen Sea. In the austral winter, we find significant positive tropical Atlantic, southeastern Atlantic, and southwestern Indian Ocean sea surface temperature anomalies preceding extreme snowfall on Thwaites Glacier (Fig. 11, Fig. S3). We also identify a clear train of alternating high- and low-pressure anomalies consistent with Rossby waves that migrate eastward, building up to extreme precipitation events (Figs. 12, S3, S4, S5, S6, S7). In the austral winter, these Rossby wave trains, as expressed in 500 hPa pressure anomalies, extend from large anomalies off the coast of Africa in the eastern Atlantic 4–5 d preceding the extreme precipitation event (Fig. 12). These waves propagate across the Southern Ocean to the Amundsen and Bellingshausen seas. In austral summer, the anomalies associated with extreme precipitation events are stronger and more significant in the Bellingshausen Sea and appear to be driven by significant summer sea surface temperature anomalies in the central Pacific, in addition to significant anomalies in the Atlantic and western Indian oceans (Figs. S2, S3).
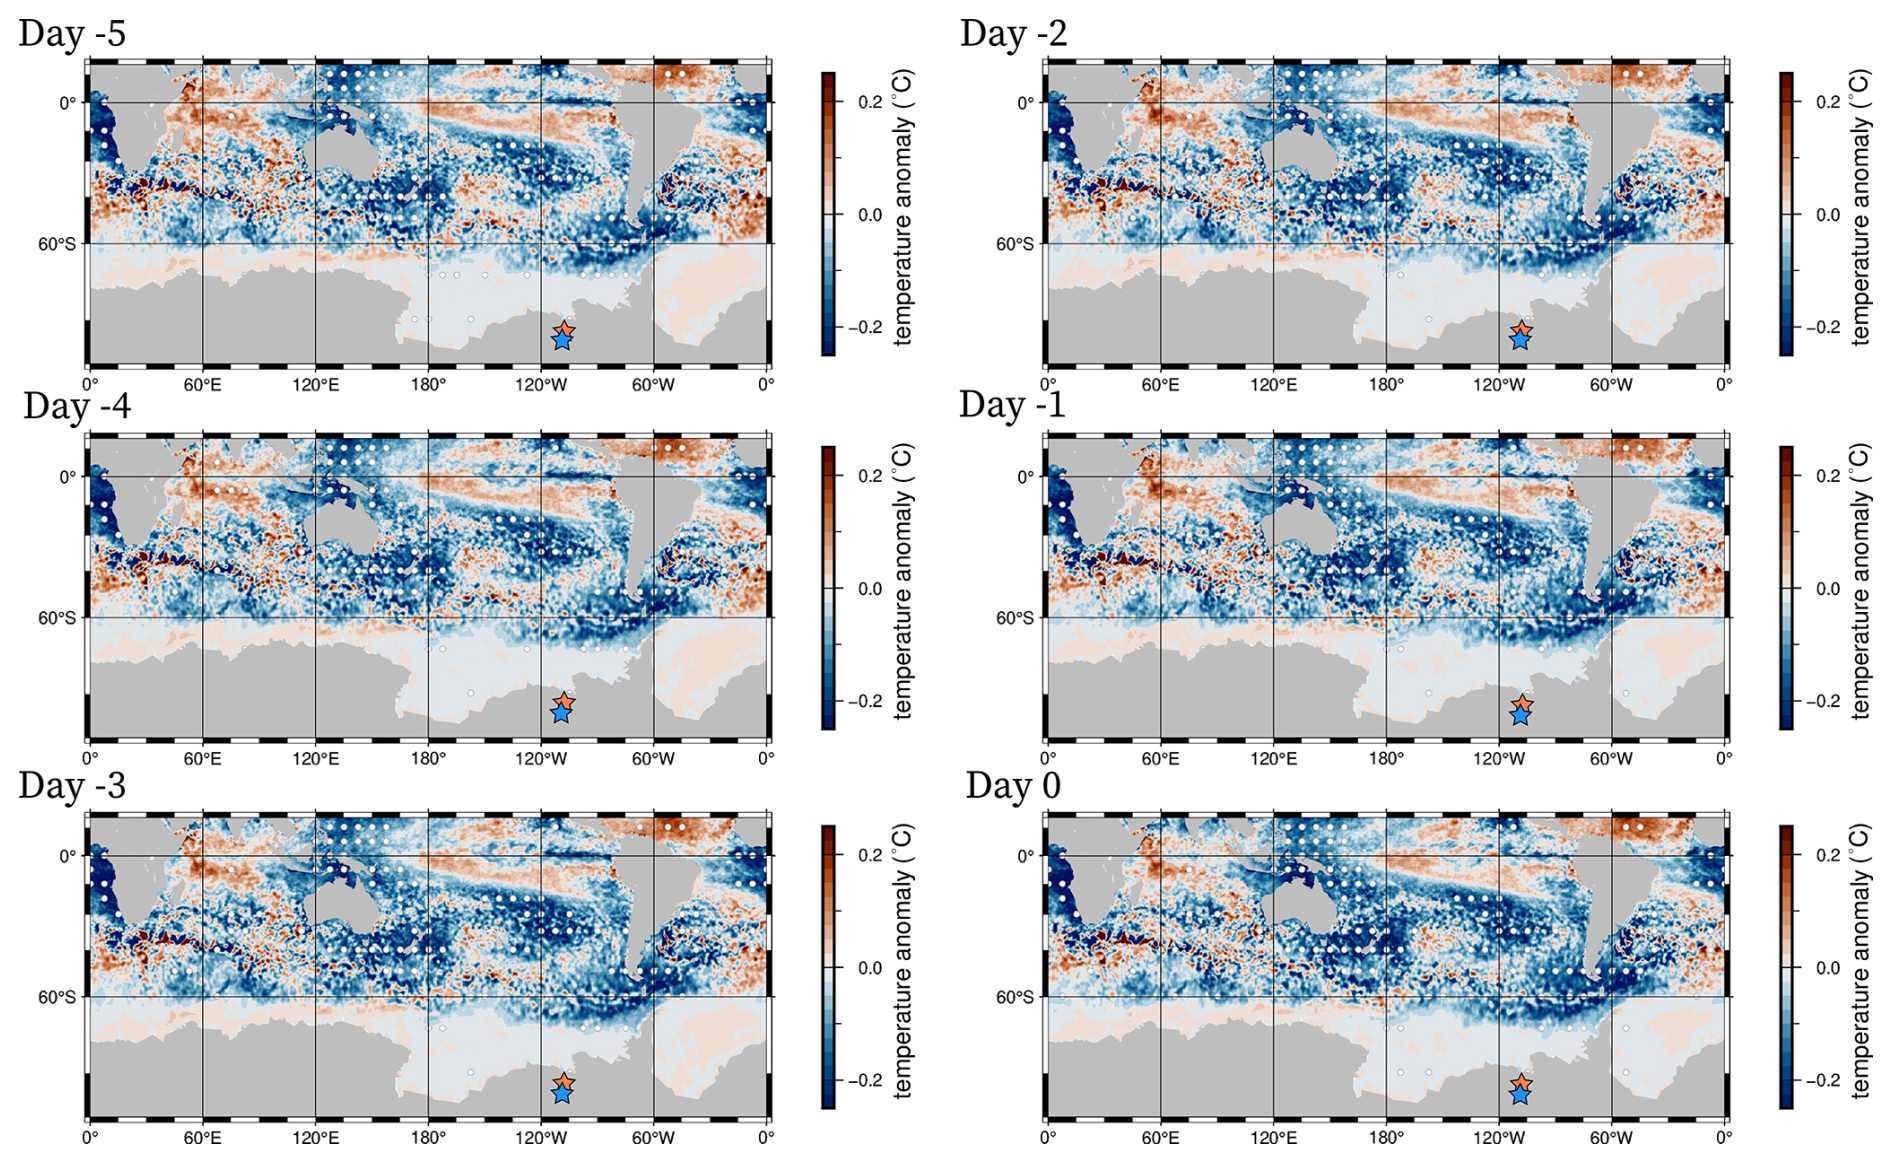
Figure 11Austral winter sea surface temperature composite anomalies. The numbering of the days indicates the days before the extreme precipitation event observed at the GNSS-IR stations located on Thwaites Glacier, which are plotted as orange and blue stars.
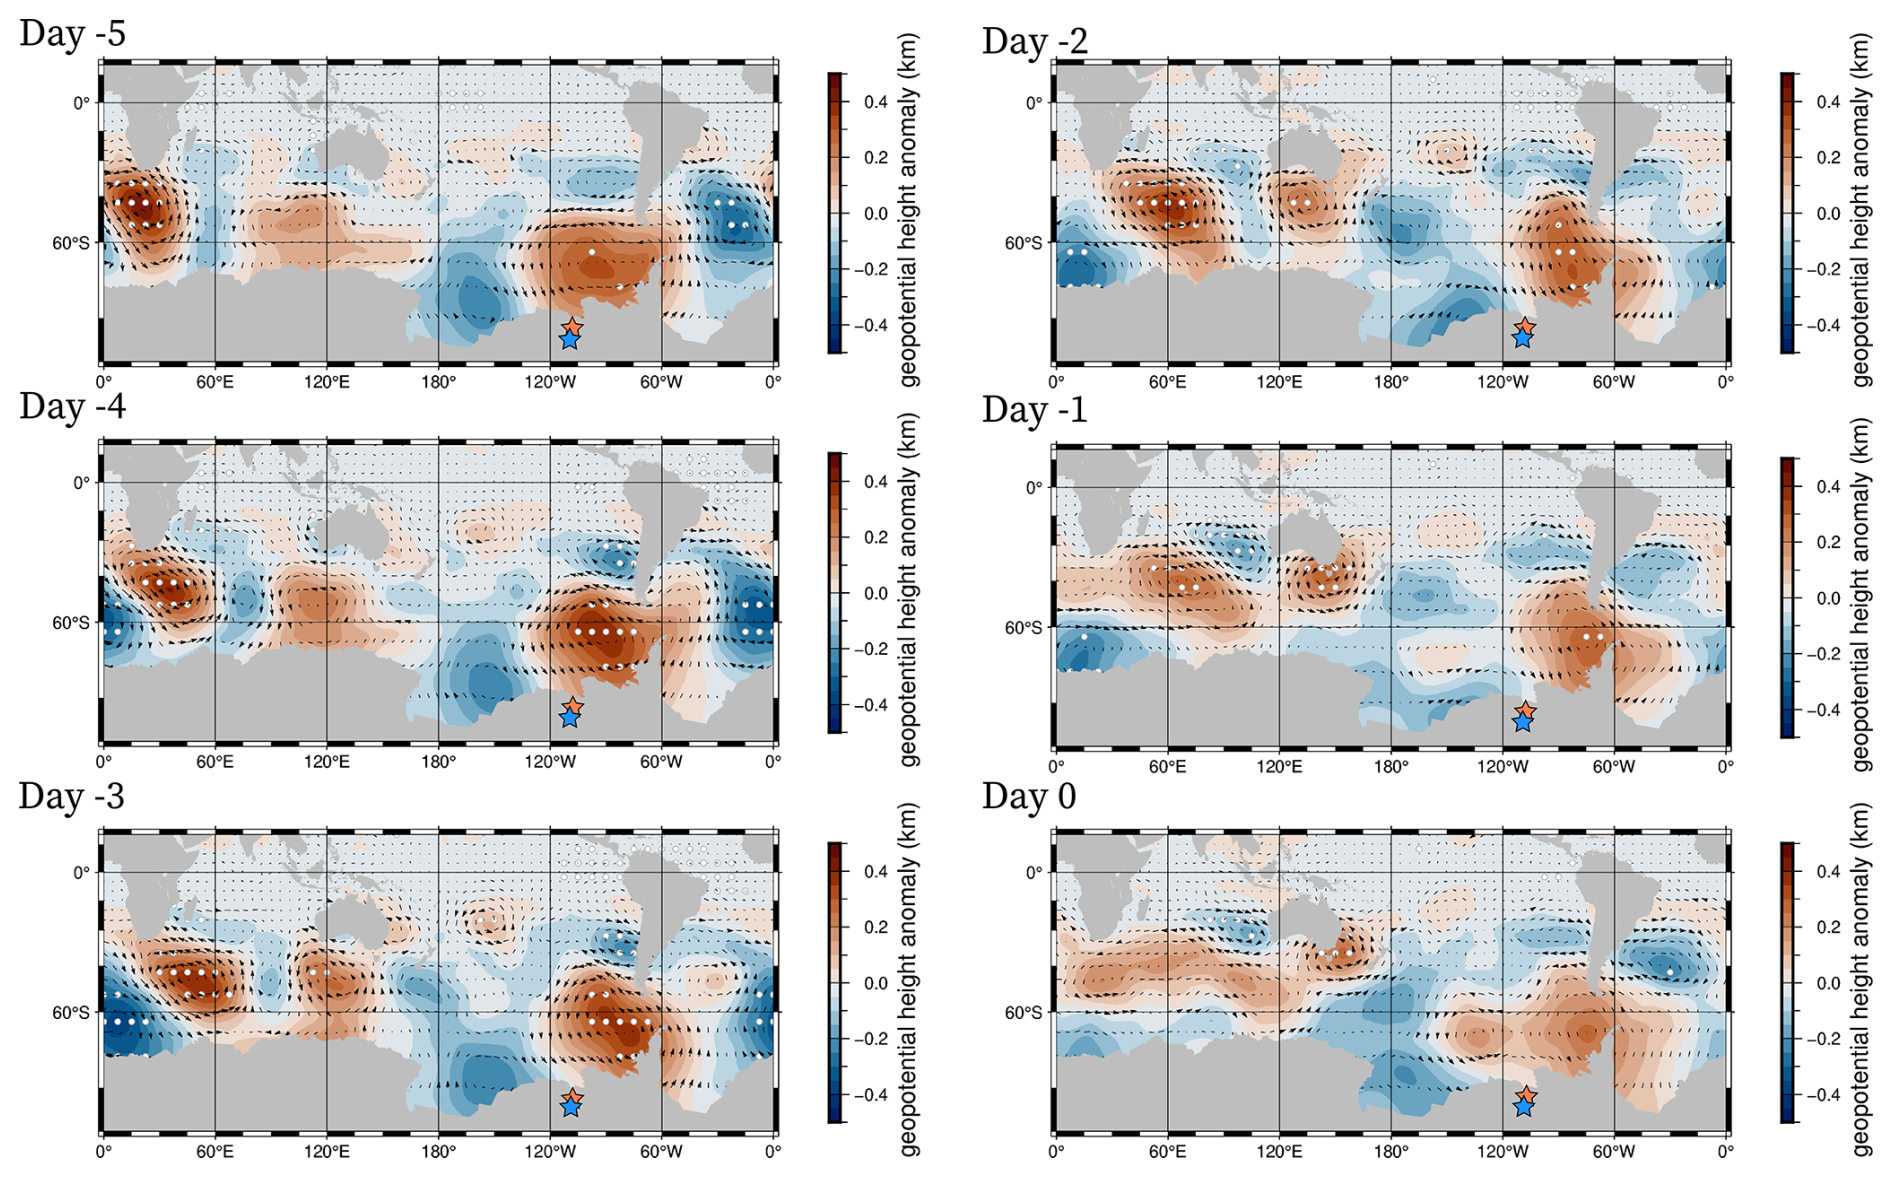
Figure 12Austral winter geopotential height composite anomalies at the 500 hPa pressure level. The numbering of the days indicates the days before the extreme precipitation event observed at the GNSS-IR stations located on Thwaites Glacier, which are plotted as orange and blue stars.
The character of the Amundsen Sea Low, specifically the magnitude of the low-pressure anomaly and the location of the anomaly, has historically been the climatological index most well linked to accumulation variability in the Amundsen Sea Embayment and has been used to suggest connections between synoptic atmospheric variability and West Antarctic precipitation. These indices represent a mean anomaly integrating pressure variations over many days and many different synoptic conditions, which complicates the interpretation and attribution of signals that might promote extreme events. Chittella et al. (2022) showed that the second principal component of the geopotential height at 850 hPa, which is correlated to the 500 hPa geopotential height analyzed in our study, is highly correlated (r2=0.9) with the zonal position of the Amundsen Sea Low and explains 43 % of the extreme precipitation events observed over this period. Our data, in conjunction with interpretations of regional reanalysis and other studies that use similar reanalysis products (Maclennan and Lenaerts, 2021; Chittella et al., 2022), suggest blocking highs in the Bellingshausen Sea drive extreme vapor transport into the West Antarctic interior (Figs. 10, 7, and 8). This pattern has previously been shown to be responsible for high-snowfall events over Thwaites Glacier (Maclennan and Lenaerts, 2021; Chittella et al., 2022), and these reanalysis studies agree with accumulation observations from GNSS interferometric reflectometry presented here, though, in general, reanalysis underestimates extreme event frequency.
The GNSS-IR time series suggests that enhanced snowfall events observed in the ASE are associated with the blocking of the westerly polar jet stream and resulting perturbations in the composite integrated water vapor transport. Patterns in vapor transport anomalies associated with extreme precipitation on Thwaites Glacier suggest that the polar storm track is blocked and that storms are rerouted poleward with distinct southward transport toward the Amundsen Sea. This is similar to the behavior observed over Greenland in the Northern Hemisphere, where mid-latitude high-pressure systems over Europe and the eastern Atlantic have been observed to divert storm tracks that then promote snowfall over Greenland (Pettersen et al., 2022).
Blocking in the Amundsen and Bellingshausen seas exhibits a seasonal cycle that may explain the frequency of extreme precipitation, which controls over half of the total accumulation we observe with GNSS-IR in the Amundsen Sea Embayment. Indeed, 40 % of extreme precipitation events were accompanied by blocking in the Amundsen and Bellingshausen sectors, and blocking frequency anomalies associated with extreme precipitation become more significant in summer and spring when blocking is generally less frequent than in winter. Increases in winter extreme precipitation event frequency compared to summer appear to be the result of Rossby wave breaking from convection northwest of the Amundsen and Bellingshausen seas in the Atlantic, Indian, and western Pacific Ocean basins. These Rossby waves form a low-pressure anomaly to the west of Thwaites Glacier and a high-pressure anomaly to the east of Thwaites Glacier, funneling moisture from the tropics between the cyclone and anticyclone. In the austral summer, extratropical Rossby wave propagation still appears to play a role in routing moisture to the Amundsen Sea; however, the anomaly associated with the blocking high-pressure system in the Bellingshausen and Amundsen seas extends further westward than the austral winter high-pressure system. This is consistent with Rossby wave propagation from the central Pacific and the significant positive sea surface temperature anomalies observed there preceding extreme summer precipitation.
Previous numerical modeling experiments investigating tropical teleconnections to the Southern Hemisphere have suggested that Rossby wave propagation to the Amundsen Sea is driven primarily from the Indian and Atlantic basins northwest of the Amundsen Sea (Li et al., 2014; Simpkins et al., 2014; Li et al., 2015). Li et al. (2015) used idealized CAM4 simulations to show that anomalous convection events in the extratropical ocean basins in the Southern Hemisphere promote Rossby wave propagation that sums linearly in the southern Pacific Ocean. This complicates connecting the pressure anomalies and mechanisms that promote blocking in the Amundsen Sea to Rossby wave source mechanisms from specific basins. There are likely contributions from many different basins. This may explain the more complex pressure anomaly pattern observed in the summer when extreme precipitation is preceded by positive sea surface temperature anomalies in the central and western Pacific Ocean in addition to the Indian Ocean. During our study period, the pressure anomalies in winter, when it snows the most in the Amundsen Sea, resemble Rossby wave trajectories initiated from the subtropical Atlantic. Li et al. (2014) found the trajectory of the Rossby wave ray path to be similar in all seasons, first propagating poleward from the subtropical South Atlantic until waves were reflected by weak vorticity gradients in the polar region. In the austral summer, Li et al. (2015) found that rays continue propagating poleward until they dissipate at high latitudes; in austral winter, however, the rays interact with a second reflecting surface created by anticyclonic shear associated with the poleward flank of the subtropical jet and the equatorial flank of the mid-latitude jet stream. This reflecting surface is sufficiently strong in idealized model representations of Rossby wave propagation to steer the ray path of the waves to the Amundsen/Bellingshausen region. Significant sea surface temperature composite anomalies observed in the Atlantic and western Indian Ocean preceding extreme precipitation are consistent with the propagation paths of eastward propagating Rossby waves modeled in the Southern Ocean (Li et al., 2015).
The advection of moist air masses by blocking anticyclones leads to precipitation in West Antarctica and represents the dominant positive contribution to the Amundsen Sea Embayment surface mass balance. The anomalously warm 2 m air temperatures and water vapor transport along the coast of the continent also suggest that these pressure systems promote the transport of warm air and clouds that can insulate the continent when the snow is deposited. This has implications for the interpretation of ice cores in West Antarctica and the assimilation of ice-core data into paleoclimate reanalyses because the fractionation of isotopes is typically related to the local temperature of the precipitating cloud. The seasonality in accumulation we observe in the GNSS-IR time series and reanalysis suggests that austral winter conditions and associated inferences of atmospheric temperature are sampled more than austral summer conditions in firn and ice cores. Our results also suggest that archives from West Antarctica for all seasons are likely biased toward the conditions associated with extreme precipitation.
The blocking pressure field that has been identified here and in previous studies as promoting extreme precipitation has also been connected to melting in West Antarctica and may increase the likelihood of rainfall instead of snowfall at the surface as this sector warms (Niwano et al., 2021). At present, the processes contributing water to the near-surface cannot sustain a perennial firn aquifer, and melt refreezes due to the cold content of the firn. Meltwater refreezing raises the temperature of firn, which can promote additional surface melt in successive events. Meltwater production and refreezing also deplete the firn air content, which has preceded hydrofracture-induced ice-shelf breakup on the Antarctic Peninsula. Changes in the firn air content associated with melting and strain-induced thinning have poorly constrained impacts on the future integrity and susceptibility of the near-surface to hydrofracture and deserve further study.
Another important implication of this work is the key role of processes that are poorly captured in general circulation models, which do not reproduce the recent increasing trend in geopotential heights in the Amundsen and Bellingshausen seas and tend to underestimate extreme event frequency and blocking frequency in the broader southern Pacific region. This contributes to inaccuracies in the simulation of West Antarctic snowfall in general circulation models. These models can also have biases associated with meridional integrated water vapor transport that underestimate snow accumulation in polar regions (Espinoza et al., 2018; Guan and Waliser, 2017). In agreement with Emanuelsson et al. (2018), our study suggests that in order to accurately model snowfall over West Antarctica and, in particular, the surface mass balance of Thwaites Glacier, atmospheric blocking, moisture transport, and precipitation processes must be properly simulated.
Spatially sparse in situ meteorological observations of snowfall in Antarctica are an impediment to assessing mechanisms responsible for extreme snowfall in the ASE and the quality of snow accumulation simulated in climate reanalysis products. GNSS-IR inverse methods quantify surface mass balance and should be applied more broadly to GNSS networks in Greenland and Antarctica. These new techniques are advantageous compared to conventional automatic weather stations (AWSs) in several ways: (1) they require less equipment and power than AWSs; (2) the observations represent a larger surface area and are less likely to be biased by the station installation itself; (3) these measurements can be made on GNSS sites that are deployed for other reasons, such as ice dynamic and solid Earth studies; and (4) there exist a wealth of historical GNSS data that could be reprocessed to produce accumulation time series from GNSS-IR. In this study, we use GNSS-IR to derive accumulation records for the long-term on-ice GNSS sites located in the ASE along with two austral summers of campaign GNSS data. The GNSS-IR accumulation records reveal that precipitation on Thwaites Glacier is most frequent and intense in the austral winter (30 % to 50 % higher), with a peak accumulation in August that tapers into the austral summer to a minimum in January. The seasonal cycle is driven primarily by changes in the frequency of extreme precipitation events, which make up over half of total precipitation in the Amundsen Sea.
We use the GNSS-IR snow accumulation time series to investigate the synoptic atmospheric conditions that promote vapor transport and extreme precipitation in the Amundsen Sea Embayment. We find that blocking plays an important role in driving extreme precipitation. The connection between seasonal blocking in the southeastern Pacific and precipitation events in West Antarctica has important implications for the mass balance of vulnerable outlet glaciers located in the Amundsen Sea Embayment. We find that accumulation in the Amundsen Sea varies seasonally and interannually and that much of this change can be explained by the presence of blocking high-pressure systems that promote extratropical cyclonic activity and vapor transport to the Amundsen Sea. This suggests that atmospheric blocking, moisture transport, and precipitation processes must be properly simulated in order to accurately model snowfall and surface mass balance over West Antarctica.
A1 Blocking catalog
Atmospheric blocking is associated with stable shifts in the position of persistent high-pressure systems, which can impact the track of cyclonic storm systems. Blocking describes many different states of the atmosphere, and thus many different methods have been developed to identify and track blocking events from reanalysis data (Schwierz et al., 2004; Barriopedro et al., 2010). We use the absolute geopotential height (AGP) reversal-based blocking index to identify blocking highs and track their evolution between 40 and 90° S, with a spatial overlap of a least 5 d based on the reversal of the geopotential height gradient at 500 hPa. The index was first implemented by Steinfeld and Pfahl (2019) and is a two-dimensional extension of the classical blocking index developed by Tibaldi and Molteni (1990), which follows from the description of Rex (1950).
A2 Atmospheric river catalog
We also catalog the atmospheric rivers that made landfall in the ASE between 1979 and 2021. Atmospheric rivers were identified using vertical integrals of specific humidity and horizontal wind from ERA5 to calculate total integrated vapor transport (IVT):
where q is specific humidity, u is the zonal horizontal wind component, v is the meridional horizontal wind component, p is pressure, and g is the terrestrial gravitational constant. A catalog of events was created using a threshold value defined monthly for each grid cell. This detection scheme first identified the 98th percentile of total IVT over a 5-month period centered on the month to be cataloged for each cell. The landfall location was then identified based on the intersection of the IVT anomaly with the Antarctic coastline. The axis of the IVT anomaly was calculated following Brands et al. (2017) and then was used to determine the length and aspect ratio of the anomaly along with the mean IVT direction and the mean IVT magnitude. Events were then filtered based on their geometry and the magnitude of the meridional component of IVT relative to a poleward threshold value. IVT Anomalies are considered atmospheric rivers when the meridional to zonal aspect ratio of the IVT anomaly is greater than 2:1 and the meridional component of the IVT anomaly is larger than 100 . The detection algorithm was applied to hourly fields of vertically integrated vapor transport from 1000 to 300 hPa pressure levels to create an atmospheric river time series from 2008 to 2022 when continuous GNSS data on Thwaites Glacier were also available. Detected atmospheric river events presented here agree well with other catalogs made using similar methods (Wille et al., 2021).
Inverse methods are available at https://doi.org/10.5281/zenodo.14807378 (Hoffman, 2025). GNSS reflection processing code is available at https://doi.org/10.5281/zenodo.5601495 (Larson, 2021).
A video of the accumulation event observed in the 2007–2008 summer is available at https://doi.org/10.5446/62769 (Hoffman, 2023).
The supplement related to this article is available online at https://doi.org/10.5194/tc-19-713-2025-supplement.
AOH, MLM, and JL theorized the study. AOH wrote the GNSS-IR accumulation inverse package, wrote the atmospheric river event detection algorithm, and implemented the blocking algorithm; MLM derived the accumulation histories from reanalysis for each of the GNSS sites; KML wrote the GNSS-IR processing package. All authors contributed to the drafting and editing of the manuscript.
The contact author has declared that none of the authors has any competing interests.
Publisher's note: Copernicus Publications remains neutral with regard to jurisdictional claims made in the text, published maps, institutional affiliations, or any other geographical representation in this paper. While Copernicus Publications makes every effort to include appropriate place names, the final responsibility lies with the authors.
We thank Terry Wilson and the UNAVCO/POLENET teams for maintaining the GPS sites, particularly Joe Pettit, Marianne Okal, Thomas Nylon, and Nico Bayou. The work was supported by a NASA FINESST award (grant no. 80NSSC20K1627), the NASA sea-level change team (grant no. 80NSSC17K0698), and the NSF–NERC International Thwaites Glacier Collaboration (grant no. OPP-1738934). NOAA Interpolated outgoing longwave radiation (OLR) data and NOAA interpolated daily sea surface temperature (SST) data are provided by the NOAA PSL, Boulder, Colorado, USA, from their website at https://psl.noaa.gov (last access: May 2023). We also recognize the efforts of and thank the folks who maintain and post-ERA5 reanalysis products.
The work was supported by a NASA FINESST award (grant no. 80NSSC20K1627), the NASA sea-level change team (grant no. 80NSSC17K0698), and the NSF–NERC International Thwaites Glacier Collaboration (grant no. OPP-1738934).
This paper was edited by Franziska Koch and reviewed by Daniel Emanuelsson and Alessandra Borghi.
Adusumilli, S., Fish, M., Fricker, H. A., and Medley, B.: Atmospheric River Precipitation Contributed to Rapid Increases in Surface Height of the West Antarctic Ice Sheet in 2019, Geophys. Res. Lett., 48, e2020GL091076, https://doi.org/10.1029/2020gl091076, 2021. a
Baines, P. G. and Fraedrich, K.: Topographic effects on the mean tropospheric flow patterns around Antarctica, J. Atmos. Sci., 46, 3401–3415, 1989. a
Barletta, V. R., Bevis, M., Smith, B. E., Wilson, T., Brown, A., Bordoni, A., Willis, M., Khan, S. A., Rovira-Navarro, M., Dalziel, I., Smalley Jr., R., Kendrick, E., Konfal, S., Caccamise II, J. D., Nyblade, A., and Wiens, D.: Observed rapid bedrock uplift in Amundsen Sea Embayment promotes ice-sheet stability, Science, 360, 1335–1339, 2018. a
Barriopedro, D., García-Herrera, R., and Trigo, R. M.: Application of blocking diagnosis methods to General Circulation Models. Part I: a novel detection scheme, Clim. Dynam., 35, 1373–1391, https://doi.org/10.1007/s00382-010-0767-5, 2010. a
Brands, S., Gutiérrez, J. M., and San-Martín, D.: Twentieth-century atmospheric river activity along the west coasts of Europe and North America: algorithm formulation, reanalysis uncertainty and links to atmospheric circulation patterns, Clim. Dynam., 48, 2771–2795, https://doi.org/10.1007/s00382-016-3095-6, 2017. a
Chen, G.: GPS kinematic positioning for the airborne laser altimetry at Long Valley, California, Ph.D. thesis, Massachusetts Institute of Technology, 1998. a
Chittella, S. P. S., Deb, P., and Wessem, J. M. v.: Relative Contribution of Atmospheric Drivers to “Extreme” Snowfall Over the Amundsen Sea Embayment, Geophys. Res. Lett., 49, e2022GL098661, https://doi.org/10.1029/2022gl098661, 2022. a, b, c, d
Christian, J. E., Robel, A. A., Proistosescu, C., Roe, G., Koutnik, M., and Christianson, K.: The contrasting response of outlet glaciers to interior and ocean forcing, The Cryosphere, 14, 2515–2535, https://doi.org/10.5194/tc-14-2515-2020, 2020. a
Connolley, W. M.: Variability in annual mean circulation in southern high latitudes, Clim. Dynam., 13, 745–756, https://doi.org/10.1007/s003820050195, 1997. a, b, c
Davison, B. J., Hogg, A. E., Rigby, R., Veldhuijsen, S., van Wessem, J. M., van den Broeke, M. R., Holland, P. R., Selley, H. L., and Dutrieux, P.: Sea level rise from West Antarctic mass loss significantly modified by large snowfall anomalies, Nat. Commun., 14, 1479, https://doi.org/10.1038/s41467-023-36990-3, 2023. a, b
Dawson, A.: Windspharm: A high-level library for global wind field computations using spherical harmonics, J. Open Res. Softw., 4, Software Sustainability Institute, 2016. a
Ding, Q., Steig, E. J., Battisti, D. S., and Wallace, J. M.: Influence of the tropics on the southern annular mode, J. Climate, 25, 6330–6348, 2012. a, b
Emanuelsson, B. D., Bertler, N. A. N., Neff, P. D., Renwick, J. A., Markle, B. R., Baisden, W. T., and Keller, E. D.: The role of Amundsen–Bellingshausen Sea anticyclonic circulation in forcing marine air intrusions into West Antarctica, Clim. Dynam., 51, 3579–3596, https://doi.org/10.1007/s00382-018-4097-3, 2018. a, b, c
Espinoza, V., Waliser, D. E., Guan, B., Lavers, D. A., and Ralph, F. M.: Global Analysis of Climate Change Projection Effects on Atmospheric Rivers, Geophys. Res. Lett., 45, 4299–4308, https://doi.org/10.1029/2017gl076968, 2018. a
Fogt, R. L., Wovrosh, A. J., Langen, R. A., and Simmonds, I.: The characteristic variability and connection to the underlying synoptic activity of the Amundsen‐Bellingshausen Seas Low, J. Geophys. Res.-Atmos., 117, D7, https://doi.org/10.1029/2011jd017337, 2012. a, b
Frezzotti, M., Scarchilli, C., Becagli, S., Proposito, M., and Urbini, S.: A synthesis of the Antarctic surface mass balance during the last 800 yr, The Cryosphere, 7, 303–319, https://doi.org/10.5194/tc-7-303-2013, 2013. a
Gelaro, R., McCarty, W., Suárez, M. J., Todling, R., Molod, A., Takacs, L., Randles, C. A., Darmenov, A., Bosilovich, M. G., Reichle, R., Wargan, K., Coy, L., Cullather, R., Draper, C., Akella, S., Buchard, V., Conaty, A., da Silva, A. M., Gu, W., Kim, G.-K., Koster, R., Lucchesi, R., Merkova, D., Nielsen, J. E., Partyka, G., Pawson, S., Putman, W., Rienecker, M., Schubert, S. D., Sienkiewicz, M., and Zhao, B.: The Modern-Era Retrospective Analysis for Research and Applications, Version 2 (MERRA-2), J. Climate, 30, 5419–5454, https://doi.org/10.1175/JCLI-D-16-0758.1, 2017. a
Guan, B. and Waliser, D. E.: Atmospheric rivers in 20 year weather and climate simulations: A multimodel, global evaluation, J. Geophys. Res.-Atmos., 122, 5556–5581, https://doi.org/10.1002/2016jd026174, 2017. a
Hersbach, H., Bell, B., Berrisford, P., Hirahara, S., Horányi, A., Muñoz‐Sabater, J., Nicolas, J., Peubey, C., Radu, R., Schepers, D., Simmons, A., Soci, C., Abdalla, S., Abellan, X., Balsamo, G., Bechtold, P., Biavati, G., Bidlot, J., Bonavita, M., Chiara, G., Dahlgren, P., Dee, D., Diamantakis, M., Dragani, R., Flemming, J., Forbes, R., Fuentes, M., Geer, A., Haimberger, L., Healy, S., Hogan, R. J., Hólm, E., Janisková, M., Keeley, S., Laloyaux, P., Lopez, P., Lupu, C., Radnoti, G., Rosnay, P., Rozum, I., Vamborg, F., Villaume, S., and Thépaut, J.: The ERA5 global reanalysis, Q. J. Roy. Meteor. Soc., 146, 1999–2049, https://doi.org/10.1002/qj.3803, 2020. a, b
Hoffman, A.: Snow accumulation event observed with GNSS-IR on Thwaites Glacier, TIB AV-Portal [video], https://doi.org/10.5446/62769, 2023. a, b
Hoffman, A.: hoffmaao/thwaites-gnss-ir: surface accumulation from GNSS-IR (v1.0.0), Zenodo [code], https://doi.org/10.5281/zenodo.14807378, 2025. a
Hoffman, A. O., Christianson, K., Shapero, D., Smith, B. E., and Joughin, I.: Brief communication: Heterogenous thinning and subglacial lake activity on Thwaites Glacier, West Antarctica, The Cryosphere, 14, 4603–4609, https://doi.org/10.5194/tc-14-4603-2020, 2020. a, b
Holton, J. R.: An introduction to dynamic meteorology, Am. J. Phys., 41, 2004. a
Hosking, J. S., Orr, A., Marshall, G. J., Turner, J., and Phillips, T.: The Influence of the Amundsen–Bellingshausen Seas Low on the Climate of West Antarctica and Its Representation in Coupled Climate Model Simulations, J. Climate, 26, 130315144221005, https://doi.org/10.1175/jcli-d-12-00813.1, 2013. a, b, c
Joughin, I., Tulaczyk, S., Bamber, J. L., Blankenship, D., Holt, J. W., Scambos, T., and Vaughan, D. G.: Basal conditions for Pine Island and Thwaites Glaciers, West Antarctica, determined using satellite and airborne data, J. Glaciol., 55, 245–257, https://doi.org/10.3189/002214309788608705, 2009. a
Kaspari, S., Mayewski, P. A., Dixon, D. A., Spikes, V. B., Sneed, S. B., Handley, M. J., and Hamilton, G. S.: Climate variability in West Antarctica derived from annual accumulation-rate records from ITASE firn/ice cores, Ann. Glaciol., 39, 585–594, https://doi.org/10.3189/172756404781814447, 2004. a, b
King, M.: Rigorous GPS data-processing strategies for glaciological applications, J. Glaciol., 50, 601–607, https://doi.org/10.3189/172756504781829747, 2004. a, b
Lachlan-Cope, T. and Connolley, W.: Teleconnections between the tropical Pacific and the Amundsen-Bellinghausens Sea: Role of the El Niño/Southern Oscillation, J. Geophys. Res.-Atmos., 111, D23101, https://doi.org/10.1029/2005JD006386, 2006. a, b
Lachlan‐Cope, T. A., Connolley, W. M., and Turner, J.: The role of the non‐axisymmetric antarctic orography in forcing the observed pattern of variability of the Antarctic climate, Geophys. Res. Lett., 28, 4111–4114, https://doi.org/10.1029/2001gl013465, 2001. a, b
Larson, K. M.: kristinemlarson/gnssrefl: First release (1.0.10), Zenodo [code], https://doi.org/10.5281/zenodo.5601495, 2021. a
Larson, K. M., Gutmann, E. D., Zavorotny, V. U., Braun, J. J., Williams, M. W., and Nievinski, F. G.: Can we measure snow depth with GPS receivers?, Geophys. Res. Lett., 36, L17502, https://doi.org/10.1029/2009GL039430, https://doi.org/10.1029/2009gl039430, 2009. a
Larson, K. M., Wahr, J., and Munneke, P. K.: Constraints on snow accumulation and firn density in Greenland using GPS receivers, J. Glaciol., 61, 101–114, https://doi.org/10.3189/2015jog14j130, 2015. a, b, c
Larson, K. M., MacFerrin, M., and Nylen, T.: Brief Communication: Update on the GPS reflection technique for measuring snow accumulation in Greenland, The Cryosphere, 14, 1985–1988, https://doi.org/10.5194/tc-14-1985-2020, 2020. a
Lazzara, M. A., Weidner, G. A., Keller, L. M., Thom, J. E., and Cassano, J. J.: Antarctic Automatic Weather Station Program: 30 Years of Polar Observation, B. Am. Meteorol. Soc., 93, 1519–1537, https://doi.org/10.1175/BAMS-D-11-00015.1, 2012. a, b
Li, X., Holland, D. M., Gerber, E. P., and Yoo, C.: Impacts of the north and tropical Atlantic Ocean on the Antarctic Peninsula and sea ice, Nature, 505, 538–542, https://doi.org/10.1038/nature12945, 2014. a, b, c
Li, X., Gerber, E. P., Holland, D. M., and Yoo, C.: A Rossby Wave Bridge from the Tropical Atlantic to West Antarctica, J. Climate, 28, 2256–2273, https://doi.org/10.1175/jcli-d-14-00450.1, 2015. a, b, c, d, e, f
Li, X., Cai, W., Meehl, G. A., Chen, D., Yuan, X., Raphael, M., Holland, D. M., Ding, Q., Fogt, R. L., Markle, B. R., Wang, G., Bromwich, D. H., Turner, J., Xie, S.-P., Steig, E. J., Gille, S. T., Xiao, C., Wu, B., Lazzara, M. A., Chen, X., Stammerjohn, S., Holland, P. R., Holland, M. M., Cheng, X., Price, S. F., Wang, Z., Bitz, C. M., Shi, J., Gerber, E. P., Liang, X., Goosse, H., Yoo, C., Ding, M., Geng, L., Xin, M., Li, C., Dou, T., Liu, C., Sun, W., Wang, X., and Song, C.: Tropical teleconnection impacts on Antarctic climate changes, Nat. Rev. Earth Environ., 2, 680–698, https://doi.org/10.1038/s43017-021-00204-5, 2021. a, b
Liebmann, B. and Smith, C. A.: Description of a complete (interpolated) outgoing longwave radiation dataset, B. Am. Meteorol. Soc., 77, 1275–1277, 1996. a
Maclennan, M. L. and Lenaerts, J. T. M.: Large‐Scale Atmospheric Drivers of Snowfall Over Thwaites Glacier, Antarctica, Geophys. Res. Lett., 48, e2021GL093644, https://doi.org/10.1029/2021gl093644, 2021. a, b, c, d, e
Maclennan, M. L., Lenaerts, J. T. M., Shields, C., and Wille, J. D.: Contribution of Atmospheric Rivers to Antarctic Precipitation, Geophys. Res. Lett., 49, e2022GL100585, https://doi.org/10.1029/2022gl100585, 2022. a
Medley, B. and Thomas, E. R.: Increased snowfall over the Antarctic Ice Sheet mitigated twentieth-century sea-level rise, Nat. Clim. Change, 9, 34–39, https://doi.org/10.1038/s41558-018-0356-x, 2019. a, b
Niwano, M., Box, J. E., Wehrlé, A., Vandecrux, B., Colgan, W. T., and Cappelen, J.: Rainfall on the Greenland Ice Sheet: Present‐Day Climatology From a High‐Resolution Non‐Hydrostatic Polar Regional Climate Model, Geophys. Res. Lett., 48, e2021GL092942, https://doi.org/10.1029/2021gl092942, 2021. a
Pettersen, C., Henderson, S. A., Mattingly, K. S., Bennartz, R., and Breeden, M. L.: The Critical Role of Euro‐Atlantic Blocking in Promoting Snowfall in Central Greenland, J. Geophys. Res.-Atmos., 127, e2021JD035776, https://doi.org/10.1029/2021jd035776, 2022. a
Pinat, E., Defraigne, P., Bergeot, N., Chevalier, J.-M., and Bertrand, B.: Long-Term Snow Height Variations in Antarctica from GNSS Interferometric Reflectometry, Remote Sens., 13, 1164, https://doi.org/10.3390/rs13061164, 2021. a
Raphael, M. N.: A zonal wave 3 index for the Southern Hemisphere, Geophys. Res. Lett., 31, L23212, https://doi.org/10.1029/2004GL020365, 2004. a, b
Renwick, J. A.: ENSO-related variability in the frequency of South Pacific blocking, Mon. Weather Rev., 126, 3117–3123, 1998. a
Renwick, J. A.: Southern Hemisphere circulation and relations with sea ice and sea surface temperature, J. Climate, 15, 3058–3068, 2002. a, b
Renwick, J. A.: Persistent positive anomalies in the Southern Hemisphere circulation, Mon. Weather Rev., 133, 977–988, 2005. a
Rex, D. F.: Blocking Action in the Middle Troposphere and its Effect upon Regional Climate, Tellus, 2, 275–301, https://doi.org/10.1111/j.2153-3490.1950.tb00339.x, 1950. a
Robel, A. A., Roe, G. H., and Haseloff, M.: Response of Marine‐Terminating Glaciers to Forcing: Time Scales, Sensitivities, Instabilities, and Stochastic Dynamics, J. Geophys. Res.-Earth Surf., 123, 2205–2227, https://doi.org/10.1029/2018jf004709, 2018. a
Roesler, C. and Larson, K. M.: Software tools for GNSS interferometric reflectometry (GNSS-IR), GPS Solutions, 22, 80, https://doi.org/10.1007/s10291-018-0744-8, 2018. a
Schwierz, C., Croci‐Maspoli, M., and Davies, H. C.: Perspicacious indicators of atmospheric blocking, Geophys. Res. Lett., 31, L06125, https://doi.org/10.1029/2003gl019341, 2004. a
Shean, D. E., Christianson, K., Larson, K. M., Ligtenberg, S. R. M., Joughin, I. R., Smith, B. E., Stevens, C. M., Bushuk, M., and Holland, D. M.: GPS-derived estimates of surface mass balance and ocean-induced basal melt for Pine Island Glacier ice shelf, Antarctica, The Cryosphere, 11, 2655–2674, https://doi.org/10.5194/tc-11-2655-2017, 2017. a
Siegfried, M. R., Medley, B., Larson, K. M., Fricker, H. A., and Tulaczyk, S.: Snow accumulation variability on a West Antarctic ice stream observed with GPS reflectometry, 2007–2017, Geophys. Res. Lett., 44, 7808–7816, https://doi.org/10.1002/2017gl074039, 2017. a, b
Simpkins, G. R., McGregor, S., Taschetto, A. S., Ciasto, L. M., and England, M. H.: Tropical Connections to Climatic Change in the Extratropical Southern Hemisphere: The Role of Atlantic SST Trends, J. Climate, 27, 4923–4936, https://doi.org/10.1175/jcli-d-13-00615.1, 2014. a
Sinclair, M. R.: A climatology of anticyclones and blocking for the Southern Hemisphere, Mon. Weather Rev., 124, 245–264, 1996. a
Smith, B., Fricker, H. A., Gardner, A. S., Medley, B., Nilsson, J., Paolo, F. S., Holschuh, N., Adusumilli, S., Brunt, K., Csatho, B., Harbeck, K., Markus, T., Neumann, T., Siegfried, M. R., and Zwally, H. J.: Pervasive ice sheet mass loss reflects competing ocean and atmosphere processes, Science, 368, 1239–1242, https://doi.org/10.1126/science.aaz5845, 2020. a
Steig, E. J., Mayewski, P. A., Dixon, D. A., Kaspari, S. D., Frey, M. M., Schneider, D. P., Arcone, S. A., Hamilton, G. S., Blue Spikes, V., Albert, M., Meese, D., Gow, J. A., Shuman, A. C., White, W. C. J., Sneed, S., Flaherty, J., and Wumkes, M.: High-resolution ice cores from US ITASE (West Antarctica): development and validation of chronologies and determination of precision and accuracy, Ann. Glaciol., 41, 77–84, https://doi.org/10.3189/172756405781813311, 2005. a
Steinfeld, D. and Pfahl, S.: The role of latent heating in atmospheric blocking dynamics: a global climatology, Clim. Dynam., 53, 6159–6180, https://doi.org/10.1007/s00382-019-04919-6, 2019. a
Thomas, E. R., Hosking, J. S., Tuckwell, R. R., Warren, R. A., and Ludlow, E. C.: Twentieth century increase in snowfall in coastal West Antarctica, Geophys. Res. Lett., 42, 9387–9393, https://doi.org/10.1002/2015gl065750, 2015. a, b
Tibaldi, S. and Molteni, F.: On the operational predictability of blocking, Tellus A, 42, 343–365, https://doi.org/10.1034/j.1600-0870.1990.t01-2-00003.x, 1990. a
Trenberth, K. E., Branstator, G. W., Karoly, D., Kumar, A., Lau, N.-C., and Ropelewski, C.: Progress during TOGA in understanding and modeling global teleconnections associated with tropical sea surface temperatures, J. Geophys. Res.-Oceans, 103, 14291–14324, https://doi.org/10.1029/97JC01444, 1998. a
Turner, J., Phillips, T., Hosking, J. S., Marshall, G. J., and Orr, A.: The Amundsen Sea low, Int. J. Climatol., 33, 1818–1829, https://doi.org/10.1002/joc.3558, 2013. a, b, c, d, e
Turner, J., Phillips, T., Thamban, M., Rahaman, W., Marshall, G. J., Wille, J. D., Favier, V., Winton, V. H. L., Thomas, E., Wang, Z., van den Broeke, M., Hosking, J. S., and Lachlan-Cope, T.: The Dominant Role of Extreme Precipitation Events in Antarctic Snowfall Variability, Geophys. Res. Lett., 46, 3502–3511, https://doi.org/10.1029/2018GL081517, 2019. a
van Wessem, J. M., van de Berg, W. J., Noël, B. P. Y., van Meijgaard, E., Amory, C., Birnbaum, G., Jakobs, C. L., Krüger, K., Lenaerts, J. T. M., Lhermitte, S., Ligtenberg, S. R. M., Medley, B., Reijmer, C. H., van Tricht, K., Trusel, L. D., van Ulft, L. H., Wouters, B., Wuite, J., and van den Broeke, M. R.: Modelling the climate and surface mass balance of polar ice sheets using RACMO2 – Part 2: Antarctica (1979–2016), The Cryosphere, 12, 1479–1498, https://doi.org/10.5194/tc-12-1479-2018, 2018. a
Velicogna, I., Mohajerani, Y., A, G., Landerer, F., Mouginot, J., Noel, B., Rignot, E., Sutterley, T., van den Broeke, M., van Wessem, M., and Wiese, D.: Continuity of Ice Sheet Mass Loss in Greenland and Antarctica From the GRACE and GRACE Follow-On Missions, Geophys. Res. Lett., 47, e2020GL087291, https://doi.org/10.1029/2020GL087291, 2020. a
Walsh, K. J., Simmonds, I., and Collier, M.: Sigma-coordinate calculation of topographically forced baroclinicity around Antarctica, Dynam. Atmos. Oceans, 33, 1–29, 2000. a
Wille, J. D., Favier, V., Gorodetskaya, I. V., Agosta, C., Kittel, C., Beeman, J. C., Jourdain, N. C., Lenaerts, J. T. M., and Codron, F.: Antarctic Atmospheric River Climatology and Precipitation Impacts, J. Geophys. Res.-Atmos., 126, e2020JD033788, https://doi.org/10.1029/2020jd033788, 2021. a, b