the Creative Commons Attribution 4.0 License.
the Creative Commons Attribution 4.0 License.
 | 18 Nov 2025
Brief communication: Tides and damage as drivers of lake drainages on Shackleton Ice Shelf
Maaike Izeboud
Sophie de Roda Husman
Bert Wouters
Stef Lhermitte
To investigate the drivers of lake drainages in Antarctica, we analyzed optical remote sensing data from the Shackleton Ice Shelf in East Antarctica over seven melt seasons, 2016 to 2023. Our study identified seven drainage event in 2016–2017, one in 2018–2019, fifteen in 2019–2020, and two in 2020–2021. All identified drainages occurred in regions with relatively medium to high levels of satellite-derived ice shelf damage and, except one, all with active damage development. Additionally, 17 out of 25 drainages coincided with increases in tidal heights. These findings provide insights into the factors influencing current lake drainages in Antarctica in both timing and distribution.
- Article
(4532 KB) - Full-text XML
-
Supplement
(45447 KB) - BibTeX
- EndNote


Surface lake drainage can destabilize ice shelves, occurring either slowly via supraglacial channels or rapidly through crevasses driven by the weight of the water – a process known as hydrofracture (Nye and Perutz, 1957). While Greenland’s lake drainages are relatively well-studied (Williamson et al., 2018a; McMillan et al., 2007), much less is known about similar processes in Antarctica. Understanding when and how surface lakes drain is crucial for assessing ice shelf stability. Previous studies, such as Trusel et al. (2022) have shown that lake drainages on the Amery Ice Shelf are linked to high-amplitude tidal cycles. Moreover, Lai et al. (2020) have shown large areas of Antarctica's ice shelves that are vulnerable to hydrofracturing if (existing) crevasses are inundated with meltwater. However, given the widespread presence of crevasses and other damage features on Antarctic ice shelves, it remains unclear to what extent pre-existing damage influences the likelihood and timing of lake drainage events. Here, we use observations of lake drainage events from remote sensing data to study their place and timing, examining whether damage alone is sufficient to indicate a potential of hydrofracturing, or if additional conditions, such as tidal forcing, are necessary to initiate lake drainage.
In Antarctica, where most surface lakes form near the grounding line, only some of these lakes drain (Stokes et al., 2019; Arthur et al., 2022). However, a more widespread vulnerability to hydrofracturing has been identified by Lai et al. (2020) across Antarctic ice shelves. While crevasses and fractures, required for lakes to drain, are abundant, hydrofracturing or rapid lake drainages are less so. We therefore hypothesize that, apart from using the presence of damage features, another driver is needed to indicate a likelihood for occurring lake drainages. Specifically, we propose that in addition to the presence of visible damage (open crevasses, fractures, and rifts), a measure of the “activeness” of the damage feature (i.e. crevasse opening or propagation) can be used to identify where lake drainages are likely to occur on an ice shelf. High activeness, indicative of crevasse opening, would facilitating new routes for lakes to (suddenly and rapidly) drain, whereas more passive crevasses either prevent the formation of lakes by providing direct runoff for meltwater or might remain stable when inundated with meltwater. Specifically, lakes on undamaged or passively damaged ice shelves may simply refreeze, while those on moderately damaged, active shelves are more likely to drain due to preconditioned fractures that allow meltwater to flow and further destabilize the ice (Lai et al., 2020). On severely damaged ice shelves, where extensive fracturing has already compromised the structure, lakes may not form at all.
The Shackleton Ice Shelf presents an ideal case for further investigation, as it features both draining and non-draining lakes, alongside regions of varying structural damage (Arthur et al., 2020; de Roda Husman et al., 2024). The key questions here are: Where do observations of meltwater ponding and damage overlap? Which meltwater ponds are draining, and under what conditions? Can draining events be traced back to specific triggers, such as the destabilization of pre-existing fractures and/or external forces like tidal flexing? Addressing these questions on the Shackleton Ice Shelf will help clarify the mechanisms behind surface lake drainage and their role in ice shelf destabilization, contributing to a broader understanding of Antarctic ice shelf dynamics.
In this study, we first detect surface lakes on the Shackleton Ice Shelf for the melt seasons of 2016–2017, 2018–2019, 2019–2020, and 2020–2021 using a threshold-based method developed by Moussavi et al. (2020) based on optical imagery. We then identify drainage events by analyzing whether meltwater lakes have disappeared between consecutive images. These drainage events are compared to satellite-derived damage and its estimated activeness of the Shackleton Ice Shelf produced by Izeboud and Lhermitte (2023). Additionally, we examine the timing of the drainage events in relation to tidal height using a tidal model (Padman et al., 2002). By integrating these data, we aim to reveal how ice shelf conditions influence the dynamics of surface lake drainage.
This study utilizes multi-source satellite imagery and a tidal height simulation model to investigate rapid lake drainages on ice shelves. We employ detection methods for lake extent and volume, lake drainages, and damage, integrating their outputs to analyze spatial distribution patterns. Satellite image access and initial processing are conducted through the Google Earth Engine (GEE) platform.
2.1 Satellite Imagery
Optical imagery is used to identify supraglacial lakes and drainage events. Sentinel-2 Level-1C (S2) and Landsat 8 Collection 2 Tier 2 TOA reflectance (L8) images are assessed via GEE and filtered by a maximum cloud coverage of 30 % and minimum sun elevation of 20°, following a similar approach as Tuckett et al. (2021). Median image mosaics are produced over time periods of 8 days for L8 and 10 days for S2 by taking the pixel-wise median value of all images within the respective period – stitching and combining individual overpasses into one domain-covering image – with resolutions of 30 m and 10 m, respectively. For the 2018–2019, 2019–2020, and 2020–2021 melt seasons, each November to March, the mosaics are sorted by their assigned date, which is defined as halfway between first and latest date of all containing images.
Synthetic aperture radar (SAR) data is utilized for damage detection in the same year as the lake detection. Sentinel-1 GRD (S1) images (instrument mode: “EW” and polarization: “HH”) are used, with images collected between 1 and 10 November to minimize the influence of meltwater on damage detection. S1 images are processed individually to detect damage and combined in postprocessing to generate one damage map per year (see Sect. 2.4).
Ice flow velocity observations for 2019 are sourced from the ITS_LIVE campaign (Gardner et al., 2020) and used for the calculation of the activeness metric (Sect. 2.4). The ice flow velocity data is downsampled from its original resolution of 240 m to a resolution of 300 m using an average resampling method.
The grounding line and ice shelf front are obtained from Gerrish et al. (2022).
2.2 Supraglacial Lake Detection and Lake Volume Calculation
The location and depth of supraglacial lakes are determined using a threshold-based method on the collected mosaics. Moussavi et al. (2020) developed the method and thresholds, which are further refined and automated by Tuckett et al. (2021). Their method involves combining different bands of the satellite images, applying thresholds to obtain masks for meltwater, rocks and clouds, and finally estimating the depth by taking into account albedo and reflectance of water. These steps are executed within GEE, and produce meltwater lake masks and meltwater depth output. The lake volume is then obtained by multiplying the depths with their respective pixel areas (Pope et al., 2016). Outliers are removed in a subsequent step if they are not located on ice mass or have a misinterpreted depth of less than 0 m (Williamson et al., 2018a). To minimize noise, lakes with a surface area of less than 1800 m2 (2 or 18 pixels of L8 and S2 imagery, respectively) are removed as suggested by Williamson et al. (2018a). For each melt season, the maximum lake extent is derived by aggregating all lake masks generated during that period.
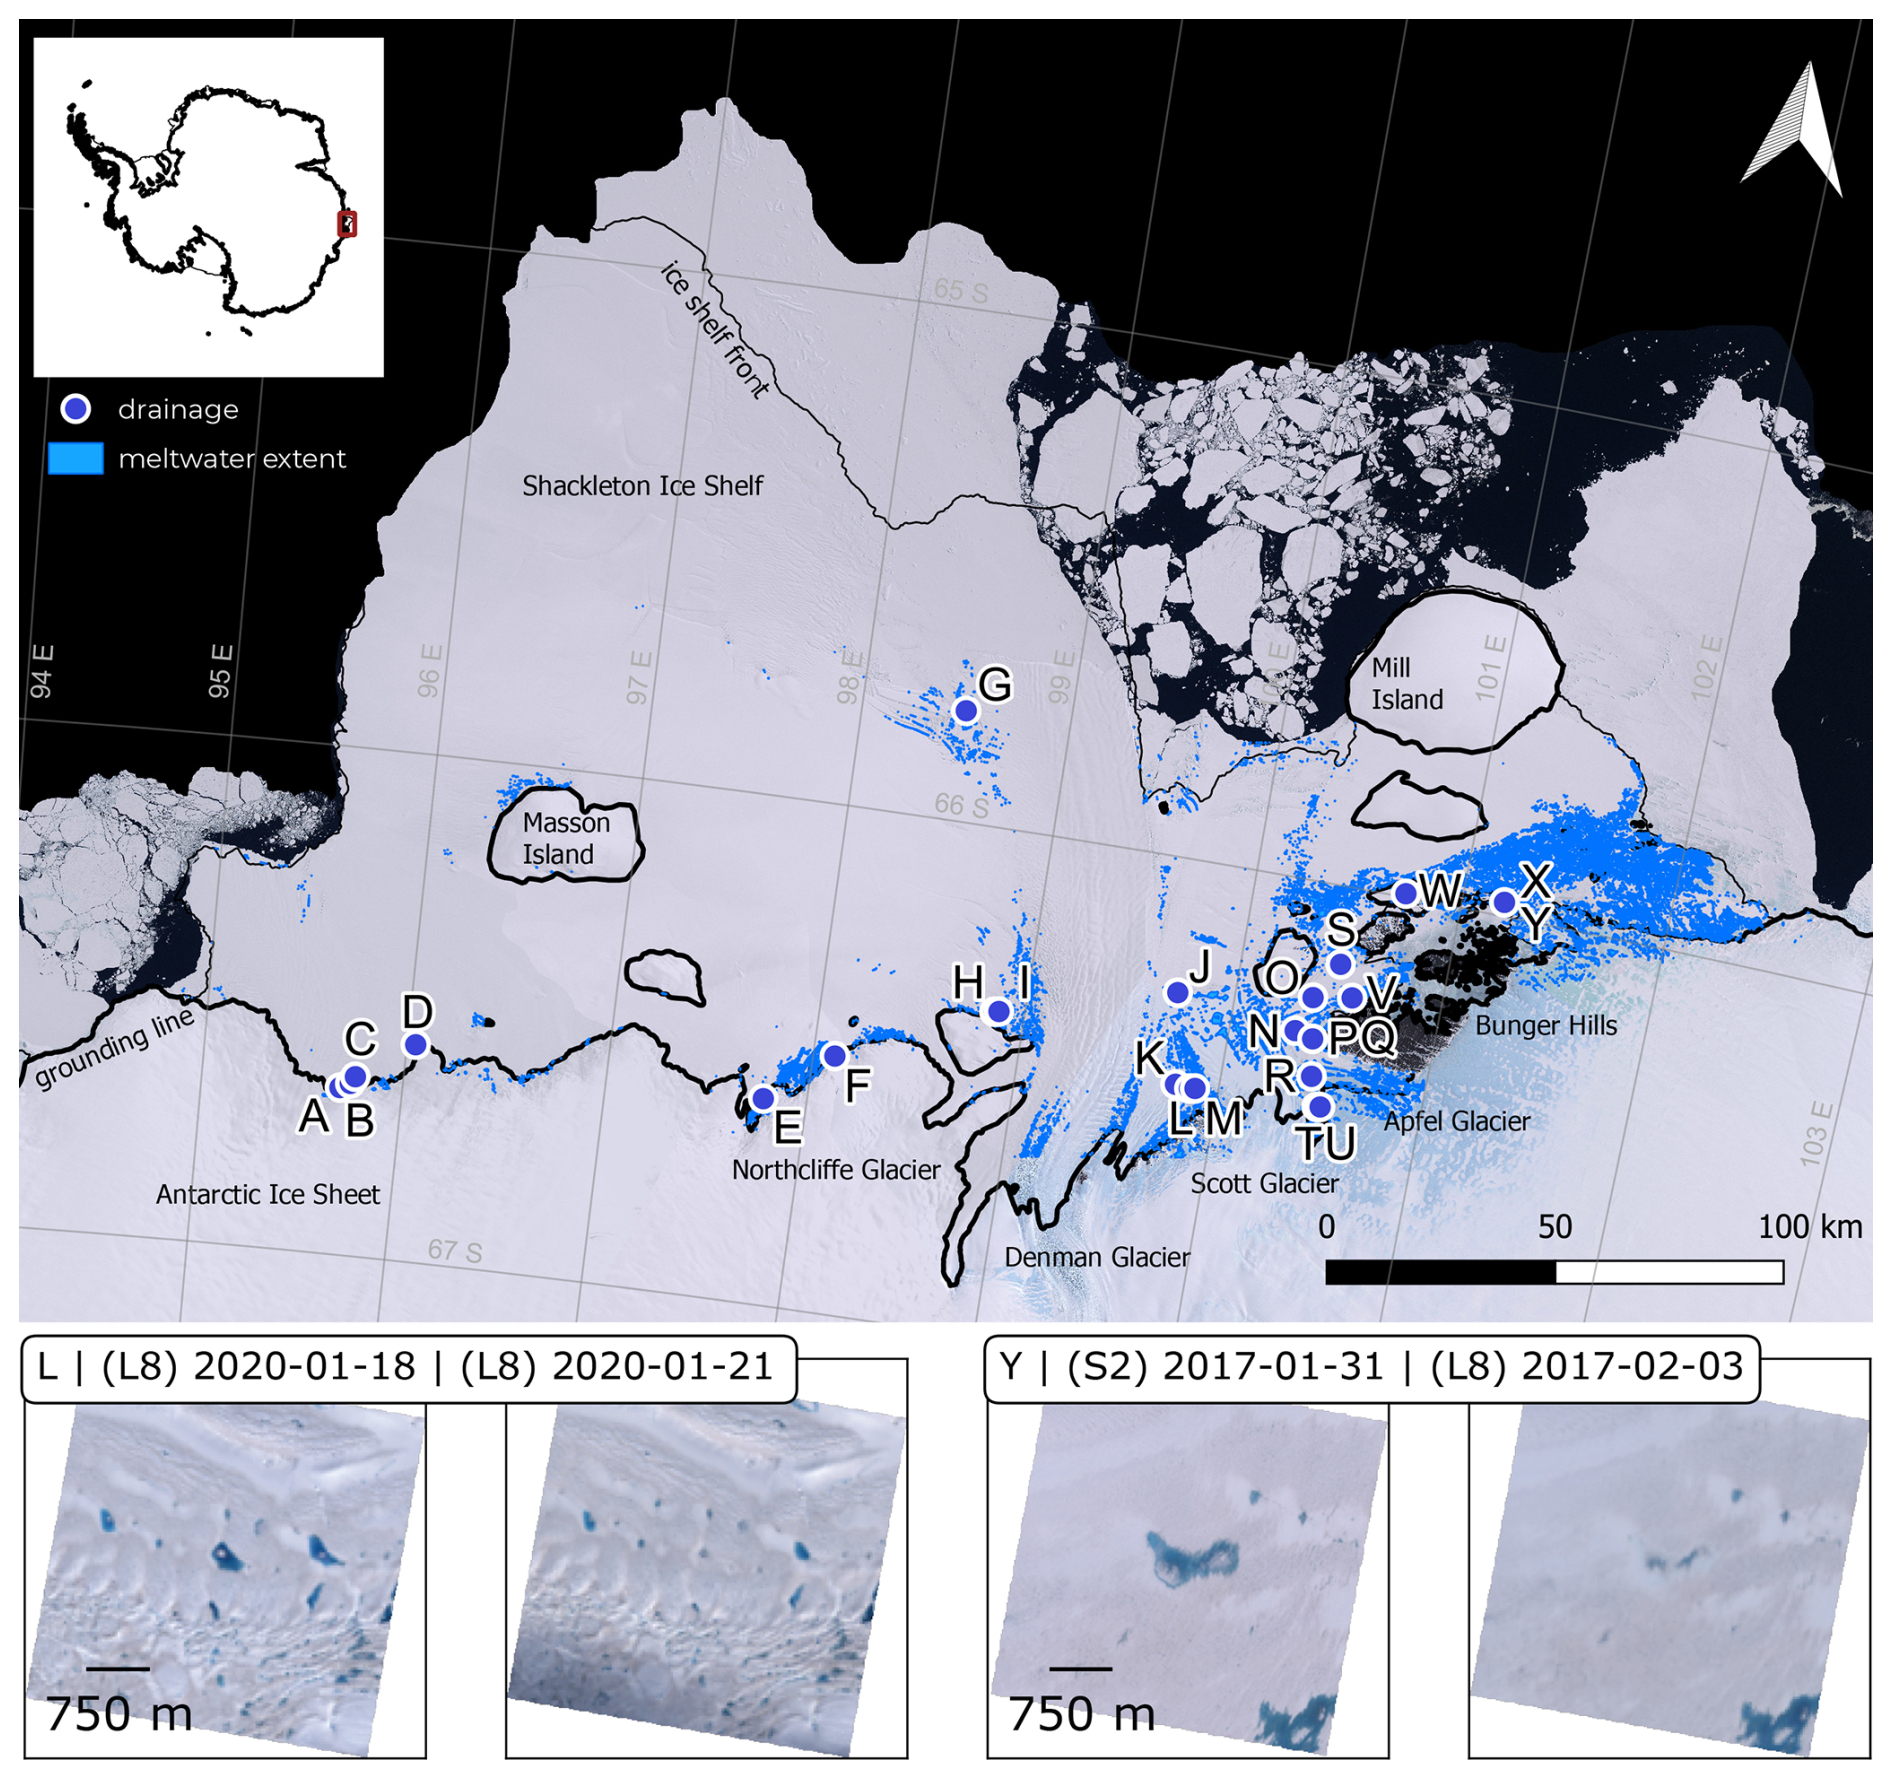
Figure 1Geographic overview of the Shackleton Ice Shelf study area. Background shows the Landsat Image Mosaic of Antarctica (LIMA) by Bindschadler et al. (2008). Inset shows location in East Antarctica. Thick black line: Grounding line. Thin black line: Shelf coastline. Both from the MEaSURES data set by Gerrish et al. (2022). Blue: Maximum meltwater extent 2019/20 based on S2 and L8 observations. Blue markers: Detected drainage events as observed, and collected in Table S3. Bottom row: Two detected drainage events.
2.3 Lake Drainage Detection
To identify lake drainages, the optical time series are analyzed. A drainage event is identified if a supraglacial lake lost at least 80 % of its area between two consecutive images, provided that no more than 10 d elapsed between those images (following Doyle et al., 2013; Miles et al., 2017; Williamson et al., 2017; Arthur et al., 2020). While lower thresholds (e.g. 50 %–70 %) can also indicate partial drainage, our observations suggest that these cases are often ambiguous and more difficult to classify confidently as true drainage events, as surface changes may equally reflect refreezing, snow cover variations, or meltwater redistribution. Therefore, we retain the 80 % criterion as a conservative and literature-consistent threshold.
Further, we only retain those lakes that meet the following conditions: surface area greater than 54 000 m2 (Williamson et al., 2017), median lake depth greater than 0.65 m (Williamson et al., 2018b), standard deviation of lake depth greater than 0.3 (Williamson et al., 2018b), and distance to the nearest masked cloud greater than 500 m. These filtering steps focus on large, deep lakes with a defined depth profile, while avoiding misinterpretations due to faulty cloud masks or blue ice regions.
As a final step, we perform a manual visual inspection of the detected drainage events utilizing all available non-mosaic imagery from L8, and S2. 31 out of 56 events are removed, as they are judged to be refreezing lakes rather than draining lakes.
2.4 Damage Detection and Activeness
The Normalised Radon transform Damage detection (NeRD) method (Izeboud and Lhermitte, 2023) is used to detect surface damage features on the ice shelf from strong linear contrasts in S1 images (line detection). In short, the NeRD method consists of the following steps: (i) create cut-out windows from the image, (ii) apply the Normalised Radon transform to these windows, (iii) extract dominant feature signal strength and orientation for every window, (iv) quantify the damage signal by removing noise from the signal and (v) postprocessing (Izeboud and Lhermitte, 2023). In the post-processing step we clipped the product to the ice shelf bounds. The S1 images are resampled to the same L8 resolution of 30 m and processed with a window size of 10 pixels within the NeRD algorithm, yielding 300 m-resolution damage maps with a damage signal between 0 and 0.5 (low to high damage indication) and their orientation (−90 to 90°). By using the NeRD method, we detect features at the ice shelf surface only – all visible crevasses, fractures and rifts – and group these under the umbrella term “damage”, distinguishing from the damage parameter commonly used in continuum mechanics literature (Sun et al., 2017). Basal crevasses are not explicitly included, but might be detected if their concurrent surface depression is distinct. The damage maps represent the presence of large features (roughly >100 m) within the 300 m range, rather than the delineation of the feature itself.
In addition to detecting the presence of surface damage features, we infer if the features are likely actively developing and opening (“activeness”) or if they are passive (apart from advecting with the ice flow). The obtained damage orientation is used to identify the potential activeness by comparing the damage orientation to local ice flow angle, to infer if the feature is in a position that favors crevasse opening. First, the ice flow velocity was resampled to match the resolution of the detected damage orientation map. Then, an area was considered likely to be “active” if the damage orientation and flow angle have a difference of 45° ± 15°, which occurs mainly in the shear zones of the ice shelf or for mixed mode opening fractures. This way we disfavor large open rifts near the ice front that are perpendicular to the ice flow, which cut completely through the ice and hence do not support lake formation and subsequent lake drainages, as well as other orientations likely representing inactive fractures misaligned with current stress fields (e.g. due to advection) (Colgan et al., 2016). This procedure produces a binary activeness mask (values 0 or 1) at 300 m resolution. new small fracture and basal crevasses. From these observational products we cannot prove causality between individual damage features and specific drainage events. Furthermore, it's possible for the drainage to occurs through a fracture that is not visible in the 300 m maps. We therefore use the damage and activeness maps as an indication of a general structurally weakened ice zone, which we hypothesize to favor lake drainages through undetected or new small fracture and basal crevasses.
For this reason, we downsampled the damage and activeness maps to inspect the overall integrity of the ice for a larger area surrounding drainage events. Both 300 m maps are downsampled with a factor of 10 using an average resampling method, and normalized with their respective maxima, resulting in 3000 m resolution rasters with values between 0 and 1.
2.5 Tidal Heights
To investigate how ocean tides influence drainage events, we utilize the Circum-Antarctic Tidal Simulation (CATS2008) model to compute daily tidal amplitudes. These amplitudes are determined by calculating the difference between the maximum and minimum tidal heights for each day. Due to low tidal amplitude variations across Shackleton ice shelf (Fig. S5, and Padman et al., 2018), the tidal amplitudes for this study are determined at the central location of lake I (Fig. 1). The CATS2008 model is a high-resolution barotropic tide model specifically designed for the Antarctic continental shelf, incorporating bathymetry data from various sources and assimilating tide gauge and satellite altimetry observations to enhance its accuracy. The model solves the depth-integrated shallow water equations on a finite difference grid, accounting for the effects of sea ice cover and ice shelf cavities, which are crucial for accurately representing tidal dynamics in polar regions (Howard et al., 2019; Padman et al., 2002).
During the study period, extensive supraglacial lake extents were detected, with a total surface maxima of 150 km2 for 2016–2017, 213 km2 for 2018–2019, 215 km2 for 2019–2020, and 152 km2 for 2020–2021 (Fig. S1 in the Supplement shows yearly evolution). Notably, summer 2019-2020 has been recognized as a record summer, characterized by unprecedented melt extent and duration, record surface meltwater ponding, and anomalously high air temperatures (Banwell et al., 2021). The meltwater primarily accumulated near the grounding line and between Bunger Hills and Mill Island, a pattern consistent with previous studies (de Roda Husman et al., 2024; Arthur et al., 2020). Saunderson et al. (2022) also noted significant melt in the north of the West-Shackleton ice shelf (north of Masson Island). However, our findings indicate minimal lake formations in this region, suggesting immediate drainage of meltwater into the ocean rather than ponding (Figs. 1 and 2).
Based on these lake masks (Sect. 2.2) and lake drainage detection method (Sect. 2.3), we identify 25 lake drainage events during the study period: seven in the 2016–2017 melt season, one in the 2018–2019 melt season, fifteen in the 2019–2020 melt season, and two in the 2020–2021 melt season (Fig. 2). The fifteen events during the 2019–2020 melt season further exemplify the extreme conditions of that Antarctic summer. Refer to Table S3 for a list of all detected events.
During the remaining melt seasons between 2015 and 2025, no drainage events were detected by the means of the methods employed in this study.
3.1 Lake Drainage Events in Areas of the Ice Shelf with Medium-to-High Damage or Activeness
Activeness and damage distribution on the Shackleton Ice Shelf, including the distribution of lake drainages listed in Table S3 in the Supplement. The limits are indicated as introduced in Table S2. Refer to Sect. 2.4 for details on damage and activeness classifications and for yearly evolution of spatial distributions of damage, activeness and strain refer to Figs. S2, S3, and S4.
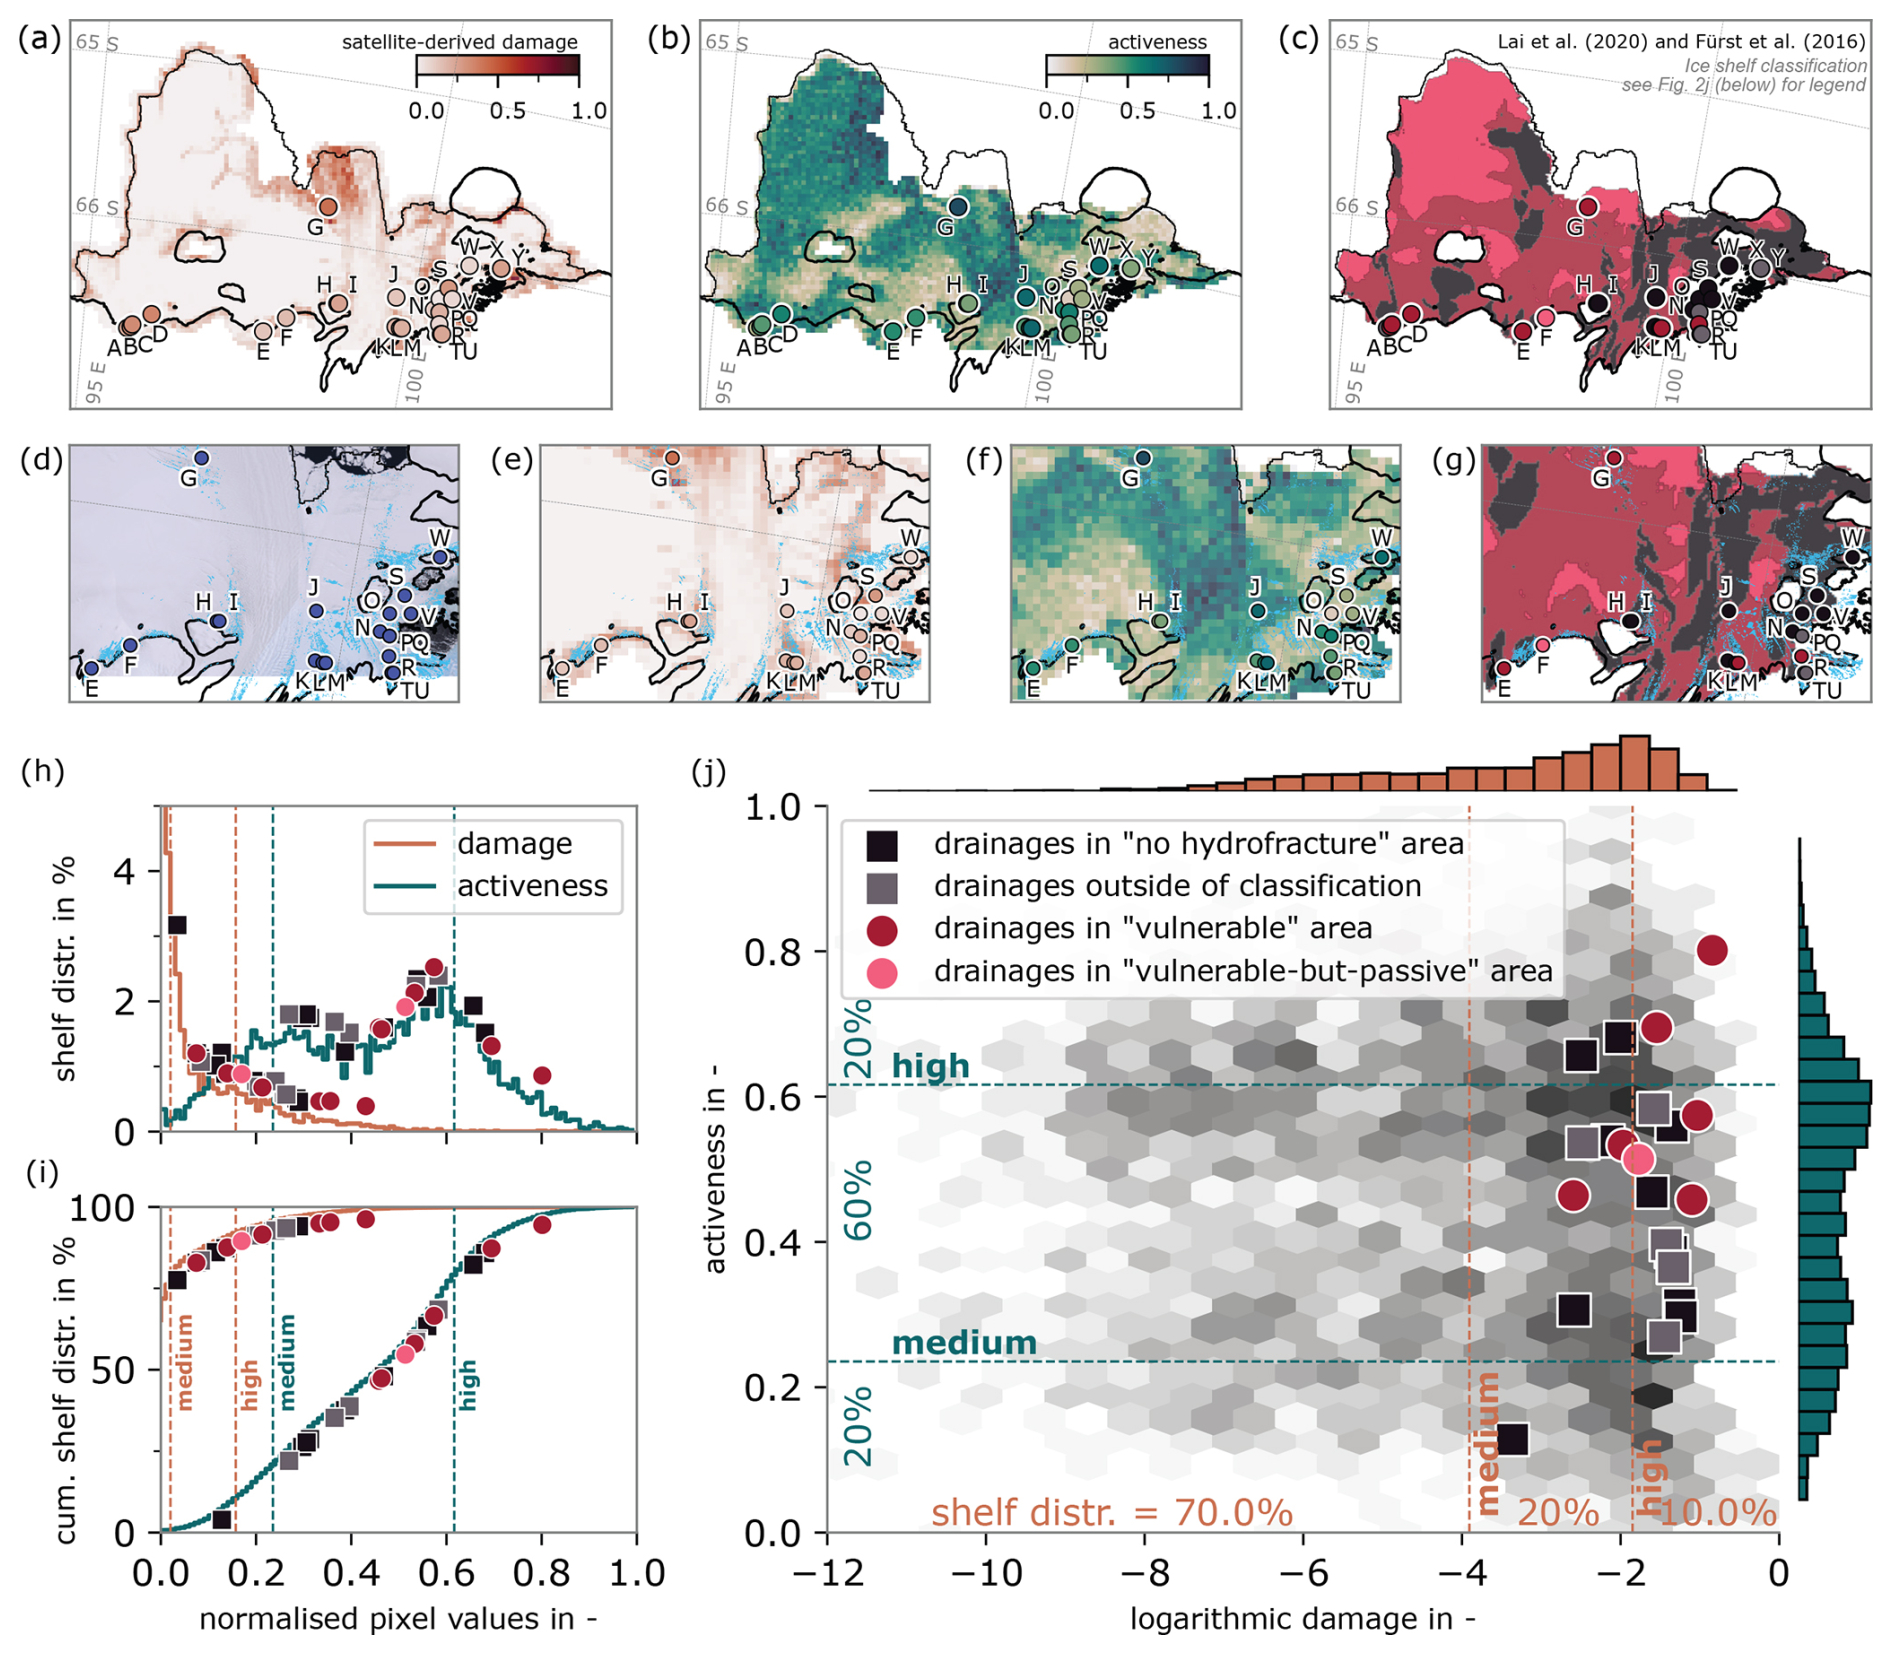
Figure 2Spatial occurrence of observed lake drainages on Shackleton ice shelf. (a) presents the satellite-derived damage and (b) the activeness metrics, both for the 2019/20 melt season. (c) shows the comparison to vulnerability to hydrofracturing estimates of Lai et al. (2020), Fürst et al. (2016). Panels (d)–(g) show zoomed section around the glaciers on the ice shelf, with (d) maximum lake extent and (e)–(g) the same as (a)–(c). The superimposed coloured dots display the location of observed drainage events, the colour of each dot represents the respective value at the drainage location for the respective melt season in which it occurred. Thick/thin black line: Grounding and Shelf coastline from MEaSURES data (Gerrish et al., 2022). Panel (h) and (i) show the distribution and the respective cumulative shelf distribution of satellite-derived damage and activeness together with the drainage events and in which area they where found. Panel (j) presents a comparison between satellite-derived damage (in logarithmic scale), activeness, observed drainage and vulnerability to hydrofracturing estimates of Lai et al. (2020), Fürst et al. (2016).
The detected damage maps (Fig. 2a) show the spatial distribution of damage features on the ice, with high values indicating areas characterized by rifts or crevasses. A visual comparison with the detected lakes (Fig. 1) shows that the distribution of the lakes are often coinciding with detected damage patterns. We categorized damage levels into three distinct groups with values specific to Shackleton ice shelf: not/low damaged (values < 0.02, 70 % of the area, no lake draining events), medium-damaged (0.02 < values < 0.16, 20 % of the area, eight lake draining events), and highly damaged (values > 0.16, 10 % of the area, 17 lake draining events). Due to the strongly skewed data distribution (Fig. 2h, and Table S2) we discretized the damage signal values in bins of unequal width, containing progressively less data samples (damaged pixels) to favor the representation of the minority, high values, class.
The results show that lake drainages predominantly occur in areas classified with medium to high relative levels of damage (Fig. 2a and e). The three lake drainages in relatively medium-damaged regions are particularly concentrated around Scott Glacier and Bunger Hills (drainages H, L, and M). Although relatively high-damaged areas cover only a small portion of the Shackleton Ice Shelf, they account for the majority of lake drainages, primarily located further west along the grounding line (drainages A to I, excluding G), with one event occurring on the glacier tongue (drainage G). In contrast, no lake drainages have been recorded in relatively low-damaged areas, despite these areas covering the majority of the ice shelf.
The activeness parameter (Fig. 2b and f) provides insights into the dynamic behavior of the shelf, with relatively high values indicating areas where the ice and local fractures have a high likelihood to be under active development due to the flow of the ice. Similar as the damage values, we categorized the activeness in the following groups to favor the tails of the distribution: not active (values < 0.24, 20 % of the area), moderately active (0.24 < values < 0.62, 60 % of the areas), and highly active (0.60 < values, 20 % of the area), as detailed in Table S2.
High activeness is found most clearly where fast flowing ice experiences shear stress from adjacent slower-moving or stationary ice masses, leading to mix-mode crevasse opening (Colgan et al., 2016). Areas close to the Northcliffe, Denman, Scott and Apfel glaciers serve as the clearest examples of areas exhibiting high activeness on Shackleton ice shelf.
All, but one, of the detected lake drainage events occur in areas of the ice shelf classified as medium to highly active relatively to Shackleton ice shelf (20 and four lake draining events respectively; Fig. 2b and Table S2), indicating that areas without damage development are not likely to accommodating lake drainage.
Considering both damage and activeness, several notable patterns emerge. First, drainages A to F, on the grounding line on West Shackleton are cases where damage is relatively high and activeness is moderate at the lake drainage sites. This indicates that areas along the grounding line are prone to such events due to the combined effect of significant damage and moderate activeness. Second, east of the glacier tongue (drainages J and M), lake drainage events occurred in areas of high activeness, despite relatively medium levels of detected damage. This suggests that the interaction between the small glaciers and the Bunger Hills creates a highly active section of the ice shelf, where accumulated meltwater rapidly drains even in moderately fractured regions. Third, we also detect a few drainages in areas with high activeness (drainages G and M) but with relatively high levels of detected damage. Taken together, the results suggest that while moderate damage appears to be a necessary precondition, activeness acts as an additional driver that can amplify the likelihood of drainage events. Drainages are more likely to occur if either detected damage or activeness is high, or both.
Compared to the vulnerability metric of Lai et al. (2020) (Fig. 2c and j), which indicates the (in)stability of detected fractures to inundation with meltwater, we see that drainages that occur on “vulnerable” areas also have moderate to high activeness (7 out 25, Fig. 2j). Intriguingly, we also detect 15 drainages that occur in areas where Lai et al. (2020) indicated “no-hydrofracturing” or outside of classification. These drainages are in areas of both moderate and high activeness (14 out 15), mostly in combination with relatively high damage areas (9 out of the 14 in areas of both moderate and high activeness). This highlights the role of ice dynamics in the behavior of hydrofracturing, and suggest that vulnerability estimates based only on fracture mechanics is not sufficient.
Overall, these results suggest that both damage and activeness are important indicators of the likelihood of supraglacial lakes draining rapidly. Although the exact relationship between these metrics requires further investigation across different ice shelves and with more drainage events, it seems that the activeness of detected damage adds insights into the where lake drainage occur in otherwise unsuspected areas.
3.2 Lake Drainage Events in Periods of Increasing Tidal Heights
Given the tidal amplitudes and the geometry of the Shackleton Ice Shelf, large areas experience cyclical stress states driven by tidal oscillations (Padman et al., 2002). As tidal amplitudes surge towards their spring maxima, the ice shelf undergoes enhanced flexure, potentially generating complex tensile stress fields at both its surface and base, which can lead to crevasse opening and so facilitate rapid lake drainages.
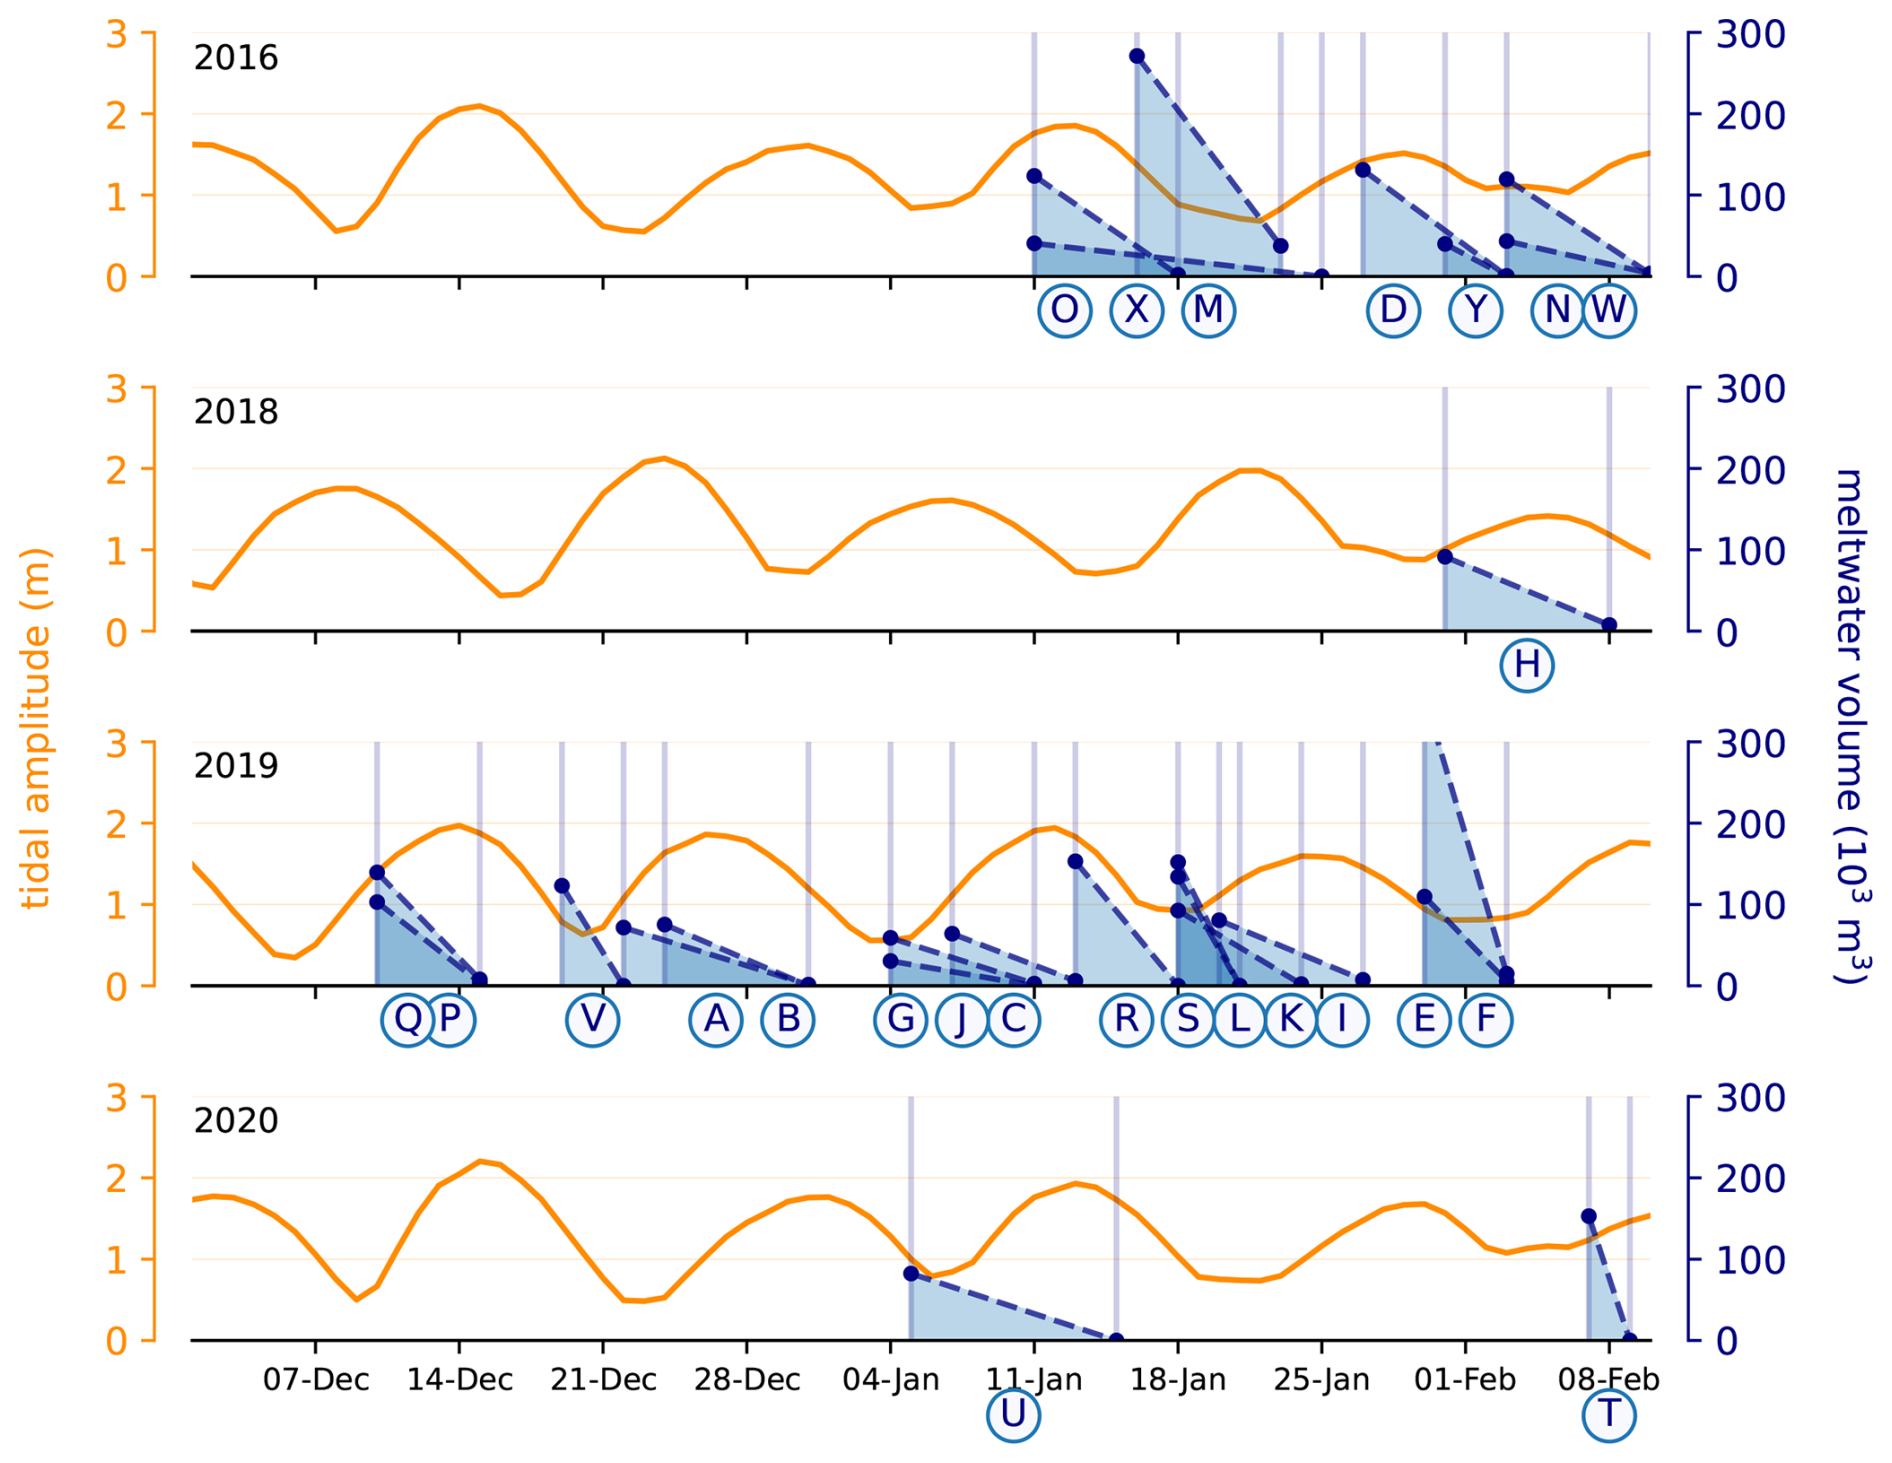
Figure 3Time-windows of individual drainages and CATS2008 tidal amplitudes. Blue dots and shaded area: Change of meltwater volume for individual lakes (Sect. 2.2).
We compare the drainage time-windows to tidal data (Fig. 3), and indeed find a clear pattern: the majority of drainage episodes aligns with the ascending phase of tide cycles (17 out of 25). Although we cannot determine the exact drainage date, only a snapshot before and after the event, few drainages seem to have occurred on the descending phase.
This pattern suggests that amplified tidal flexure may serve as a catalyst, either initiating new cracks or reactivating dormant weaknesses within the ice shelf structure. Once this process begins, the rapid influx of draining water could further propagate these fractures, facilitating complete lake drainage in a cascade of events reminiscent of those described by Das et al. (2008).
Our observations of several drainage events indicate that tidal forcing plays an important role in modulating supraglacial lake drainage across the ice shelf. These results are consistent with previous findings (Trusel et al., 2022).
One of the primary challenges in studying ice shelf hydrofracturing is detecting the drainage events. Rapid drainages, often indicative of hydrofracture, can occur within hours to days when meltwater accumulates in existing fractures or new cracks form, leading to sudden drainage. The rapid nature of these events means they can commence and conclude between satellite observations, making it challenging to capture the precise moment of hydrofracture initiation, and its duration. While it is possible to detect the aftermath of drainage events, as done in this study, attributing these events specifically to hydrofracture is difficult.
We were able to automatically detect rapid lake drainage events from satellite imagery. Nevertheless, for the seven seasons analysed in this case study, the number of observed rapid drainage events (25) remains relatively small, and manual inspection of the detected events was essential. Possibly no more rapid drainages occurred, or possibly events have been obscured due to cloud cover and other atmospheric disturbances in the satellite imagery.
To accurately identify and attribute rapid drainage events to hydrofracture mechanisms, a shorter observational time window is needed. This means a higher temporal resolution in satellite data or the integration of complementary observational methods (e.g. Miles et al., 2017).
Our results show that drainage of supraglacial lakes occur in areas with relatively high ice shelf damage or damage activeness, or both. We have resampled these parameters to provide an indication for larger-scale weakening of the ice surrounding the drainage events, since the NeRD method does not resolve individual fractures.
This allowed us to provide a generalised comparison across the ice shelf, but limits the attribution of lake drainages to specific features and so limits a more detailed representation of individual events. By using satellite-derived damage, these analyses also exclude the influence of basal fractures.
Similarly, the activeness parameter offers a simplified but effective approach to identify areas of active damage development, by comparing fracture orientations to the local velocity field, but is limited in providing detailed physical understanding of individual events – which would need a more thorough understanding of local ice stresses and strain rates. Nevertheless, this method complements the use of detected damage alone, and provides new insights with respect to the vulnerability to hydrofracturing previously determined based on linear fracture mechanics by Lai et al. (2020).
The methods in this study are, in essence, transferable to other regions. However, we have tailored post-processing steps to this study area, and hence values presented in this study are specific to this ice shelf. Firstly, we normalized the detected damage and activeness values based on their observed maxima in the spatiotemporal domain. Similarly, we discretized the values into relatively low, moderate and high classes with bin edges based on the overall data distribution, to give weight to the minority classes in our analyses. Including data from other regions might change the normalisation and discretizations of the data distribution. Therefore, careful selection and adjustment of these criteria are essential when applying our approach to different ice shelves.
Our results show that lake drainages generally occur during the ascending phase of tidal amplitude, when surface crevasses tend to close and basal crevasses may open, indicating that triggers for drainage events likely involve more than surface fracture stability alone. During the ascending tidal phase, tensile stresses at the base of the ice shelf promote the opening of basal crevasses, which facilitates water drainage when the base of the lake or a surface crevasse is reached. However, with the NeRD framework, we are not able to distinguish basal from surface crevasses to further study this process, and so cannot determine why basal crevasse opening would be more favorable to facilitate lake drainages. In line with this, future work should target and constrain the role of basal fracturing in lake formation and meltwater drainage.
Given the complex nature of drainage events and the challenges in their detection, there is a clear need for more sophisticated and larger statistical approaches to observe where and when rapid lake drainages occur. Future research could focus on developing (probabilistic) models that can identify subtle changes in ice shelf characteristics that precede drainage events, and conducting high-resolution time series observational analyses to better understand the temporal dynamics of meltwater accumulation and drainage. To study individual drainage events in high detail, other fracture detection methods are advised, such as segmentation approaches (Surawy-Stepney et al., 2023) that can delineate individual features, or ground-penetrating radar observations to include basal crevasses. Additionally, process-based modeling studies can be used to study and resolve the physical relationship between the ice dynamics, fracture mechanics, and meltwater accumulation to the observed lake drainage. This will help to understand the cause and timing of hydrofracturing and to what extent lake drainages (and hydrofracturing) might affect ice shelf stability.
In conclusion, our study of the Shackleton Ice Shelf reveals a complex interplay of ice shelf damage, damage activeness, meltwater accumulation, and tidal forces, on the distribution and timing of rapid lake drainages. This complexity underscores the need for a holistic approach when studying ice shelf hydrofracturing. While our study provides new insights, it is important to recognize that more process-based studies are needed to understand the full system that leads to hydrofracturing. Our findings provide a direction for future research aiming to understanding lake drainages and hydrofracturing on Antarctic ice shelves.
GEE code, python processing code, and the data are available in the zenodo repository at DOI https://doi.org/10.5281/zenodo.17352530 (Sommer et al., 2025).
The supplement related to this article is available online at https://doi.org/10.5194/tc-19-5903-2025-supplement.
JS: Conceptualization, Methodology, Visualization, Writing – original draft, Data curation. MI and SRH: Conceptualization, Methodology, Writing – review & editing. BW and SL: Methodology, Writing – review & editing.
At least one of the (co-)authors is a member of the editorial board of The Cryosphere. The peer-review process was guided by an independent editor, and the authors also have no other competing interests to declare.
Publisher’s note: Copernicus Publications remains neutral with regard to jurisdictional claims made in the text, published maps, institutional affiliations, or any other geographical representation in this paper. While Copernicus Publications makes every effort to include appropriate place names, the final responsibility lies with the authors. Views expressed in the text are those of the authors and do not necessarily reflect the views of the publisher.
MI and SRH were funded by the Dutch Research Council (NWO).
This research has been supported by the Nederlandse Organisatie voor Wetenschappelijk Onderzoek (grant nos. ALWGO.2018.043 and OCENW.GROOT.2019.091).
This paper was edited by Nicolas Jourdain and reviewed by three anonymous referees.
Arthur, J. F., Stokes, C. R., Jamieson, S. S. R., Carr, J. R., and Leeson, A. A.: Distribution and seasonal evolution of supraglacial lakes on Shackleton Ice Shelf, East Antarctica, The Cryosphere, 14, 4103–4120, https://doi.org/10.5194/tc-14-4103-2020, 2020. a, b, c
Arthur, J. F., Stokes, C. R., Jamieson, S. S. R., Rachel Carr, J., Leeson, A. A., and Verjans, V.: Large Interannual Variability in Supraglacial Lakes around East Antarctica, Nature Communications, 13, 1711, https://doi.org/10.1038/s41467-022-29385-3, 2022. a
Banwell, A. F., Datta, R. T., Dell, R. L., Moussavi, M., Brucker, L., Picard, G., Shuman, C. A., and Stevens, L. A.: The 32-year record-high surface melt in 2019/2020 on the northern George VI Ice Shelf, Antarctic Peninsula, The Cryosphere, 15, 909–925, https://doi.org/10.5194/tc-15-909-2021, 2021. a
Bindschadler, R., Vornberger, P., Fleming, A., Fox, A., Mullins, J., Binnie, D., Paulsen, S. J., Granneman, B., and Gorodetzky, D.: The Landsat Image Mosaic of Antarctica, Remote Sensing of Environment, 112, 4214–4226, https://doi.org/10.1016/j.rse.2008.07.006, 2008. a
Colgan, W., Rajaram, H., Abdalati, W., McCutchan, C., Mottram, R., Moussavi, M. S., and Grigsby, S.: Glacier Crevasses: Observations, Models, and Mass Balance Implications, Reviews of Geophysics, 54, 119–161, https://doi.org/10.1002/2015RG000504, 2016. a, b
Das, S. B., Joughin, I., Behn, M. D., Howat, I. M., King, M. A., Lizarralde, D., and Bhatia, M. P.: Fracture Propagation to the Base of the Greenland Ice Sheet During Supraglacial Lake Drainage, Science, 320, 778–781, https://doi.org/10.1126/science.1153360, 2008. a
de Roda Husman, S., Lhermitte, S., Bolibar, J., Izeboud, M., Hu, Z., Shukla, S., van der Meer, M., Long, D., and Wouters, B.: A High-Resolution Record of Surface Melt on Antarctic Ice Shelves Using Multi-Source Remote Sensing Data and Deep Learning, Remote Sensing of Environment, 301, 113950, https://doi.org/10.1016/j.rse.2023.113950, 2024. a, b
Doyle, S. H., Hubbard, A. L., Dow, C. F., Jones, G. A., Fitzpatrick, A., Gusmeroli, A., Kulessa, B., Lindback, K., Pettersson, R., and Box, J. E.: Ice tectonic deformation during the rapid in situ drainage of a supraglacial lake on the Greenland Ice Sheet, The Cryosphere, 7, 129–140, https://doi.org/10.5194/tc-7-129-2013, 2013. a
Fürst, J. J., Durand, G., Gillet-Chaulet, F., Tavard, L., Rankl, M., Braun, M., and Gagliardini, O.: The Safety Band of Antarctic Ice Shelves, Nature Climate Change, 6, 479–482, https://doi.org/10.1038/nclimate2912, 2016. a, b
Gardner, A., Fahnestock, M., and Scambos, T.: MEaSUREs ITS_LIVE Landsat Image-Pair Glacier and Ice Sheet Surface Velocities, Version 1, NASA National Snow and Ice Data Center DAAC [data set], https://doi.org/10.5067/IMR9D3PEI28U, 2020. a
Gerrish, L., Fretwell, P., and Cooper, P.: High Resolution Vector Polylines of the Antarctic Coastline – VERSION 7.6, UK Polar Data Centre, Natural Environment Research Council UK Research & Innovation [data set], https://doi.org/10.5285/45174e8c-7ce8-4d87-a6f7-570db476c6c9, 2022. a, b, c
Howard, S., Padman, L., and Erofeeva, S.: CATS2008: Circum-Antarctic Tidal Simulation Version 2008, U.S. Antarctic Program (USAP) Data Center [data set], https://doi.org/10.15784/601235, 2019. a
Izeboud, M. and Lhermitte, S.: Damage Detection on Antarctic Ice Shelves Using the Normalised Radon Transform, Remote Sensing of Environment, 284, 113359, https://doi.org/10.1016/j.rse.2022.113359, 2023. a, b, c
Lai, C.-Y., Kingslake, J., Wearing, M. G., Chen, P.-H. C., Gentine, P., Li, H., Spergel, J. J., and van Wessem, J. M.: Vulnerability of Antarctica's Ice Shelves to Meltwater-Driven Fracture, Nature, 584, 574–578, https://doi.org/10.1038/s41586-020-2627-8, 2020. a, b, c, d, e, f, g, h
McMillan, M., Nienow, P., Shepherd, A., Benham, T., and Sole, A.: Seasonal Evolution of Supra-Glacial Lakes on the Greenland Ice Sheet, Earth and Planetary Science Letters, 262, 484–492, https://doi.org/10.1016/j.epsl.2007.08.002, 2007. a
Miles, K. E., Willis, I. C., Benedek, C. L., Williamson, A. G., and Tedesco, M.: Toward Monitoring Surface and Subsurface Lakes on the Greenland Ice Sheet Using Sentinel-1 SAR and Landsat-8 OLI Imagery, Frontiers in Earth Science, 5, https://doi.org/10.3389/feart.2017.00058, 2017. a, b
Moussavi, M., Pope, A., Halberstadt, A. R. W., Trusel, L. D., Cioffi, L., and Abdalati, W.: Antarctic Supraglacial Lake Detection Using Landsat 8 and Sentinel-2 Imagery: Towards Continental Generation of Lake Volumes, Remote Sensing, 12, 134, https://doi.org/10.3390/rs12010134, 2020. a, b
Nye, J. F. and Perutz, M. F.: The Distribution of Stress and Velocity in Glaciers and Ice-Sheets, Proceedings of the Royal Society of London. Series A. Mathematical and Physical Sciences, 239, 113–133, https://doi.org/10.1098/rspa.1957.0026, 1957. a
Padman, L., Fricker, H. A., Coleman, R., Howard, S., and Erofeeva, L.: A New Tide Model for the Antarctic Ice Shelves and Seas, Annals of Glaciology, 34, 247–254, https://doi.org/10.3189/172756402781817752, 2002. a, b, c
Padman, L., Siegfried, M. R., and Fricker, H. A.: Ocean Tide Influences on the Antarctic and Greenland Ice Sheets, Reviews of Geophysics, 56, 142–184, https://doi.org/10.1002/2016RG000546, 2018. a
Pope, A., Scambos, T. A., Moussavi, M., Tedesco, M., Willis, M., Shean, D., and Grigsby, S.: Estimating supraglacial lake depth in West Greenland using Landsat 8 and comparison with other multispectral methods, The Cryosphere, 10, 15–27, https://doi.org/10.5194/tc-10-15-2016, 2016. a
Saunderson, D., Mackintosh, A., McCormack, F., Jones, R. S., and Picard, G.: Surface melt on the Shackleton Ice Shelf, East Antarctica (2003–2021), The Cryosphere, 16, 4553–4569, https://doi.org/10.5194/tc-16-4553-2022, 2022. a
Sommer, J., Izeboud, M., de Roda Husman, S., Wouters, B., and Lhermitte, S.: Brief Communications: Tides and Damage as Drivers of Lake Drainages on Shackleton Ice Shelf, Zenodo [code and data set], https://doi.org/10.5281/zenodo.17352530, 2025. a
Stokes, C. R., Sanderson, J. E., Miles, B. W. J., Jamieson, S. S. R., and Leeson, A. A.: Widespread Distribution of Supraglacial Lakes around the Margin of the East Antarctic Ice Sheet, Scientific Reports, 9, 13823, https://doi.org/10.1038/s41598-019-50343-5, 2019. a
Sun, S., Cornford, S. L., Moore, J. C., Gladstone, R., and Zhao, L.: Ice shelf fracture parameterization in an ice sheet model, The Cryosphere, 11, 2543–2554, https://doi.org/10.5194/tc-11-2543-2017, 2017. a
Surawy-Stepney, T., Hogg, A. E., Cornford, S. L., and Hogg, D. C.: Mapping Antarctic crevasses and their evolution with deep learning applied to satellite radar imagery, The Cryosphere, 17, 4421–4445, https://doi.org/10.5194/tc-17-4421-2023, 2023. a
Trusel, L. D., Pan, Z., and Moussavi, M.: Repeated Tidally Induced Hydrofracture of a Supraglacial Lake at the Amery Ice Shelf Grounding Zone, Geophysical Research Letters, 49, https://doi.org/10.1029/2021GL095661, 2022. a, b
Tuckett, P. A., Ely, J. C., Sole, A. J., Lea, J. M., Livingstone, S. J., Jones, J. M., and van Wessem, J. M.: Automated mapping of the seasonal evolution of surface meltwater and its links to climate on the Amery Ice Shelf, Antarctica, The Cryosphere, 15, 5785–5804, https://doi.org/10.5194/tc-15-5785-2021, 2021. a, b
Williamson, A. G., Arnold, N. S., Banwell, A. F., and Willis, I. C.: A Fully Automated Supraglacial Lake Area and Volume Tracking (“FAST”) Algorithm: Development and Application Using MODIS Imagery of West Greenland, Remote Sensing of Environment, 196, 113–133, https://doi.org/10.1016/j.rse.2017.04.032, 2017. a, b
Williamson, A. G., Banwell, A. F., Willis, I. C., and Arnold, N. S.: Dual-satellite (Sentinel-2 and Landsat 8) remote sensing of supraglacial lakes in Greenland, The Cryosphere, 12, 3045–3065, https://doi.org/10.5194/tc-12-3045-2018, 2018a. a, b, c
Williamson, A. G., Willis, I. C., Arnold, N. S., and Banwell, A. F.: Controls on Rapid Supraglacial Lake Drainage in West Greenland: An Exploratory Data Analysis Approach, Journal of Glaciology, 64, 208–226, https://doi.org/10.1017/jog.2018.8, 2018b. a, b