the Creative Commons Attribution 4.0 License.
the Creative Commons Attribution 4.0 License.
 | 27 Jan 2025
Snow depth estimation on leadless landfast ice using Cryo2Ice satellite observations
Monojit Saha
Julienne Stroeve
Dustin Isleifson
John Yackel
Vishnu Nandan
Jack Christopher Landy
Hoi Ming Lam
Observations of snow on Arctic Sea ice are vitally important for sea ice thickness estimation, bio-physical processes, and human activities. While previous studies have combined CryoSat-2- and ICESat-2-derived freeboards to estimate snow depth over Arctic sea ice, these approaches require leads within the ice pack to estimate the freeboard heights above the sea surface. In regions such as the Canadian Arctic Archipelago (CAA), leads are scarce in winter, posing a significant challenge to estimate snow depth from altimeters. This study is the first assessment of the potential for near-coincident ICESat-2 and Cryosat-2 (Cryo2Ice) snow depth retrievals in a leadless region of the CAA including validation with in situ data. In lieu of sea surface height estimates from leads, snow depths are retrieved using the absolute difference in surface heights (ellipsoidal heights) from ICESat-2 and Cryosat-2 after applying an ocean tide correction based on tidal gauges between satellite passes on 29 April 2022. Both the absolute mean snow depths and distributions retrieved from Cryo2Ice were slightly underestimated (2 to 4 cm) when compared to in situ measurements. All four in situ sites had snow with saline basal layers and different levels of roughness and ridging, which significantly impact the accuracy of the Cryo2Ice snow depth retrievals. Differences between Cryo2Ice and in situ snow depth distributions reflect the varying sampling resolutions of the sensors and the in situ measurements. Cryo2Ice tends to miss snow depths greater than 30 cm, especially around ridges. The results suggest that it might be possible to estimate snow depth over landfast sea ice without leads. However, the observed biases of 2–4 cm likely stem from several factors: (1) discrepancies in sampling resolution between ICESat-2 and CryoSat-2; (2) the CryoSat-2 scattering horizon not aligning with the snow–ice interface due to snow salinity, density, and surface roughness; (3) the choice of retracker; and (4) potential errors in the altimeter's tidal corrections. Further investigation is needed to address these issues. Moreover, the proposed methodology for getting snow depth over leadless landfast sea ice needs to be validated using in situ datasets in other landfast sea ice regions in the Arctic.
- Article
(8250 KB) - Full-text XML
- BibTeX
- EndNote


Changes in Arctic sea ice are affecting climate, ecosystems, and traditional ways of living and harvesting (Meier and Stroeve, 2022). A critical component of the sea ice cover is its overlying snow cover, which has been challenging to accurately measure by satellites (Webster et al., 2018). Snow acts as an insulator, impacting both the growth and decay of sea ice (Maykut and Untersteiner, 1971). Snow also (1) limits the amount of light penetrating through the sea ice, affecting the timing of sea ice algae growth (Mundy et al., 2005); (2) contributes to the amount of freshwater discharged to the ocean, affecting its budget (Andersen et al., 2019); and (3) affects the heat exchange between the atmosphere and the sea ice (Andreas et al., 2005; Eicken et al., 2004).
Using monthly composites of airborne laser and radar altimeter data collected during the Laser and Radar Altimetry (LaRA) mission over sea ice around Svalbard, Leuschen et al. (2008) suggested snow depth could be retrieved by differencing freeboards, although there was a lack of in situ ground truth to validate results. Following this, studies have differenced coincident satellite radar (CryoSat-2; hereafter CS2) and laser (ICESat-2; hereafter IS2) altimeter freeboards to estimate pan-Arctic (e.g., Kwok and Markus, 2018; Kwok et al., 2020) and Antarctic snow depth (Kacimi and Kwok, 2020). However, significant uncertainties remain related to (1) differences in electromagnetic frequencies and spatial resolution (Fons et al., 2021); (2) whether or not the CS2 Ku-band radar returns originate from the snow–ice interface, which has been contested even for a dry and cold (below freezing) snowpack (Willatt et al., 2023, 2011; Nandan et al., 2017; de Rijke-Thomas et al., 2023); (3) the influence of surface roughness over different length scales on the laser and radar waveforms (Landy et al., 2020); and (4) spatial heterogeneity of snow distributed over sea ice.
Earlier studies also faced challenges of having different orbits for CS2 and IS2, limiting the number of crossover points (Kwok and Markus, 2018). Kwok and Markus (2018) made a case for adjusting the CS2 orbit to achieve more overlaps with IS2, thereby improving both spatial and temporal coincidence. As part of the Cryo2Ice campaign, the CS2 orbit was raised by ∼900 m in August 2020 to significantly increase the number of crossovers with IS2 (ESA, 2020). This realignment means that once in every 19 CS2 (20 IS2) cycles, the two ground tracks nearly align for hundreds of kilometers over the Arctic, providing new opportunities to improve and validate snow depths retrieved by combining laser and radar freeboards. Fredensborg Hansen et al. (2024) took advantage of the Cryo2Ice campaign to retrieve along-track snow depths along 7 km segments. In their study, they compared the derived Cryo2Ice snow depths against snow depths from passive microwave, snow models, and climatologies and found uncertainties of 10–11 cm.
This study is the first comparison of Cryo2ice snow depths to in situ snow depth retrievals over landfast ice, evaluating retrievals along 300 m and 1 km segments. This study also provides the first high-resolution in situ validation of snow depths retrieved along coincident Cryo2Ice tracks near Cambridge Bay, Nunavut, in the Canadian Arctic Archipelago (CAA). The CAA is a region with a significantly different bathymetry and icescape than the central Arctic (Galley et al., 2012). Sea ice in the CAA is landfast ice for the majority of the year (6 to 8 months) (Melling, 2002) and exhibits minimal ice drift (Galley et al., 2012), making it easier to match up IS2 and CS2 tracks. On the other hand, the tidal amplitudes within the shallow bathymetry of the CAA are larger than in the open ocean, posing an additional challenge compared to validation studies in the central Arctic Ocean. However, the most prominent challenge pertains to the lack of open water for estimating the local sea surface height (SSH) needed to reference the freeboards. Landfast ice grows along the narrow channels in the CAA and often lacks leads for several hundred kilometers (Galley et al., 2012). Therefore, assuming IS2 and CS2 are viewing the same landfast ice, the variation in SSH due to tidal variations must be known and corrected for between the two sensors. Our objective is to develop an approach to combine IS2 and CS2 along-track data in regions where the local SSH estimate is not readily available from satellite observations. The along-track Cryo2Ice-retrieved snow depths are then validated using near-coincident in situ snow depth observations. We further use in situ snow property observations and satellite estimates of the surface roughness to examine the drivers of CS2 and IS2 height variability. Finally, the sources of bias in the retrieval process and major challenges are discussed.
2.1 ICESat-2 (IS2)
The Advanced Topographic Laser Altimeter System (ATLAS) is the photon-counting lidar system on board ICESat-2. ATLAS emits low-energy 532 nm (green) pulses in three two-beam pairs that have a cross track spacing of 3.3 km between each pair with intra-pair spacing of 90 m. The laser has a footprint size of 11 m (Magruder et al., 2020). Detailed specifications can be found in Neumann et al. (2019).
In this study, the uncorrected ATL07 Sea Ice Height Release Version 6 data available from the National Snow and Ice Data Center (https://nsidc.org/data/atl07/versions/6, last access: 18 January 2025), which are computed directly from ATL03 photon heights, are used. ATL07 contains sea surface and sea ice heights derived from ATL03 photon heights that were aggregated into segment lengths consisting of 150 photons, resulting in variable along-track lengths over which these photos are accumulated. In the uncorrected ATL07 product, sea ice heights within the 25 km land buffer are included despite low confidence in the geophysical corrections close to land (Kwok et al., 2023a). The IS2 strong beam (gt2l) (referred to as IS2 2l) from ATL07 is used after assessing all three strong beams. The IS2 2l was ∼1500 m from the CS2 point of closest approach, whereas beams 1l and 3l were ∼2200 and ∼4500 m away, respectively.
The geophysical corrections applied to the ATL07 data are summarized in Table A1. Each correction varies over time and has different impacts on the retrieved IS2 heights. Ocean tide corrections are provided every hour and can vary from −62 to +62 cm, which are the largest among the different geophysical corrections applied. The ocean tide corrections are obtained from the Global Ocean Tide Model 4.8 (GOT 4.8) (Kwok et al., 2021), which provides tidal predictions for all regions of the globe based on the assimilation of data from satellite altimetry and tide gauge measurements into a tidal model.
2.2 CryoSat-2 (CS2)
The Synthetic Aperture Radar (SAR) Interferometric Radar Altimeter (SIRAL) is the primary instrument on board CryoSat-2, which is a combination of a pulse-limited radar altimeter and an SAR Interferometer system (SARIn). SIRAL operates at Ku-band (13.575 GHz) and in three different modes with along-track sampling resolution of around 300 m and across-track resolution of 1600 m (ESA, 2013). Cryosat-2 operated in the SARIn mode in the CAA during the study period. Here we use the CS2 Level-2 Baseline E products available through the European Space Agency's EO-CAT web explorer (https://eocat.esa.int/, last access: 18 January 2025). The CS2 Level-2 sea ice heights are retracked using the University College London (UCL) retracker (Tilling et al., 2018), which assumes a threshold (70 %) on the first peak for diffuse echoes representing the mean elevation of the snow–sea ice interface within the footprint. This fixed threshold retracker is used in the CS2 Baseline E level product over sea ice floes in the SAR–SARIn mode.
Tidal corrections (ocean, long-period equilibrium, ocean loading, solid earth, and geocentric polar) are included in the Level-2 Baseline E Cryosat-2 SAR–SARIn product (Table B2). The ocean tide, long-period equilibrium tide, and ocean loading tide corrections used are retrieved from the Finite Element Solution 2004 Ocean Tide Model (FES 2004) (ESA, 2019). The ocean tide corrections are typically in the ±50 cm range.
2.3 Sentinel-1 SAR
SAR imagery from European Space Agency's Sentinel-1 satellite was used in this study in conjunction with IS2 and CS2. Sentinel-1 provides C-band dual-polarization SAR data, which are available through the Google Earth Engine platform (https://developers.google.com/earth-engine/datasets/catalog/COPERNICUS_S1_GRD, last access: 18 January 2025). The Sentinel-1 GRD (Ground Range Detected) files had already been pre-processed with the following corrections: GRD border noise removal, thermal noise removal, radiometric calibration, and terrain correction. For this study, the cross-polarized VH backscatter was obtained from 5 May 2022. The backscatter values were then converted to decibels.
2.4 Field measurements
The study site comprised a 75 km long NNE-to-SSW transect across Dease Strait (69°26′58.02′′ N, 106°41′57.25′′ W to 68°46′42.48′′ N, 106°55′52.10′′ W) (Fig. 1), ∼70 km west of Cambridge Bay, Nunavut. This region connects Coronation Gulf and Queen Maud Gulf of the Kitikmeot Sea and is a part of the southern route of the Northwest Passage (Xu et al., 2021). Dease Strait is relatively shallow (maximum depth ∼100 m), and its narrow channel is normally covered by landfast ice between November and mid-July (Galley et al., 2012). Coincident CS2 and IS2 tracks were identified using the CS2 and IS2 Coincident Data Explorer (https://cs2eo.org/, last access: 18 January 2025) (Ewart et al., 2022). The tracks were ∼1.5 km apart and passed by within 77 min of each other (Fig. 1).
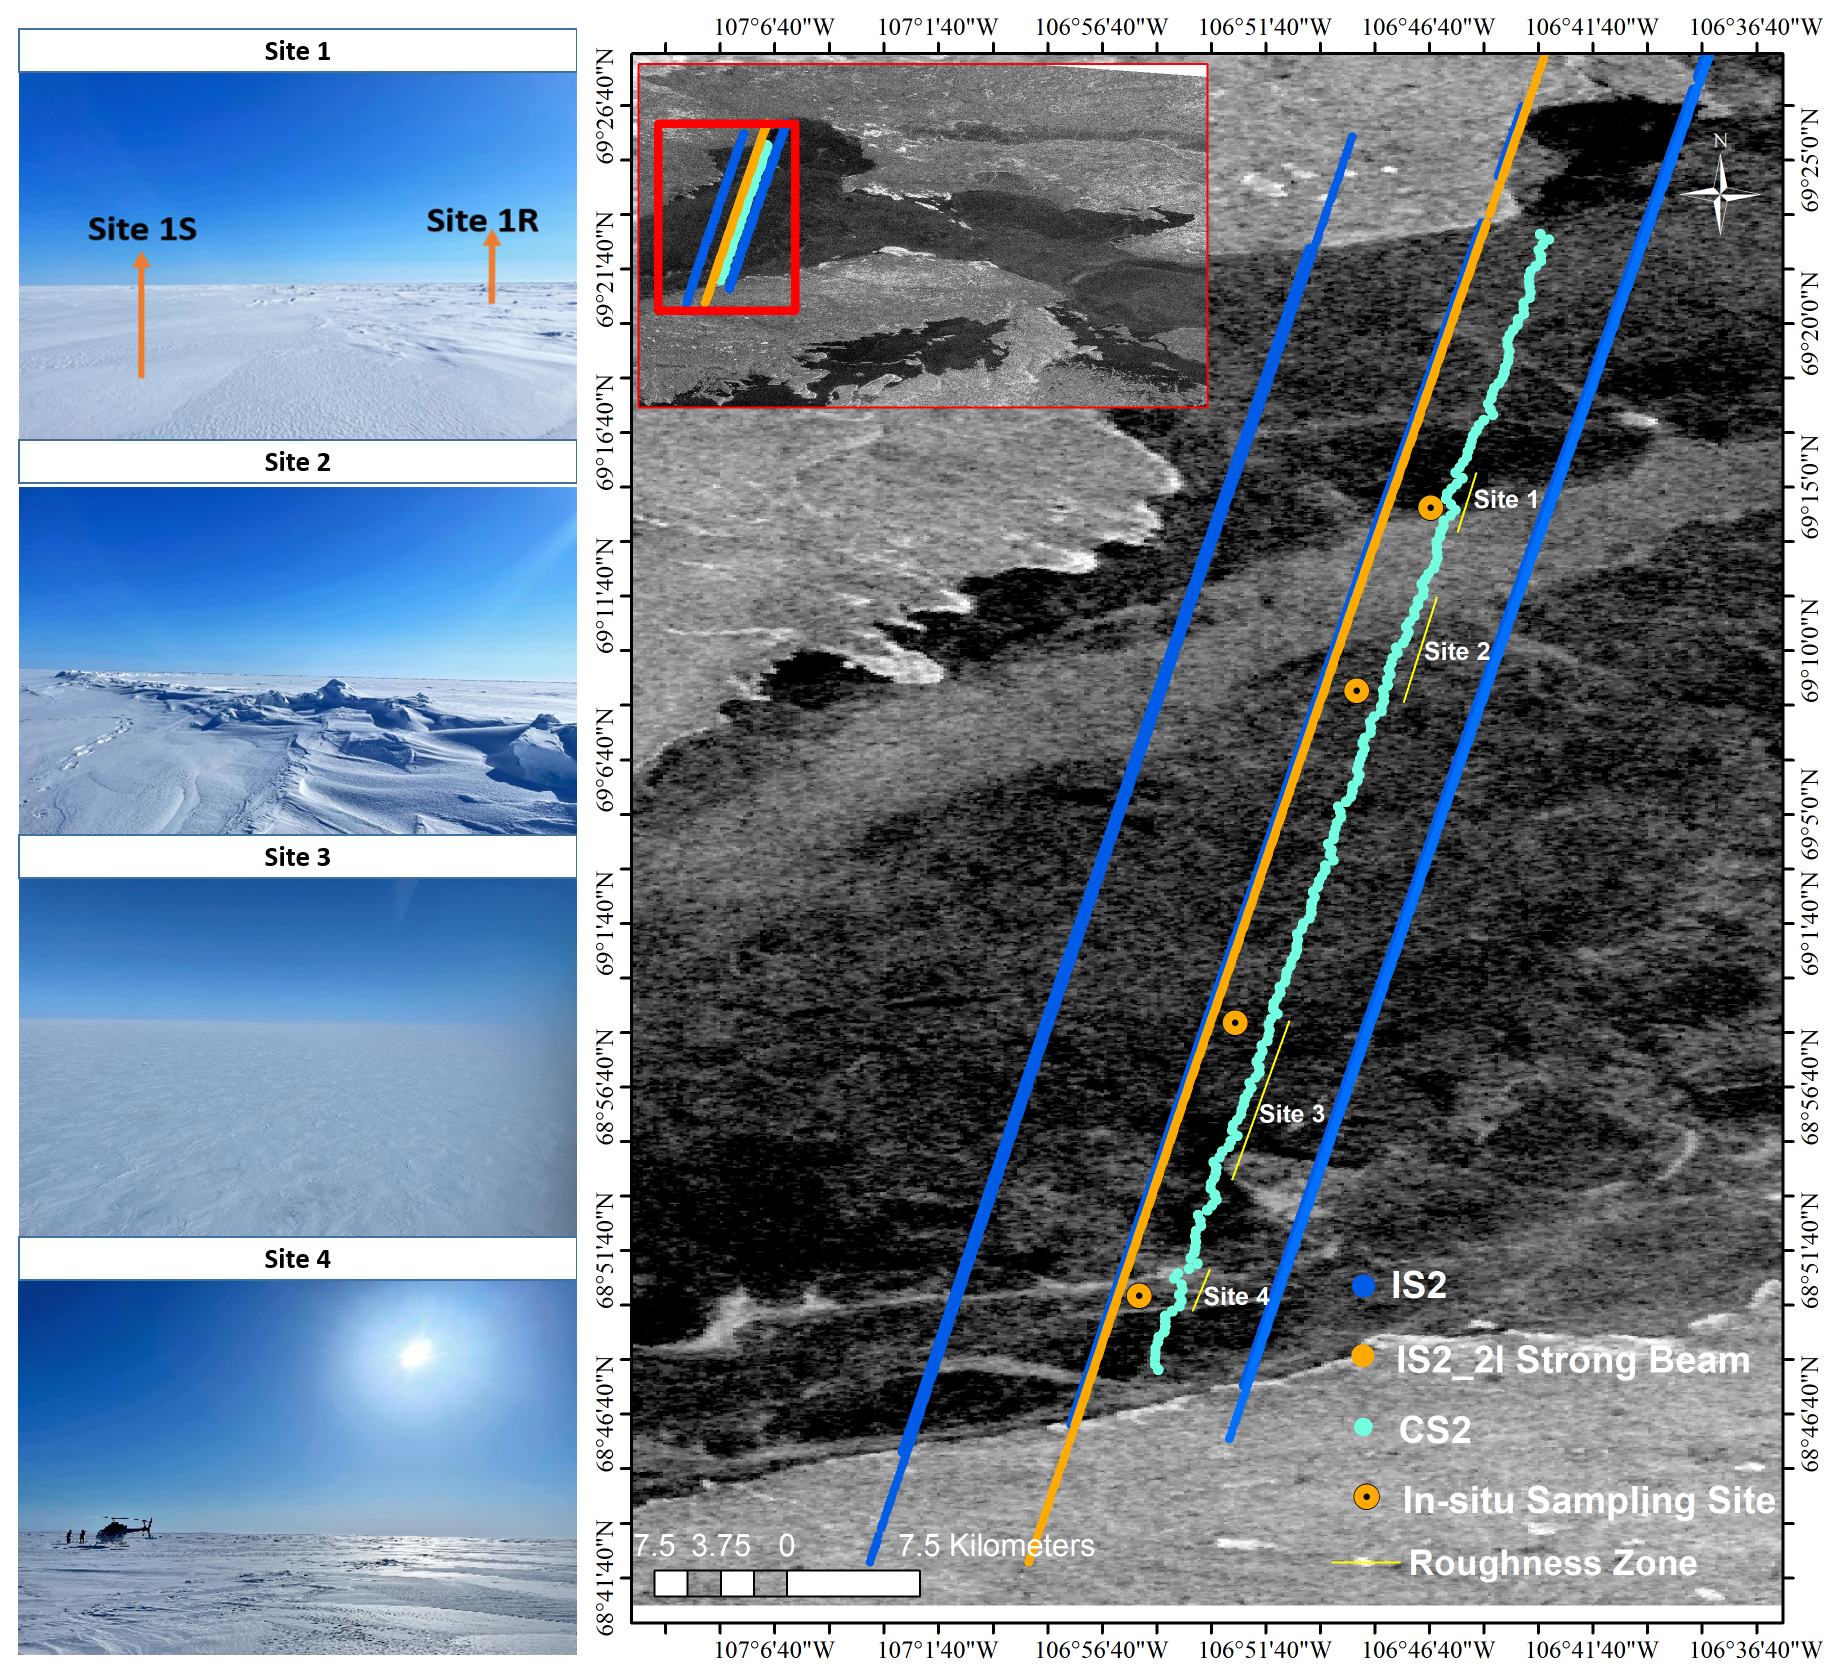
Figure 1The map shows the Cryosat-2 points of closest approach (POCA) locations, the IS2 2l strong beam, other IS2 beams, the in situ sampling locations, and the identified roughness zones. The background contains Sentinel-1 HH-pol SAR imagery. Site photos show the variation in snow roughness.
In situ snow depths were collected at four different sites (Sites 1–4) ranging from smooth, rough, and mixed sea ice roughness zones. The transects were set considering wind direction as well as the sea ice surface features for each site. The sampling strategy was to ensure coverage of the Cryo2Ice along-track and across-track directions, taking into consideration the prevailing wind direction and different representative roughness features. At Site 1, two L-shaped transects representing the rough and smooth sea ice zones were conducted (Fig. D1a). For Site 2, two different L-shaped transects were conducted to sample both the ridged ice areas and the smoother ice further away from the ridges (Fig. D1b). For Site 3 and Site 4 which had wider regions of smooth and rough sea ice, respectively, two L-shaped transects were conducted (Fig. D1c and d). Based on Sentinel-1 SAR and field reconnaissance, Site 1 was classified as a rough and smooth sea ice transition zone, Site 2 was a thin snow zone with significant ridging, Site 3 was a smooth sea ice zone with extensive areas of thin snow, and Site 4 was a rough sea ice site with extensive areas of thick snow. All sites were located equidistant between the IS2 strong beam and CS2 track to ensure the highest likelihood that snow depth sampling was representative of both sensors. The snow depth sampling direction was determined according to distinctive roughness features at individual sites, ensuring sufficient sampling distance in both the along- and across-track directions, representative of the prevailing east–southeast wind direction and snow dune pattern (Moon et al., 2019). Snow depth was surveyed using Snow-Hydro's automated snow depth magnaprobe, which has an accuracy of ±0.3 cm on level sea ice and snow (Sturm and Holmgren, 2018). The magnaprobe was reassembled and re-calibrated before each sampling effort to avoid instrument bias. Sampling was conducted by a single person to avoid variations in instrument handling and to maintain constant intervals between samples.
All four sites were surveyed on 1 May 2022 within 48 h of the ICESat-2 and CryoSat-2 pass on 29 April 2022. The sites were accessed via helicopter, and no sampling was conducted within 200 m of the helicopter landing zone to avoid snow redistribution during landing. While the sampling interval was initially set at 5 m intervals to ensure spatial heterogeneity and to avoid spatial autocorrelation of the sampled snow depth (Moran, 1948) values following Iacozza and Barber (1999), the sampling interval ranged between 2 to 3.8 m during the field sampling for all sites. There was no precipitation recorded during the sampling period or during the time interval between the CS2 and IS2 overpasses. Furthermore, high pressure dominated the region between 26 April 2022 and 4 May 2022, causing light surface winds. As such, snow redistribution between CS2 and IS2 overpasses and in situ sampling was negligible. The air temperature varied between −11.7 and −14.1 °C during the sampling as measured at the land-based Cambridge Bay meteorological station.
Snow geophysical properties, including snow salinity and density, were sampled from all four sites. Snow temperature was not measured because the temperature probe would not calibrate quickly enough between the short helicopter landing durations. For Site 1, two pits were sampled, one for the rough sea ice (Site 1a) and one for the relatively smooth sea ice zone (Site 1b). Single pits were excavated at the other three sites. Snow density was measured using a 66 cm3 ( cm) density cutter at 2 cm intervals and weighed in the lab. Following this, weighed samples were melted at room temperature for snow salinity measurement using a Cole-Parmer C100 Conductivity Meter (accuracy of ±0.5 %). Sea ice thickness and freeboard at each site were measured using a freeboard tape to an accuracy of 0.5 cm.
2.5 Estimating snow depth from Cryosat-2 and ICESat-2
Kwok et al. (2020) calculate snow depth (SD) as the difference between IS2-derived total freeboard (snow + ice) and CS2-derived radar freeboard (CS2). Freeboard heights are computed relative to the instantaneous sea surface height interpolated from sea surface measurements from along-track leads (Kwok et al., 2020; Ricker et al., 2014). The CS2 radar freeboard is additionally adjusted for reduced Ku-band propagation speed through snow. While this approach has been applied to the Cryo2Ice campaign within the central Arctic (Fredensborg Hansen et al., 2024), freeboards require accurate estimation of the sea surface height, which is dependent on the availability of leads within a reasonable distance (tens of kilometers) along both the IS2 and CS2 track. No leads were detected along the portion of the IS2 and CS2 tracks in our study area, and therefore the sea surface height could not be reliably estimated. Therefore, we modified the approach used in Kwok et al. (2020) to instead use the absolute sea ice heights measured from IS2 ATL07 (h(IS2)) and CS2 (h(CS2)) referenced to the WGS84 ellipsoid to estimate SD (Fig. 3). SD can be calculated as the freeboard differences under the assumption that Ku-band penetrates to the snow–ice interface
where ηs is the refractive index of Ku-band microwaves, which compensates for the propagation delay through the snowpack (Kwok et al., 2020). The refractive index is calculated using ( (Ullaby et al., 1987), where the in situ bulk snow density (ρs) measured from the field is used. The average snow density from all four sites is used to compute snow depth for the entire track (Fig. 8), while snow densities from each site are used to compute SD from corresponding portions of the Cryo2Ice track (Fig. 5).
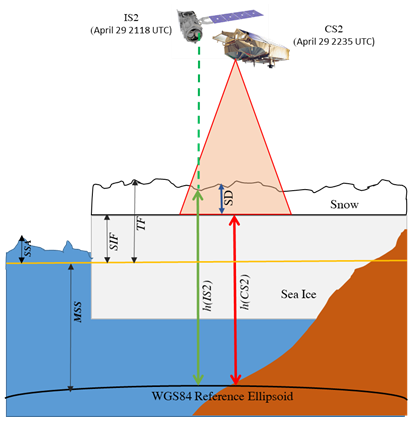
Figure 2Schematic showing the calculation of snow depth (SD) from ICESat-2 and Cryosat-2 over sea ice. The diagram illustrates the representative heights for the sea surface anomaly (SSA), mean sea surface (MSS) in yellow, sea ice freeboard (SIF), and total freeboard (TF). SD is shown with the blue arrow, IS2 surface height (h(IS2)) is shown with the green arrow, and CS2 surface height (h(CS2)) is represented by the red arrow. The land is shown in orange.
2.6 Data processing
The uncorrected IS2 ATL07 heights (h(IS2)) are referenced to the WGS84 ellipsoid, which is also consistent with the CS2 heights (Fig. 2). In our processing of the ATL07 data, we apply the following geophysical corrections contained within the IS2 ATL07 product: ocean tide correction, long-period equilibrium tide, and inverted barometer correction. We do not apply the mean sea surface (MSS) since it is based on decadal averages and therefore is not representative of the variation in sea surface heights within the 77 min interval between the IS2 and CS2 passes. The geophysical corrections included within the CS2 data product are applied to the CS2 L2 sea ice heights. However, as mentioned previously, the two products do not have the same tidal corrections.
Further, there is limited confidence in these individual geophysical corrections closer to land. The tides varied over a range of ∼6.0 cm in Dease Strait in between the two passes based on the tide gauge data, and thus it was crucial to check if the tidal corrections contained within the products accurately accounted for tide differences in the ∼77 min between passes. Therefore, after comparing the geophysical correction as explained in Sect. 2.6, an ocean tide correction factor is applied to the Cryo2Ice snow depths.
Since IS2 has a smaller footprint (Sect. 2.1 and 2.2), the IS2 ATL07 geolocated heights were averaged to be spatially congruent with the CS2 footprint, giving snow depth estimates in the maximum along-track resolution of 300 m. Here, the IS2 photons are first averaged over 300 m length segments to match the along-track CS2 footprint and then co-registered based on the distance to the closest CS2 point of closest approach. Similarly, to reduce the impact of CS2 noise, as explained later in Sect. 4.3, the snow depths are also computed over 1 km. Therefore, each CS2 point is co-registered to the closest 300 m ATL07 height segment. Snow depths computed from the IS2 and CS2 height differences were estimated following Eq. (1) and subsequently adjusted with the ocean tidal correction. In order to compare snow distributions representative of each sampled field site (S1 to S4), snow depth is compared over similar roughness zones. Roughness zones corresponding to each site are defined as a portion of the CS2/IS2 track that had IS2 surface roughness within 1 standard deviation of the IS2-derived surface roughness directly adjacent to the in situ sampling site (Fig. 1). The Cryo2Ice-derived snow depth corresponding to each roughness site was then compared against the in situ snow distribution from the sampling sites.
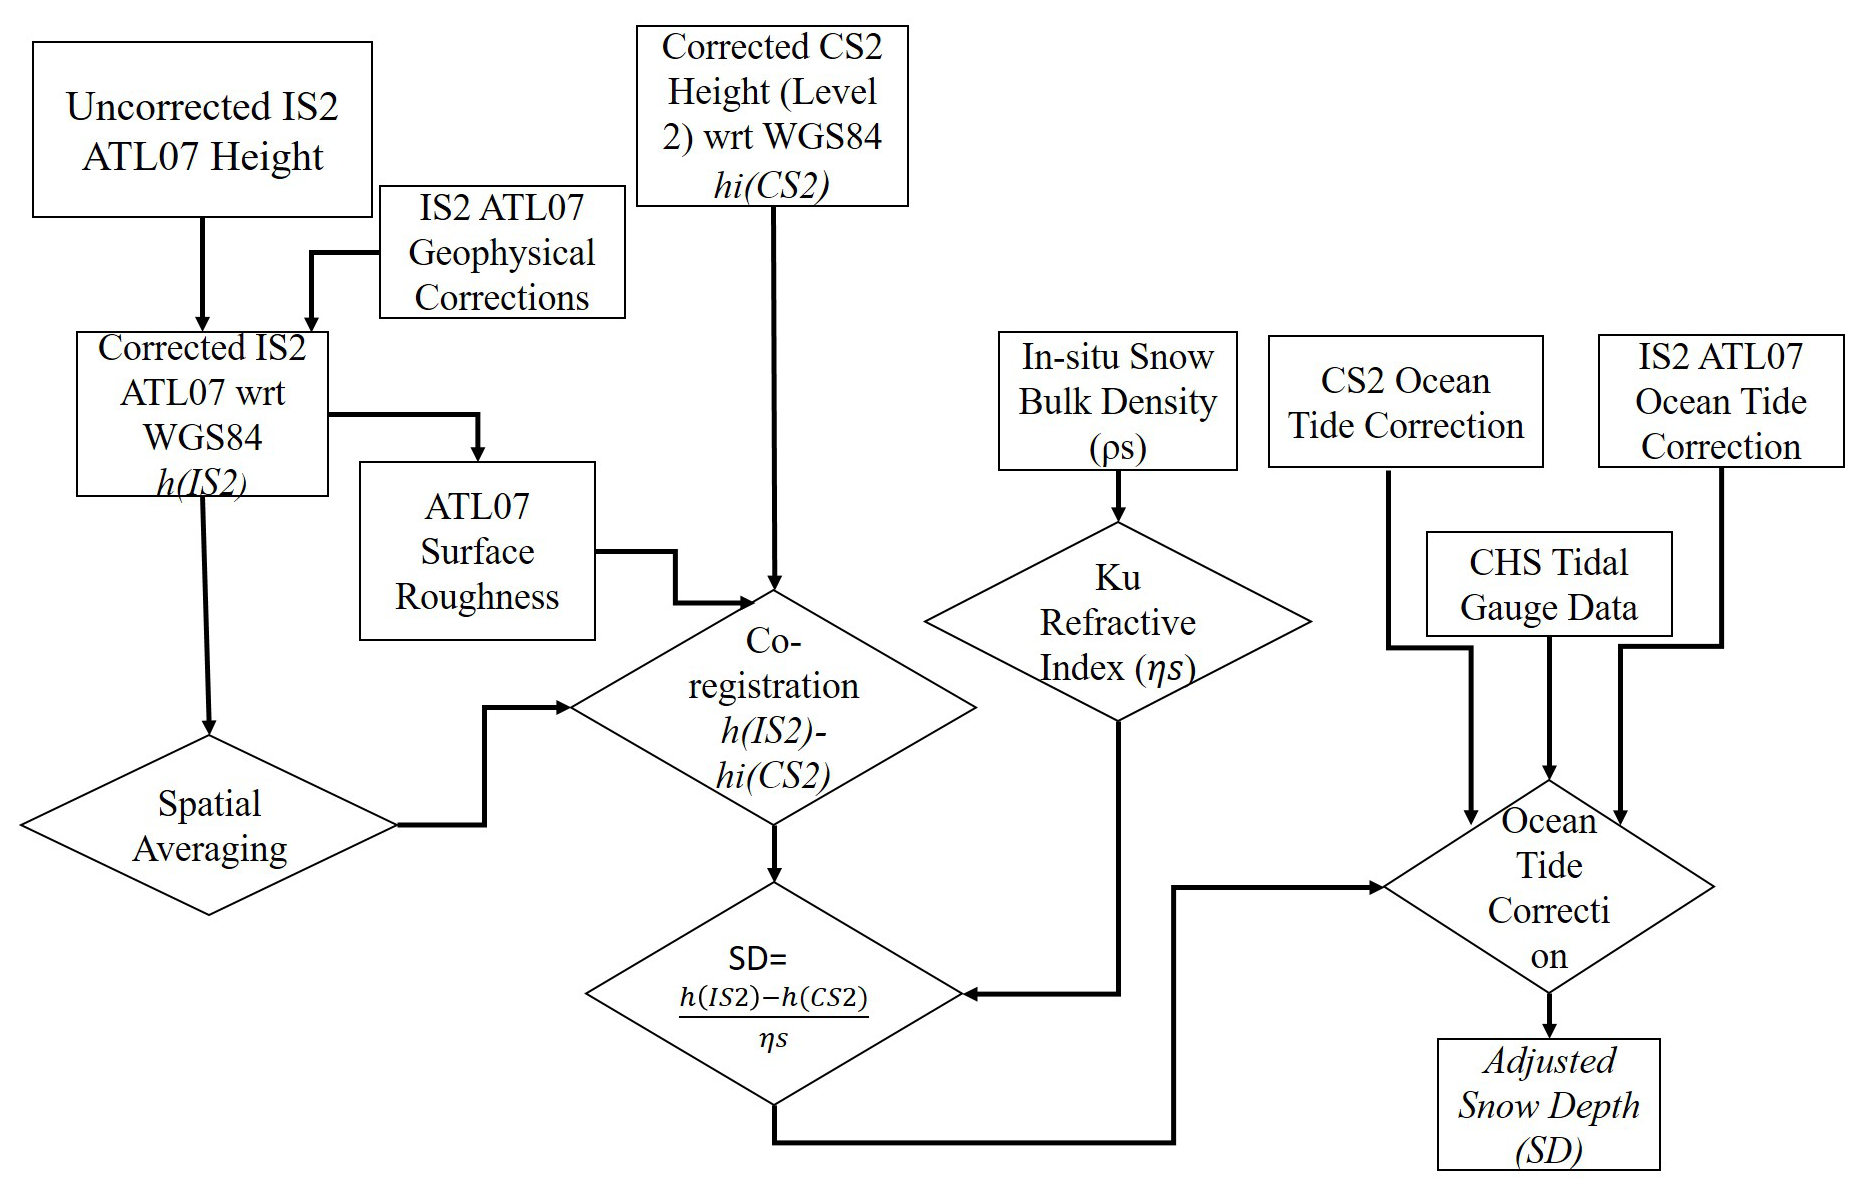
Figure 3Methodological workflow for retrieving snow depth (SD) from CS2 and IS2. Co-registered averaged ATL07 (h(IS2)) and Cryosat-2 heights (h(CS2)) are subtracted following Eq. (1). The differenced product is located at the point of closest approach (POCA) of each CS2 footprint. The differenced product is then adjusted with the refractive index (ηs).
2.7 Adjusting for sea surface height variation
Assuming IS2 and CS2 are viewing the same landfast ice, any variation in sea surface height over the short 77 min interval between tracks is assumed to be due to tidal variations. The long-period equilibrium tide and ocean tide with the inverted barometer corrections were compared between the sensors to identify differences between them. As mentioned earlier, different ocean tide corrections are applied to CS2 and IS2, with values ranging between ±50 cm in CS2 and ±62 cm in IS2 (Kwok et al., 2021, Cryosat-2 Product Handbook), and these have the most significant impact on the height retrievals (Fig. C1; see Fig. S1 in Bagnardi et al., 2021). Ideally, the ocean tide correction applied to IS2 and CS2 should account for the true variation in SSH due to local tides between the data acquisition passes. Although sea ice significantly dampens tides (Rotermund et al., 2021) and tidal fluctuations, in this case the tidal corrections were found to be non-negligible. We compared the average ocean tide corrections to local tidal gauge predictions from the Canadian Hydrographic Service (CHS) (https://tides.gc.ca, last access: 20 January 2025), which are based on real-time and historical tidal gauge measurements from the Cambridge Bay station. The CHS dataset provides instantaneous tidal variations at the CB station every 15 min, with six observations between the IS2 and CS2 passes. The difference in ocean tidal corrections between the IS2 and CS2 pass was 7.9 cm on average along the track, whereas the difference in water level was 6.0 cm according to the CHS data. The difference in height between IS2 and CS2 was therefore adjusted by a single value of 1.9 cm before the snow depths were computed (Fig. 3), and this value then represents a systematic uncertainty in the final snow depth estimates.
2.8 Evaluating other sources of uncertainties
One of the critical assumptions is that IS2 and CS2 tracks are roughly coincident; i.e., both tracks are measuring roughly the same snow despite their reference ground tracks being ∼1.5 km apart. To test this assumption, Sentinel-1 SAR VH backscatter was characterized across both the IS2 and CS2 reference ground tracks. The Sentinel-1 backscatter is sensitive to surface roughness, which roughly corresponds to the snow depths along the track (Cafarella et al., 2019). Therefore, the Sentinel-1 backscatter is used to compare the backscatter profiles along IS2 and CS2 tracks to determine if they are similar and therefore are seeing similar snow depth distributions. Given that IS2 has three different strong beams (IS2 1l, 2l, and 3l), we compare the SAR backscatter across all three tracks and compare it to the SAR backscatter along the CS2 track. We notice that along the IS2 2l track the SAR backscatter shows the most similar backscatter distribution to that along the CS2 track (Fig. 4a). This also aligned with the fact that the IS2 2l beam was the closest (∼1.5 km) from the CS2 points of closest approach (POCA) and therefore would see the most similar snow distributions. Therefore, the IS2 2l was considered for the subsequent Cryo2Ice snow depth calculations. The SAR pixels intersecting with the IS2 and CS2 track were used to calculate the mean backscatter along each track. The mean difference in SAR backscatter was −0.3 dB, less than 1 standard deviation of the backscatter of each track (Fig. 4a). Since both the tracks have similar backscatter, the assumption that they are coincident and observing snowpacks with the same distribution is likely valid. Additionally, the difference in the point-to-point backscatter between IS2 and CS2 was also calculated to assess whether the difference in backscatter is consistent throughout the track (Fig. G1). We see that the average difference in backscatter between the colocated points is within ±1 dB. The average difference in backscatter between IS2 and CS2 is 0.9 dB. Since the tracks have similar backscatter, the assumption that they are coincident and observing snowpacks with the same distribution is likely to be valid in most cases.
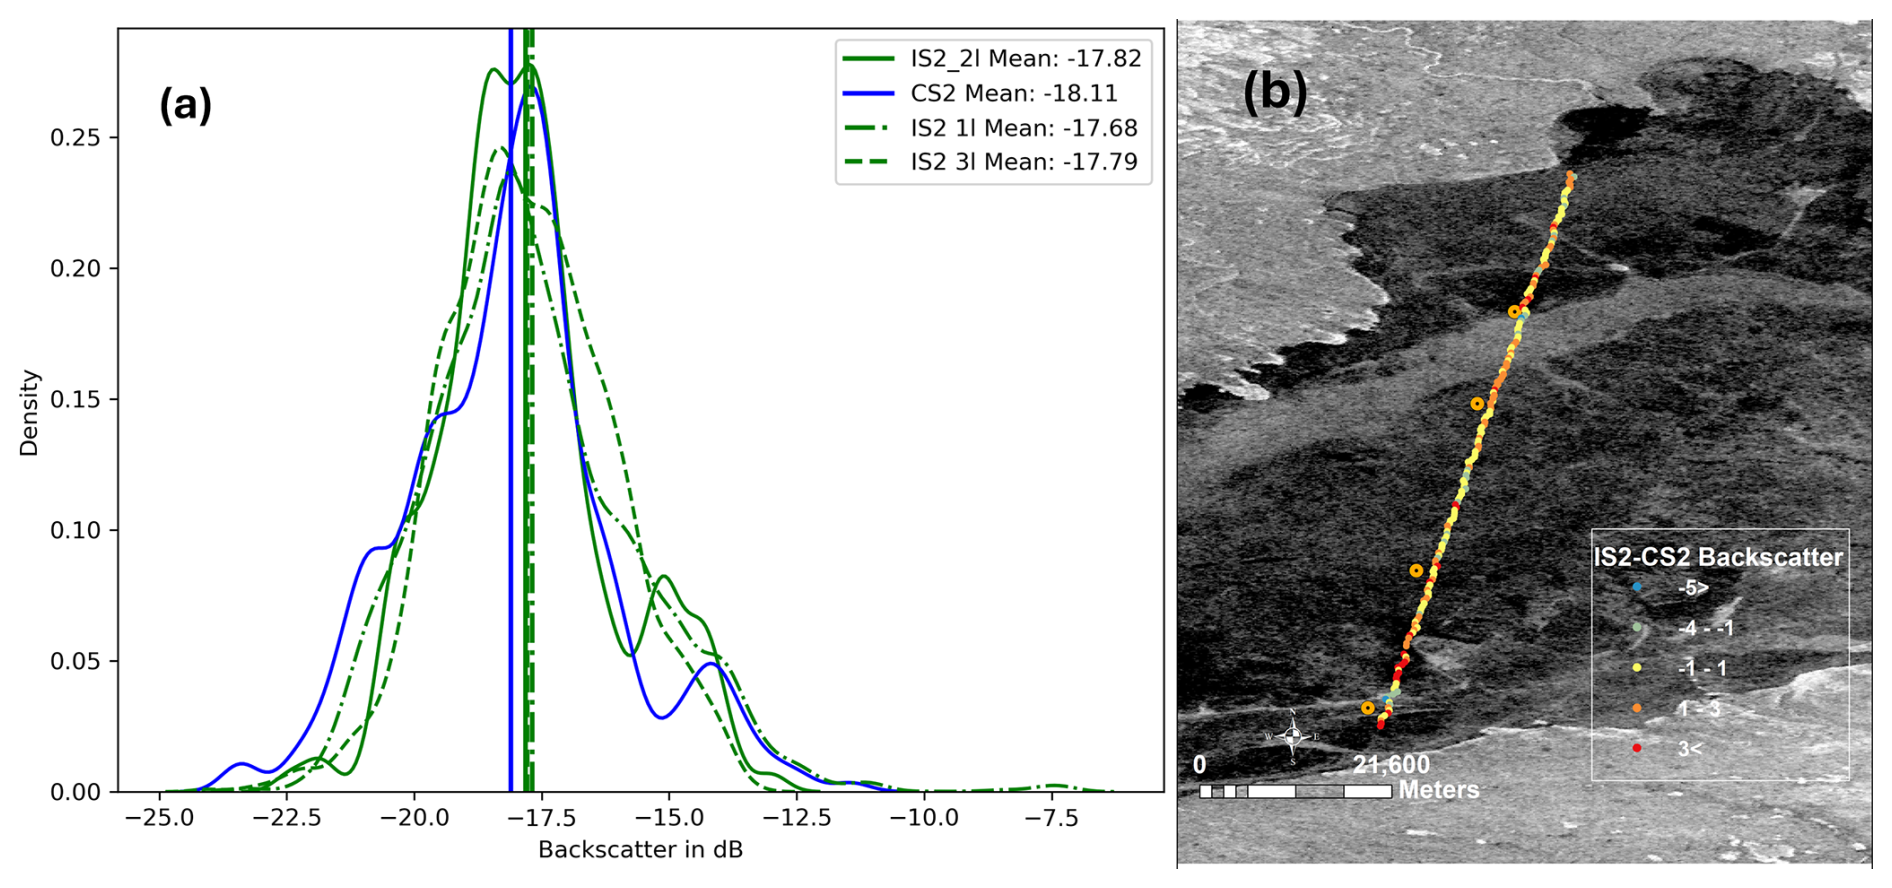
Figure 4(a) Sentinel-1 backscatter (in dB) obtained from all the strong beams of IS2 (IS2 1l, 2l, and 3l) and CS2 track locations. The Sentinel-1 VH backscatter from 5 May 2022 is used for extracting backscatter along both of the tracks to assess whether the observed snow distribution is similar. (b) Spatial distribution of the Sentinel-1 backscatter between the IS2 and CS2 tracks, showing the differences in backscatter between IS2 and CS2 on 5 May 2023.
Landy et al. (2019, 2020) demonstrated the importance of considering surface roughness in radar data processing. Sea ice surface roughness was computed across the IS2 track using the ATL07 sea ice height product. Surface roughness was calculated as the standard deviation of the ATL07 sea ice height product following Farrell et al. (2020). However, instead of the 25 km distance set for pan-Arctic studies, the regional differences in surface roughness were calculated over 300 m length segments to maintain consistency with the spatially averaged ATL07 heights.
Previous studies measured or modeled the dominant scattering surface over first-year sea ice (FYI) at Ku-band (Nandan et al., 2017, 2020; Willatt et al., 2011) several to many centimeters above the snow–sea ice interface even for cold snowpacks. Nandan et al. (2017, 2020) argue that when brine is present within the snowpack, the dominant scattering horizon at Ku-band is shifted upwards by approximately 7 cm above the snow–sea ice interface. Mallett et al. (2020) further demonstrated that the use of fixed snow densities introduced significant biases in the snow depth retrievals. Provided snow salinity impacts the location of the Ku-band-dominant scattering horizon (Nandan et al., 2017), an assessment was conducted to test the bias introduced by choosing different snow bulk densities by assuming (a) Ku-band microwaves penetrate completely through the snow layers to the sea ice surface and (b) Ku-band microwaves penetrate through layers with snow salinity less than 1 ppt. The corresponding average in situ snow bulk densities from (a) the complete snow layer and (b) snow layers with less salinity than 1 ppt were used to compute refractive indices followed by respective snow depth calculations. There was negligible difference in the refractive index (<0.05) when considering the snow bulk densities with differences in salinity, and therefore the average bulk densities from the complete snowpack were used in this study.
3.1 In situ snow depths and distributions
In situ snow depths demonstrate significant spatial variability among the four sampled sites (Fig. 5). The mean snow depth from the four different sites varies between 9 and 17 cm, and all sites have positively skewed distributions (Fig. 5). Site 2 also has some exceptionally high snow depths (>90 cm), corresponding to the ridged areas (Fig. 5), and therefore it shows higher standard deviations (Fig. 5). Site 2 and Site 3 have similar snow distributions (Fig. 5), but the presence of ridging at Site 2 results in a wider tail compared to Site 3. The maximum snow depth of 80 cm was recorded at Site 2 and was picked up directly adjacent to the ridge. Site 4 has the highest mean snow depth (Fig. 5) and the thickest-tailed snow distribution (Fig. 5). The distinctive snow depth characteristics were also evident from the standard deviation of snow depth among the four sites. Site 2 had significant ridging and the highest standard deviation of snow depth (15.8 cm). Site 1R and Site 4 had rougher sea ice and had high standard deviations of snow depth (13.7 (Site 1R) and 13.9 (Site 4)).
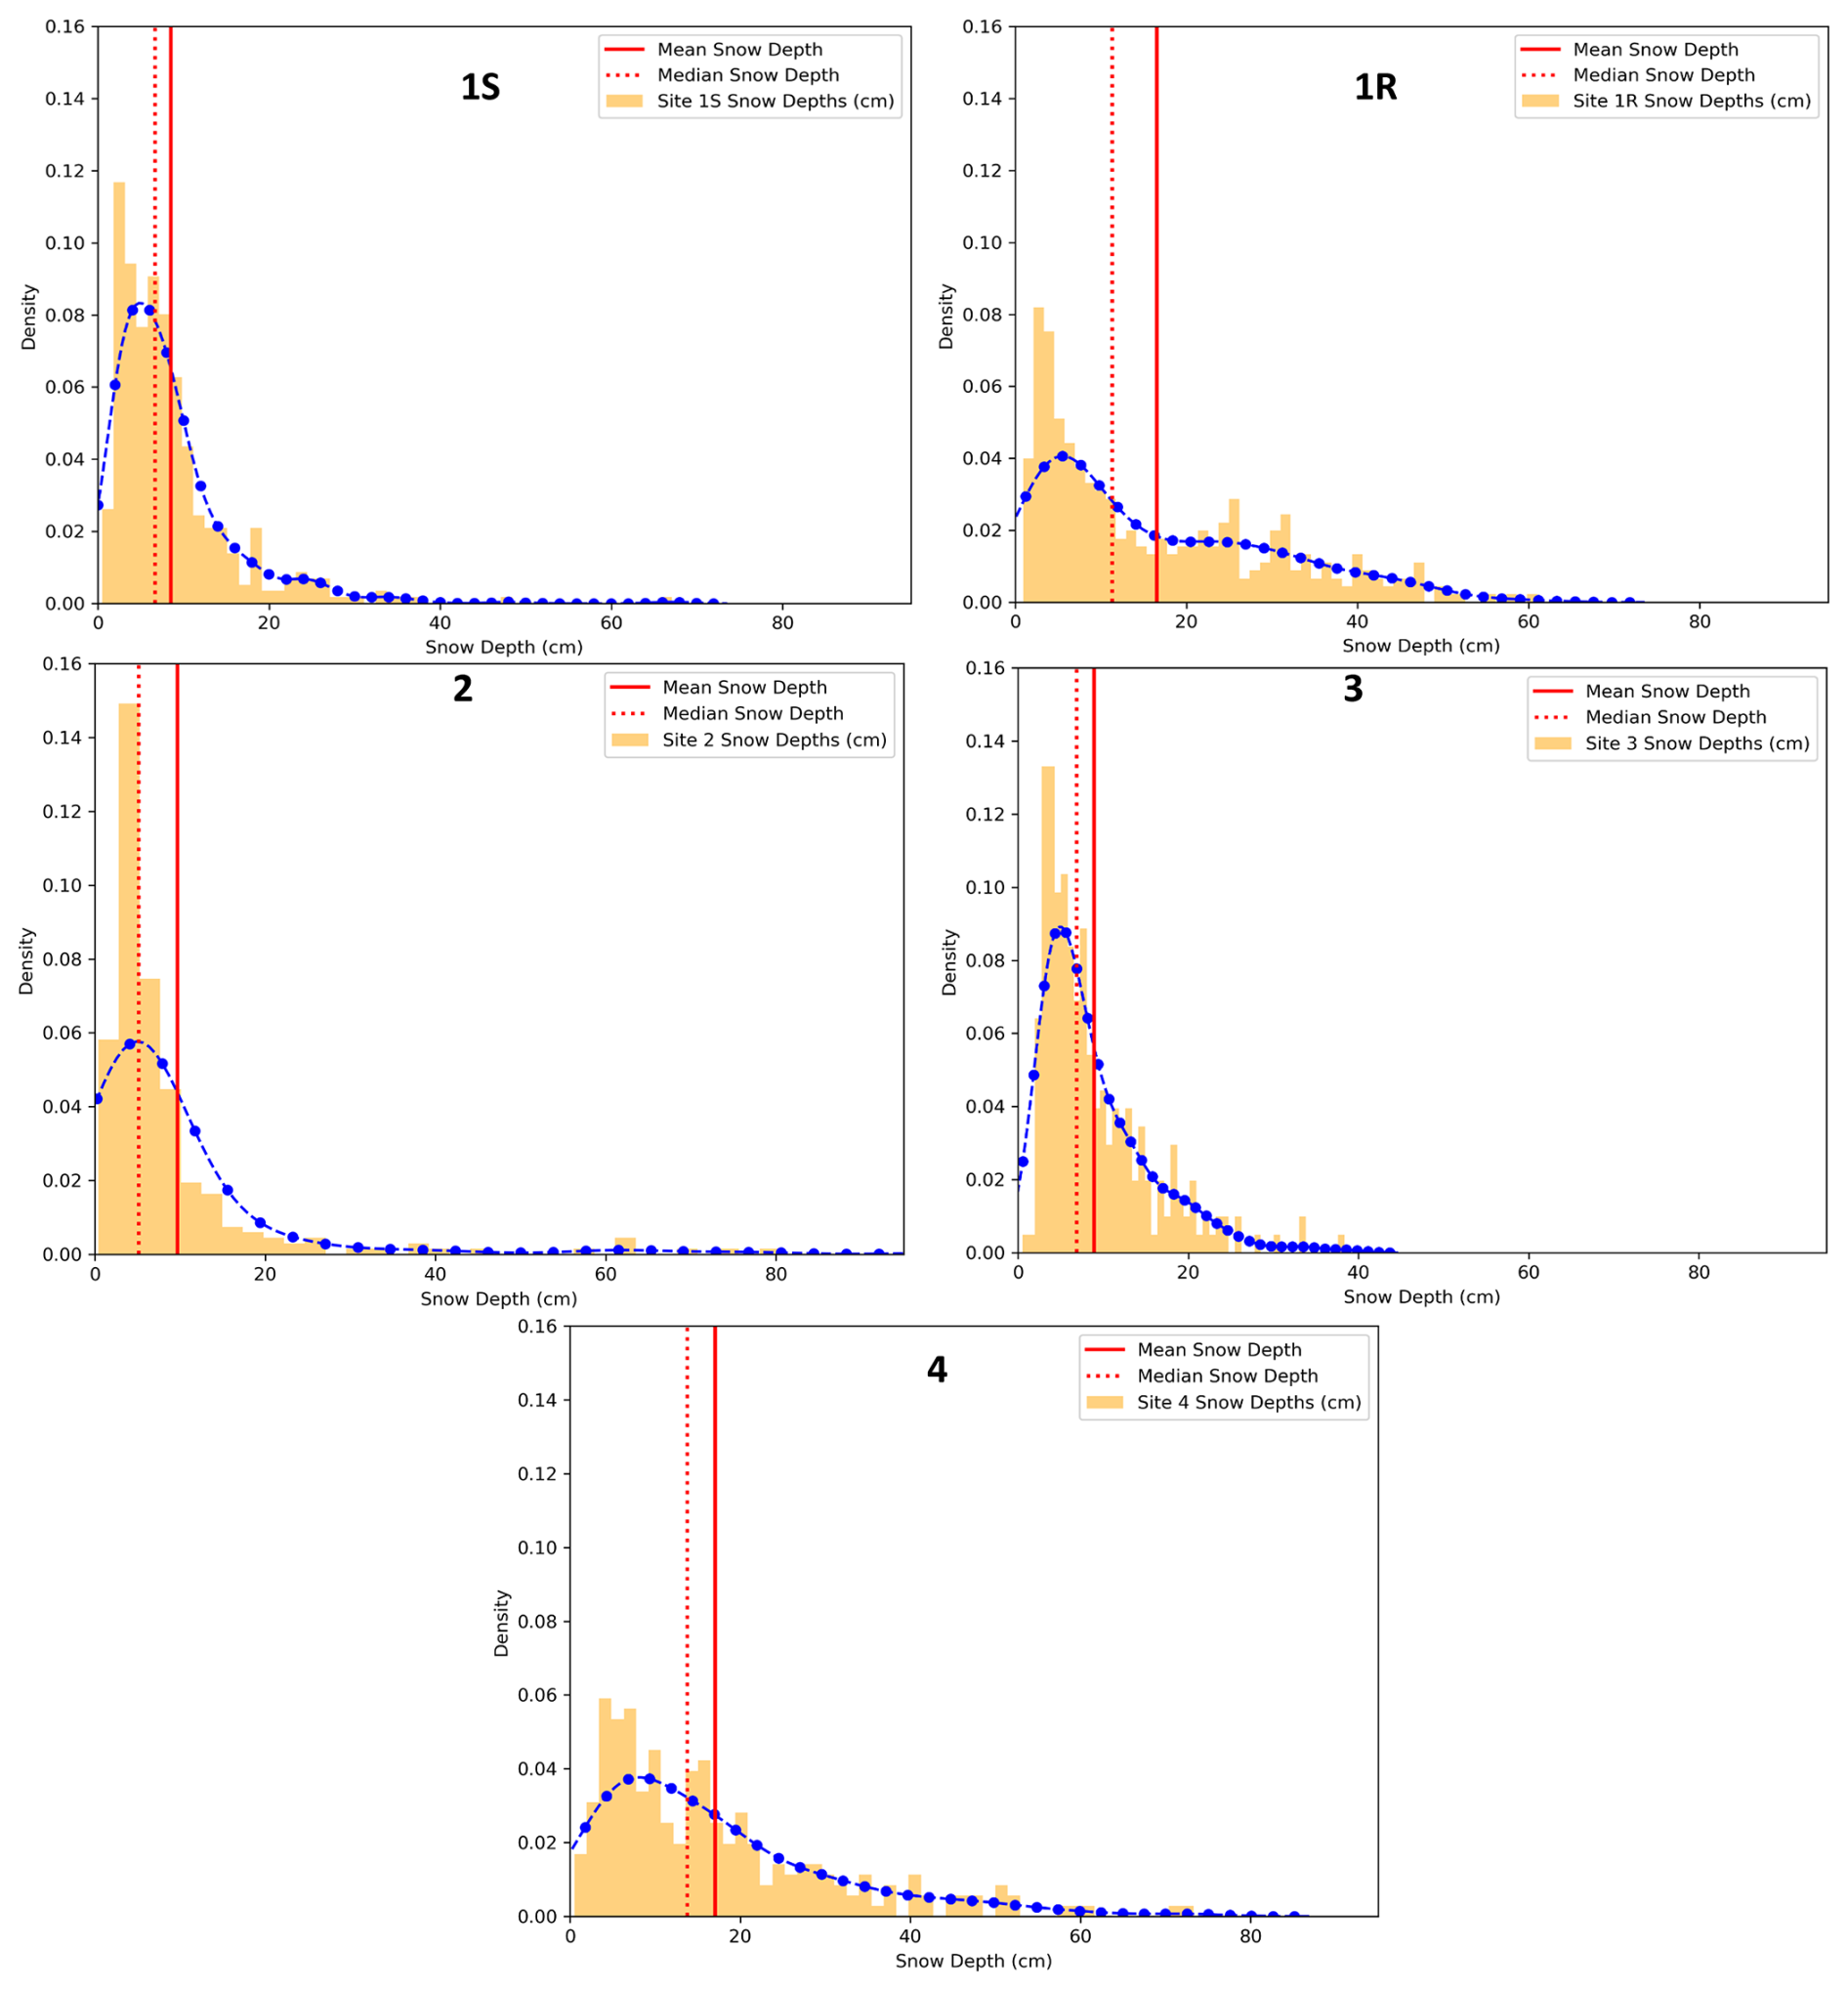
Figure 5Snow depth distributions from the four in situ measurement sites along the Cryo2Ice transect. The density distribution curve is shown in blue.
3.2 Snow geophysical parameters
Mean snow salinity varies between 1.5 and 3.0 ppt for Sites 1S, 2, 3, and 4, whereas at Site 1S the snow salinity is 6.78 ppt (Fig. 6). The mean snow bulk density varies between 0.358 and 0.374 g cm−3 at all sites, with the exception of Site 3, where the mean snow density is 0.248 g cm−3.
Vertical profiles of snow salinity and bulk density present further insights. As shown in Fig. 6, the snow density patterns are similar for Sites 1R, 1S, 2, and 4, with bulk density ranging between 0.260 and 0.420 g cm−3 and being lower at the base of the snowpack than the surface (Fig. 6). The snow density varies in the different snow layers, but there is a general trend towards higher densities at 4 to 7 cm above the snow–ice interface at all sites (Fig. 6). This is attributed to the presence of a wind slab snow layer that is most prominent at Sites 1R, 2, and 4.
Snow salinity shows higher salinities closer to the snow–ice interface but decreasing with height up the interface (Fig. 6a). For snow pits greater than 7.5 cm in thickness, the salinity is less than 1 ppt closer to the air–snow interface. There is a spike in salinity between 5 and 3 cm from the snow–ice interface at Site 3 that corresponds to the high bulk density snow layer (Fig. 6b).
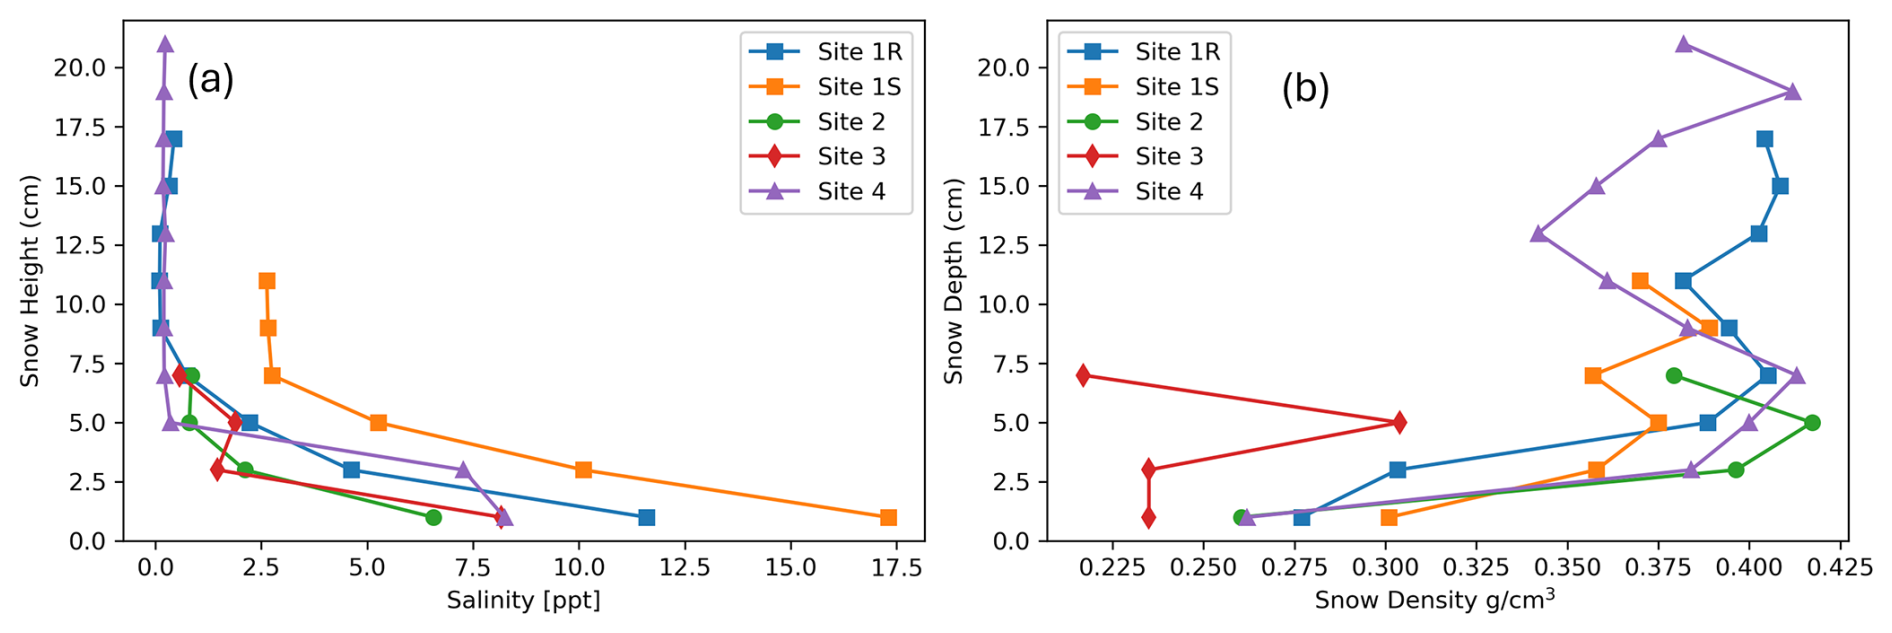
Figure 6(a) Snow salinity and (b) snow density change by snowpack depth at the four snow sampling sites. Zero snow depth in both plots represents the snow–ice interface.
3.3 ICESat-2- and Cryosat-2-derived snow depths
Snow depths were calculated based on the ellipsoidal height difference between the IS2 2l and CS2 after adjusting for the difference in tides, as explained in Sect. 2.6 (Fig. E1). IS2 2l was closest to the CS2 points of closest approach (POCA), which ensured that the uncertainty due to the difference in spatial colocation of IS2 and CS2 was minimized, as explained in Sect. 2.7. The CS2 (h(CS2) and IS2 (h(IS2)) heights show a general pattern of lower CS2 heights relative to co-registered IS2 heights (Fig. 7). The correlation of the CS2 ellipsoidal height with the Cryo2Ice snow depth (0.2509) is higher than the IS2 ellipsoidal heights (−0.1213), which implies that the snow depths would be impacted more by the noise in CS2 heights compared to IS2. The h(IS2) − h(CS2) ranges between −26.5 and 50.0 cm, with a mean difference of 7.9 cm. A total of 20 % of the calculated differences are negative, and these values are distributed randomly along the track (Fig. 8). While negative snow depths do not have a physical basis, we include them in the subsequent snow depth calculations to not discard the impacts of altimeter noise on the retrieved heights (Fredensborg Hansen et al., 2024). The noises in the CS2 heights that are evident in Fig. 7 correspond to the large negative snow depth values (Figs. 7, 8). Therefore, to reduce the negative bias in snow depths due to the CS2 noise, we exclude negative snow depth values that are 2 standard deviations away from the mean Cryo2Ice snow depths in the subsequent calculations (Fig. 9).
The adjusted mean snow depth across the whole Cryo2Ice track is 7.4 cm (Fig. 5). A maximum snow depth of 39.4 cm is retrieved from Cryo2Ice at a length scale of 300 m, which is significantly lower than the maximum snow depths measured in situ >90 cm.
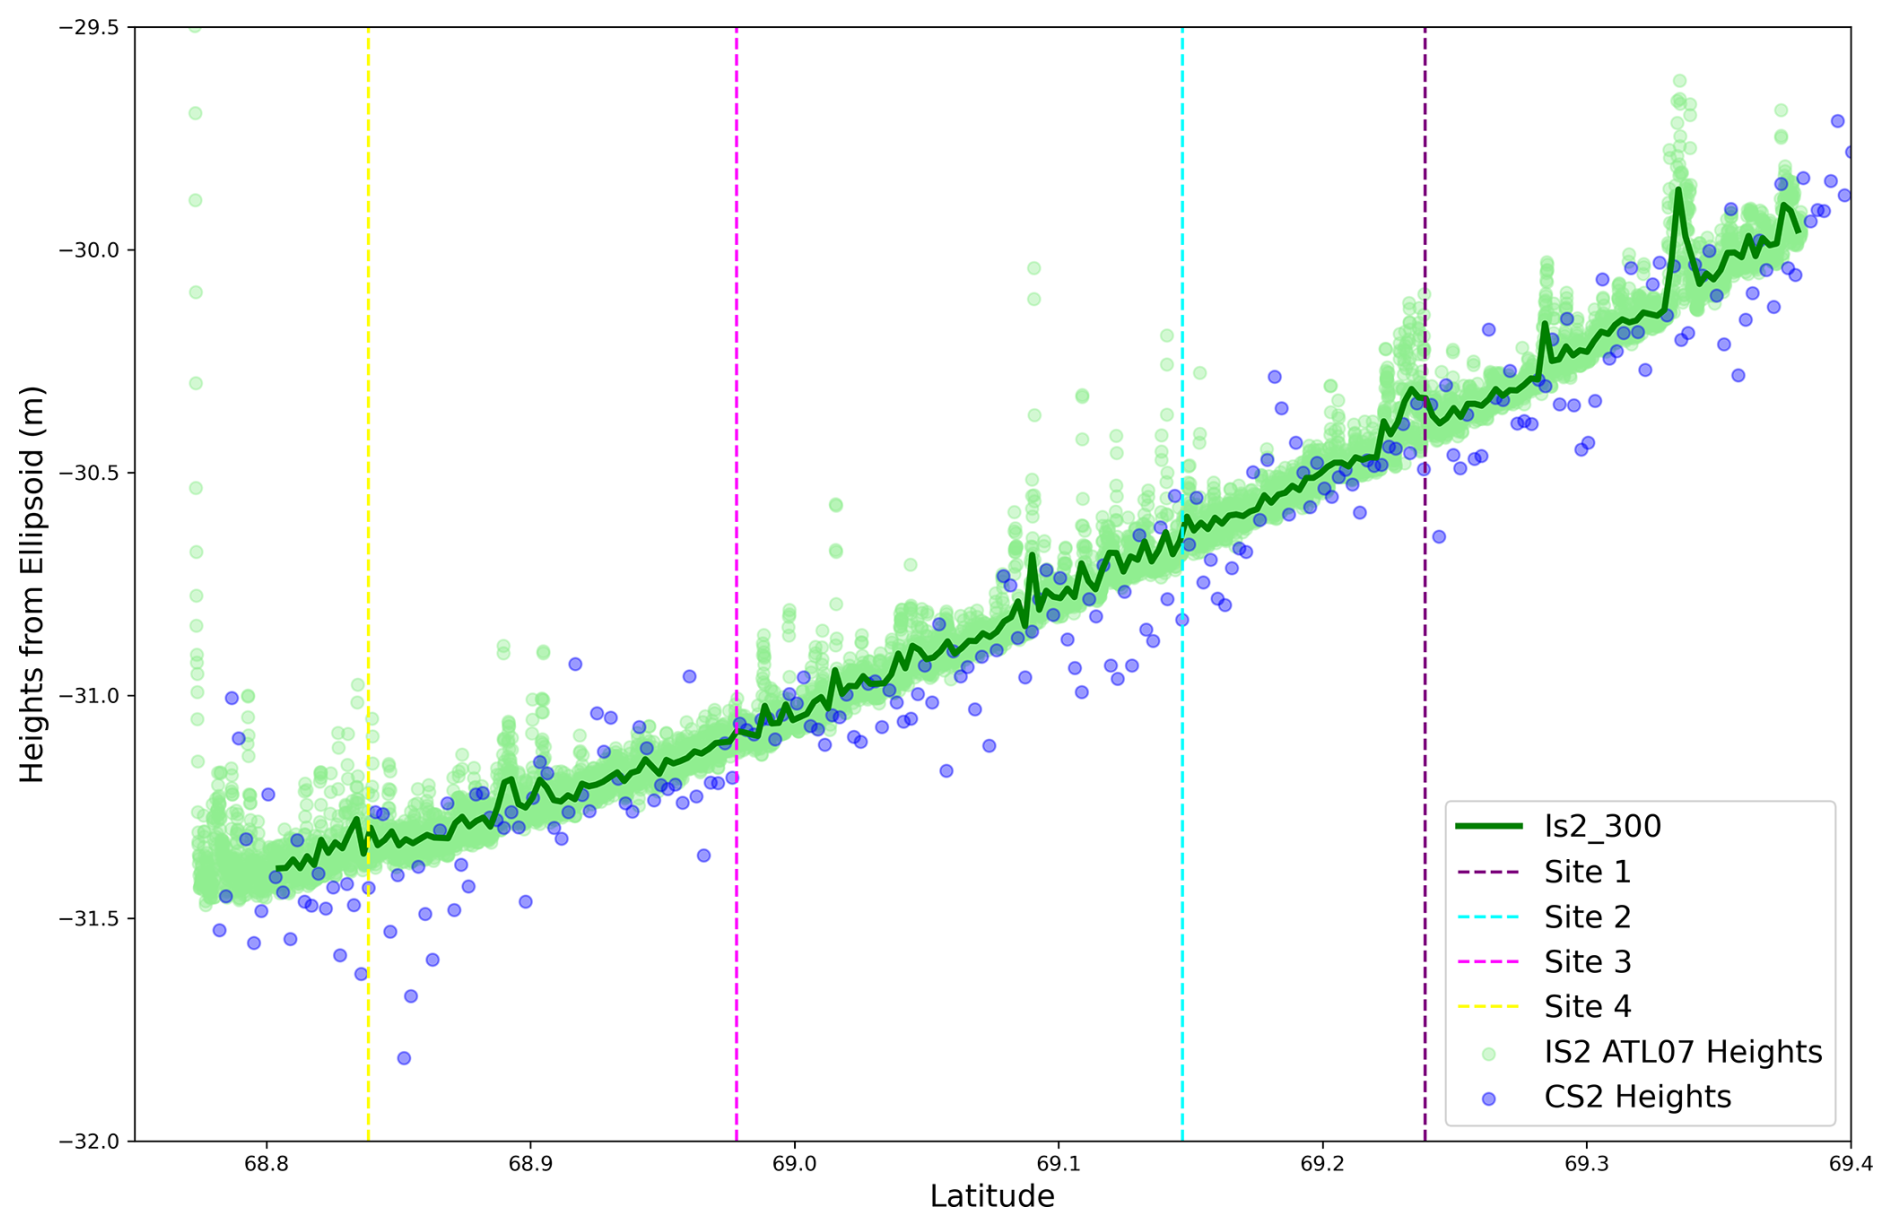
Figure 7IS2 ATL07 sea ice heights plotted along with CS2 surface heights. Note that the reported heights are relative heights and can be negative because of the WGS84 ellipsoid reference heights in the study area. The light green color indicates the raw ATL07 heights (IS2 ATL07 Heights). The solid green line indicates the aggregated ATL07 heights aggregated every 300 m (IS2_300). The purple color indicates the CS2 heights.
Snow depths shown in Fig. 9 display a right-skewed distribution with a sharper and heavier tail compared to a normal distribution. This is consistent with the distributions obtained from the in situ snow sites (Fig. 5). Analyzing the spatial distribution of the retrieved snow depths demonstrates that there is high spatial variability in the retrieved Cryo2Ice snow depths (Fig. 8).
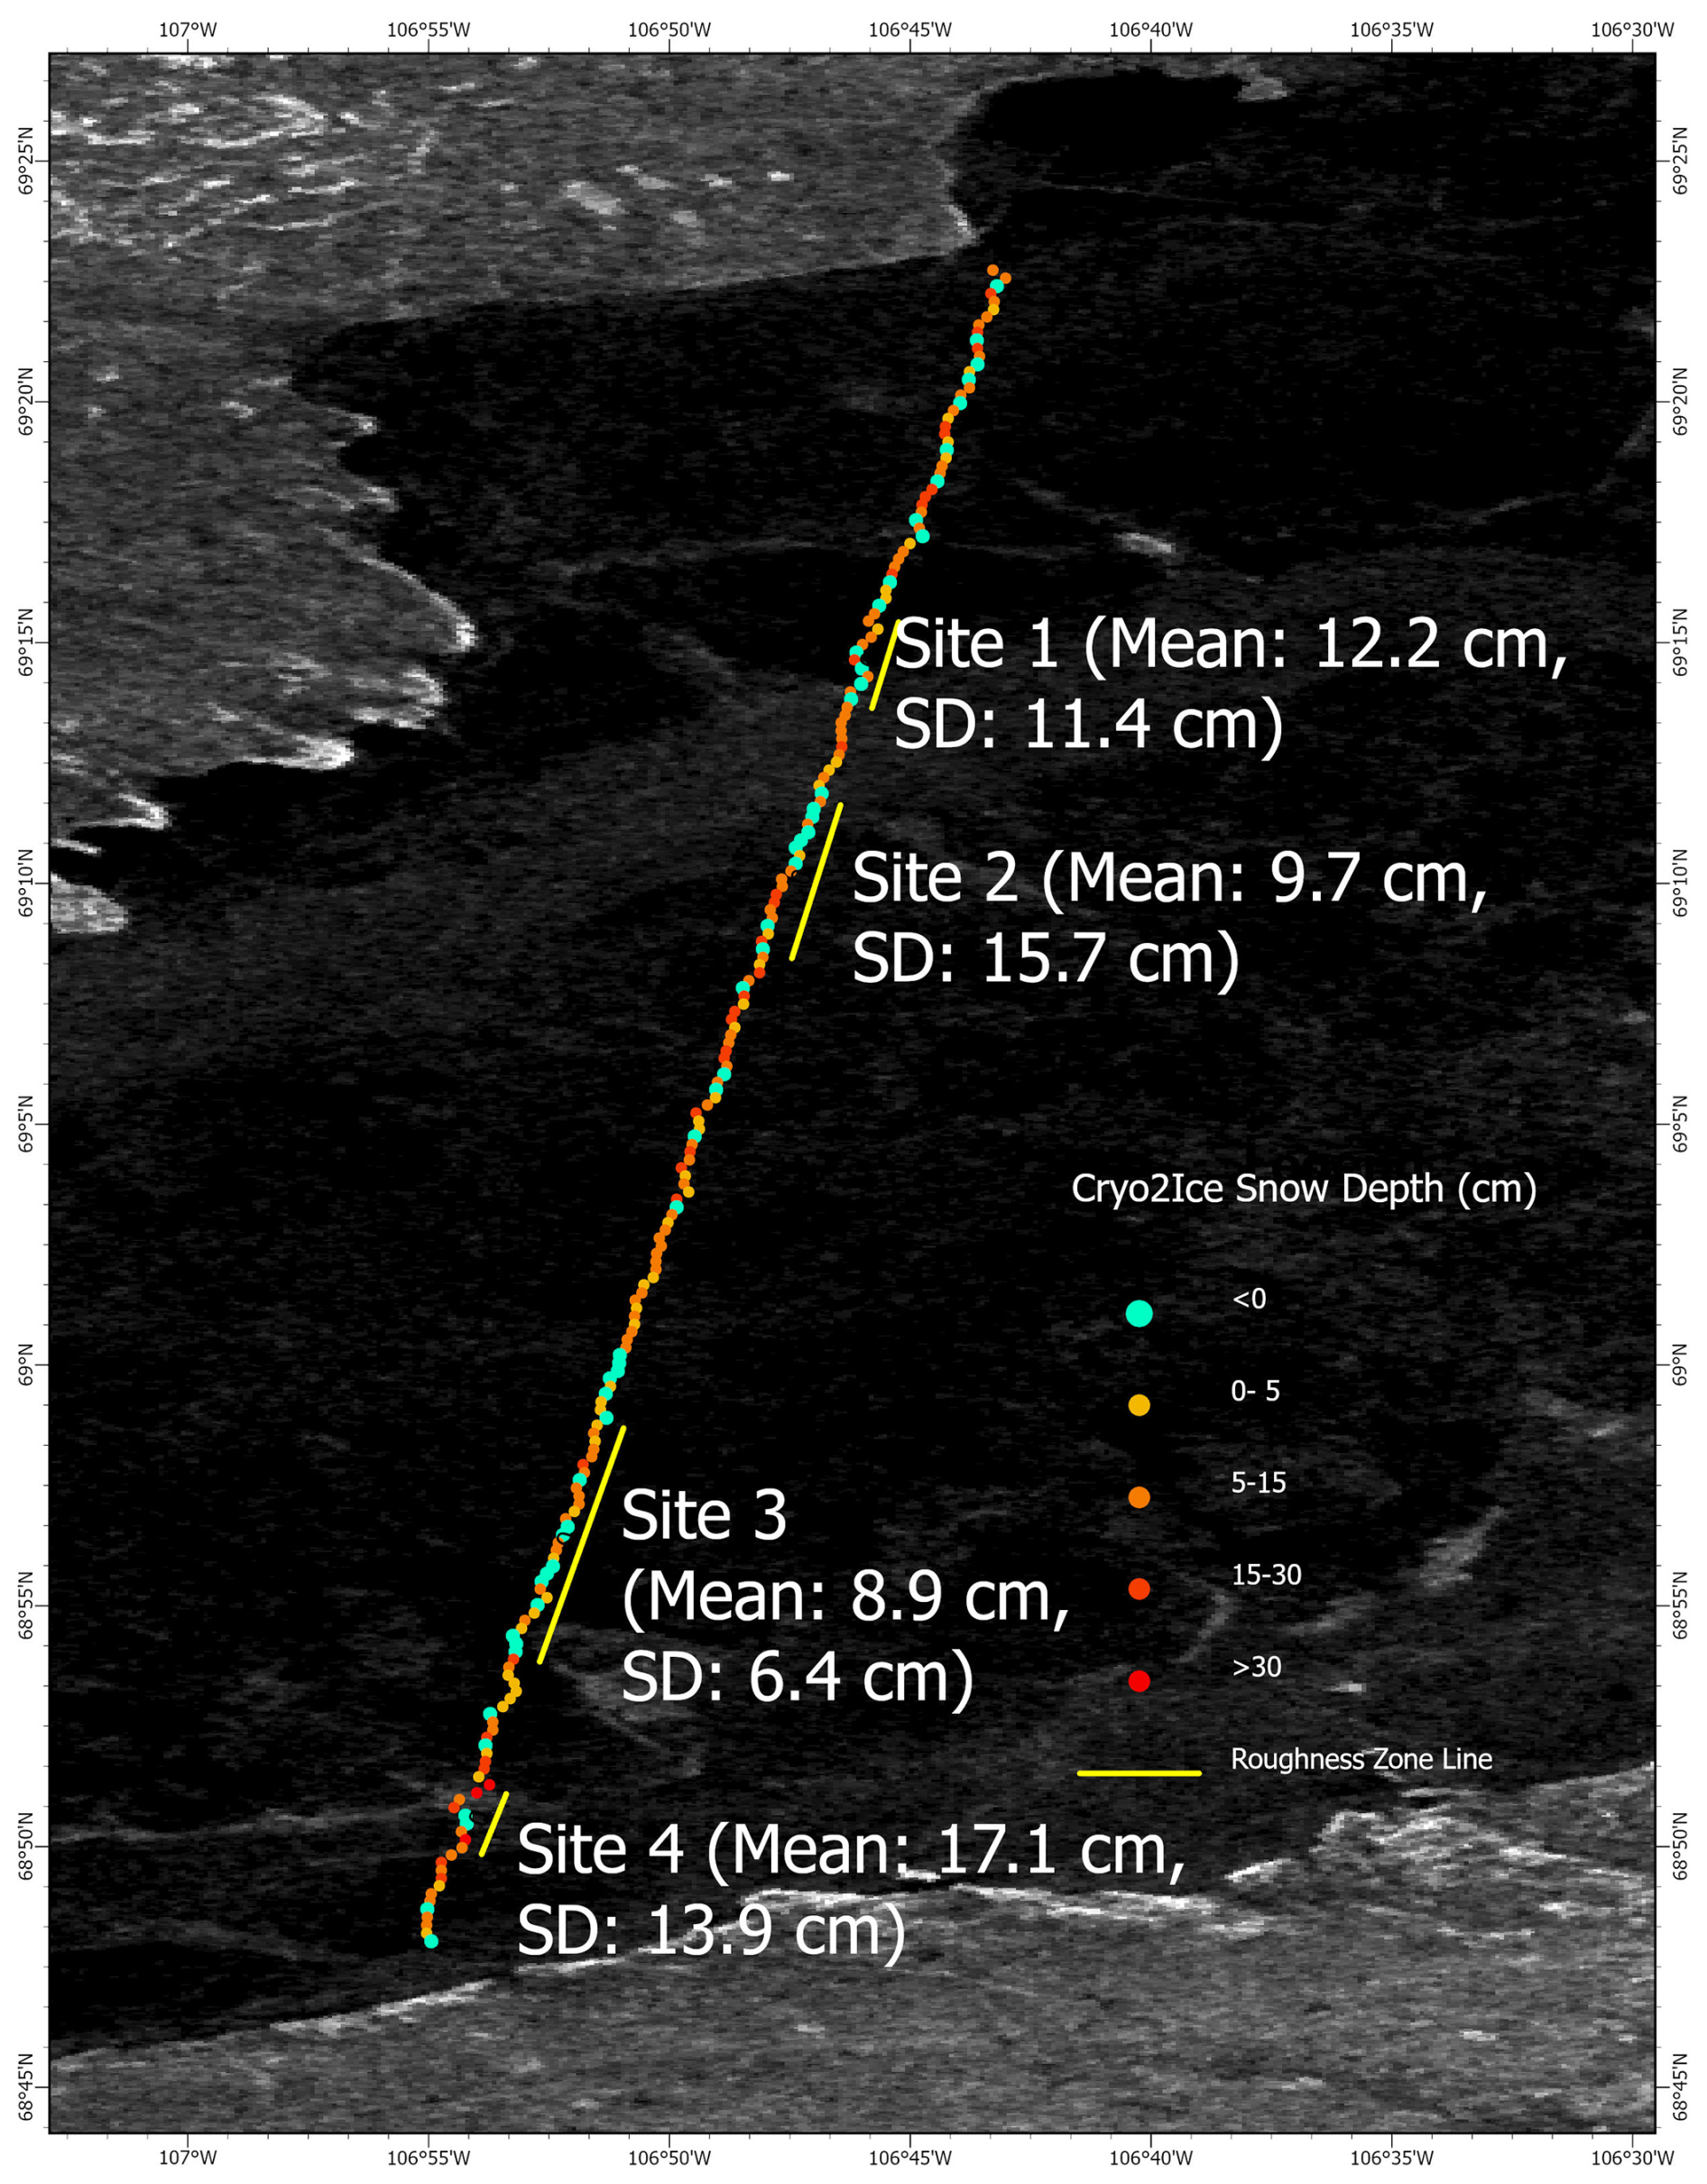
Figure 8Spatial distribution of 300 m scale Cryo2Ice snow depths across the CS2- and IS2-derived track. The background image is a Sentinel-1 HH backscatter image from 5 May 2022. The mean and standard deviation (SD) values of the in situ snow depths for the surveyed sites are included in parentheses.
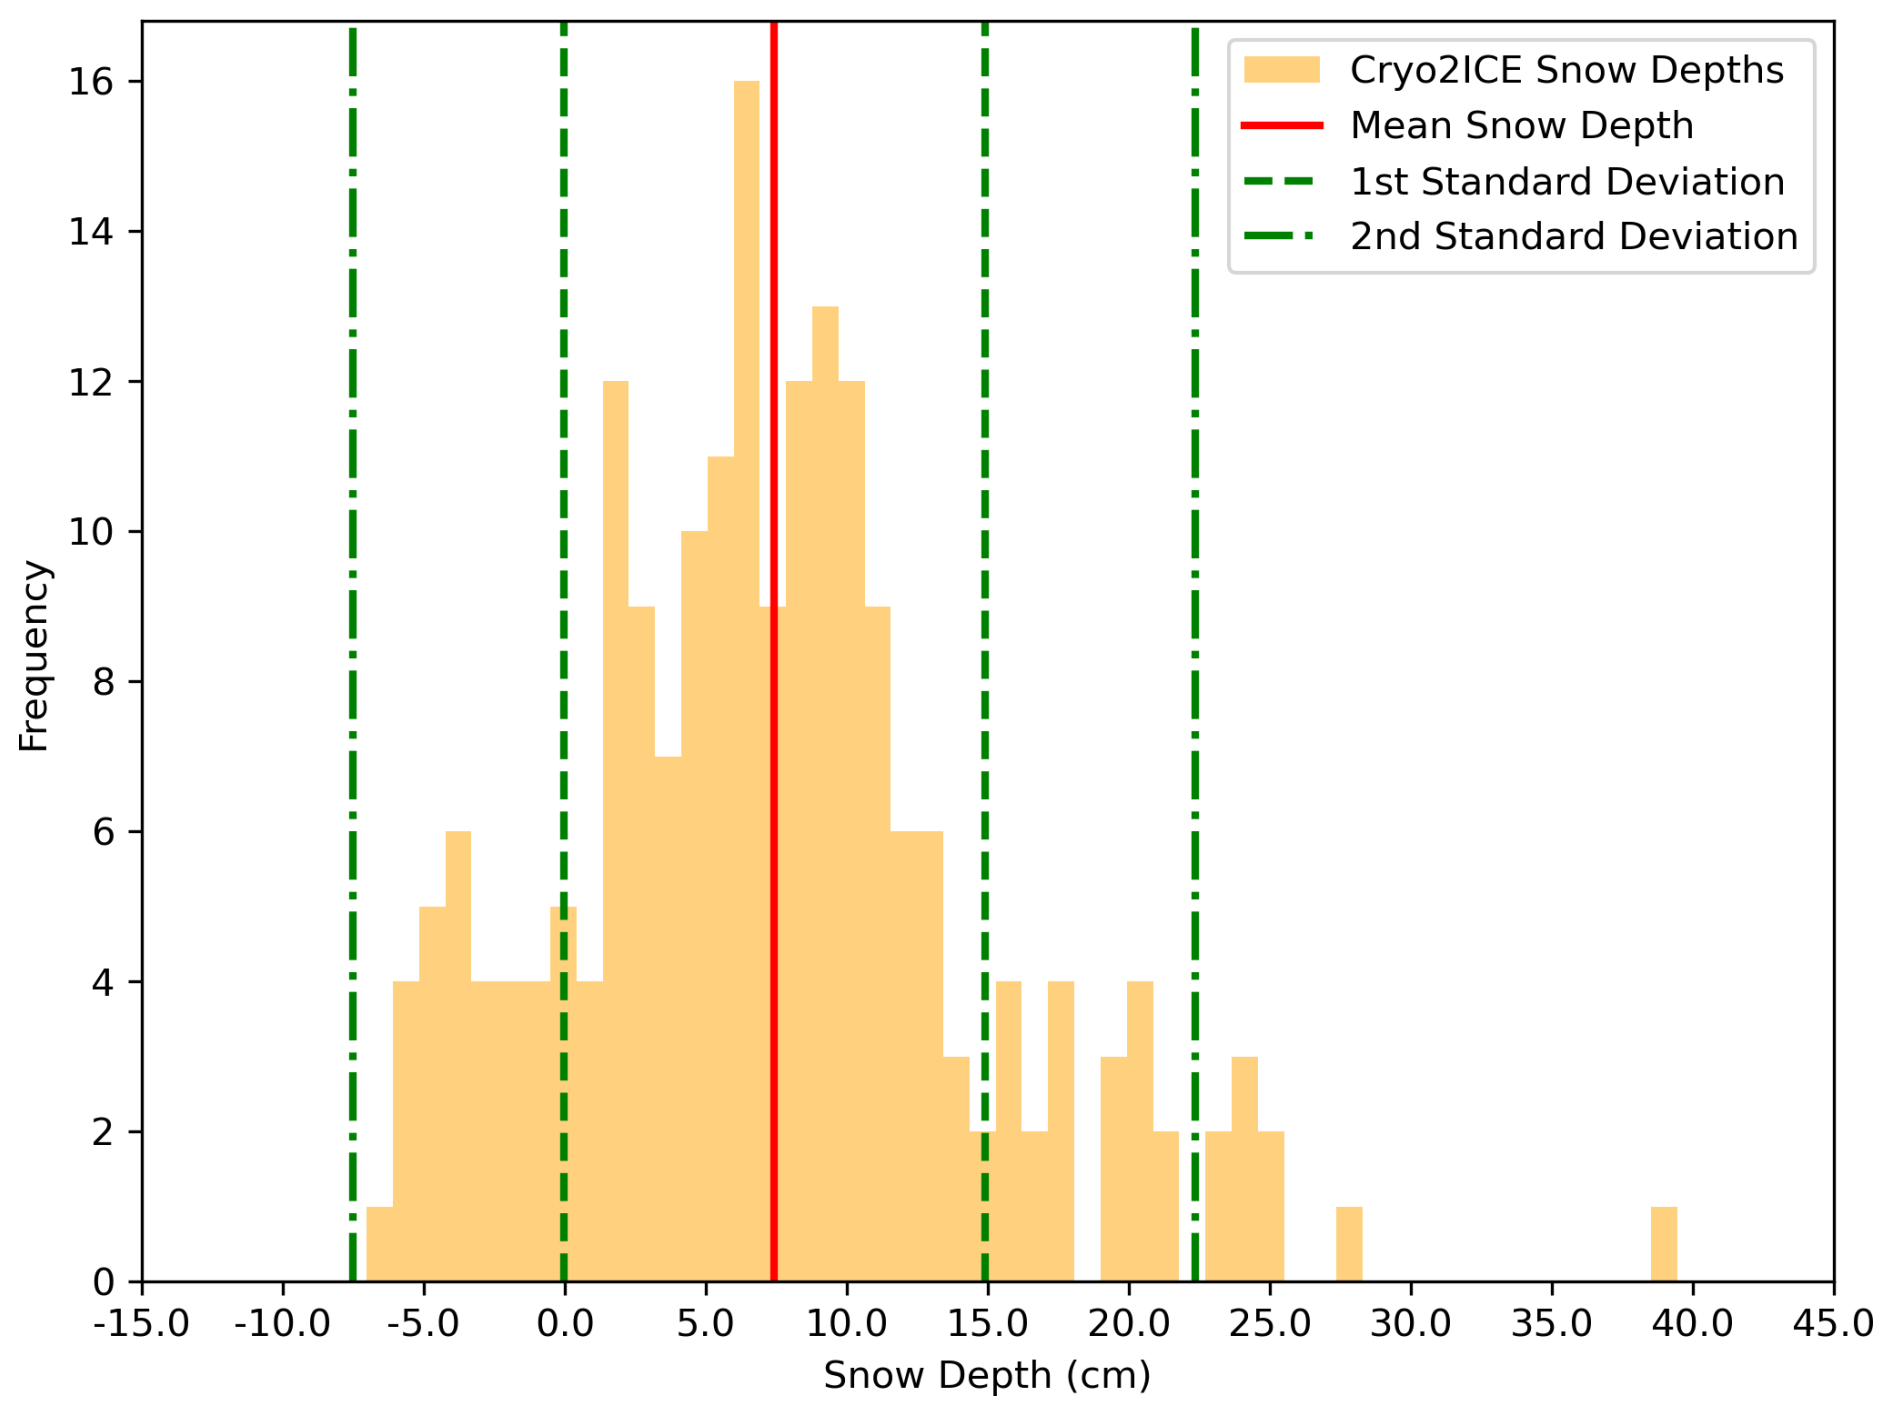
Figure 9Histogram showing the density distribution of the retrieved snow depth in the native 300 m resolution along the Cryo2Ice track with the mean and the median snow depths. Negative snow depths greater than 2 standard deviations from the mean snow depth were removed to reduce the impact of CS2 noise.
4.1 Snow depth: Cryo2Ice vs. in situ data
Previous field observations from Yackel et al. (2019) and Nandan et al. (2020) suggest that mean snow depth of FYI in Dease Strait during late winter ranges between 10 and 30 cm depth (Table 1). While our mean in situ snow depth measurements (11.9 cm) are within the typical range reported in previous surveys, we see that the Cryo2Ice mean snow depth (7.44 cm) underestimated the observed snow depths (Table 1).
Table 1In situ snow depth measurements at Dease Strait. The range of mean snow depths represents the range of mean snow depths retrieved from the sampled sites.
Cryo2Ice snow depths showed similar relative patterns when compared to in situ snow depth sampling. The thinnest (Site 3) and thickest (Site 4) mean snow depths found in the in situ measurements are corroborated with Cryo2Ice snow depths as well. A Kruskal–Wallis non-parametric test (Kruskal and Wallis, 1952) was conducted to assess statistically significant differences between the snow depths retrieved from the in situ data and Cryo2Ice. The test results show significant differences between in situ sites, which was also evident in the corresponding Cryo2Ice snow depths.
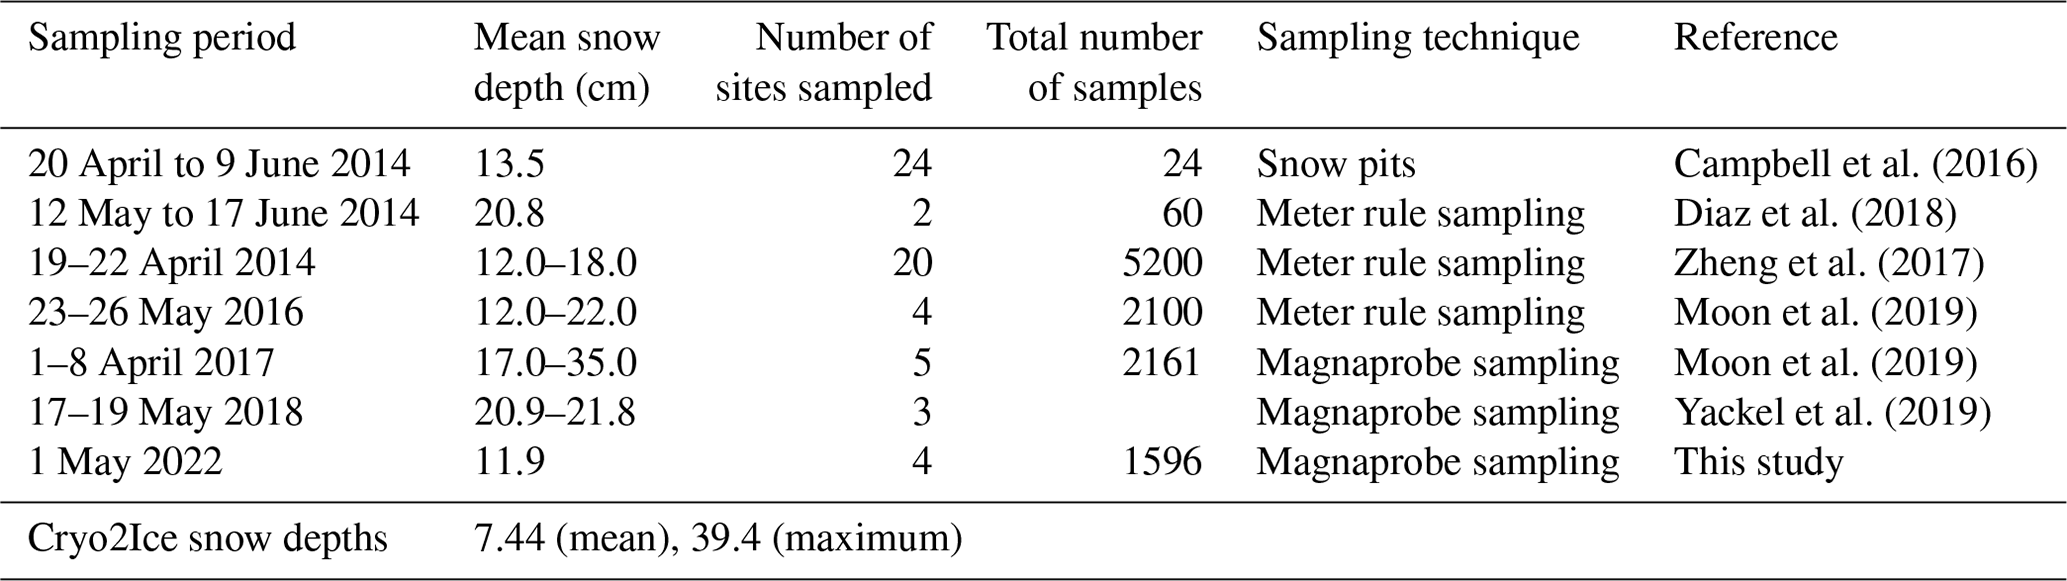
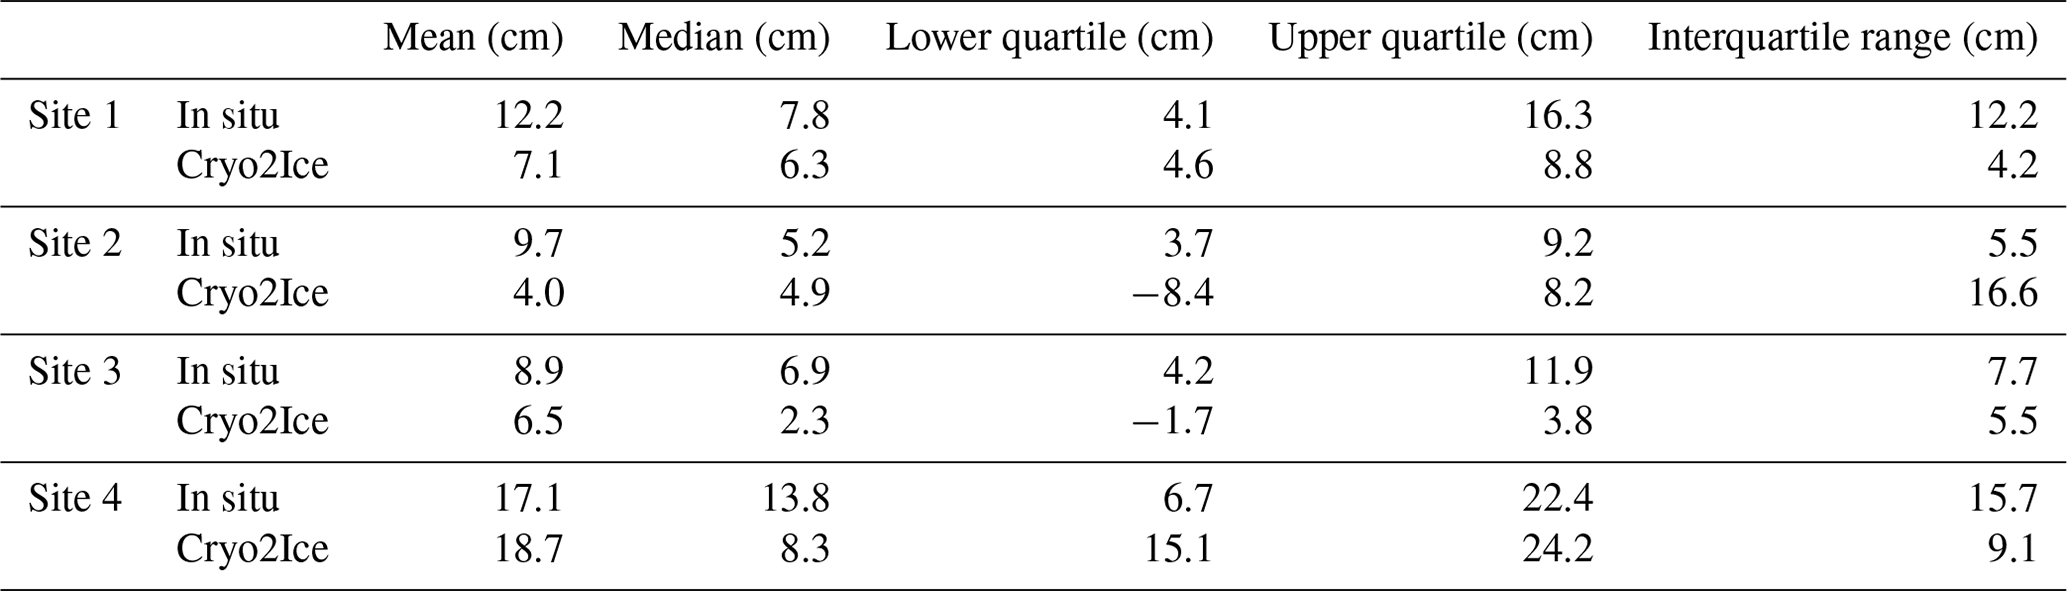
Considering the median bias of snow depths reduces the impact of the outliers, i.e., the retrieved negative snow depths, meaning that Cryo2Ice snow depths are on average 3.07 cm thinner than the in situ data, which is a 1 cm larger difference than the manual tidal correction we applied to compare the CS2 and IS2 track heights (i.e., the largest known systematic uncertainty during processing) (Fig. F1). This pattern of a few centimeters of mean snow depth underestimation by Cryo2Ice is consistently observed across four sites (Fig. 10; Table F1). It is evident that while IS2 has a much finer resolution, the larger footprint of CS2 means that the spatial variability of snow depths under the kilometer scale is not well represented by Cryo2Ice. For instance, the Cryo2Ice snow depths are consistently truncated at the thick end of the distribution, with at least some portion of the in situ distributions above ∼30–50 cm seemingly unresolved from space (Fig. 10).
We also notice that the Cryo2Ice snow depth distributions are generally wider than the in situ distributions, which is due to the impact of the significant negative snow depths that are included in the calculation. These negative snow depths, while included in the initial calculations to reflect the true native resolution results, do not have a physical basis, leading to artificial widening of the distributions in Fig. 10.
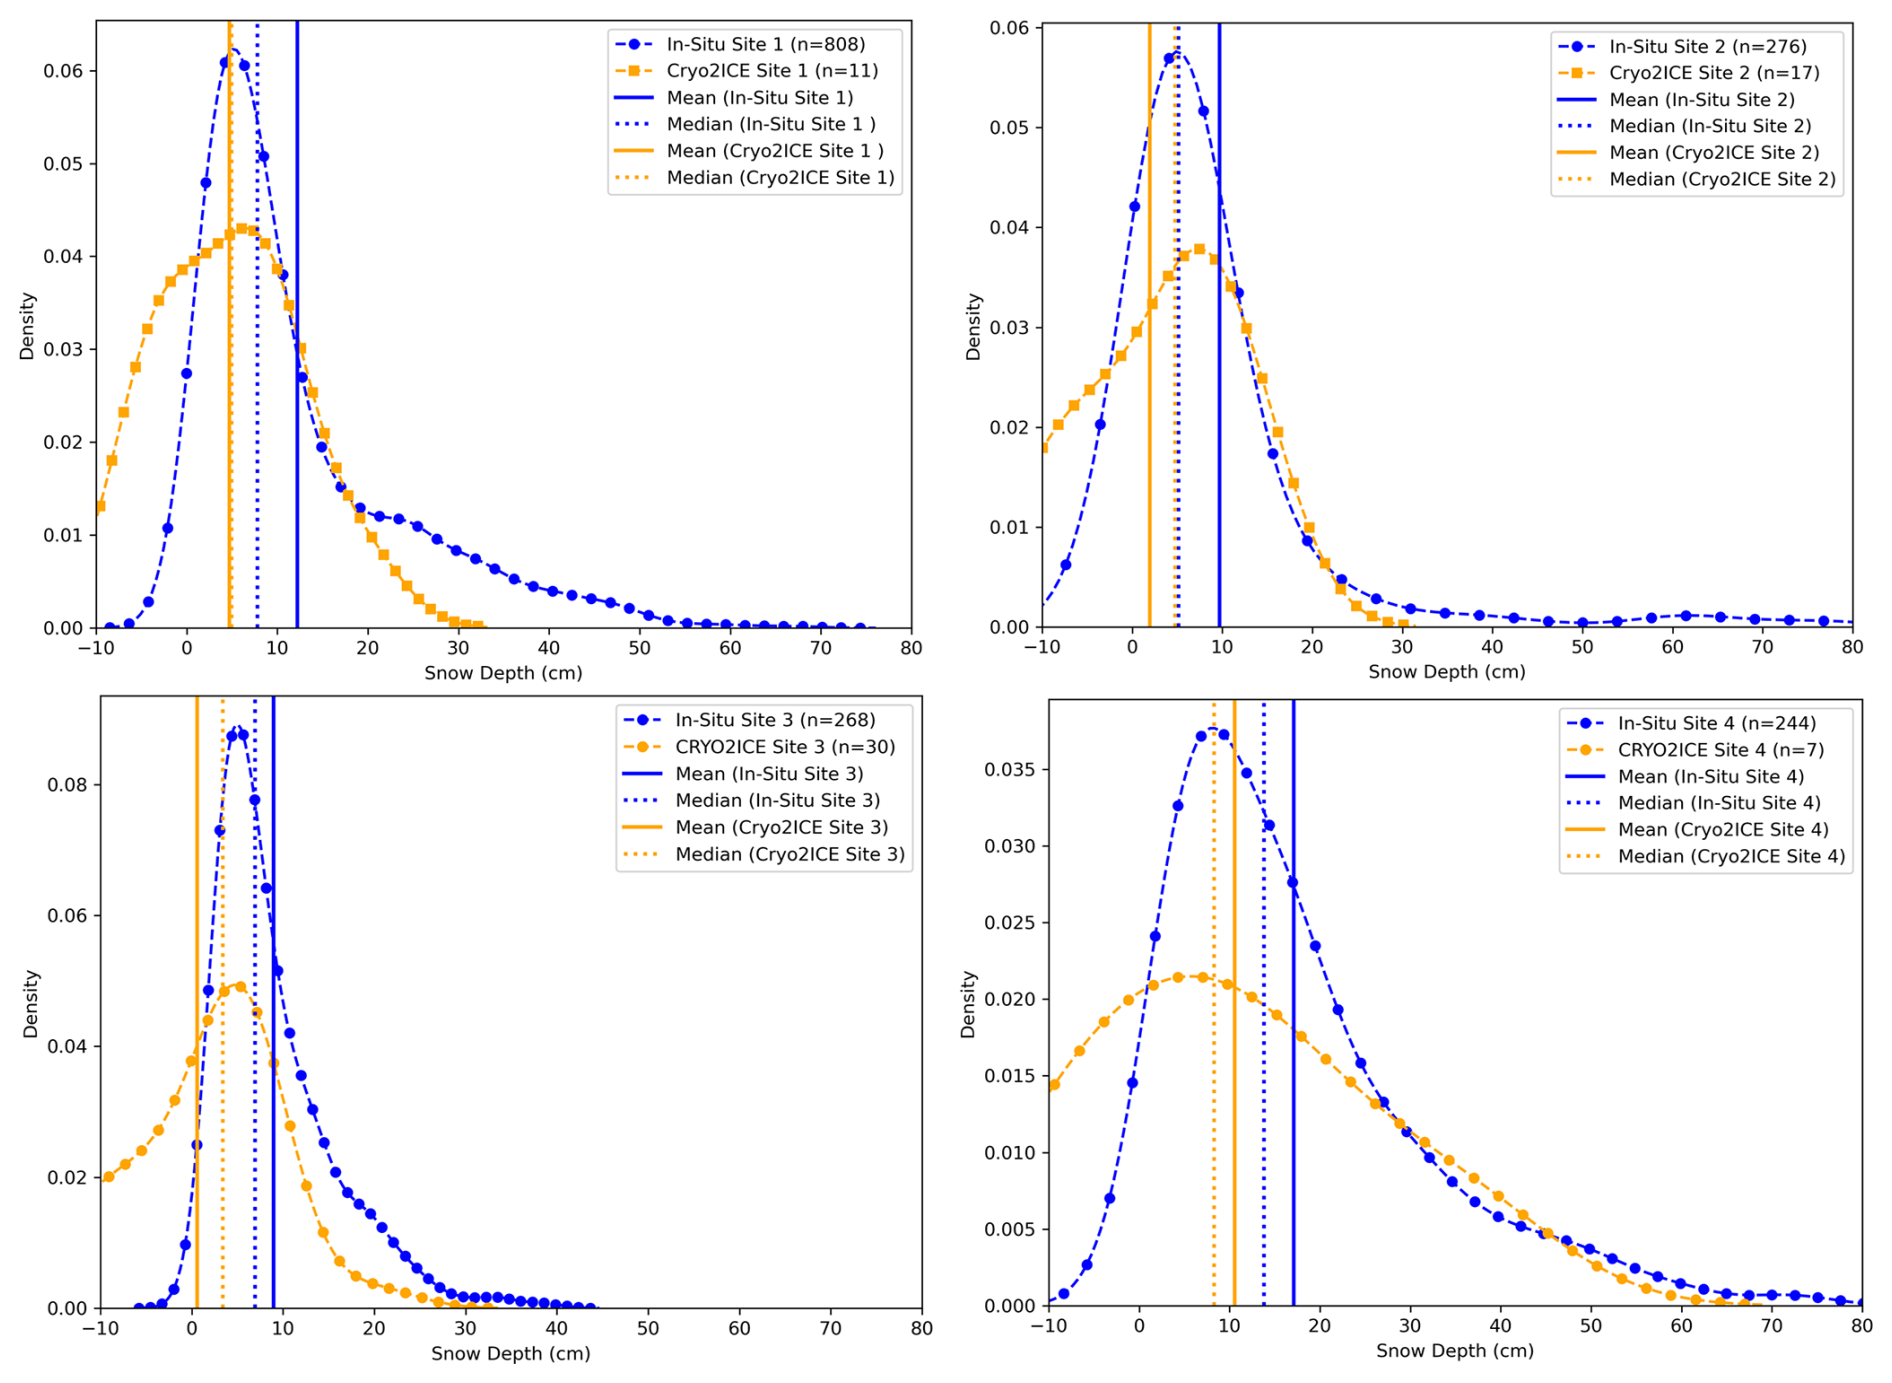
Figure 10Probability density plots comparing in situ snow depths to Cryo2Ice-retrieved snow depths and the median and mean values. Different snow bulk densities were used to calculate the refractive index and subsequently the Cryo2Ice snow depths for each site (Site 1: 0.399 g cm−3; Site 2: 0.398 g cm−3; Site 3: 0.217 g cm−3; Site 4: 0.381 g cm−3). The detailed statistics used for the comparison are provided in Table F1.
4.2 Adjusting for the difference in the CS2 and IS2 footprints
The difference between CS2 and IS2 footprint size, with IS2 having a significantly smaller footprint compared to CS2, leads to a significant underestimation of the retrieved snow depths in the native 300 m resolution. Therefore, to reduce the impact of this artificial underestimation of the distribution, we average both IS2 and CS2 over a larger along-track distance. While averaging the CS2 and IS2 over 1 km causes some of the prominent roughness features such as ridges to be missed by Cryo2Ice, the snow depths from the 1 km averaged CS2 and IS2 heights are more realistic representations of the snow distributions when compared to in situ data (Fig. 11). The average snow depth from the 1 km averaged CS2 and IS2 heights represents the overall shapes of the in situ snow depths better compared to the native 300 m averaged heights (Fig. 11). The shapes of the distributions are well represented, especially at Site 1 and Site 2. We also notice that the shapes of the Cryo2Ice snow depth distributions match best at Site 1 and Site 2 compared to in situ data. However, the general underestimation of snow depths is reflected within most of the sites (Sites 1, 2, 3), with the exception of Site 4, which seems to overestimate the snow depth (Fig. F2). The average snow depth retrieved from the 1 km averaged product is 7.80 cm, which is slightly higher than the 300 m averaged product presented in Sect. 3.3. The median bias between the in situ data and the 1 km averaged product is less than 2 cm at Site 1 and Site 2. (Fig. 11; Table F2).
Comparing the shapes of the distributions, we see that almost all the sites have similar snow depth distributions compared to in situ sites (Fig. 11). However, a significant portion of the tails of the distributions are still missing, which was also evident in the 300 m snow depth product. While the shapes of the distributions at Site 3 and Site 4 are similar compared to in situ data, the peaks of the distribution do not coincide well. Cryo2Ice snow depths at Site 1 have the most similar distribution to in situ data when compared to the other sites. At Site 2 we also see very similar snow depth distributions between Cryo2Ice and in situ data even between the 20 and 30 cm snow depths. While the shapes of the distributions match well at Site 3, we see a shift towards negative snow depths, indicating that negative snow depths caused by noise in CS2 have larger impacts here in the smoother sea ice. Cryo2Ice seems to perform worst at Site 4, which is the roughest sea ice zone, with Cryo2Ice snow depths being overestimated when compared to in situ data. This is also evident in the shape of the 1 km adjusted snow depth product, which seems to be skewed towards higher snow depth values (Fig. 11). Therefore, after adjusting for the difference in footprint size and averaging over the 1 km along-track distance, the overall snow depth distributions are more similar to in situ data for the majority of the sites.
Figure 11Probability density plots comparing in situ snow depths to Cryo2Ice-retrieved snow depths retrieved from 1 km averaged CS2 and IS2 heights and the median and mean snow depth values. Different snow bulk densities were used to calculate the refractive index and subsequently Cryo2Ice snow depths for each site (Site 1: 0.399 g cm−3; Site 2: 0.398 g cm−3; Site 3: 0.217 g cm−3; Site 4: 0.381 g cm−3). The detailed statistics used for the comparison are provided in Table F2.
4.3 Snow geophysical properties and Cryo2Ice retrievals
Both snow salinity and bulk density changes across the snowpack layer impact the IS2 laser and CS2 radar waveform interactions with the snowpack. While the IS2 green laser is mostly impacted by the air–snow interface conditions, CS2 radar waveforms interact with different layers of the snowpack, and the dominant scattering horizon and subsequently the radar heights are impacted by the snow properties. There were significant differences among the snow salinity and density characteristics (Fig. 6) between the surveyed sites. However, we notice that higher snow depths, i.e., depths greater than 30 cm, were picked up better at Site 4, which also had the lowest mean salinity, with 17 cm out of the 22 cm deep snowpack being non-saline. Therefore, the maximum intensity of the CS2 backscatter may have been sourced from closer to the sea–ice interface at Site 4. On the contrary, highly saline layers can potentially raise the height of dominant scattering intensity of the Ku-band radar, leading to overestimated CS2 heights (h(CS2)) and subsequently lower mean snow depth compared to in situ values. This phenomenon of snow depth underestimation was evident at Site 1 and Site 2 potentially because of the sharp increase in snow salinity within the first 5 cm (from the air–snow interface) of the snowpack (Fig. 6) and may have contributed to ∼2 cm underestimation of Cryo2Ice snow depths.
The chance of snow bulk density impacting on the Cryo2Ice retrievals was less likely, with the exception of areas with wind slab layers, which are identified as stark increases in snow bulk densities within the snowpack. The wind slab layers were identified at Site 1R where the density reached 0.425 g cm−3 compared to 0.358 to 0.374 g cm−3 on average throughout the snowpack, which may have hindered Ku-band penetration and thus contributed to median underestimations. The presence of this high-density snow layer and a reduction in Ku-band speed due to power attenuation of Ku-band microwaves may potentially cause a cumulative upward shift in the dominant scattering horizon, resulting in an underestimation of snow depths. However, it is difficult to ascribe such uncertainties to a single physical factor due to the interdependency of the processes.
4.4 Sea surface height estimation and Cryo2Ice retrievals
Canadian Hydrographic Service (CHS) tidal predictions for 29 April 2022 suggest that the satellite overpasses occurred during a low-tide period. According to the predictions, the water level was 6 cm higher for the IS2 pass at 21:18 UTC than for the CS2 pass at 22:35 UTC (Fig. C1). This 6 cm water level difference should ideally be accounted for by the difference in IS2 and CS2 ocean tide corrections. The IS2 ATL07 heights were reduced by a mean ocean tide correction of −0.71 cm, whereas the CS2 heights were reduced by an average ocean tide correction of −8.64 cm. Therefore, the difference between IS2 heights and CS2 heights was increased by 7.9 cm due to the ocean tide correction adjustment, but the CHS predictions suggest it should have been only 6.0 cm. This 1.9 cm difference would introduce a 25.5 % bias in retrieved snow depths, given the approximate mean snow depths we measured in situ. This error could be attributed to the ocean tide corrections used in IS2 and CS2 originating from two different models, i.e., GOT 4.8 (IS2) and FES 2004 (CS2). To put this source of error into wider context, past coincident CS2 and IS2 tracks from 15 April and 14 May 2021 were also analyzed. We found a bias of 2 to 5 cm when compared with the CHS dataset, meaning that we can expect ∼15 %–40 % systematic uncertainty in Cryo2Ice-retrieved snow depths owing to the uncertainty in tidal differences between satellite passes. This is a significant uncertainty, but it is systematic and varies at the length scale of the tidal corrections (hundreds of kilometers), meaning that it will not affect the relative variations in retrieved snow depth along track and would instead only affect their absolute magnitude. Therefore, Cryo2Ice seems capable of measuring the relative variations in snow depth between different locations of the CAA without the availability of sea surface reference tie points.
4.5 Surface roughness and Cryo2Ice retrievals
Surface roughness calculated from IS2 was used to analyze the Cryo2Ice snow depths between sites with different roughness values. There was only a weak positive correlation (R2=0.04) between surface roughness retrieved from IS2 and Cryo2Ice snow depths. Site 4 had the highest mean surface roughness (4.58 cm), whereas the other sites had roughness values ranging between 2.4–2.7 cm. Although there was significant ridging at Site 2, with IS2 picking up some of the ridges (Fig. 7), the mean surface roughness is low (2.48 cm) because of the extensive areas of thin snow cover that dominate the laser returns. Site 4 had the highest snow depth and the highest surface roughness from IS2, which also corresponds with the highest median bias (Table F2). Significant variation in surface type at Site 4 is also evident from the large variation in retrieved backscatter from Sentinel-1 (−5 to 3 dB) (Fig. 4b), which was not very well represented in the snow depth estimations from Cryo2Ice. Therefore, we notice that Cryo2Ice performs poorly in regions with relatively high surface roughness. The presence of isolated ridges and the deeper snow accumulated around them may have been missed by the CryoSat-2 radar given the larger impact of level ice vs. ridges on the backscattered power, which may explain the underestimation at Site 1 and Site 2. The ridge heights may also be underestimated with current ICESat-2 processing methods (Ricker et al., 2023), meaning that snow depths would be underestimated. The surface roughness from IS2 computed and compared well to the roughness features picked up from the snow depth variations, with higher roughness zones having higher snow depths from Cryo2Ice, e.g., Site 4. However, the difference in spatial resolutions between IS2 and snow depths from Cryo2ice means that finer-scale surface roughness features were missed by Cryo2Ice, especially in the 1 km averaged snow depth product.
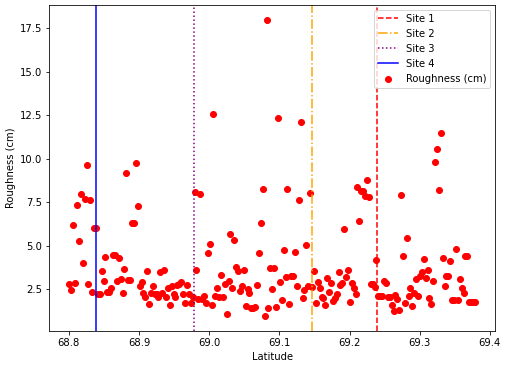
Figure 12Variation in surface roughness along the Cryo2Ice track at the four in situ snow thickness validation sites.
Accurate snow depth monitoring over landfast ice in the Canadian Arctic Archipelago (CAA) is important for communities that rely on landfast ice for transportation and their livelihood (Mahoney et al., 2009). It is imperative to monitor snow depth in the CAA as there have been reports of declining snow depths at a rate of 0.8 cm per decade in Cambridge Bay and at other locations in the CAA (Howell et al., 2016; Lam et al., 2023). Moreover, the reported snow depth and sea ice trends were highly correlated to the declining sea ice thickness. Therefore, this study explores the potential of retrieving snow depth using Cryo2Ice in leadless regions of the Canadian Arctic Archipelago. Snow depth from Cryo2Ice is retrieved based on the elevation difference between IS2 and CS2 sea ice heights from a common ellipsoid as opposed to the popular freeboard differencing method. The instantaneous difference in sea level between the 77 min difference between the CS2 and IS2 passes is accounted for by adjusting the ocean tide corrections with local tide model predictions. The snow depths retrieved from Cryo2Ice compare favorably with in situ snow depth measurements when averaged over 1 km segments of the tracks. The relative snow depth patterns from in situ field sites were corroborated with Cryo2Ice measurements, meaning that the thinnest and thickest snow depth regions were picked up correctly by Cryo2Ice. The 300 m averaged Cryo2Ice snow depths show an average of 7.44 cm, which is slightly underestimated when compared to in situ measurements from this study (11.9 cm) and previous studies conducted at the Dease Strait. While the ∼2 to 3 cm underestimation demonstrates that Cryo2Ice can estimate snow depth with reasonable accuracy after adjusting for the tidal uncertainty (Fredensborg Hansen et al., 2024, report 10–11 cm uncertainties), there are still significant sources of both systematic and random uncertainties that need to be addressed. We note that median biases ranging from 2 to 5.5 cm are reported among the different sites, which is often higher than the tidal correction applied (1.9 cm).
The site-wise comparison between in situ snow depths and Cryo2Ice snow depths shows that Cryo2Ice performs well in regions with moderately thin and smooth snow on sea ice, i.e., ranging between 5 to 20 cm, while it struggles to pick up snow depths greater than 30 cm irrespective of the roughness characteristics. This phenomenon is largely attributed to the difference in footprint size between CS2 and IS2, where the large footprint of CS2 missed a lot of the high-snow-depth sites, particularly the ones close to the ridges, which are otherwise picked up by IS2. We also notice that negative snow depths mostly retrieved from rougher sea ice zones spatially coincide with the noisy CS2 heights, which are significantly higher than the IS2 heights. These negative snow depths (20 % of the Cryo2Ice estimates) significantly skew the snow depth distributions retrieved. We note that the number of negative freeboards (20 %) is much larger than the 3 % negative snow depths reported in Fredensborg Hansen et al. (2024), which we believe is mostly due to the fact that this study considers a single track averaging over 300 m and 1 km windows compared to the 7 km window in the aforementioned study. Therefore, we see that the noisy nature of CS2 data, especially in landfast ice, plays a major role in the underestimation of the snow depths retrieved from Cryo2Ice. Differences in the shapes of the distributions from in situ sites and representative roughness zones of the Cryo2Ice are mostly a result of the difference in sampling resolutions of Cryo2Ice (∼300 m) and the in situ measurements (5 m). The tails of the in situ snow depth distributions (>40 cm) were largely missed by Cryo2Ice, and the Cryo2Ice snow depth retrieval accuracy is impacted by the presence of sea ice ridges. This impact leads to an artificial widening of the snow depth distributions that are obtained in the native 300 m resolution. After adjusting for this difference by averaging both IS2 and CS2 heights over 1 km instead, more realistic snow depth distributions are obtained. We note that while Cryo2Ice generally underestimates snow depths by 2 to 4 cm compared to in situ data, the 1 km averaged snow depths also show the possibility of overestimation over significantly rough ice. Therefore, future studies should consider analyzing both the 300 m resolution product and the 1 km averaged product in order to get both the meter-scale snow depth variations from the 300 m snow depths and the more representative snow depth distribution from the 1 km averaged snow depths.
Snow geophysical properties, especially snow salinity in the deepest few centimeters of the snowpack, may impact the dominant scattering surface of the CS2 radar, resulting in the scattering surface shifting upwards into the snowpack and leading to underestimation of the snow depths. The 1 km averaged snow depth was slightly underestimated at three out of four sites compared to in situ measurements; however, the median biases compared to in situ data are less than 5 cm. This study identifies several different sources of uncertainty, such as noise in the CS2 heights, surface roughness, and snow geophysical properties, which significantly impact the snow depth retrievals in addition to the uncertainty due to the tidal correction. However, it is difficult to determine given the few centimeters of bias whether this is due to snow geophysical processes, surface roughness, and/or errors in the altimeters' tidal corrections given that a lot of these uncertainties are inter-related and are highly variable among different length scales. Therefore, a further comprehensive study across different regions is required to isolate the impacts of these uncertainties and determine their contributions to the total uncertainty. Additionally, there are uncertainties such as the use of a fixed threshold retracker in CS2 that is not tuned for the landfast sea ice and uncertainties associated with the IS2 fine tracker that may also contribute significantly to the snow depth retrievals. Therefore, further studies are required in different leadless regions under varying snow conditions to obtain improved insights into the sources of bias in snow depth retrievals from Cryo2Ice. It is also noteworthy that the suggested method of using ellipsoidal heights from IS2 and CS2 with the tidal correction may also be applied in regions beyond the landfast sea ice in the Canadian Arctic Archipelago (CAA). However, as the current method relies on using tidal gauge station data from a nearby station, this method may not be directly applicable for regions that do not have a tidal gauge station nearby. However, tidal predictions from tide models that consider the impact of sea ice on the tidal amplitude such as those from the Nucleus for European Modelling of the Ocean (NEMO) framework may be used instead to estimate the difference in tides between the passes. While this study suggests the use of ellipsoidal heights for landfast ice, the freeboard differencing approach as suggested in Kwok et al. (2020) is better suited for regions where getting a direct estimation of the sea surface height and direct estimates of the freeboard are available. Findings from this study are encouraging for estimating snow depth on landfast sea ice in leadless regions using Cryo2Ice and for future coincident laser and radar or dual-frequency altimeter missions.
Table A1Geophysical corrections applied to the IS2 ATL07 product. The range represents the typical variation in the corrections as reported in the IS2 Algorithm Theoretical Basis Document (ATBD).
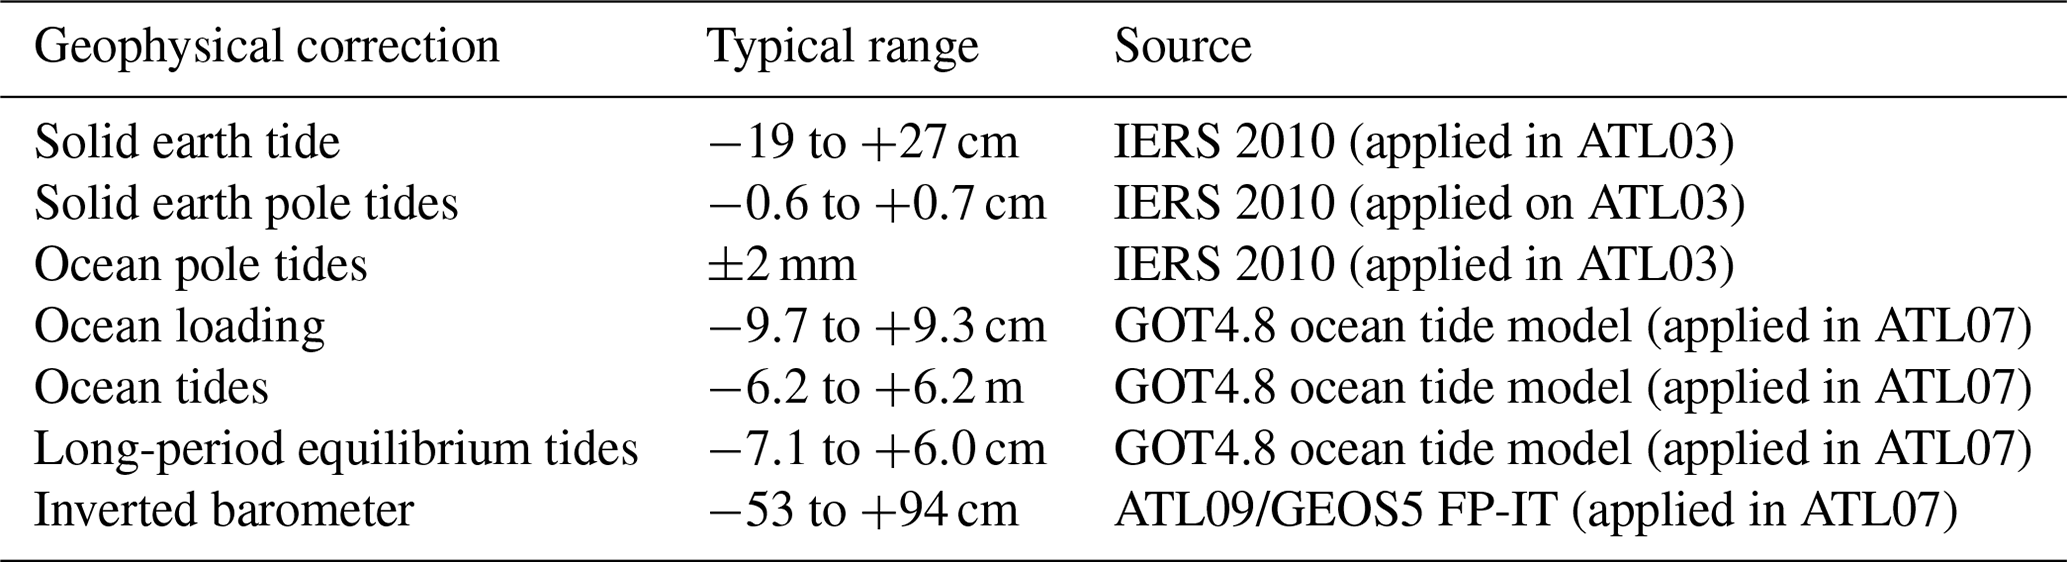
Table B1Geophysical corrections applied to the CS2 Level-2 product. The typical range values are reported in the Cryosat-2 Baseline E Level-2 Product Handbook.
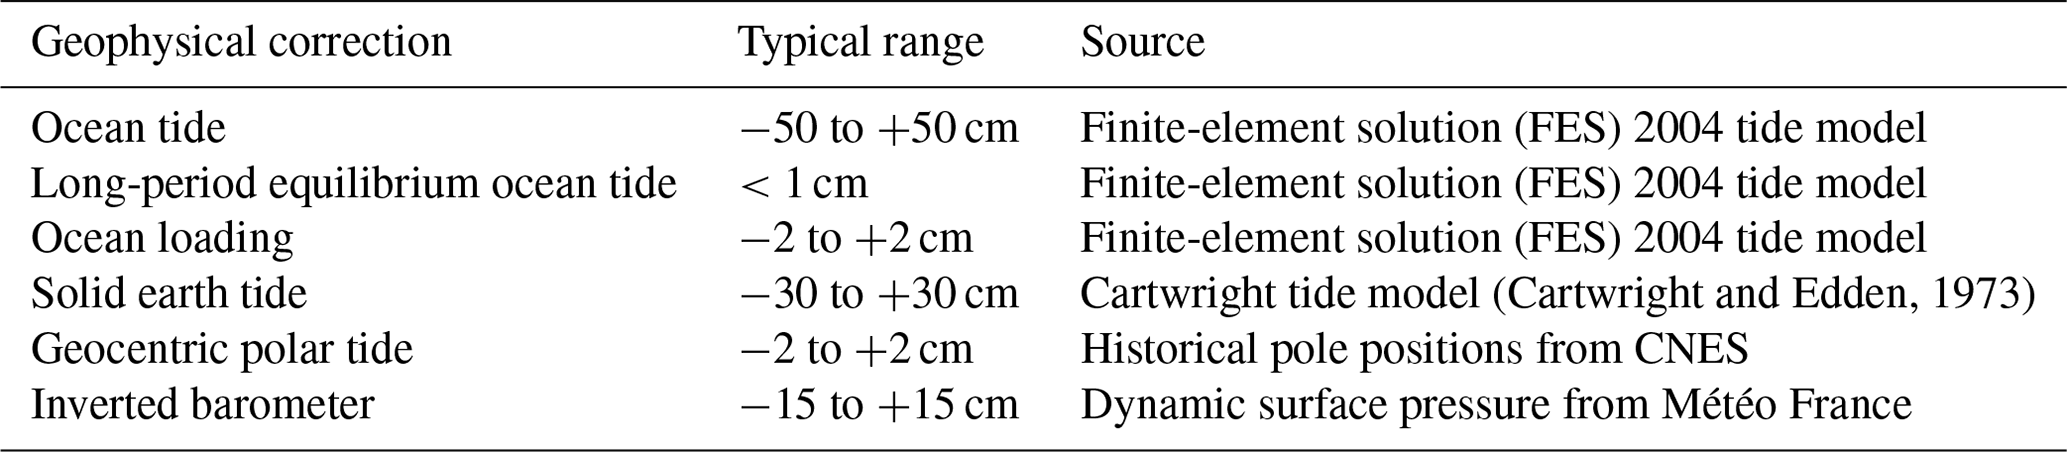
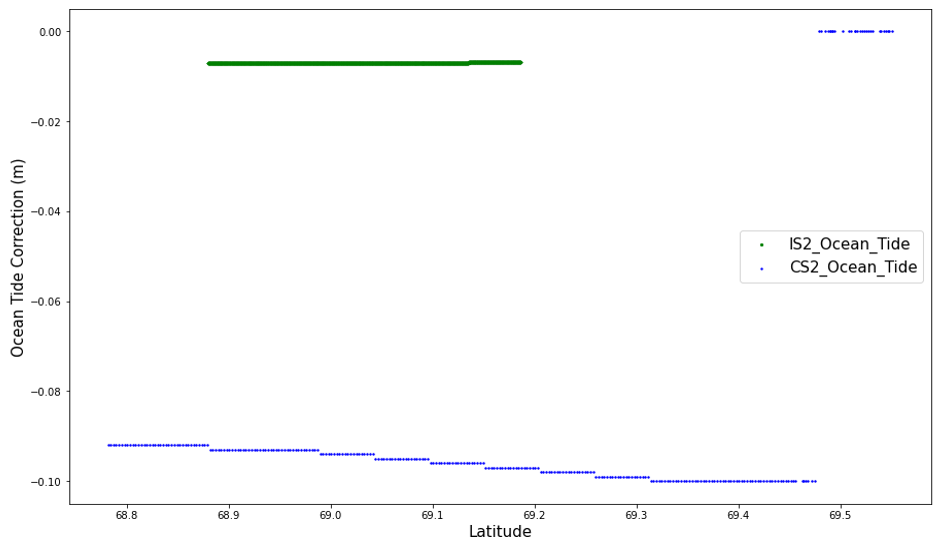
Figure C1Ocean tidal correction used in the IS2 and CS2 tracks. The IS2 ocean tide corrections are shown in green, while the CS2 ocean tide corrections are shown in blue.
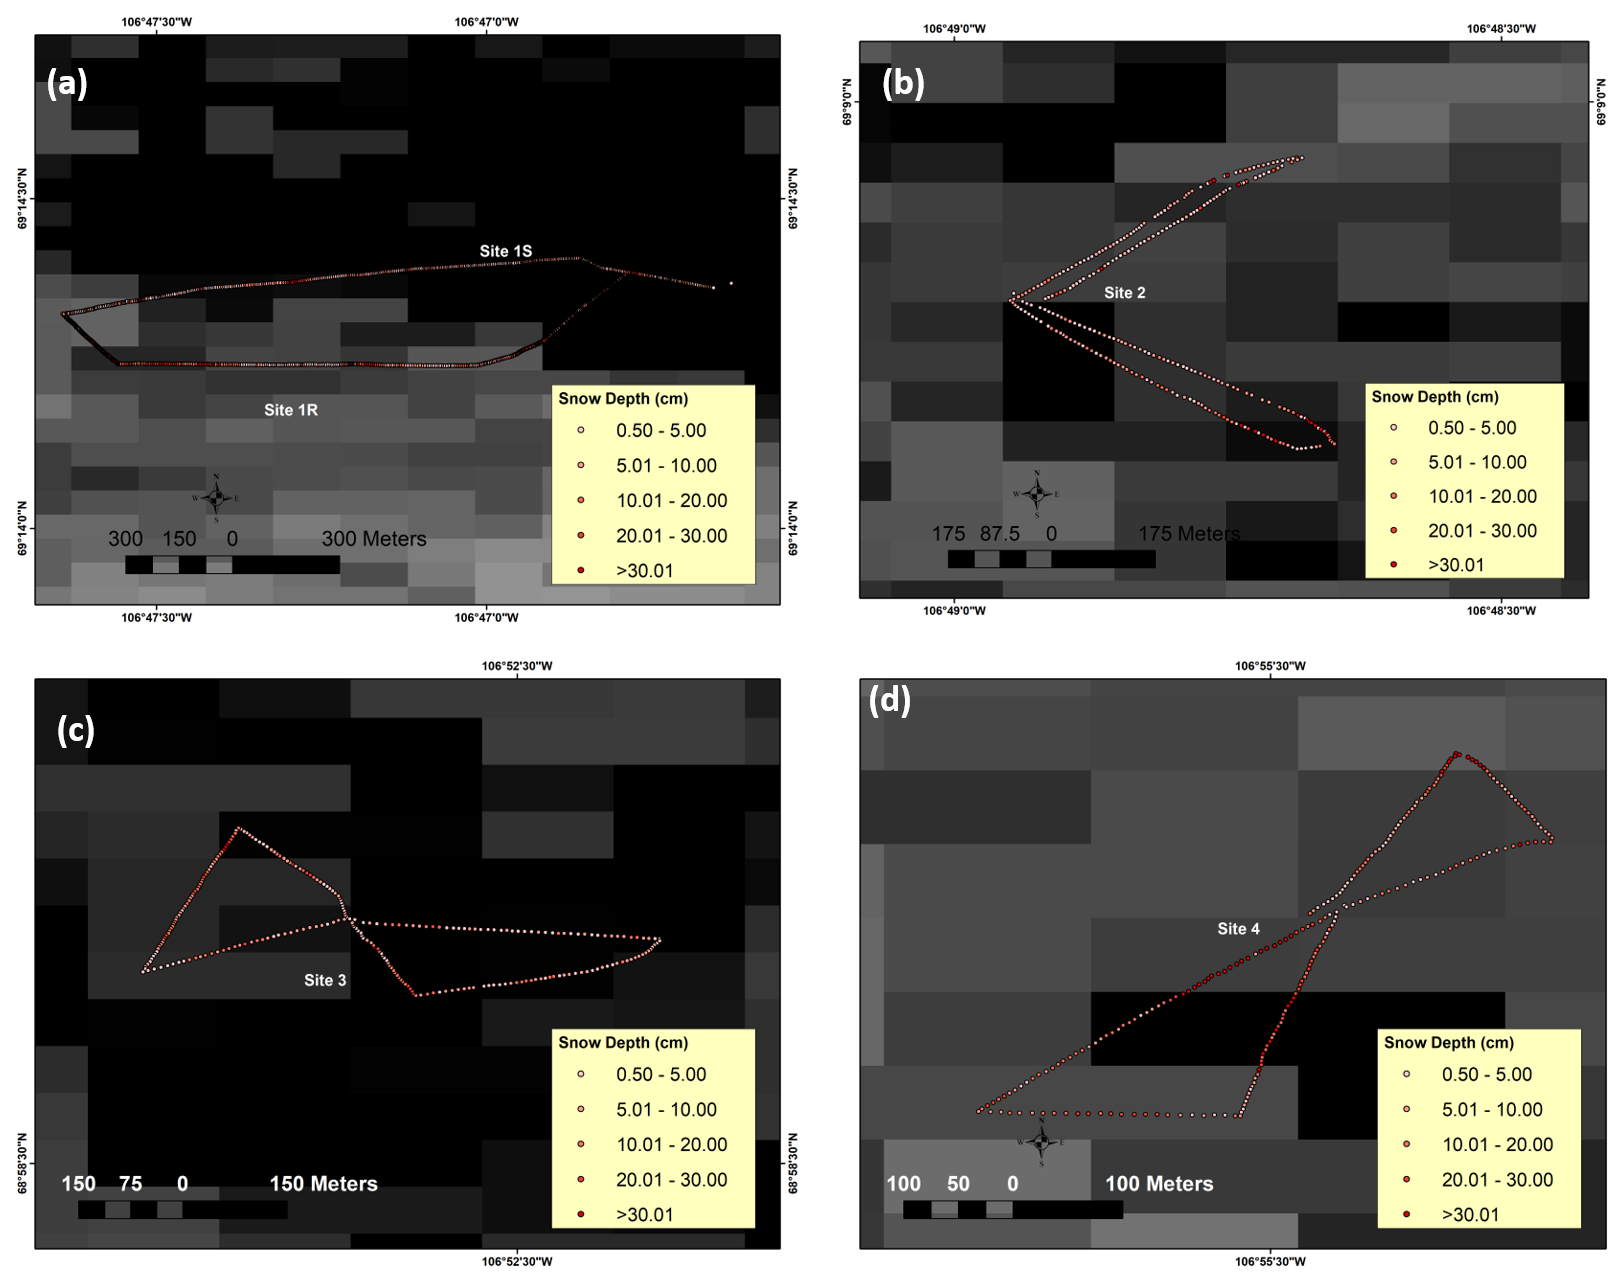
Figure D1The in situ snow depth transects conducted at (a) Site 1, (b) Site 2, (c) Site 3, and (d) Site 4. The spatial distributions of the snow depths are included for each site.
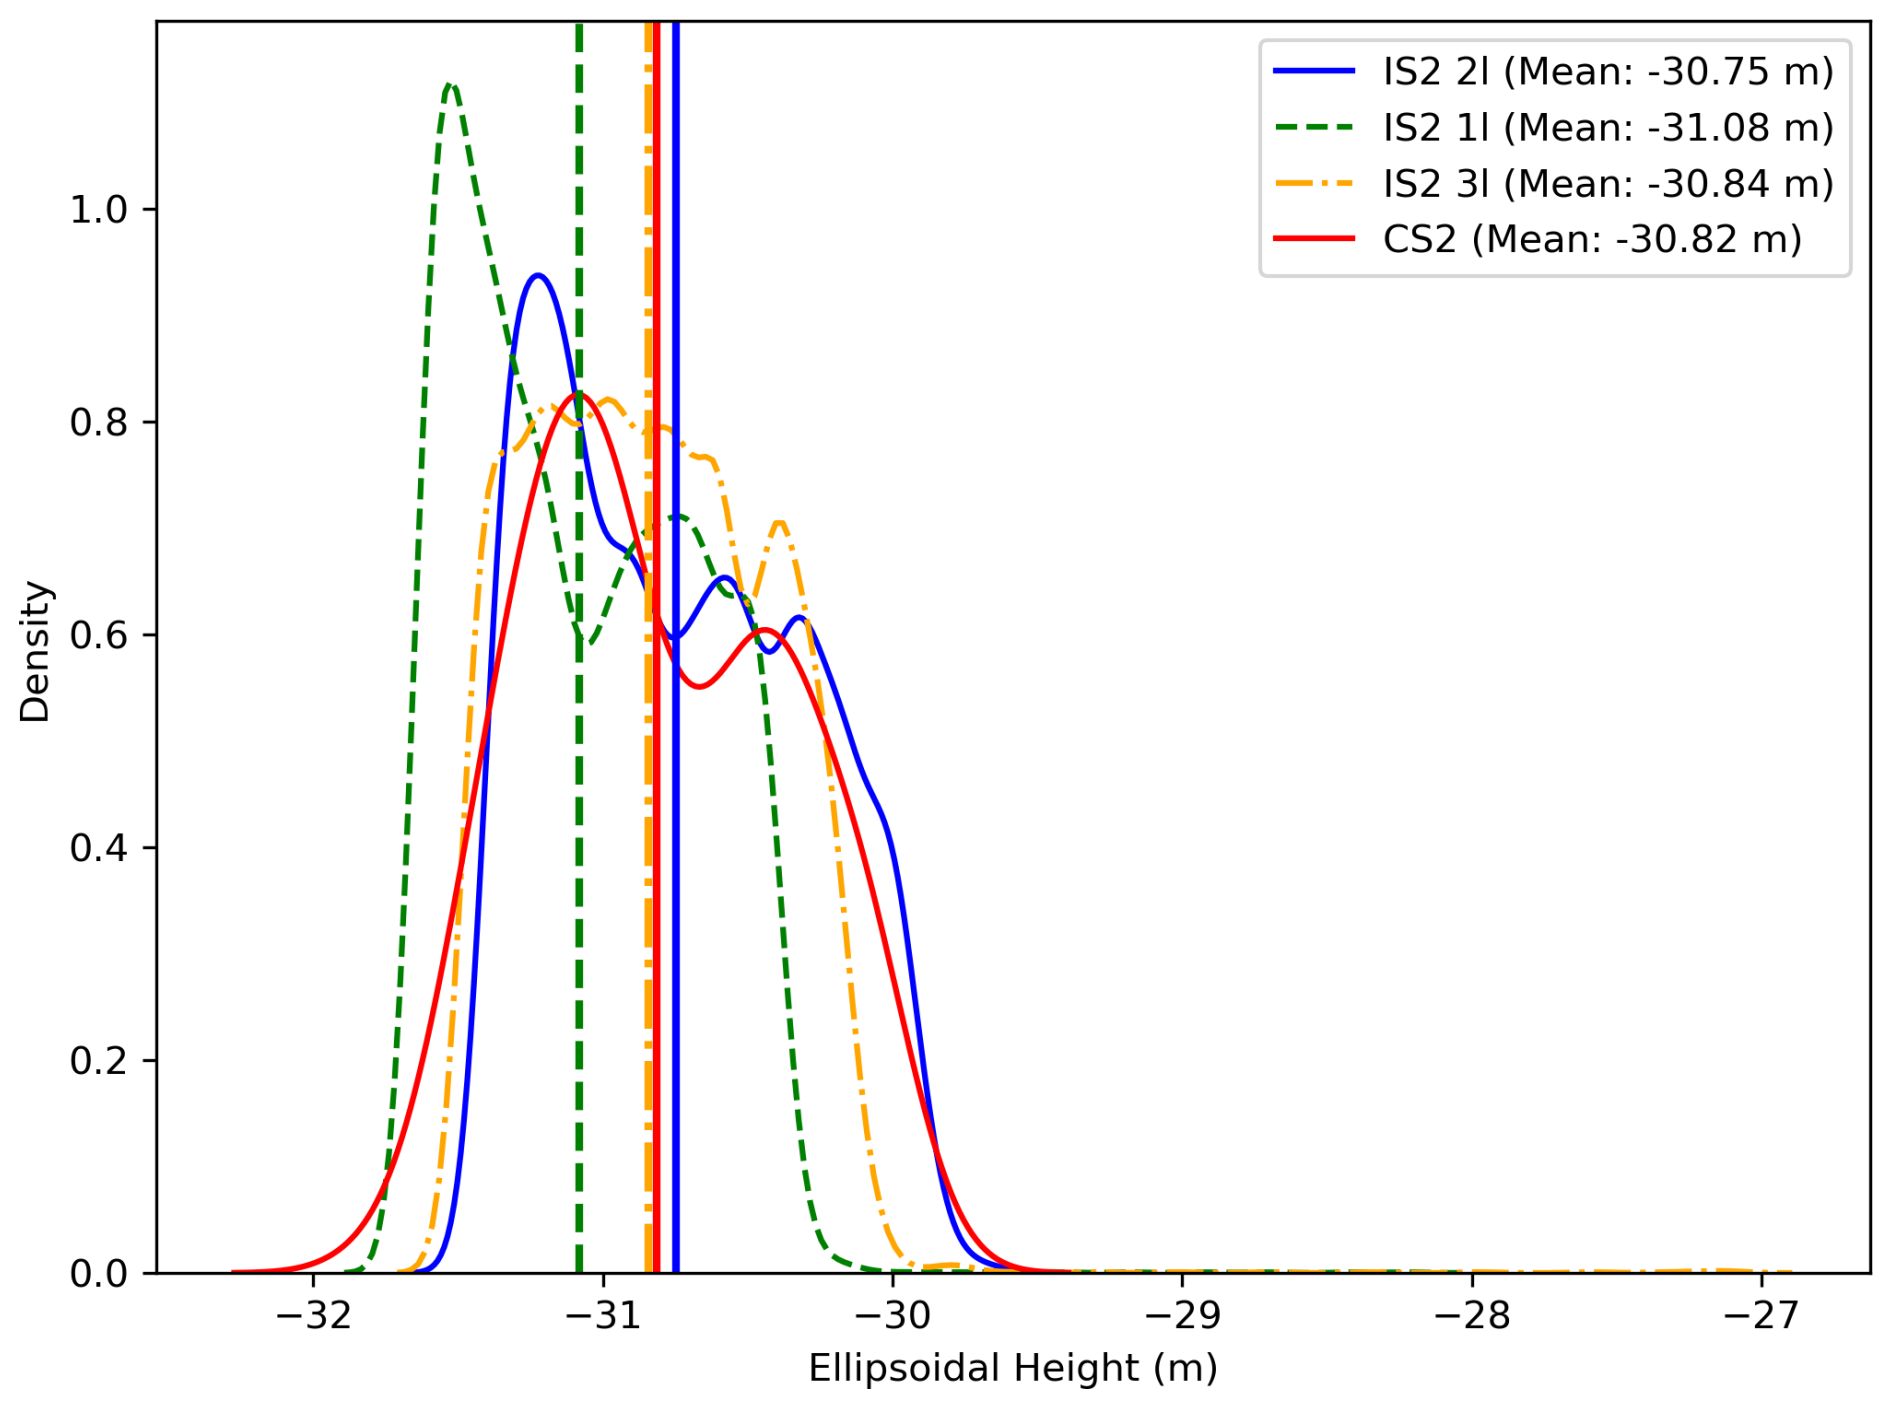
Figure E1ATL07 ICESat-2 strong-beam (IS2 1l, 2l, 3l) sea ice ellipsoidal-height distributions compared to the CS2 height ellipsoidal-height distribution.
Table F1In situ vs. Cryo2Ice snow depth distribution statistics retrieved using 300 m averaged IS2 and CS2 height.
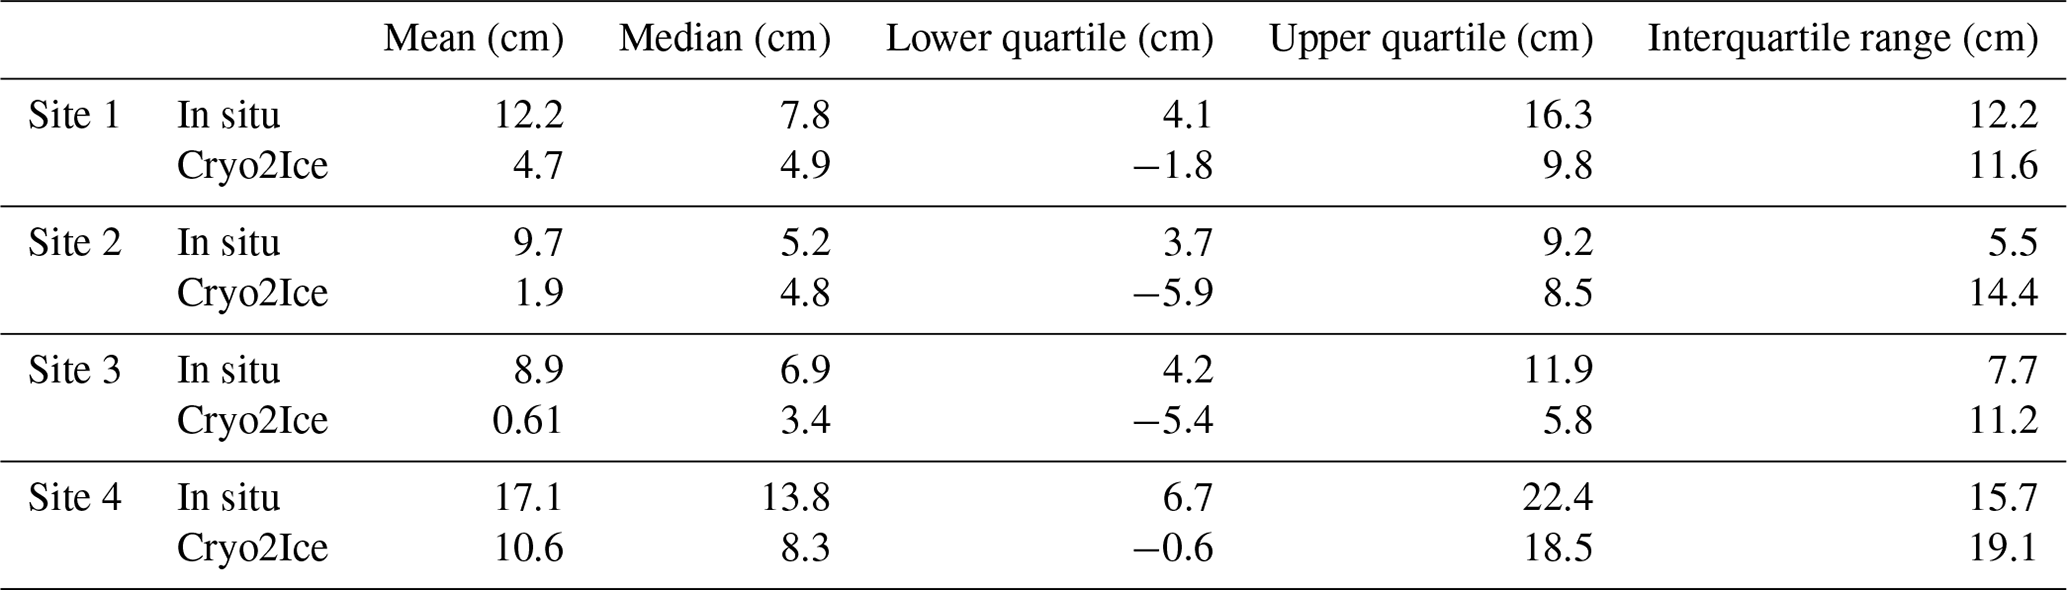
Table F2In situ vs. Cryo2Ice snow depth distribution statistics retrieved using 1 km averaged IS2 and CS2 height.
ICESat-2 ATL07 data may be accessed from the NSIDC website (https://doi.org/10.5067/ATLAS/ATL07.006, Kwok et al., 2023b).
Cryosat-2 data may be accessed from ESA (https://eocat.esa.int/sec/#data-services-area; ESA, 2025). The snow depth validation dataset is available from the CanWIN data hub (https://doi.org/10.34992/j86x-dc30, Saha et al., 2022).
MS, JS, and DI were involved in the conceptualization of the study. MS, JS, JY, HML, and VN were involved in planning of the field campaign. JS acquired the funding for the research. MS, JY, and HML collected the snow and sea ice physical property validation data from the field. MS, JS, DI, JCL, and VN were involved in formulating the methodology for the analysis. MS prepared the original draft. All co-authors were involved in the review and editing process.
At least one of the (co-)authors is a member of the editorial board of The Cryosphere. The peer-review process was guided by an independent editor, and the authors also have no other competing interests to declare.
Publisher's note: Copernicus Publications remains neutral with regard to jurisdictional claims made in the text, published maps, institutional affiliations, or any other geographical representation in this paper. While Copernicus Publications makes every effort to include appropriate place names, the final responsibility lies with the authors.
The authors would like to acknowledge Torsten Geldsetzer from the University of Calgary for his input during the planning stages of the Cambridge Bay campaign. We acknowledge Nathan Kurtz from NASA for providing early access to ICESat-2 ATL07 release 006 data that were vital for the analysis. Monojit Saha was supported by ArcticNet (grant no. 52551) and Julienne Stroeve's NSERC Canada 150 Chair (grant no. 50297). We acknowledge Julienne Strove's NASA award (no. 80NSSC20K1121) and the University of Manitoba Graduate Student Fellowship (UMGF). We also acknowledge ArcticNet Field Aircraft Support for providing helicopter support. We acknowledge a Canadian NSERC Discovery Grant to Dustin Isleifson. We also acknowledge John Yackel's NSERC Discovery Grant (grant no. RGPIN-2017-04888). Jack Landy was supported by the INTERAAC (air-snow-ice-ocean INTERactions transforming Atlantic Arctic Climate) project of the Research Council of Norway (RCN, grant no. 328957), the DynAMIC (Detecting episodes of Arctic sea ice Mass Imbalance) project of the RCN (grant no. 343069), and the SI/3D (Summer Sea Ice in 3D) project of the European Research Council (ERC, grant no. 101077496).
This research has been supported by ArcticNet (grant no. 52551) and Julienne Stroeve's NSERC Canada 150 Chair (grant no. 50297).
This paper was edited by Lars Kaleschke and reviewed by two anonymous referees.
Andersen, O. B., Nilsen, K., Sørensen, L. S., Skourup, H., Andersen, N. H., Nagler, T., Wuite, J., Kouraev, A., Zakharova, E., and Fernandez, D.: Arctic freshwater fluxes from earth observation data: International Review Workshop on Satellite Altimetry Cal/Val Activities and Applications, Fiducial Reference Measurements for Altimetry, in: International Association of Geodesy Symposia ((IAG SYMPOSIA, vol. 150), 97–103, https://doi.org/10.1007/1345_2019_75, 2019.
Andreas, E. L., Jordan, R. E., and Makshtas, A. P.: Parameterizing turbulent exchange over sea ice: the ice station weddell results, Bound.-Lay. Meteorol., 114, 439–460, https://doi.org/10.1007/s10546-004-1414-7, 2005.
Bagnardi, M., Kurtz, N. T., Petty, A. A., and Kwok, R.: Sea Surface Height Anomalies of the Arctic Ocean From ICESat-2: A First Examination and Comparisons With CryoSat-2, Geophys. Res. Lett., 48, e2021GL093155, https://doi.org/10.1029/2021GL093155, 2021.
Cafarella, S. M., Scharien, R., Geldsetzer, T., Howell, S., Haas, C., Segal, R., and Nasonova, S.: Estimation of Level and Deformed First-Year Sea Ice Surface Roughness in the Canadian Arctic Archipelago from C- and L-Band Synthetic Aperture Radar, Can. J. Remote Sens., 45, 457–475, https://doi.org/10.1080/07038992.2019.1647102, 2019.
Campbell, K., Mundy, C. J., Landy, J. C., Delaforge, A., Michel, C., and Rysgaard, S.: Community dynamics of bottom-ice algae in Dease Strait of the Canadian Arctic, Prog. Oceanogr., 149, 27–39, https://doi.org/10.1016/j.pocean.2016.10.005, 2016.
Cartwright, D. E. and Edden, A. C.: Corrected Tables of Tidal Harmonics, Geophys. J. Int., 33, 253–264, https://doi.org/10.1111/j.1365-246X.1973.tb03420.x, 1973.
De Rijke-Thomas, C., Landy, J. C., Mallett, R., Willatt, R. C., Tsamados, M., and King, J.: Airborne Investigation of Quasi-Specular Ku-Band Radar Scattering for Satellite Altimetry Over Snow-Covered Arctic Sea Ice, IEEE T. Geosci. Remote, 61, 1–19, https://doi.org/10.1109/TGRS.2023.3318263, 2023.
Diaz, A., Ehn, J. K., Landy, J. C., Else, B. G. T., Campbell, K., and Papakyriakou, T. N.: The Energetics of Extensive Meltwater Flooding of Level Arctic Sea Ice, J. Geophys. Res.-Oceans, 123, 8730–8748, https://doi.org/10.1029/2018JC014045, 2018.
Eicken, H., Grenfell, T. C., Perovich, D. K., Richter-Menge, J. A., and Frey, K.: Hydraulic controls of summer Arctic pack ice albedo, J. Geophys. Res.-Oceans, 109, C08007, https://doi.org/10.1029/2003JC001989, 2004.
ESA: CryoSat-2 Product Handbook, 2013.
ESA: CryoSat-2 Product Handbook, European Space Agency, 2019.
ESA: About CRYO2ICE – Earth Online, https://earth.esa.int/eogateway/missions/cryosat/Cryo2Ice (last access: 20 October 2023), 2020.
ESA: EO-CAT, European Space Agency, https://eocat.esa.int/sec/#data-services-area, last access: 20 January 2025.
Ewart, M., Bizon, J., Alford, J., Easthope, R., Gourmelen, N., Horton, A., Incatasciato, A., Parrinello, T., Bouffard, J., Di Bella, A., Goss, T., Michael, C., and Meloni, M.: cs2eo Version 3, European Space Agency, http://cs2eo.org, last access: March 2022.
Farrell, S. L., Duncan, K., Buckley, E. M., Richter-Menge, J., and Li, R.: Mapping Sea Ice Surface Topography in High Fidelity With ICESat-2, Geophys. Res. Lett., 47, e2020GL090708, https://doi.org/10.1029/2020GL090708, 2020.
Fons, S. W., Kurtz, N. T., Bagnardi, M., Petty, A. A., and Tilling, R. L.: Assessing CryoSat-2 Antarctic Snow Freeboard Retrievals Using Data From ICESat-2, Earth Space Sci., 8, e2021EA001728, https://doi.org/10.1029/2021EA001728, 2021.
Fredensborg Hansen, R. M., Skourup, H., Rinne, E., Høyland, K. V., Landy, J. C., Merkouriadi, I., and Forsberg, R.: Arctic Freeboard and Snow Depth From Near-Coincident CryoSat-2 and ICESat-2 (CRYO2ICE) Observations: A First Examination of Winter Sea Ice During 2020–2022, Earth Space Sci., 11, e2023EA003313, https://doi.org/10.1029/2023EA003313, 2024.
Galley, R. J., Else, B. G. T., Howell, S. E. L., Lukovich, J. V., and Barber, D. G.: Landfast Sea Ice Conditions in the Canadian Arctic: 1983–2009, Arctic, 65, 133–144, 2012.
Howell, S. E. L., Laliberté, F., Kwok, R., Derksen, C., and King, J.: Landfast ice thickness in the Canadian Arctic Archipelago from observations and models, The Cryosphere, 10, 1463–1475, https://doi.org/10.5194/tc-10-1463-2016, 2016.
Iacozza, J. and Barber, D. G.: An examination of the distribution of snow on sea‐ice, Atmosphere-Ocean, 37, 21–51, https://doi.org/10.1080/07055900.1999.9649620, 1999.
Kacimi, S. and Kwok, R.: The Antarctic sea ice cover from ICESat-2 and CryoSat-2: freeboard, snow depth, and ice thickness, The Cryosphere, 14, 4453–4474, https://doi.org/10.5194/tc-14-4453-2020, 2020.
Kruskal, W. H. and Wallis, W. A.: Use of Ranks in One-Criterion Variance Analysis, J. Am. Stat. A., 47, 583–621, https://doi.org/10.1080/01621459.1952.10483441, 1952.
Kwok, R. and Markus, T.: Potential basin-scale estimates of Arctic snow depth with sea ice freeboards from CryoSat-2 and ICESat-2: An exploratory analysis, Adv. Space Res., 62, 1243–1250, https://doi.org/10.1016/j.asr.2017.09.007, 2018.
Kwok, R., Bagnardi, M., Petty, A., and Kurtz, N.: ICESat-2 sea ice ancillary data – Mean Sea Surface Height Grids, Zenodo [data set], https://doi.org/10.5281/zenodo.4294048, 2020.
Kwok, R., Petty, A. A., Bagnardi, M., Kurtz, N. T., Cunningham, G. F., Ivanoff, A., and Kacimi, S.: Refining the sea surface identification approach for determining freeboards in the ICESat-2 sea ice products, The Cryosphere, 15, 821–833, https://doi.org/10.5194/tc-15-821-2021, 2021.
Kwok, R., Petty, A., Bagnardi, M., Wimert, J. T., Cunningham, G. F., Hancock, D. W., Ivanoff, A., and Kurtz, N.: Ice, Cloud, and Land Elevation Satellite (ICESat-2) Project Algorithm Theoretical Basis Document (ATBD) for Sea Ice Products, version 6, ICESat-2 Project, https://doi.org/10.5067/9VT7NJWOTV3I, 2023a.
Kwok, R., Petty, A. A., Cunningham, G., Markus, T., Hancock, D., Ivanoff, A., Wimert, J., Bagnardi, M., Kurtz, N., and the ICESat-2 Science Team: ATLAS/ICESat-2 L3A Sea Ice Height(ATL07, Version 6), Boulder, Colorado USA, NASA National Snow and Ice Data Center Distributed Active Archive Center [data set], https://doi.org/10.5067/ATLAS/ATL07.006, 2023b.
Lam, H.-M., Geldsetzer, T., Howell, S. E. L., and Yackel, J.: Snow Depth on Sea Ice and on Land in the Canadian Arctic from Long-Term Observations, Atmosphere-Ocean, 61, 217–233, https://doi.org/10.1080/07055900.2022.2060178, 2023.
Landy, J. C., Tsamados, M., and Scharien, R. K.: A Facet-Based Numerical Model for Simulating SAR Altimeter Echoes From Heterogeneous Sea Ice Surfaces, IEEE T. Geosci. Remote, 57, 4164–4180, https://doi.org/10.1109/TGRS.2018.2889763, 2019.
Landy, J. C., Petty, A. A., Tsamados, M., and Stroeve, J. C.: Sea Ice Roughness Overlooked as a Key Source of Uncertainty in CryoSat-2 Ice Freeboard Retrievals, J. Geophys. Res.-Oceans, 125, e2019JC015820, https://doi.org/10.1029/2019JC015820, 2020.
Leuschen, C. J., Swift, R. N., Comiso, J. C., Raney, R. K., Chapman, R. D., Krabill, W. B., and Sonntag, J. G.: Combination of laser and radar altimeter height measurements to estimate snow depth during the 2004 Antarctic AMSR-E Sea Ice field campaign, J. Geophys. Res.-Oceans, 113, C04S90, https://doi.org/10.1029/2007JC004285, 2008.
Magruder, L. A., Brunt, K. M., and Alonzo, M.: Early ICESat-2 on-orbit Geolocation Validation Using Ground-Based Corner Cube Retro-Reflectors, Remote Sens., 12, 3653, https://doi.org/10.3390/rs12213653, 2020.
Mahoney, A., Gearheard, S., Oshima, T., and Qillaq, T.: Sea Ice Thickness Measurements from a Community-Based Observing Network, B. Am. Meteorol. Soc., 90, 370–378, https://doi.org/10.1175/2008BAMS2696.1, 2009.
Mallett, R. D. C., Lawrence, I. R., Stroeve, J. C., Landy, J. C., and Tsamados, M.: Brief communication: Conventional assumptions involving the speed of radar waves in snow introduce systematic underestimates to sea ice thickness and seasonal growth rate estimates, The Cryosphere, 14, 251–260, https://doi.org/10.5194/tc-14-251-2020, 2020.
Maykut, G. A. and Untersteiner, N.: Some results from a time-dependent thermodynamic model of sea ice, J. Geophys. Res., 76, 1550–1575, https://doi.org/10.1029/JC076i006p01550, 1971.
Meier, W. and Stroeve, J.: An Updated Assessment of the Changing Arctic Sea Ice Cover, Oceanography, 35, 10–19, https://doi.org/10.5670/oceanog.2022.114, 2022.
Melling, H.: Sea ice of the northern Canadian Arctic Archipelago, J. Geophys. Res.-Oceans, 107, 2-1–2-21, https://doi.org/10.1029/2001JC001102, 2002.
Moon, W., Nandan, V., Scharien, R. K., Wilkinson, J., Yackel, J. J., Barrett, A., Lawrence, I., Segal, R. A., Stroeve, J., Mahmud, M., Duke, P. J., and Else, B.: Physical length scales of wind-blown snow redistribution and accumulation on relatively smooth Arctic first-year sea ice, Environ. Res. Lett., 14, 104003, https://doi.org/10.1088/1748-9326/ab3b8d, 2019.
Moran, P. A. P.: The Interpretation of Statistical Maps, J. R. Stat. Soc. Ser. B Methodol., 10, 243–251, 1948.
Mundy, C. J., Barber, D. G., and Michel, C.: Variability of snow and ice thermal, physical and optical properties pertinent to sea ice algae biomass during spring, J. Marine Syst., 58, 107–120, https://doi.org/10.1016/j.jmarsys.2005.07.003, 2005.
Nandan, V., Geldsetzer, T., Yackel, J., Mahmud, M., Scharien, R., Howell, S., King, J., Ricker, R., and Else, B.: Effect of Snow Salinity on CryoSat-2 Arctic First-Year Sea Ice Freeboard Measurements, Geophys. Res. Lett., 44, 10419–10426, https://doi.org/10.1002/2017GL074506, 2017.
Nandan, V., Scharien, R. K., Geldsetzer, T., Kwok, R., Yackel, J. J., Mahmud, M. S., Rösel, A., Tonboe, R., Granskog, M., Willatt, R., Stroeve, J., Nomura, D., and Frey, M.: Snow Property Controls on Modeled Ku-Band Altimeter Estimates of First-Year Sea Ice Thickness: Case Studies From the Canadian and Norwegian Arctic, IEEE J. Sel. Top. Appl. Earth Obs., 13, 1082–1096, https://doi.org/10.1109/JSTARS.2020.2966432, 2020.
Neumann, T. A., Martino, A. J., Markus, T., Bae, S., Bock, M. R., Brenner, A. C., Brunt, K. M., Cavanaugh, J., Fernandes, S. T., Hancock, D. W., Harbeck, K., Lee, J., Kurtz, N. T., Luers, P. J., Luthcke, S. B., Magruder, L., Pennington, T. A., Ramos-Izquierdo, L., Rebold, T., Skoog, J., and Thomas, T. C.: The Ice, Cloud, and Land Elevation Satellite – 2 mission: A global geolocated photon product derived from the Advanced Topographic Laser Altimeter System, Remote Sens. Environ., 233, 111325, https://doi.org/10.1016/j.rse.2019.111325, 2019.
Ricker, R., Hendricks, S., Helm, V., Skourup, H., and Davidson, M.: Sensitivity of CryoSat-2 Arctic sea-ice freeboard and thickness on radar-waveform interpretation, The Cryosphere, 8, 1607–1622, https://doi.org/10.5194/tc-8-1607-2014, 2014.
Ricker, R., Fons, S., Jutila, A., Hutter, N., Duncan, K., Farrell, S. L., Kurtz, N. T., and Fredensborg Hansen, R. M.: Linking scales of sea ice surface topography: evaluation of ICESat-2 measurements with coincident helicopter laser scanning during MOSAiC, The Cryosphere, 17, 1411–1429, https://doi.org/10.5194/tc-17-1411-2023, 2023.
Rotermund, L. M., Williams, W. J., Klymak, J. M., Wu, Y., Scharien, R. K., and Haas, C.: The Effect of Sea Ice on Tidal Propagation in the Kitikmeot Sea, Canadian Arctic Archipelago, J. Geophys. Res.-Oceans, 126, e2020JC016786, https://doi.org/10.1029/2020JC016786, 2021.
Saha, M., Stroeve, J., Yackel, J., Isleifson, D., Nandan, V., and Lam, H. M.: Cambridge Bay Snow Depth – April 2022, CanWIN [data set], https://doi.org/10.34992/j86x-dc30, 2022.
Sturm, M. and Holmgren, J.: An Automatic Snow Depth Probe for Field Validation Campaigns, Water Resour. Res., 54, 9695–9701, https://doi.org/10.1029/2018WR023559, 2018.
Tilling, R. L., Ridout, A., and Shepherd, A.: Estimating Arctic sea ice thickness and volume using CryoSat-2 radar altimeter data, Adv. Space Res., 62, 1203–1225, https://doi.org/10.1016/j.asr.2017.10.051, 2018.
Ullaby, F. T., Moore, R. K., and Fung, A. K.: Microwave Remote Sensing. Active and Passive, Geol. Mag., 124, 88, https://doi.org/10.1017/S0016756800015831, 1987.
Webster, M., Gerland, S., Holland, M., Hunke, E., Kwok, R., Lecomte, O., Massom, R., Perovich, D., and Sturm, M.: Snow in the changing sea-ice systems, Nat. Clim. Change, 8, 946–953, https://doi.org/10.1038/s41558-018-0286-7, 2018.
Willatt, R., Laxon, S., Giles, K., Cullen, R., Haas, C., and Helm, V.: Ku-band radar penetration into snow cover on Arctic sea ice using airborne data, Ann. Glaciol., 52, 197–205, https://doi.org/10.3189/172756411795931589, 2011.
Willatt, R., Stroeve, J. C., Nandan, V., Newman, T., Mallett, R., Hendricks, S., Ricker, R., Mead, J., Itkin, P., Tonboe, R., Wagner, D. N., Spreen, G., Liston, G., Schneebeli, M., Krampe, D., Tsamados, M., Demir, O., Wilkinson, J., Jaggi, M., Zhou, L., Huntemann, M., Raphael, I. A., Jutila, A., and Oggier, M.: Retrieval of Snow Depth on Arctic Sea Ice From Surface-Based, Polarimetric, Dual-Frequency Radar Altimetry, Geophys. Res. Lett., 50, e2023GL104461, https://doi.org/10.1029/2023GL104461, 2023.
Xu, C., Mikhael, W., Myers, P. G., Else, B., Sims, R. P., and Zhou, Q.: Effects of Seasonal Ice Coverage on the Physical Oceanographic Conditions of the Kitikmeot Sea in the Canadian Arctic Archipelago, Atmosphere-Ocean, 59, 214–232, https://doi.org/10.1080/07055900.2021.1965531, 2021.
Yackel, J., Geldsetzer, T., Mahmud, M., Nandan, V., Howell, S. E. L., Scharien, R. K., and Lam, H. M.: Snow Thickness Estimation on First-Year Sea Ice from Late Winter Spaceborne Scatterometer Backscatter Variance, Remote Sens., 11, 417, https://doi.org/10.3390/rs11040417, 2019.
Zheng, J., Geldsetzer, T., and Yackel, J.: Snow thickness estimation on first-year sea ice using microwave and optical remote sensing with melt modelling, Remote Sens. Environ., 199, 321–332, https://doi.org/10.1016/j.rse.2017.06.038, 2017.