the Creative Commons Attribution 4.0 License.
the Creative Commons Attribution 4.0 License.
 | 28 Jul 2025
Glacier inventories reveal an acceleration of Heard Island glacier loss over recent decades
Levan G. Tielidze
Andrew N. Mackintosh
Weilin Yang
Glacier inventories provide baseline data for understanding and evaluating past, current, and future changes in glacier extent in response to climate changes. We present a multi-year, manually mapped glacier inventory for sub-Antarctic Heard Island, a remote glacier-covered volcano in the southern Indian Ocean. Glacier outlines are presented for 1947, 1988, and 2019, derived from large-scale topographical maps (1:50 000), cloud-free medium-resolution SPOT, and high-resolution Pléiades satellite ortho-images. ASTER and Pléiades digital surface elevation models for 2000 and 2019 were also used to determine topographic parameters for individual glaciers. Heard Island glacier area reduced from 289.4 ± 6.1 km2 in 1947 to 260.3 ± 6.3 km2 in 1988, further decreasing to 225.7 ± 4.2 km2 in 2019. The rate of annual glacier area loss between the two observation periods (1947–1988 and 1988–2019) almost doubled from −0.25 % to −0.43 % yr−1. Glaciers on the eastern slopes of Heard Island experienced much higher retreat rates than glaciers elsewhere on the island. The maximum retreat observed between 1947 and 2019 was ∼5.8 km for the east-facing Stephenson Glacier, where collapse of the terminus led to the formation of a large lagoon during recent decades. Surface debris cover on Heard Island glaciers increased from 7.0 % ± 6 % (18.1 km2) in 1988 to 12.8 % ± 5.5 % (29.0 km2) in 2019. We also observed an upward shift (4.2 m yr−1) in the maximum elevation of debris cover from 285 ± 20 m a.s.l. (above sea level) to 605 ± 20 m a.s.l. during this time. Direct climate observations from Heard Island are scarce, but climate reanalysis data show that the decline in glaciers is associated with a rising temperature of 0.7 °C over the last seven decades. Our inventory dataset will be freely available in the Global Land Ice Measurements from Space (GLIMS) glacier database to facilitate further analysis and modelling of Heard Island glaciers.
- Article
(7697 KB) - Full-text XML
-
Supplement
(13931 KB) - BibTeX
- EndNote


Glaciers are a key component of the climate system and serve as sensitive indicators of climate change (Hock et al., 2019). Over recent decades, global glaciers – excluding the Greenland and Antarctic ice sheets – have contributed approximately 27 ± 22 mm to the rise in global mean sea level from 1961 to 2016 (Zemp et al., 2019), including approximately 18 mm between 2000 and 2023 (GlaMBIE, 2025). Glacier shrinkage also has a fundamental impact on global water supplies and mountain hazards (Hock et al., 2019) and glacier inventories are essential for assessing all these impacts (Haeberli and Hoelzle, 1995; Huss and Hock, 2018; Hugonnet et al., 2021; Rounce et al., 2023). Inventories include digitized glacier outlines and their morphological features, such as area, slope, aspect, and elevation, mapped from satellite images and digital elevation models (DEMs). In combination with glacier outlines they provide crucial data for estimating geodetic mass balance (Shean et al., 2020), determining glacier volume (Farinotti et al., 2019), measuring surface velocity (Dehecq et al., 2019), and testing glacier models (Radić et al., 2014; Eis et al., 2021).
Given the scarcity of landmasses and climate observations in the Southern Ocean region, glacier-covered sub-Antarctic islands provide a unique window into the impacts of past, present, and future climate changes (e.g. Deline et al., 2024). Heard Island is such an example, but because of its remote location and harsh climate, its glaciers remain relatively poorly studied compared to other glaciers in the Southern Hemisphere. A new inventory from this region offers critical data on glacier behaviour, such as area and terminus changes, which are essential for understanding how these glaciers are responding to climate changes and other drivers. Given the limited field-based research opportunities on Heard Island, a new glacier inventory also allows us to analyse past glacier conditions, improving our understanding of processes and providing a baseline for predicting future changes in this sensitive region.
Heard Island is a UNESCO World Heritage site due to its outstanding physical and biological features which are being affected by significant ongoing climatic changes. As one of the only sub-Antarctic islands mostly free of introduced species, its largely undisturbed ecosystems are at risk from the impact of glacier retreat (HIMI Management Plan, 2014). This is because ice recession causes long-isolated ecological communities to become connected, likely favouring generalist species (Bosson et al., 2023). Glacier inventory work will help in designing effective conservation strategies and managing protected areas to ensure the preservation of the biodiversity they support (Pockley, 2001; HIMI Management Plan, 2014).
Since a complete inventory of Heard Island glaciers has not been published for several decades (e.g. Budd, 2000; Allison and Thost, 2000; Thost and Truffer, 2008), this study aims to create a new inventory using remotely sensed glacier parameters. We use our analysis to assess how various climatic, morphological, and topographic factors influence glacier recession on Heard Island, providing preliminary answers to the question of how Heard Island glaciers are changing.
2.1 Physical characteristics
Heard Island is the largest member of the Territory of Heard Island and McDonald Islands located at 53°05′ S and 73°31′ E at the southern edge of Indian Ocean, almost midway between western Australia and South Africa. Antarctica is the nearest continent, located ∼1500 km to the south, while the relatively large Kerguelen Islands are ∼450 km to the northwest. Heard Island is approximately 40 km long from northwest to southeast and only 20 km wide from northeast to southwest (Fig. 1).
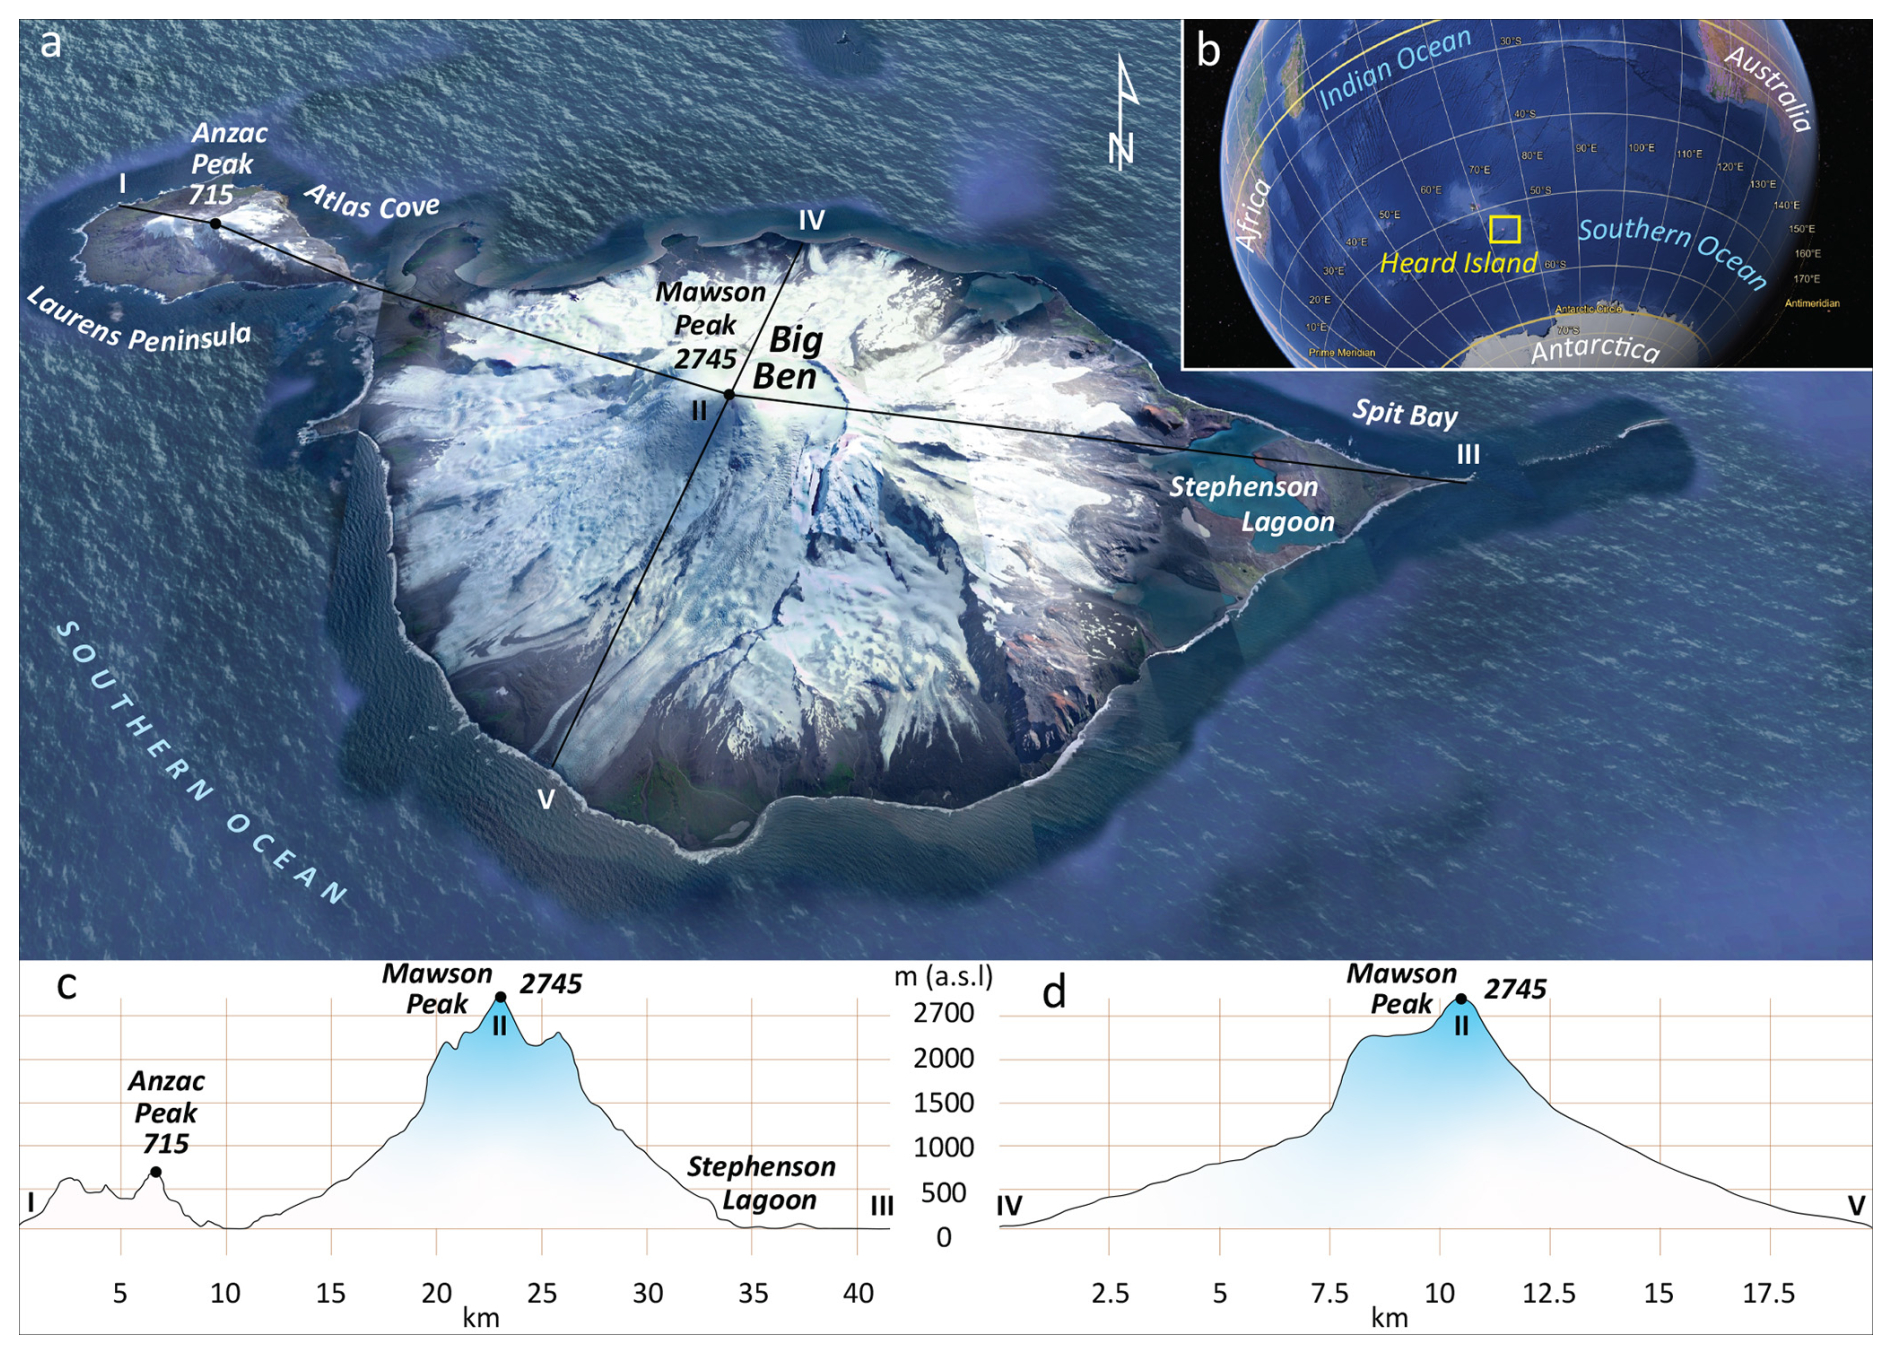
Figure 1True colour aerial image of Heard Island (© Google Earth). (b) Location of Heard Island in the Southern Hemisphere (© Google Earth). (c) Longitudinal and (d) transverse profiles (cross sections) of Heard Island.
Heard Island, along with the McDonald Islands and Kerguelen Island, forms part of the submarine Kerguelen Plateau, a significant geological feature in the southern Indian Ocean. Heard Island's geological structure is characterized by its two volcanic cones – Big Ben and Laurens Peninsula – each with distinct elevations and volcanic rocks and landforms. Big Ben, with a diameter of ∼20 km and reaching an elevation of 2745 m a.s.l. at Mawson Peak, is the larger volcanic cone. The highest point of Laurens Peninsula is Anzac Peak (715 m a.s.l.). Over 80 % of Heard Island is ice-covered with glaciers (Thost and Truffer, 2008) flowing from the caldera of Big Ben and the summit plateau of Laurens Peninsula. Big Ben was most recently reported active in November 2020 (Fox et al., 2021).
The climate of the Heard and McDonald Islands region is significantly shaped by its mid-latitude position in the Southern Ocean, south of the Antarctic Polar Front, where subantarctic and colder Antarctic Ocean waters converge. This location is affected by the region's westerly winds, which are linked to the west-to-east progression of deep low-pressure systems in the middle to high southern latitudes (Allison and Keage, 1986). Heard Island's weather is characterized by small variations in both seasonal and daily temperatures, with persistent cloud cover, frequent precipitation, and strong winds. Snowfall occurs year-round. Based on various observations from the second half of the 20th century (Kiernan and McConnell, 2002; HIMI official website, 2024), average monthly temperatures at Atlas Cove range from 0.0 to 4.2 °C. In summer, daily temperatures typically vary between 3.7 and 5.2 °C, while in winter, they range from −0.8 to 0.3 °C. The winds are predominantly westerly and strong, with monthly average speeds at Atlas Cove varying between ∼26 and 33.5 km h−1. Gusts can exceed 180 km h−1. Heard Island experiences annual precipitation at sea level ranging from 1300 to 1900 mm, with rain or snow occurring on roughly 3 out of every 4 days. However, meteorological records for the island are scarce and incomplete, and long-term local observations including information about local gradients and trends are rare.
2.2 Previous studies
Heard Island became widely known after 1853 when Captain Heard visited the site, although it was first seen by Captain Peter Kemp in 1833 (Mawson, 1935). Two years after Captain Heard's expedition, Darwin Rogers was the first to land on Heard Island in 1855 (Lambeth, 1951). Following this, sealers occupied the island from the middle to late 19th century, decimating the seal population. Later, various scientific expeditions visited Heard Island and stayed only several days, mainly at Atlas Cove (e.g. Von Drygalski, 1908; Aubert de la Rue, 1929; Mawson, 1932).
The largest scientific campaign began in 1947, when the Australian National Antarctic Research Expedition established a base camp at Atlas Cove. This campaign continued until 1955, and James Lambeth first carried out physical measurements of Heard Island glaciers at this time (Lambeth, 1951). According to his notes the snow line of the Heard Island glaciers was at about 305 m a.s.l. in Austral summer of 1947–1948. There was a minor difference in the snow line elevations between north- and south-facing glaciers. Thickness of the Baudissin and Vahsel glaciers at the frontal area was between 35–40 m in August 1948. Ice velocity measurement at an elevation of 90 m a.s.l. of Baudissin Glacier tongue between 11 September and 8 December indicated an average ice flow rate of approximately 440 m yr−1, while the ablation at an elevation of about 40 m a.s.l. was m during this ∼3-month period. A recent global study of glacier thickness and velocity (Millan et al., 2022), based on Landsat and Sentinel image pairs acquired between 2017 and 2018, shows unusually fast flow velocities for Gotley Glacier with velocities up to 1500 m yr−1.
Short scientific visits to the island were also made in 1963, 1965, and 1969 mainly for seasonal observations of the north-facing glacier front variations (Budd, 1964, 1970; Budd and Stephenson, 1970). More detailed studies of Vahsel Glacier, including mass balance measurements, started later in 1971 (Allison, 1980). Ablation at 200 m a.s.l. was estimated at 3–4 m water equivalent annually. A surface velocity profile across the glacier at the same elevation showed annual movement of 200–280 m near the centre. The average thickness of Vahsel Glacier (determined gravimetrically) below the equilibrium line was between 60–80 m near the centreline.
Studies of south- and southeast-facing glaciers started later in the 1990s. The retreat and proglacial lake expansion at Stephenson Glacier were studied by Kiernan and McConnell (2002), who showed that the glacier retreated at a mean rate of −18 m yr−1 from 1947 to 1987 before accelerating dramatically to −100 m yr−1 between 1987 and 2000. A further glaciological and meteorological study of Brown Glacier on the eastern slope of Heard Island was conducted by Thost and Truffer (2008) based on old topographical maps (1947) and ground-based observations (2004). They concluded that Brown Glacier area decreased by ∼29 % during the investigated period, while on average the surface lowered by −0.50 m yr−1. This mass loss was consistent with interpolated summer (January–March) temperatures in the area that indicated a +0.9 °C warming over the investigated period (1947–2004). They also observed that the Brown Glacier terminus retreated by 63 m between 2000 and 2003.
The Global Land Ice Measurements from Space (GLIMS) book (Kargel et al., 2014) identifies 29 glaciers on Heard Island with a total area of 257 km2 in 1988 (Cogley et al., 2014), while the Randolph Glacier Inventory (RGI v6) database identifies 31 glaciers with a total area of 254.4 km2 (Pfeffer et al., 2014). Some glaciers in these datasets have incorrect terminus positions, specifically the eastern-facing glaciers, and nearly all glaciers are also characterized by inaccurate ice margins (due to misidentification of ice divides). This issue persists in the RGI v7 database (Maussion et al., 2023).
Conducting large-scale field-based glacier research on Heard Island is extremely challenging due to topographic, logistical, financial, and safety obstacles (e.g. Allison and Thost, 2000). Consequently, old topographical maps and remotely sensed images from historical and current Earth observation platforms provide the most viable method for tracking changes in glacier parameters (e.g. Tielidze, 2016; Freudiger et al., 2018; Weber et al., 2020).
3.1 Old maps
The first aerial photographs of Heard Island glaciers were captured in 1947 using a handheld (15 cm × 15 cm) Fairchild F24 camera on board an RAAF Walrus amphibious aircraft. These photos provided limited oblique coverage of the east and north coasts. However, a ground triangulation survey conducted in 1948, which focused on Laurens Peninsula and the north and east coasts, allowed for more accurate mapping of terrain features, including glacier fronts (Allison, 1980). A large-scale (1:50 000) topographical map of Heard Island (1964) shows glacier boundaries from 1947–1948 based on these early photographs and surveys (Division of National Mapping, 1964). Therefore, the glacier extent on Heard Island in 1947–1948 can be directly referenced from this topographical map, which reflects the original positions of the glaciers as depicted in the aerial images (Fig. 2; Table 1).
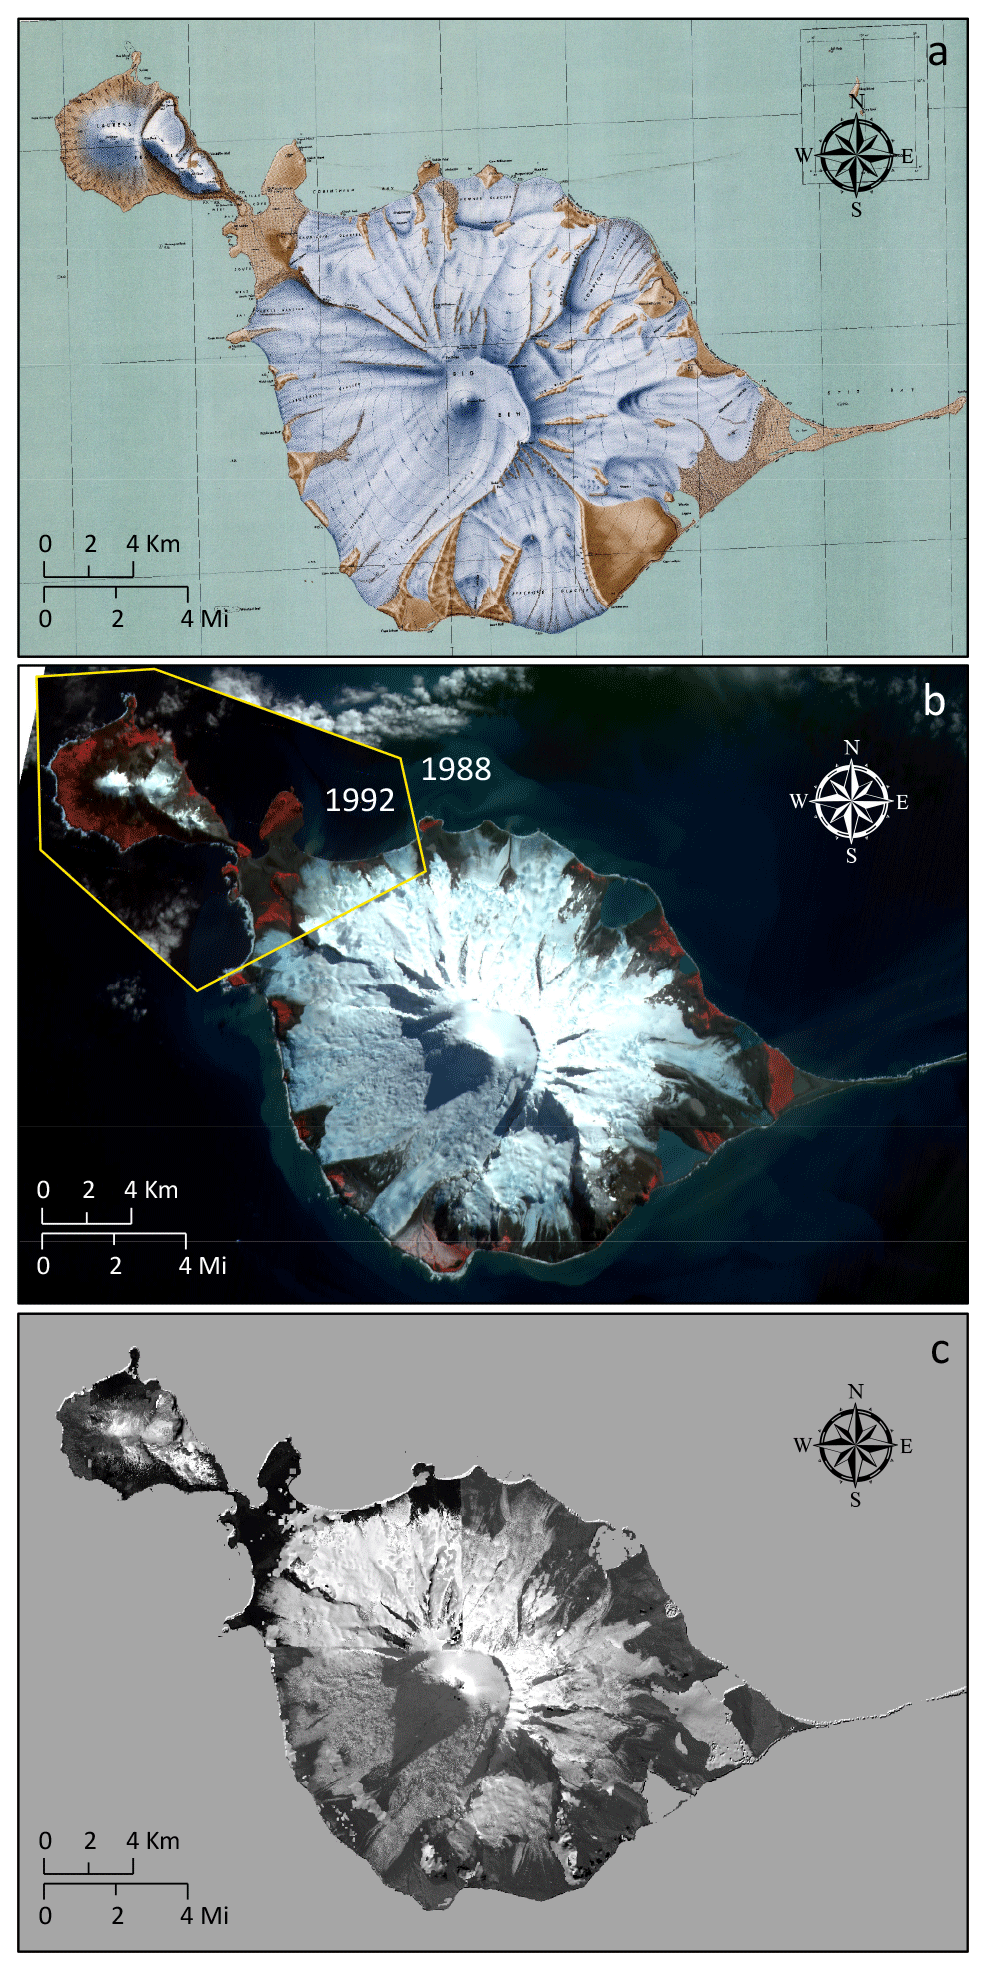
Figure 2Data sources used in this study for glacier mapping. (a) Topographical map from 1964 compiled based on aerial imagery from 1947. (b) SPOT images from 1988 and 1992. (c) Pléiades images from 2019.
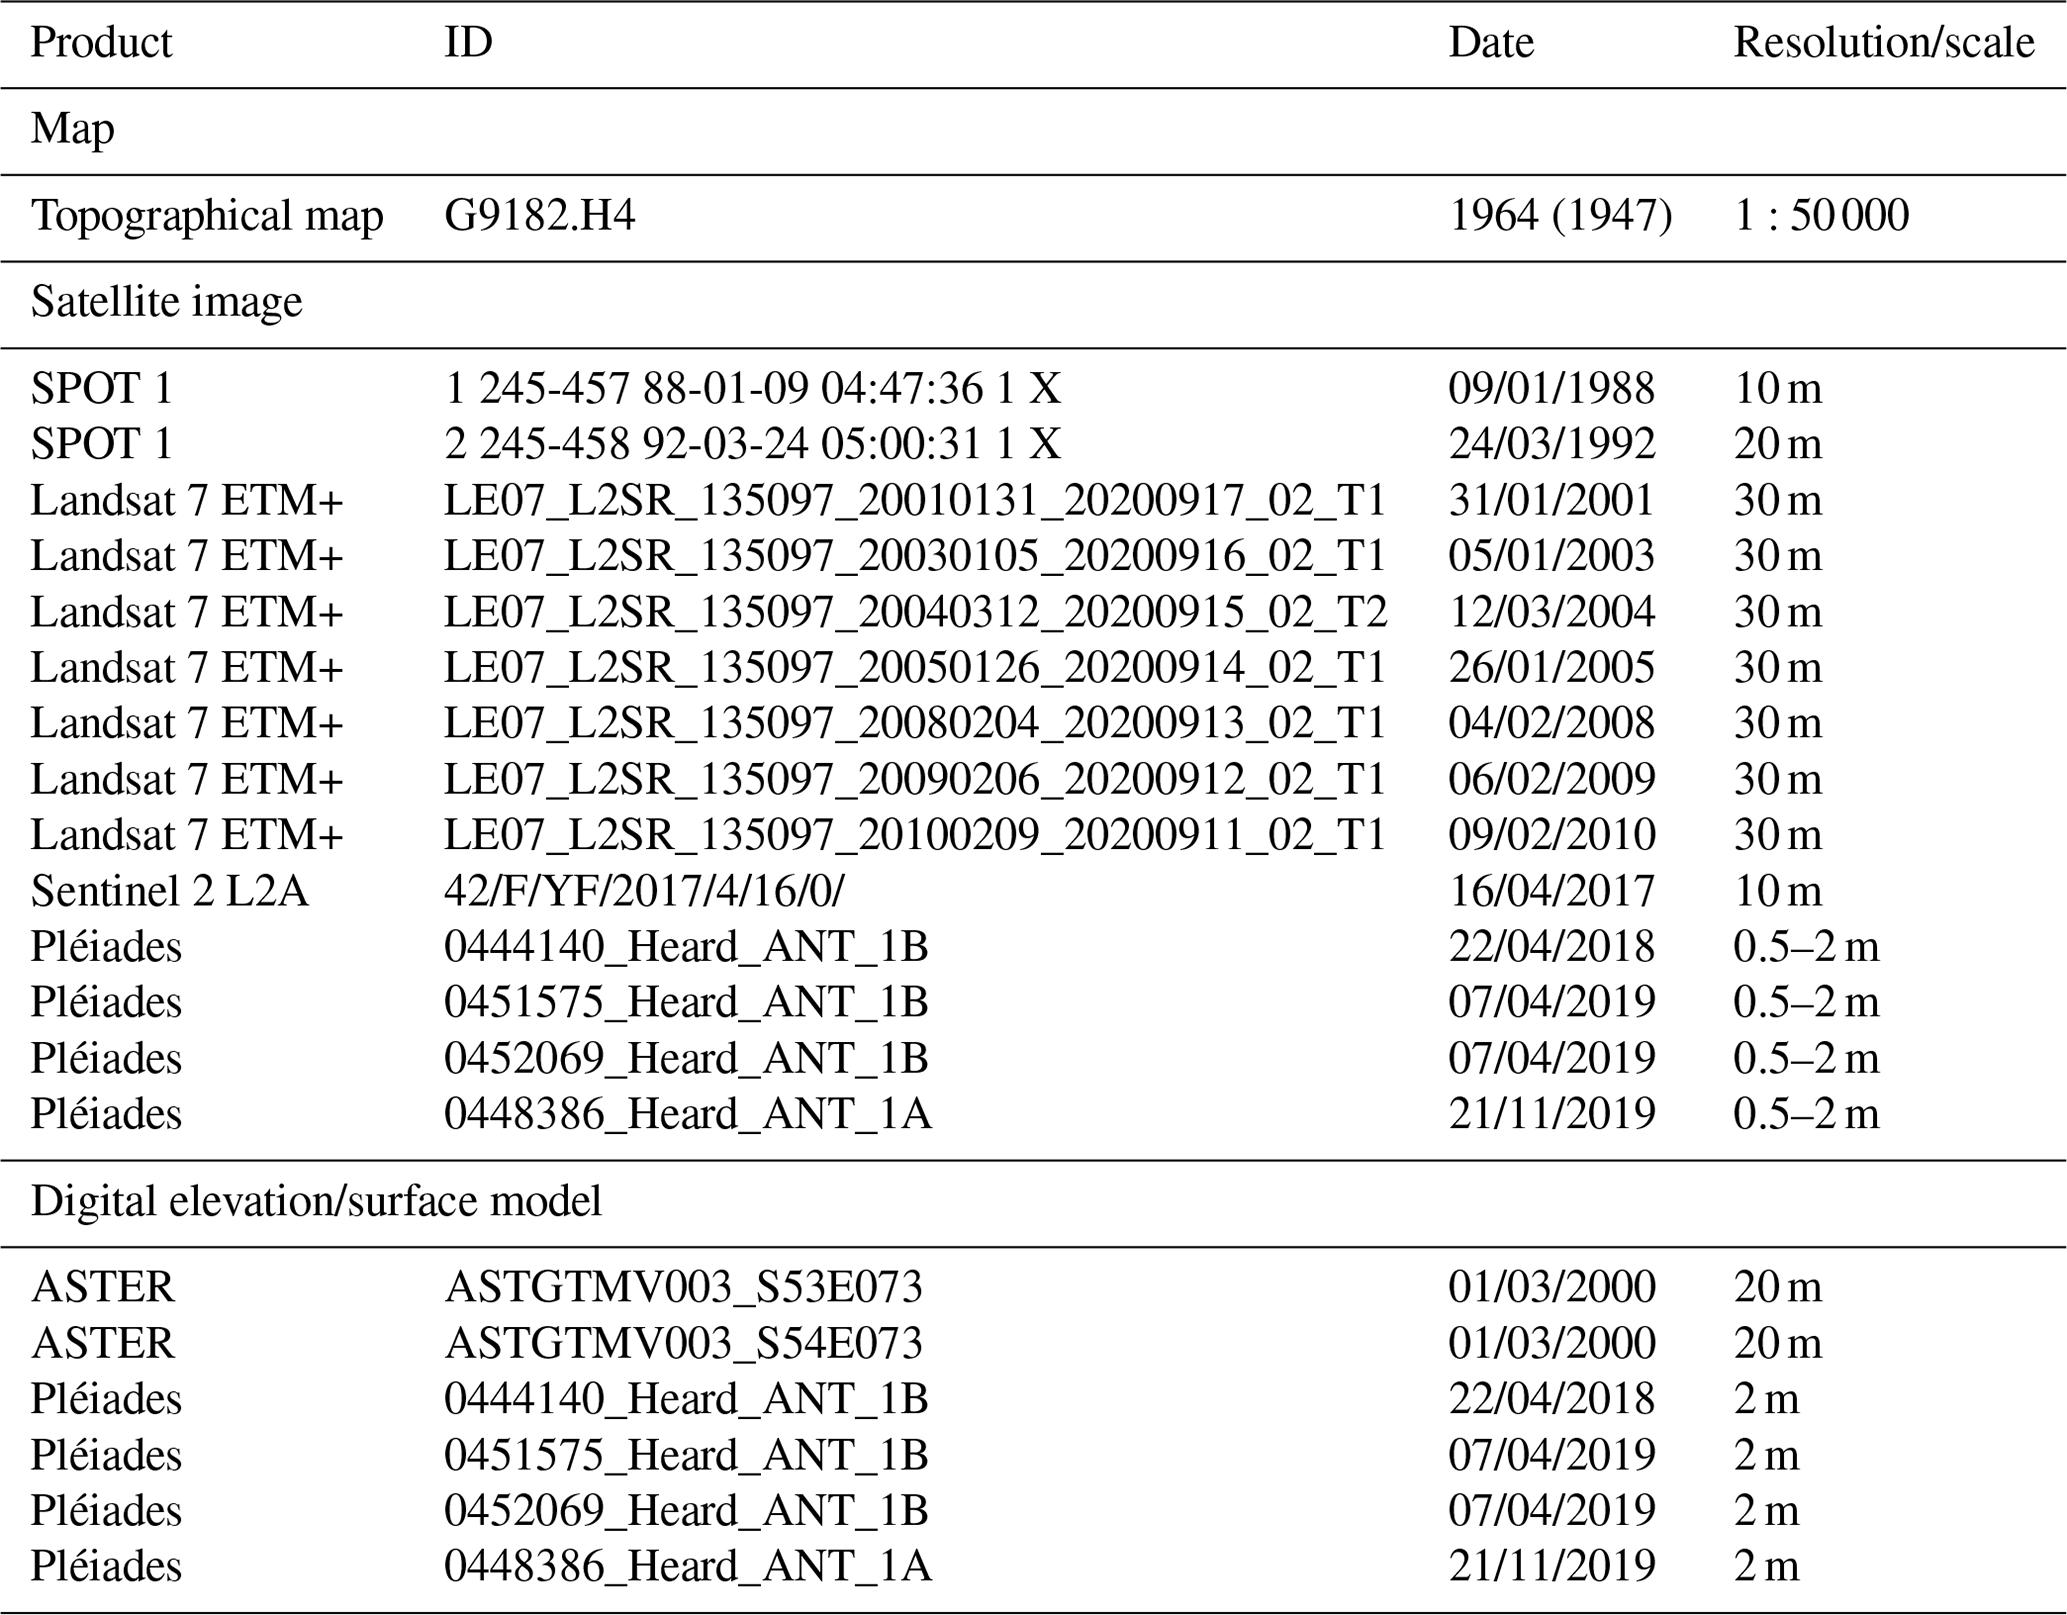
Table 1Topographic maps, satellite images, and digital elevation/surface models used in this study.
3.2 Satellite images
Landsat satellite products have been available since the 1980s, although image acquisition was limited in the early 1990s due to its commercial phase (Williamson, 1997). Post-1990 Landsat images of Heard Island often feature cloud cover that partially or completely obscures glaciers, making it difficult to accurately delineate glacier boundaries. We therefore use medium-resolution (10 and 20 m) cloud-free SPOT 1 images from 1988 and 1992 available from the French Space Agency's (CNES) Spot World Heritage Programme (https://regards.cnes.fr/html/swh/Home-swh3.html, last access: August 2024). The 1988 image was used as the baseline database, and the 1992 image was used as a supplement because Laurens Peninsula and northern parts of the Heard Island glaciers were partly covered by clouds in the 1988 image.
A 2 m resolution, georeferenced, cloud-free Pléiades ortho-mosaic and 0.5 m resolution panchromatic bands from 2019 austral summer were used to delineate the most recent glacier boundaries in our data set. These images were not available for the northwest part of Laurens Peninsula. To fill this gap, we used a similar Pléiades product acquired in April 2018, but the images from 2019 were used as a main dataset for the island. Pléiades images were received from the Laboratory of Space Geophysical and Oceanographic Studies (LEGOS) via the Pléiades Glacier Observatory (Berthier et al., 2024).
High-resolution QuickBird images (2014–2024), combined with SRTM3 topography data (Raup et al., 2014), were also used in Google Earth Pro software to enhance the 3D visualization and identification of ice divides as well as to validate the glacier outlines mapped from the satellite images.
For the annual measurements of Stephenson and Brown glacier termini, 30 m resolution Landsat 7 Enhanced Thematic Mapper Plus (ETM+) and 10 m resolution Sentinel 2 images were used, as they only had cloud-free windows for these two glaciers. Both Landsat and Sentinel products are from the Earth observation (EO) Browser (https://apps.sentinel-hub.com/eo-browser/, last access: August 2024).
3.3 Digital elevation/surface models
Topographic parameters of glaciers such as aspect, slope, and elevation from 1947 and 1988 were obtained from the Advanced Spaceborne Thermal Emission and Reflection Radiometer Global Digital Elevation Model (ASTER GDEM V3, 1 March 2000), available through EarthExplorer (http://earthexplorer.usgs.gov/, last access: May 2024), U.S. Geological Survey (USGS), with a horizontal resolution of 20 m (Tachikawa et al., 2011). The ASTER GDEM is widely recognized and used in glaciological research globally across different spatial scales (e.g. Bhambri et al., 2011; Stokes et al., 2013; Tielidze et al., 2020). The same topographic characteristics for the glaciers from 2019 were extracted from the high-resolution (2 m) Pléiades digital surface models (DSMs) for 2018–2019 available from the Laboratory of Space Geophysical and Oceanographic Studies (LEGOS) via the Pléiades Glacier Observatory (Berthier et al., 2024).
4.1 Glacier mapping
Despite some advantages of the automated mapping method of clean ice (e.g. Paul et al., 2013), the manual mapping of glaciers is more accurate for many mountain regions around the world (e.g. Stokes et al., 2013; Nagai et al., 2016; Tielidze and Wheate, 2018; Korneva et al., 2024). In this study, glacier boundaries were, therefore, delineated manually. This was also mainly due to the (i) unavailability of cloud-free satellite channels/bands for different years for the entire study area, which limited us to use different band ratio segmentation methods for automated mapping; (ii) significant amount of debris cover, which can cause uncertainty during automatic mapping or hinder mapping; and (iii) a relatively small study area, which was less time expensive than it would have been for an entire mountain range.
4.2 Terminus measurement
Accurately quantifying changes in glacier termini is essential for effective monitoring of glacier changes over various timescales, from years to centuries. Methods for this technique each offer advantages and limitations (Lea et al., 2014). In this study, we only measured two glacier (Stephenson and Brown) lengths based on the Global Land Ice Measurements from Space (GLIMS) guidelines (https://www.glims.com, last access: 17 February 2025) and by following Purdie et al. (2014). The flow direction of the glacier was manually determined to be perpendicular to altitude contours. We assessed terminus changes by comparing glacier outlines from different dates along the ice front, oriented perpendicular to the flow. Elevation changes at the glacier fronts were also measured at the intersection points.
4.3 Accuracy and uncertainly assessment
When using glacier outlines to assess changes, it is crucial to understand their accuracy. Assessing accuracy can be difficult because high-resolution reference data are often scarce. Additionally, any manual corrections made to the raw outlines (e.g. such as debris cover) may reflect the bias of the analyst rather than the effectiveness of the algorithm used (Paul et al., 2013). It is therefore essential to establish an uncertainty even after achieving high-accuracy mapping. Uncertainty often arises from the resolution of the satellite image, and from the contrast between the glacier and the surrounding terrain (Burgess and Sharp, 2004; DeBeer and Sharp, 2007).
To estimate glacier mapping uncertainty, first we tested multiple digitizations (e.g. Paul et al., 2013; Tielidze et al., 2022). A sub-sample of two glaciers from the medium-resolution SPOT image, 1988, were re-digitized by three different operators. The selected glaciers included debris-free Brown and one unnamed debris-covered glacier with a GLIMS ID of G073625E53121S. The uncertainty for the debris-free Brown Glacier based on normalized standard deviation (NSD – delineations by multiple digitalizations divided by the mean glacier area for all outlines) was 2.0 %. In contrast, the debris-covered glacier exhibited a much higher uncertainty of 5.3 %. We applied the same methodology to these glaciers using the high-resolution Pléiades image from 2019. The mapping uncertainty for the debris-free glacier was determined to be 1.1 %, while the debris-covered glacier exhibited a considerably higher uncertainty of 5.1 % (Fig. 3a–d).
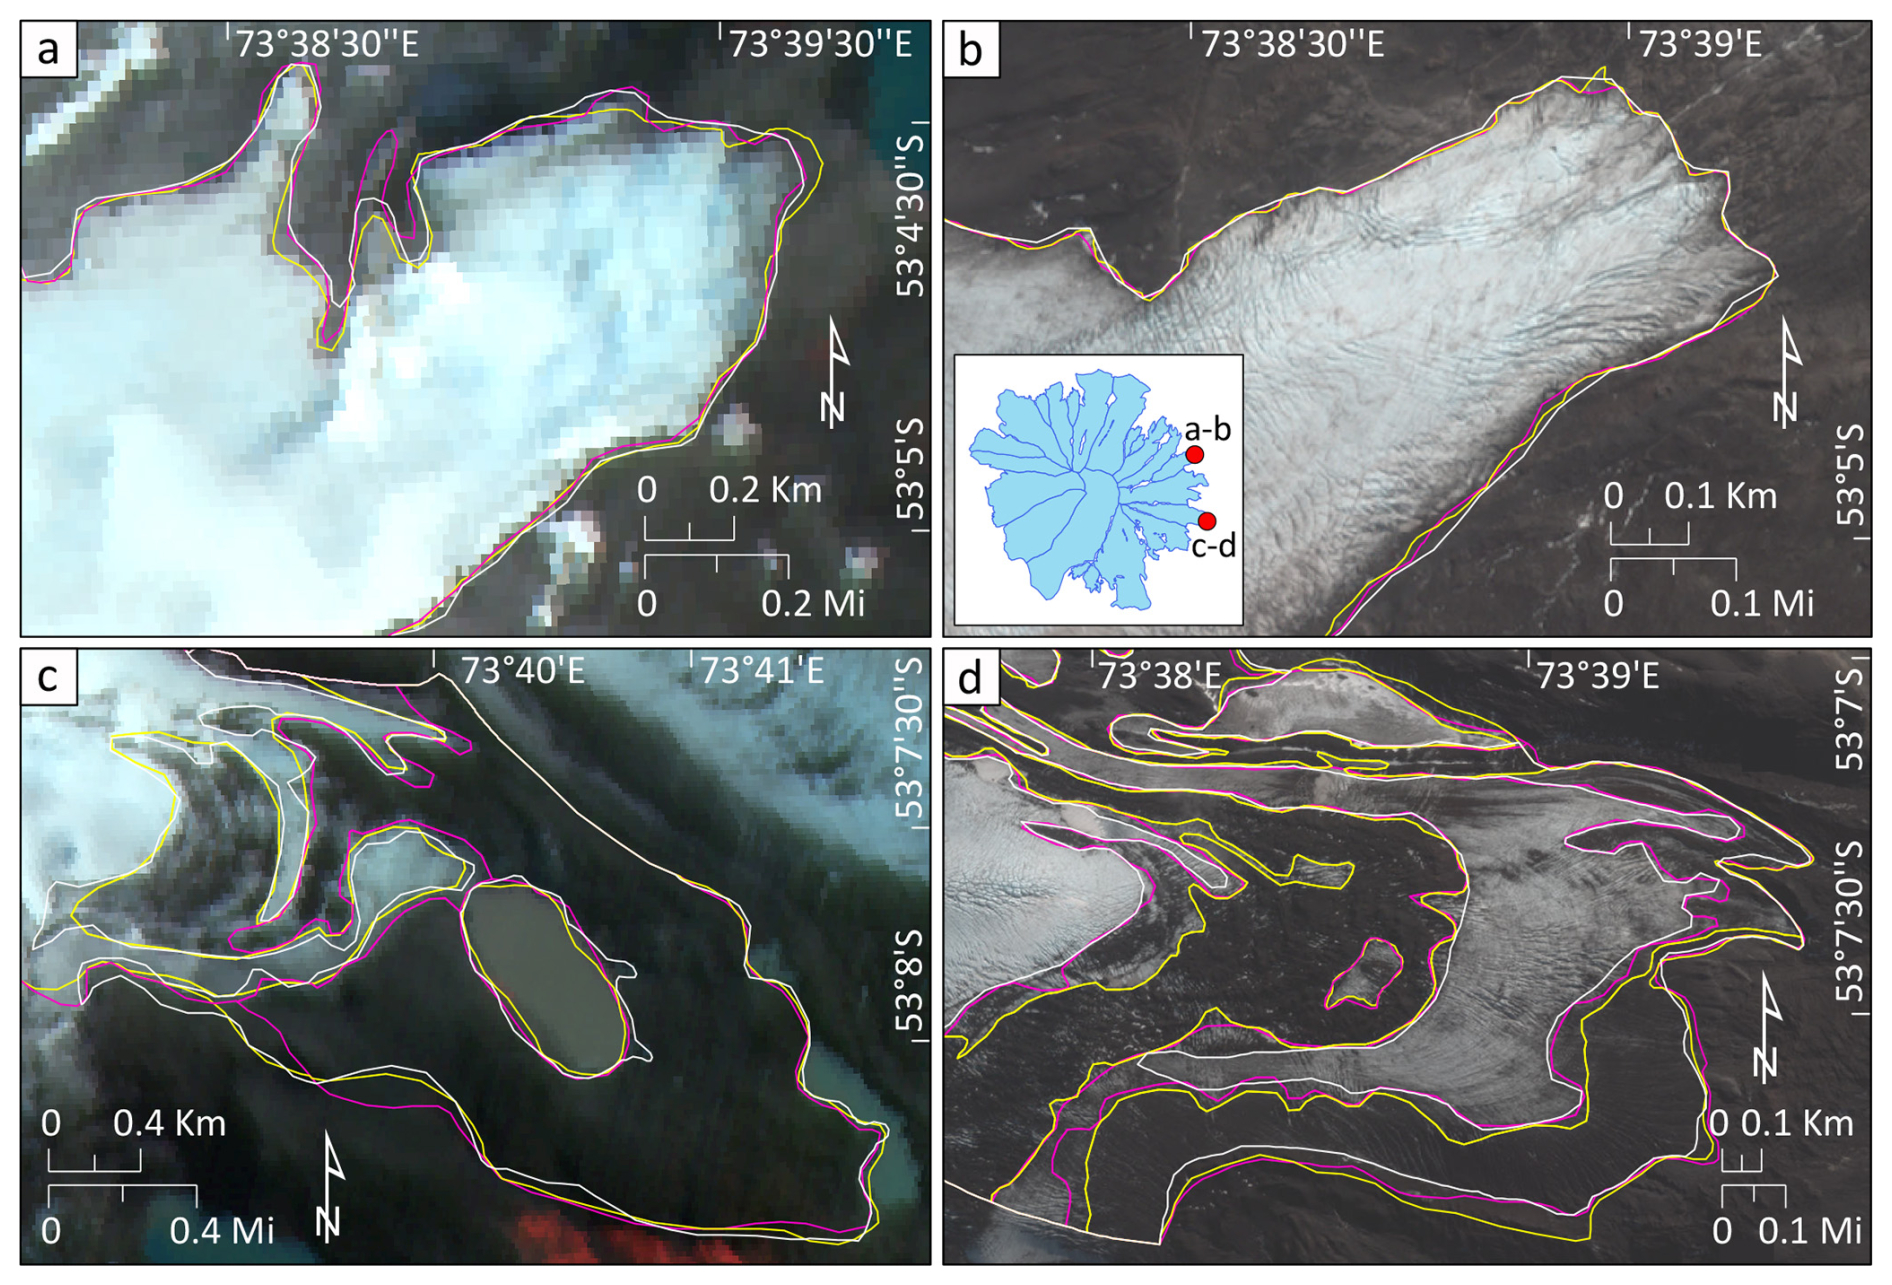
Figure 3An example of multiple digitization for debris-free Brown (a, b) and debris-covered G073625E53121S (b, c) glacier termini. (a, c) SPOT scene (9 January 1988). (b, d) Pléiades scene (7 April 2019). Insert map in panel (b) shows location of the selected glaciers relative to other glaciers.
To estimate the statistical uncertainty for each glacier, we used the buffer method as in Granshaw and Fountain (2006) and Bolch et al. (2010). This approach provides minimum and maximum area values, which we utilized to calculate the relative area difference. For the 1:50 000 scale topographic map, or glacier outlines from 1947, a 30 m buffer size proposed by Tielidze (2016) was used, yielding a total potential error of ±2.1 %. A 20 m buffer was used for 1988 glacier outlines, giving a total error of ±2.4 %. The chosen buffer is based on a previous multiple digitizing experiment from similar-resolution satellite images worldwide (Paul et al., 2013; Tielidze and Wheate, 2018), demonstrating that the variability in positioning typically falls within one pixel, or approximately ±10–30 m, depending on the image resolution. Despite the high resolution of the Pléiades images, we choose a 10 m buffer size for glacier contours from 2019, estimating a total uncertainty of ±1.9 %. This decision is primarily due to an extensive debris cover, which frequently complicates the mapping of glaciers.
A larger buffer should be applied to the debris-covered parts of glaciers, as outline uncertainties are higher than for bare ice (e.g. Tielidze et al., 2020). In our case, the buffer size was set to 30 m, resulting in a total potential error of ±6.0 % for 1988 and ±5.5 % for 2019 glaciers. We have not estimated the surface debris cover for the glaciers from 1947.
For uncertainties in length changes, we used the source image resolution as proposed by Hall et al. (2003).
5.1 Glacier area changes in 1947–1988 and 1988–2019
A total of 29 glaciers, with an average size of 9.9 km2, were mapped in the study area in 1947 (Fig. 4). During the 41-year observation period from 1947–1988, the glaciers shrank by 29.1 ± 0.7 km2 (10.1 %) from 289.4 ± 6.1 km2 in 1947 to 260.3 ± 6.3 km2 in 1988, showing a mean annual glacier area loss of −0.25 % yr−1. A total of 30 glaciers were identified in 1988 with an average size of 8.7 km2. Between 1988 and 2019, a considerable decrease in glacier area of 34.6 km2 (13.3 %) to 225.7 ± 4.2 km2 occurred, almost doubling the rate of annual glacier area loss to −0.43 % yr−1. The average glacier size also decreased to 6.4 km2 during this period.
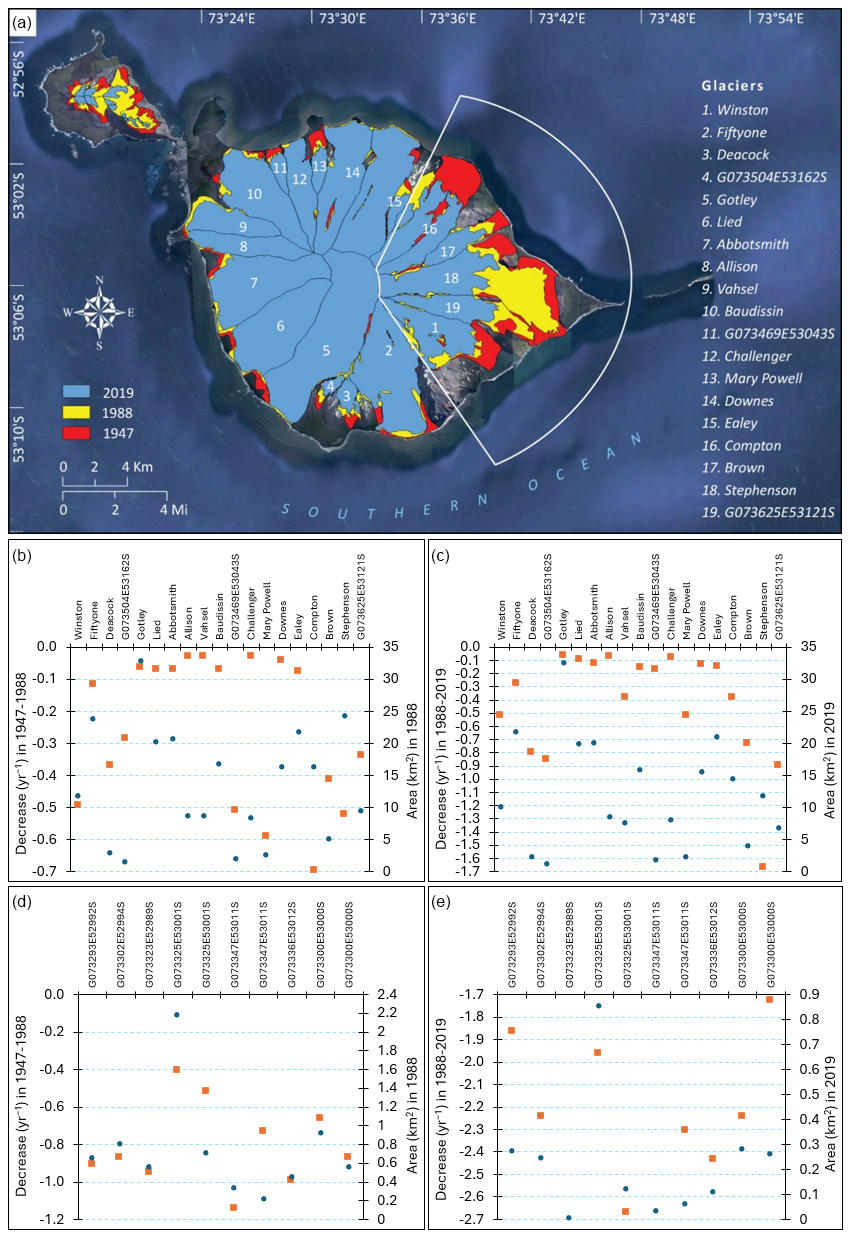
Figure 4(a) Heard Island glacier outlines in 1947, 1988, and 2019. The white frame highlights east-facing glaciers where the highest decrease rates occurred. A scatter plot of the individual glacier area change rate is also shown (brown dots) vs. glacier size (blue dots) for Big Ben (b, c) and for Laurens Peninsula (d, e).
The pattern of observed glacier wastage is strongly influenced by topographic and morphological parameters. The small and low-elevation glaciers at Laurens Peninsula experienced the largest change in area from 10.5 to 2.2 km2 between 1947–2019. This is an area loss of −79 % ± 2.2 % amounting to an annual decrease of −1.1 % yr−1 (Fig. 4b–e).
We also observed an upward shift in the minimum and mean elevation of all Heard Island glaciers during the study period and downward shift in the maximum elevation from 1988 (Fig. 5). The decreasing trend of maximum glacier elevation is mainly due to the disappearance of small glaciers from Laurens Peninsula.
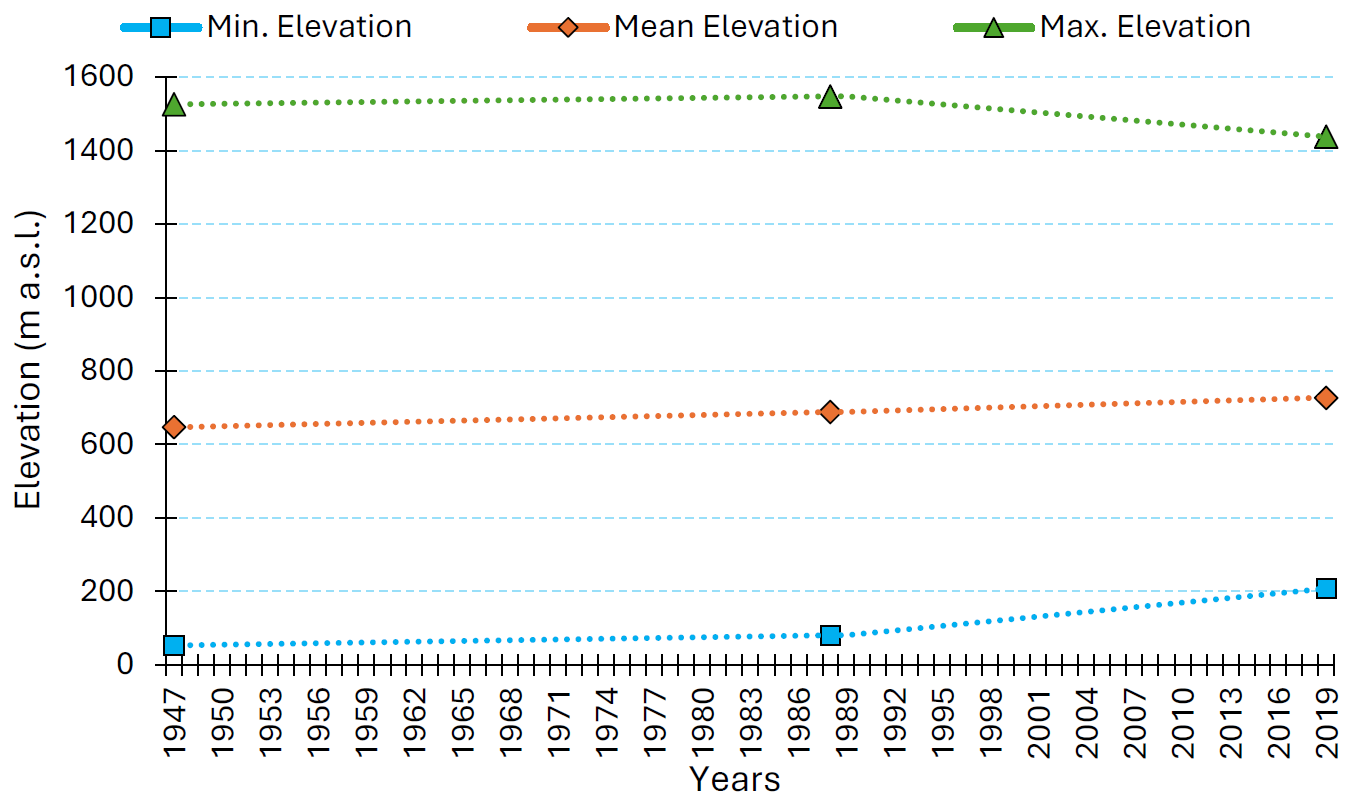
Figure 5Changes in Heard Island glacier minimum (Min.), mean, and maximum (Max.) elevations between 1947–1988 and 1988–2019.
Gotley Glacier was largest on Heard Island in 2019, with an area of 32.3 ± 0.5 km2, followed by Fiftyone and Abbotsmith glaciers with areas of 21.8 ± 0.4 and 19.9 ± 0.3 km2, respectively.
By number, most glaciers on Heard Island are oriented towards the northeast, whereas most of the glacier-covered area is facing southwest. Glaciers of west and southwest orientation have the highest mean elevations (Fig. 6a–c).
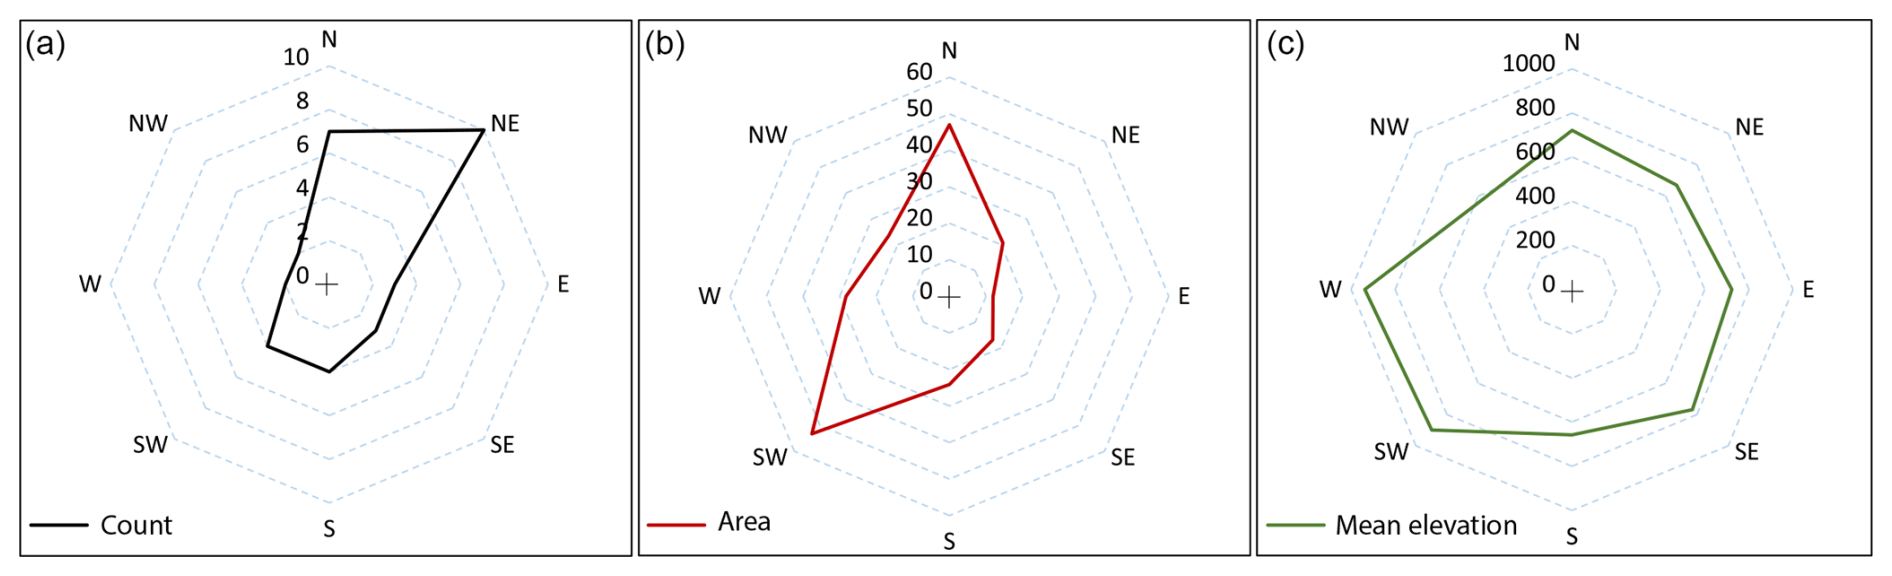
Figure 6Distribution of Heard Island glacier aspects by (a) number, (b) area (km2), and (c) mean elevation (a.s.l.) in 2019.
Eastern-facing glaciers experienced the highest area loss over the study period (depicted by the white outline in Fig. 4a) from 85.1 ± 1.6 km2 in 1947 to 66.5 ± 1.3 km2 in 1988 and 46.3 ± 0.9 km2 in 2019. This was a 22 % or −0.53 % yr−1 decrease between 1947–1988, which is more than double the change for all Heard Island glaciers over this period. Glacier change during the more recent investigated period was dramatic and unprecedented for the eastern-facing glaciers on Heard Island – they declined by 30 % or −1.0 % yr−1 between 1988–2019.
5.2 Glacier length changes
Brown and Stephenson glaciers showed significant terminus retreat, as evidenced by glacier shrinkage during the study period. An average total terminus retreat of 1483 ± 20 m was observed for Brown Glacier between 1947–2019 with an annual mean retreat rate of −20.6 m yr−1. The retreat rate of −25.7 m yr−1 was much higher during the second investigated period (1988–2019).
Stephenson Glacier retreated more than any other glacier on Heard Island during our study period. The glacier terminus retreated by 5811 ± 20 m between 1947–2019, yielding an annual retreat rate of −80.7 m yr−1 (Fig. 7). The largest retreat of Stephenson Glacier, −5541 ± 20 m, was recorded during the period 1988–2019, corresponding to an annual retreat rate of −178.7 m yr−1, which is 7 times higher than was observed for Brown Glacier during the same time. Observations in Stephenson Lagoon during the summer of 2008 revealed a dense concentration of icebergs drifting towards the ocean, creating the illusion of a glacier readvance. However, the upper section of the glacier tongue showed no change. Although a small terminus retreat was recorded from 2008 to 2009, the primary change was the complete loss of the floating icebergs by 2009 (see also Supplement).
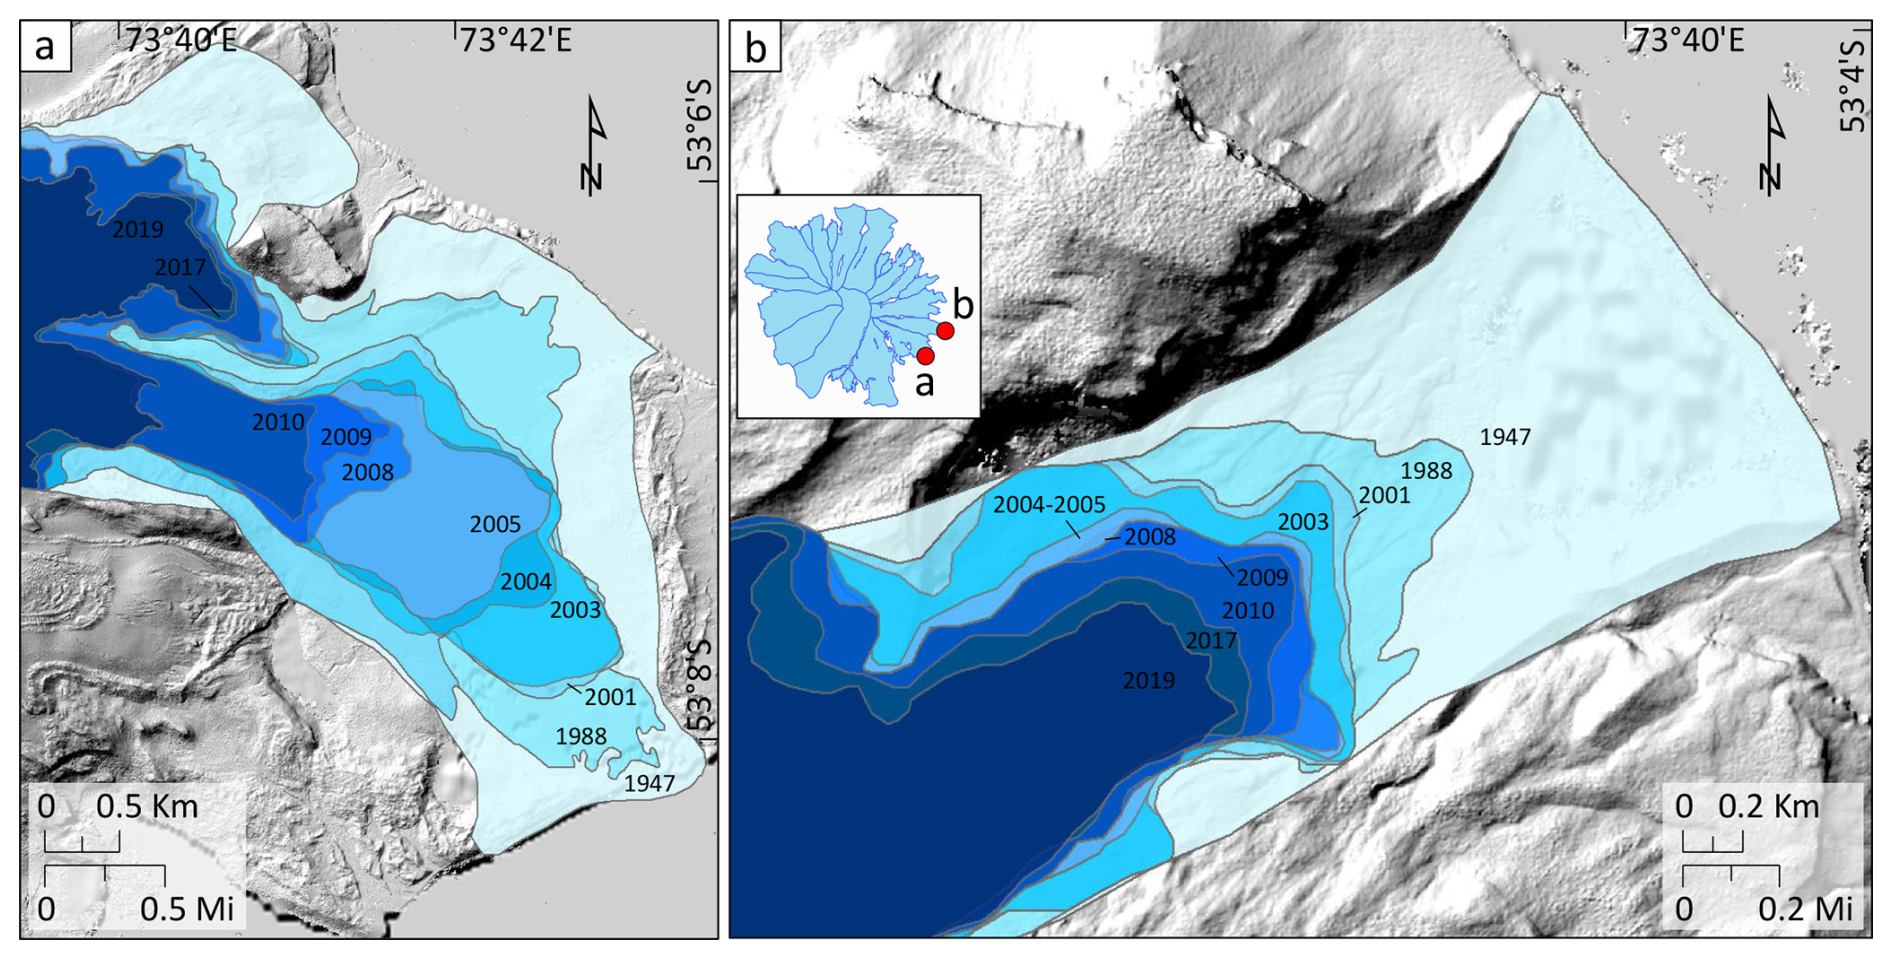
Figure 7Stephenson (a) and Brown (b) glacier retreat between 1947 and 2019. Pléiades Hillshade is used as a background (7 April 2019). Insert map in panel (b) shows location of the selected glaciers relative to other glaciers.
5.3 Surface debris cover changes in 1988–2019
We found that surface debris cover increased for all glaciers on Heard Island except those facing northwest and for glaciers on Laurens Peninsula. Overall debris cover increased from 18.2 ± 1.1 km2 in 1988 to 29.0 ± 1.6 km2 in 2019. This increase in debris-covered area occurred despite a large decrease in corresponding glacier area over this period. The change equates to an increase in the proportion of debris-covered surface area from 7.0 % ± 6.0 % in 1988 to 12.8 % ± 5.5 % in 2019 (Fig. 8).
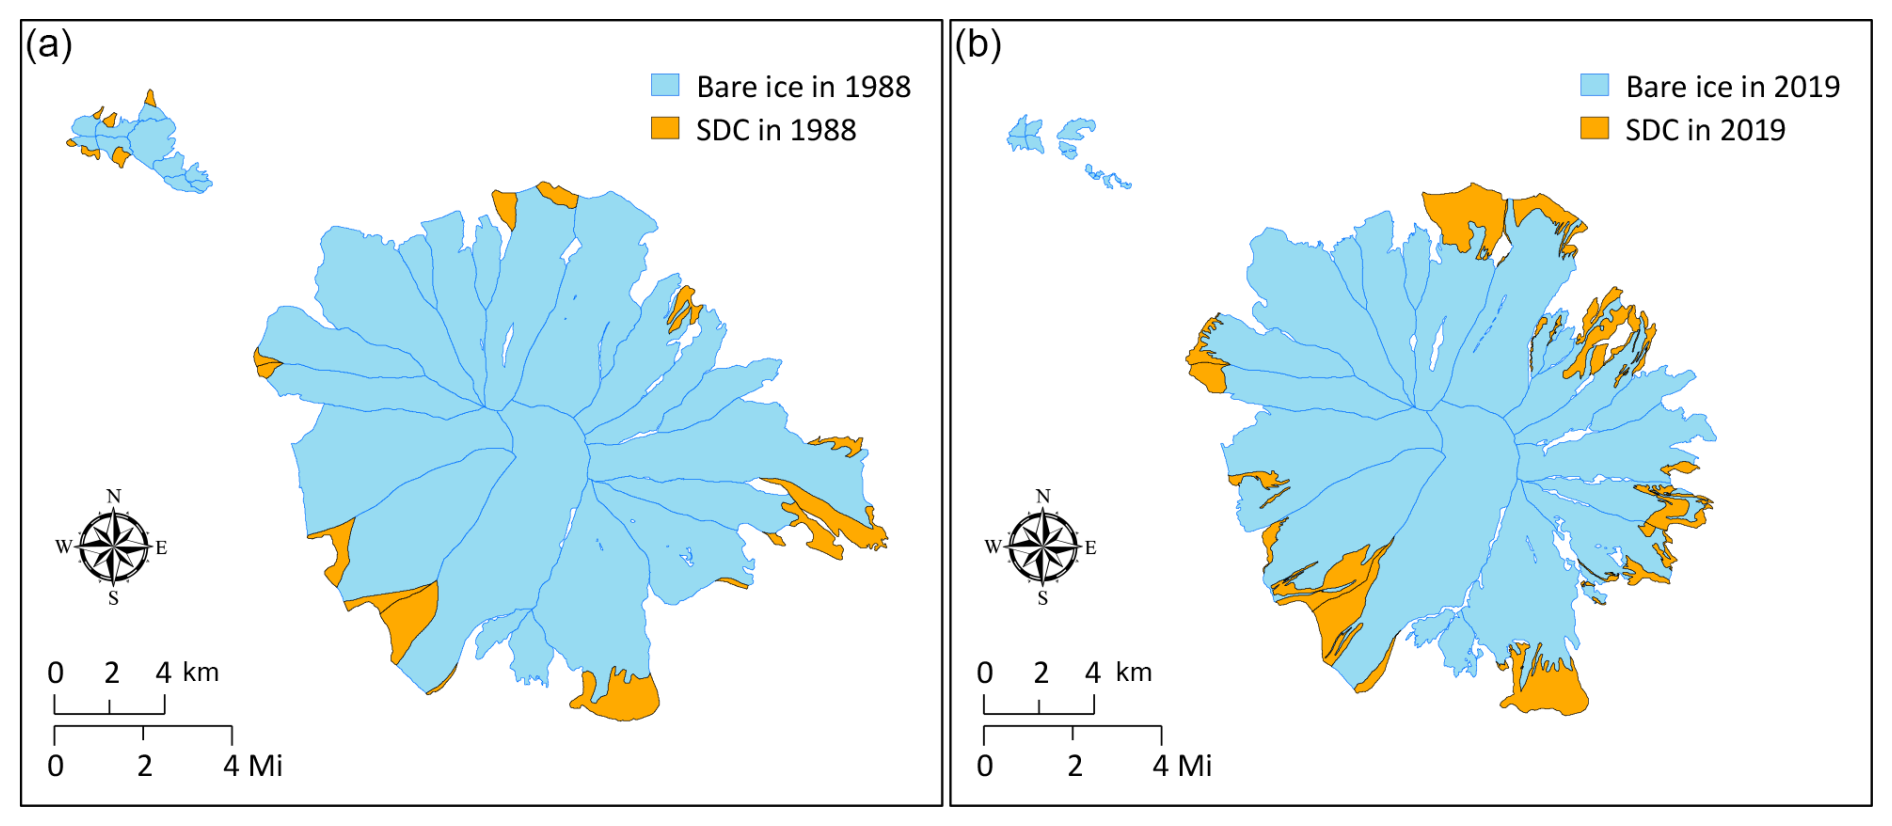
Figure 8Decrease in bare ice and increase in surface debris cover (SDC) on Heard Island glaciers between 1988 (a) and 2019 (b).
The mean upper limit (or maximum elevation) of the debris cover shifted from 285 ± 20 to 605 ± 20 m a.s.l. between 1988 and 2019 for all debris-covered glaciers on Heard Island. The mean elevation of debris-covered parts also moved upwards from 165 ± 20 to 410 ± 20 m a.s.l. during this time. Southwest-facing Gotley Glacier had the highest mean upper limit of surface debris cover with an elevation of 985 ± 20 m a.s.l. Glaciers at Laurens Peninsula had a small debris cover in 1988 but had become debris-free by 2019.
6.1 Glacier retreat and climate drivers
The relationship between climate and glacier changes in the Heard Island region must be considered cautiously because no local long-term weather station data are available. Instead, 2 m surface air temperatures from ERA5 reanalysis (Soci et al., 2024) (0.5°×0.5°) from a region encompassing Heard Island (50–53° S, 70–73° E) were investigated between 1947 and 2019 (Fig. 9). Comparisons between the first (1947–1959) and last (2009–2019) decades show summer temperatures (NDJFM) increase by 0.7 °C, which is consistent with Thost and Truffer (2008), who observed 0.8 °C increase in the summer temperatures between the 1948–1955 and 1997–2005 epochs. As shown in Fig. 9, a warming trend of the mean annual summer temperatures and temperature anomalies relative to the long-term mean, specifically from the 1980s, also aligns with higher glacier retreat over the second investigated period, from the 1990s onwards.
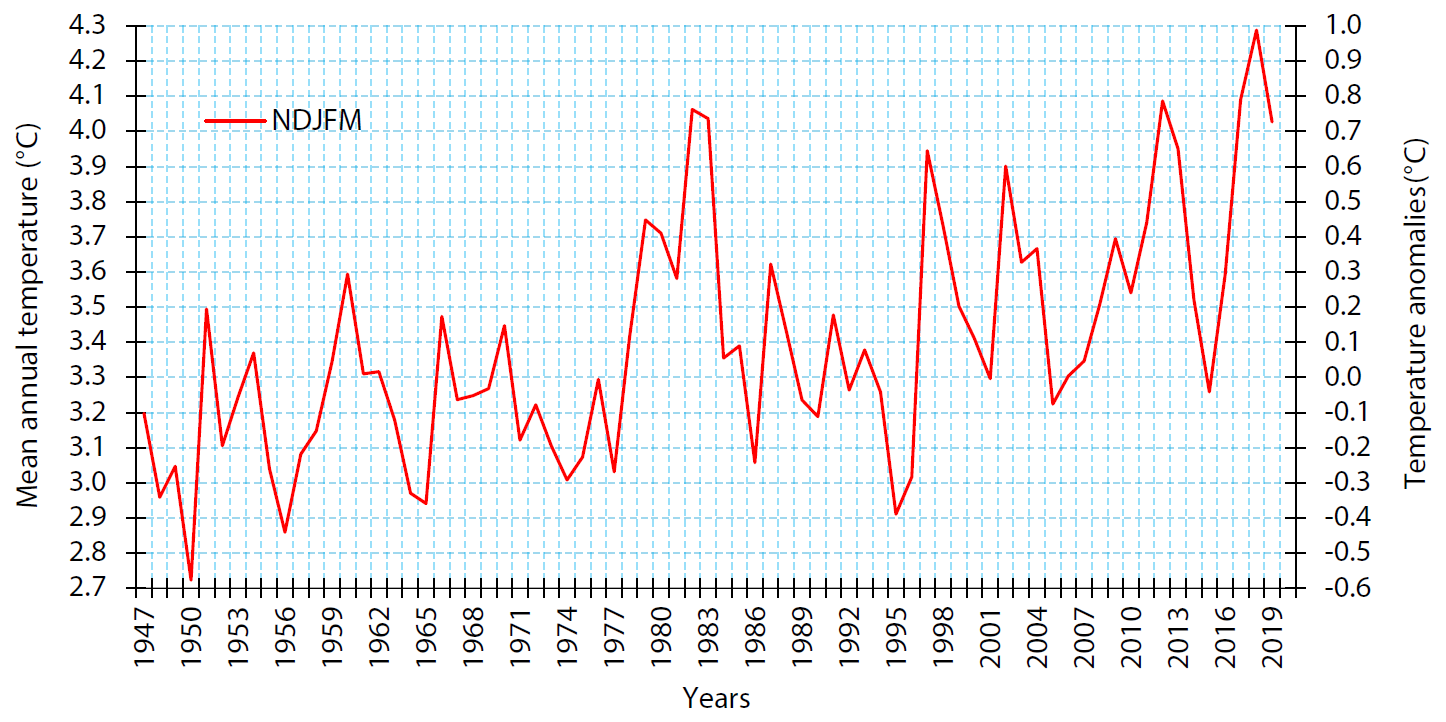
Figure 9Mean annual warm season (NDJFM) temperatures and monthly air temperature anomalies (°C) for Heard Island between 1947–2019. Both values are based on the ERA5 2 m surface air temperature dataset.
Maritime glaciers such as those on Heard Island are particularly sensitive to air temperature changes (e.g. Anderson and Mackintosh, 2006; Davies et al., 2014). Warming causes the frequent precipitation to fall as rain at higher elevation rather than as snow. Higher temperatures also increase melt rates due to strong turbulent exchange in these windy environments (e.g. Anderson et al., 2010; Anderson and Mackintosh, 2012). For these reasons, the observed summer temperature increases since the 1980s are likely an important driver of ongoing glacier recession on Heard Island. However, few direct precipitation and mass balance measurements exist for Heard Island (Thost and Truffer, 2008), and Favier et al. (2016) showed that retreat of the Cook Ice Cap on the relatively nearby Kerguelen Islands is likely due to atmospheric drying since the 1960s rather than atmospheric warming. Further observations and modelling are required to increase confidence in our interpretation that climate warming was largely responsible for driving recent glacier retreat on Heard Island.
Our new glacier inventories indicate that Heard Island glaciers experienced higher area loss between 1988 and 2019. This finding is supported by satellite-based geodetic mass balance estimates for all Heard Island glaciers extracted from the global study of Hugonnet et al. (2021) (Fig. 10). Negative mass balance values between the 1990s and 2019, derived from a mixed method that incorporates in situ observations (Dussaillant et al., 2025), also align with higher glacier area loss from the 1990s onwards. A positive geodetic mass balance trend between 1976 and the 1990s (Dussaillant et al., 2025), perhaps due to a serious of relatively cooler years (Fig. 9), contrasts with our observed glacier area reduction during the same period. This mismatch (Fig. 10) could be for several reasons: it might be because the glacier response is lagged and is responding to earlier warming, or it could be a function of data limitations. This includes a lack of direct mass balance observations to constrain the estimates of Dussaillant et al. (2025) and limited instrumental meteorological observation in this remote region to support the ERA5 dataset.
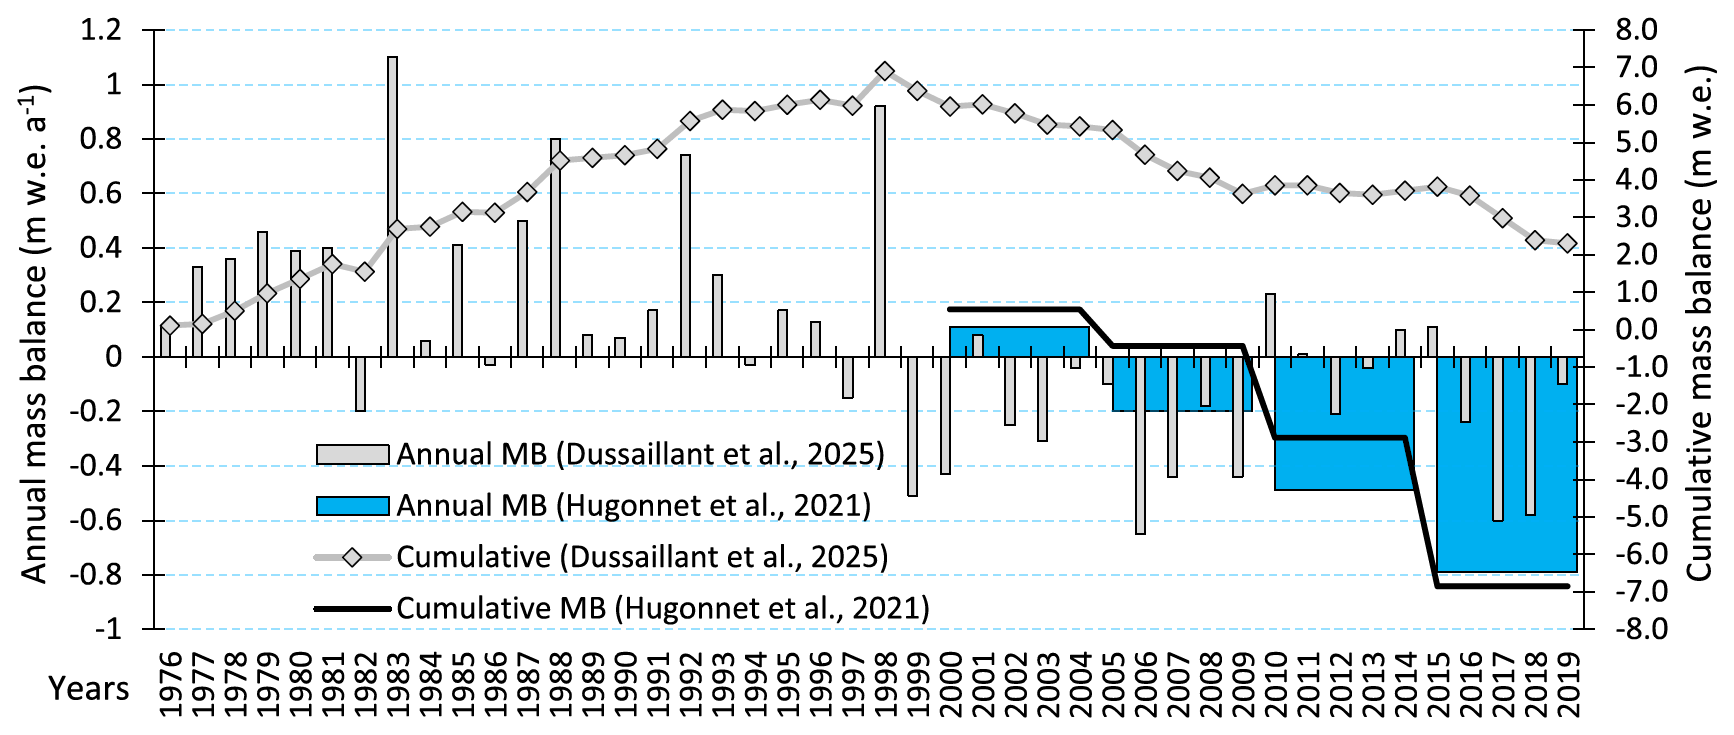
Figure 10Mean annual geodetic mass balance (MB; ) and cumulative mass balance (m w.e.) for all Heard Island glaciers between 2000–2019 (Hugonnet et al., 2021) (averaged within a rolling window of 5 years) and between 1976–2019 (Dussaillant et al., 2025).
The warming trend evident in ERA5 data in the Heard Island region (0.7 °C) is relatively small compared to the observed 1.1 °C warming for the neighbouring Kerguelen Island between 1951–2020 (Nel et al., 2023), but it is in agreement with the general Southern Ocean warming trend since the 1950s (Auger et al., 2021; Li et al., 2023). Atmospheric and ocean warming in this region is associated with a shift towards the positive phase of the Southern Annular Mode (Pohl et al., 2021), including an intensification and poleward shift in the Southern Hemisphere westerly winds (Perren et al., 2020). This shift has been attributed to the combined anthropogenic effects of increasing greenhouse gases and decreasing stratospheric ozone (e.g. Son et al., 2008).
Volcanic activity is another potential factor that could be contributing to the accelerated glacier melting on Heard Island. Glacier mass loss could also be a trigger for enhanced volcanism at Heard Island due to the decompression of the underlying magma chamber (e.g. Barr et al., 2018). Eruptions could cause significant melting of the ice or deposition of the thin layer of tephra, while increases in geothermal heat may lead to greater basal melting, thereby influencing glacier movement (Allison and Keage, 1986; Fox et al., 2021). Conversely, sufficiently thick deposition of tephra on the glacier surface might also decrease glacier mass loss (Kirkbride and Dugmore, 2003). However, given the lack of direct evidence in satellite images for unusual melt or tephra cover, as well as the fact that accelerated glacier melt occurred on all Heard Island glaciers and not just a subset and also on nearby Kerguelen Islands (Berthier et al., 2009; Deline et al., 2024), we consider that any volcanic drivers of glacier retreat have been less important than climatic ones during our observation period.
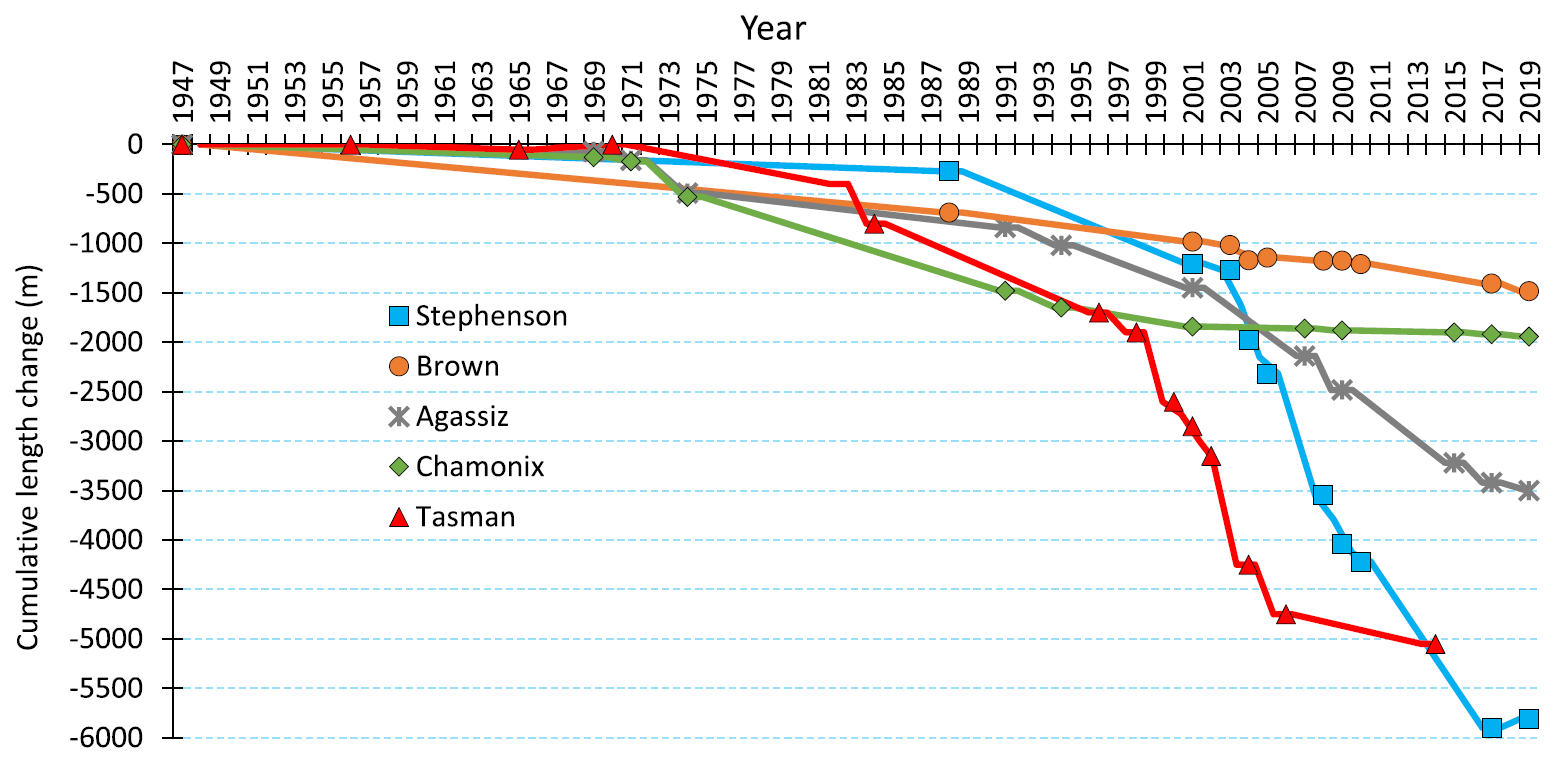
Figure 11Cumulative length changes between 1947–2019 for Brown and Stephenson glaciers (current study) compared to Agassiz and Chamonix glaciers on Kerguelen (Deline et al., 2024) and Tasman Glacier in New Zealand (Purdie et al., 2020; Mackintosh et al., 2017).
6.2 The role of aspect and glacier lake formation on glacier retreat
We observed that higher rates of glacier retreat occurred on the eastern side of the island (Fig. 4). Although climate data are sparse and a process-based modelling approach is required for further investigation, we expect this greater sensitivity of east-facing glaciers is due to orographic effects; satellite observations and limited climate station data show that the eastern side of the island, in the lee of the prevailing westerly winds, is less cloudy, is warmer, and receives less precipitation. This asymmetry has been noted in previous studies of Heard Island glaciers (e.g. Thost and Truffer, 2008) and is consistent with other islands in the sub-Antarctic region where strong westerly winds interact with mountain barriers. For example, Berthier et al. (2009) observed that the eastern part of Cook Ice Cap on Kerguelen shrank 2.5 times more (∼28 %) than the western part (∼11 %) between 1963 and 2003. Similar observations have been made in South Georgia, where glacier decrease on the east coast was higher than on the windy and wet southwest coast during the second half of the 20th century (Gordon et al., 2008).
A comparison with other glacier retreat records from the southern middle to high latitudes (Fig. 11) shows that lake formation is a key driver of accelerated glacier retreat. Brown Glacier on Heard Island initially experienced rapid retreat as a proglacial lake formed between 1947 and 1988; this is like Chamonix Glacier on Kerguelen which initially retreated in a lake but has been land-terminating for several decades subsequently. The retreat rate of these glaciers once they become land-terminating is relatively linear.
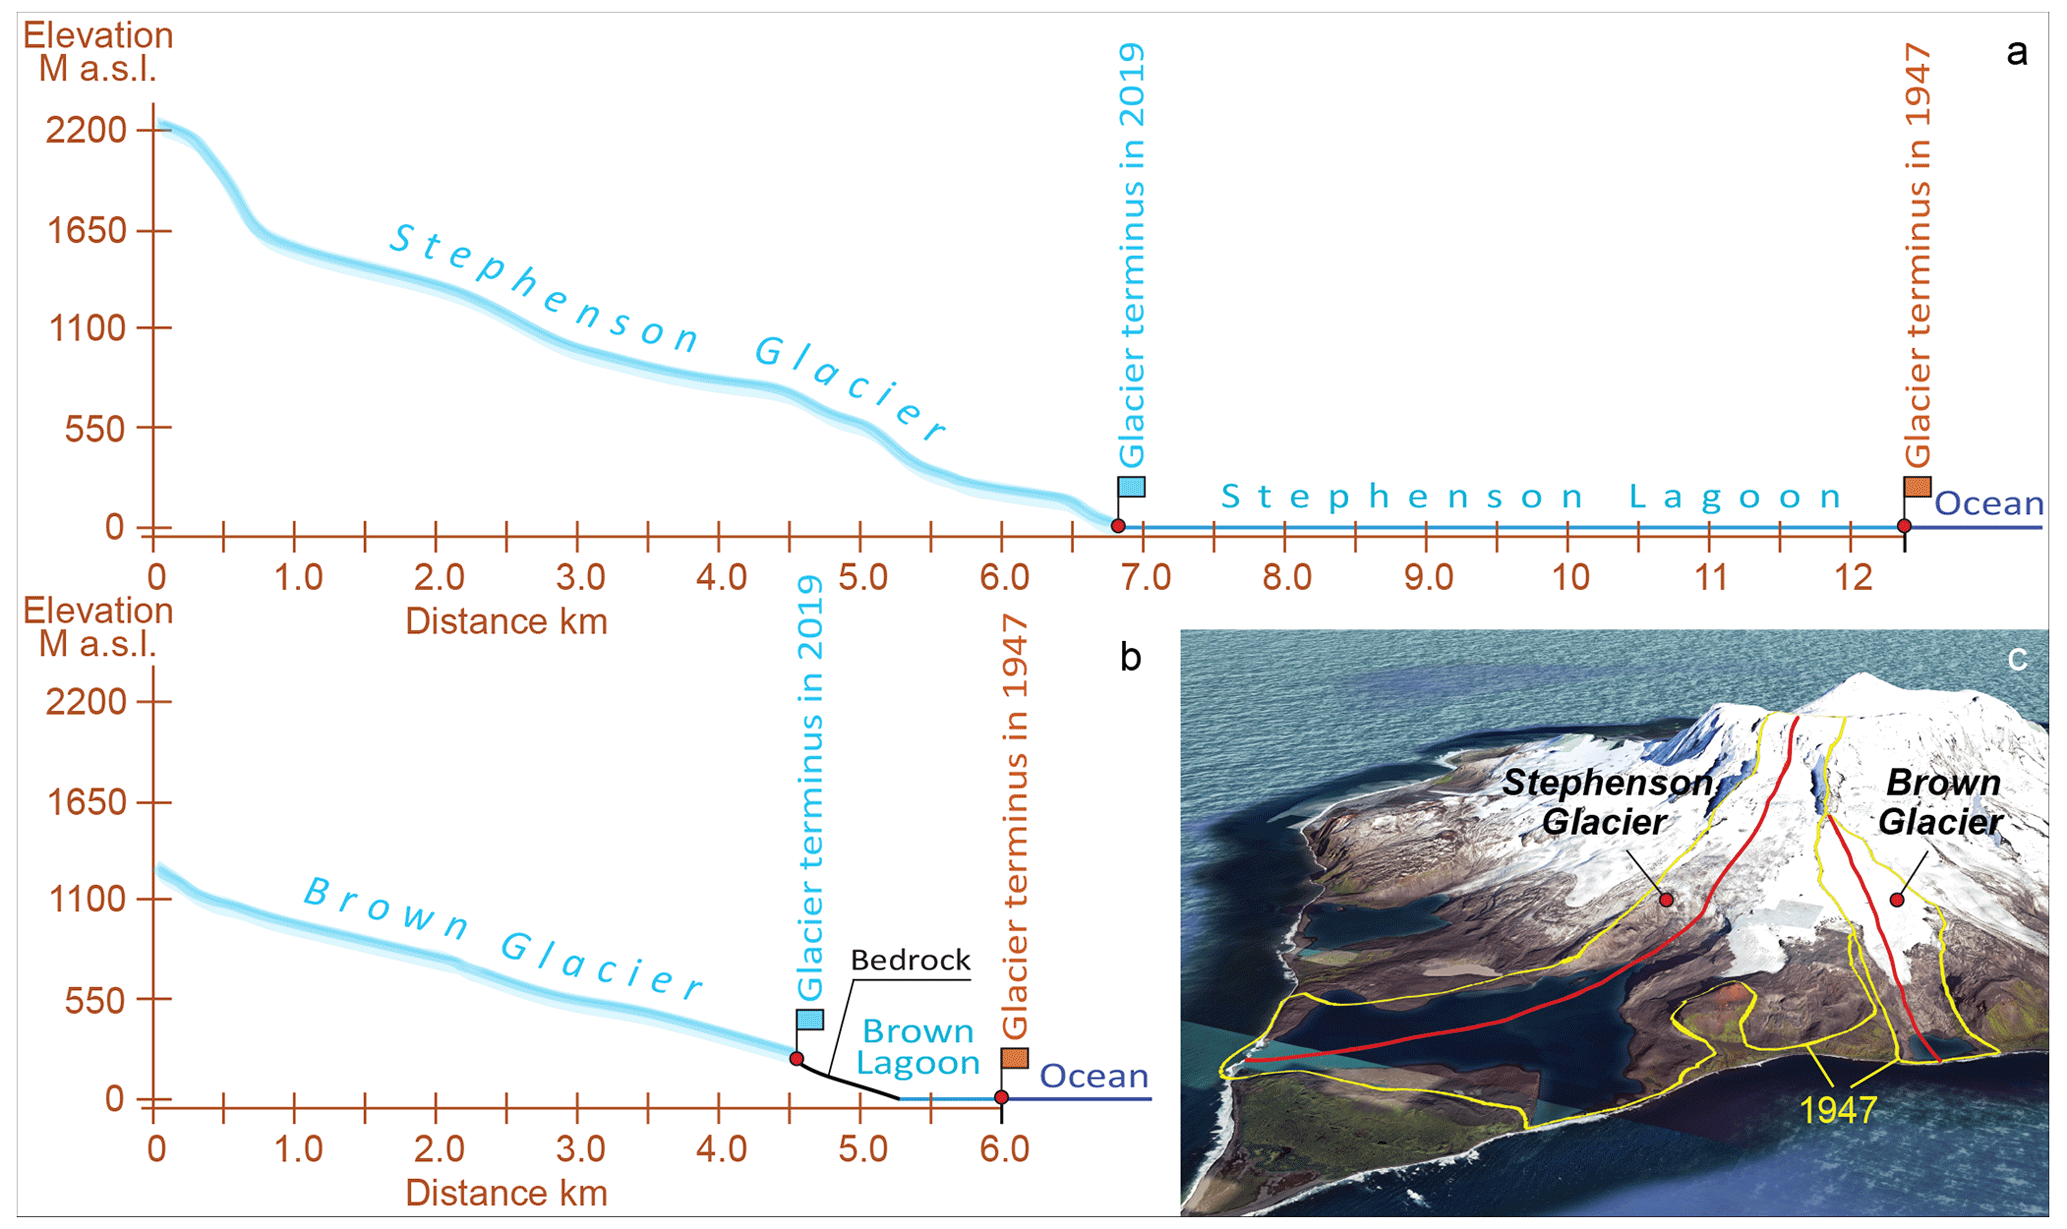
Figure 12Longitudinal profiles based on Pléiades DSM, 2019. (a) Stephenson Glacier. (b) Brown Glacier. (c) Longitudinal profile paths (in red) for both glaciers in 3D view (© Google Earth).
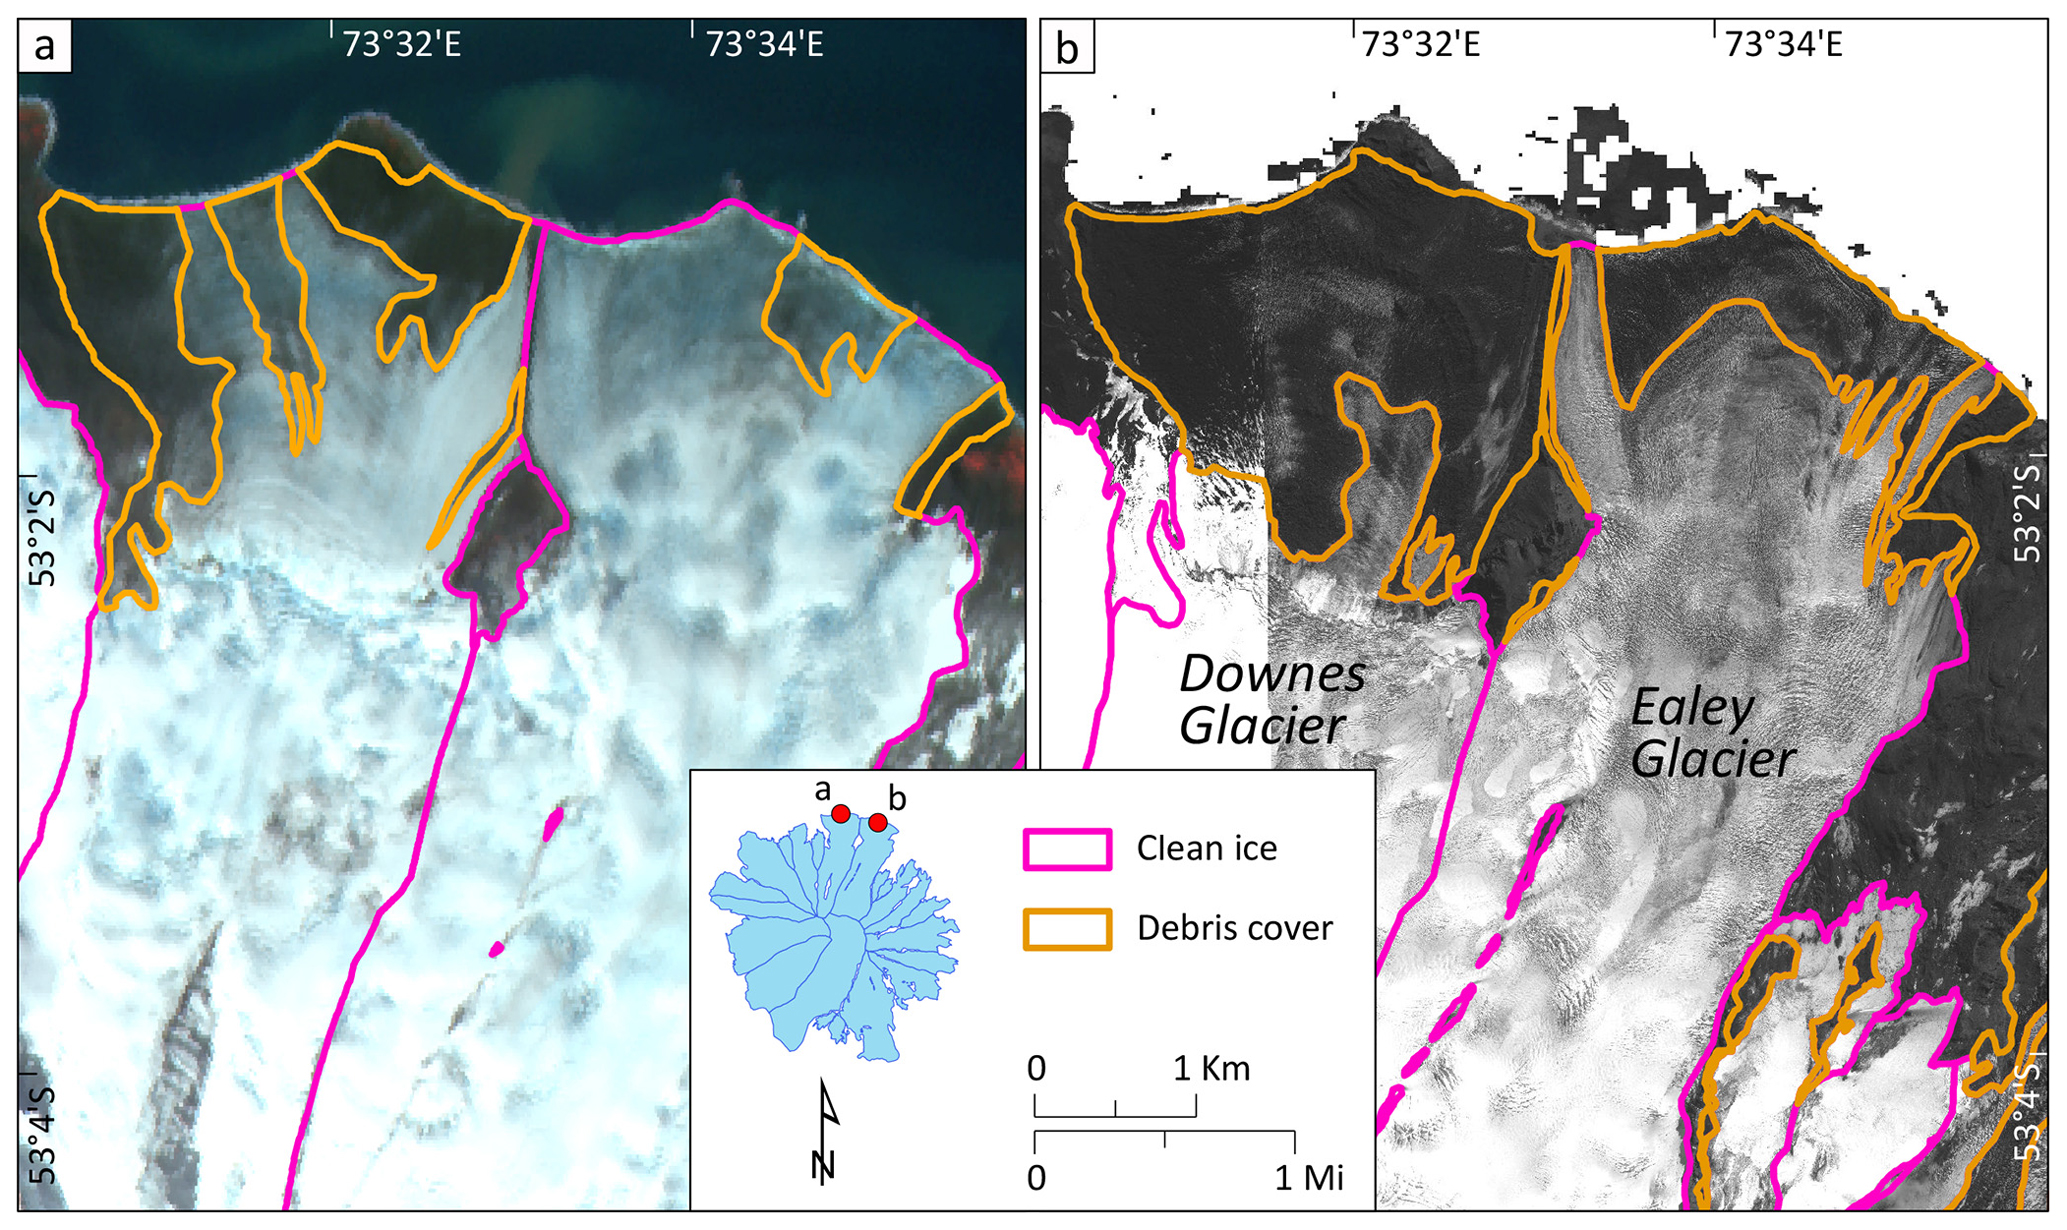
Figure 13The most heavily debris-covered Downes Glacier along with Ealey Glacier within Heard Island in (a) 1988 and (b) 2019. A SPOT_1 (9 January 1988) and a Pléiades (7 April 2019) ortho-image is used as a background. Insert map in the legend shows location of the selected glaciers relative to other glaciers.
In contrast, Stephenson Glacier on Heard Island is notable for its unprecedentedly high terminus retreat, particularly between 1988 and 2019 when the glacier retreated by almost 5.5 km compared to 0.8 km at Brown Glacier (Fig. 11). Lake formation at Stephenson Glacier was much later than at Brown, and once a proglacial lake did form it became extremely large. This is like the situation at Agassiz Glacier on Kerguelen which retreated into its proglacial lake more recently than Chamonix Glacier (Deline et al., 2024), as well as Tasman Glacier in New Zealand which retreated more than 4.5 km in its proglacial lake over recent decades (Mackintosh et al., 2017; Purdie et al., 2020).
The retreat of Stephenson Glacier warrants further discussion. In the 1950s, the glacier had a steep and small accumulation area relative to its long (∼5.5 km) and low-angle terminus compared to its counterparts. A significant portion of that tongue was located near sea level (Fig. 12). This is due to the subtle and flatter topography of the eastern lower part of Heard Island (see also Fig. 1c). This steep and small accumulation area, low-angle terminus, relatively high ablation rates at sea level, melting by seawater, and mechanical calving by tidal action (Truffer and Motyka, 2016) likely made the glacier more susceptible to warming. Once lagoon formation initiated, the high retreat rate of the Stephenson Glacier was enhanced by calving as the glacier retreated into its overdeepened basin. We also note that despite recent efforts to quantify water properties in similar environments (Mortensen et al., 2013; Straneo and Cenedese, 2015), rates of subaqueous melting for Heard Island glaciers along with the water properties of the associated lagoons are largely unknown and require further investigation.
6.3 Evolution of surface debris cover in 1988–2019
It is widely observed that in glacio-volcanic regions, volcanic eruptions regularly deposit tephra onto adjacent glaciers (Nield et al., 2013). These deposits into the ice system produce a significant component of the surface debris on these ice masses (Kirkbride and Dugmore, 2003). Ash–ice interactions can significantly modulate glacial mass balance responses to climatic changes, affecting glaciers for decades following eruptions (e.g. Richardson and Brook, 2010; Rivera et al., 2012). Given Heard Island's glacio-volcanic nature, we consider both rockfall and tephra deposition, or a combination, as possible debris cover sources.
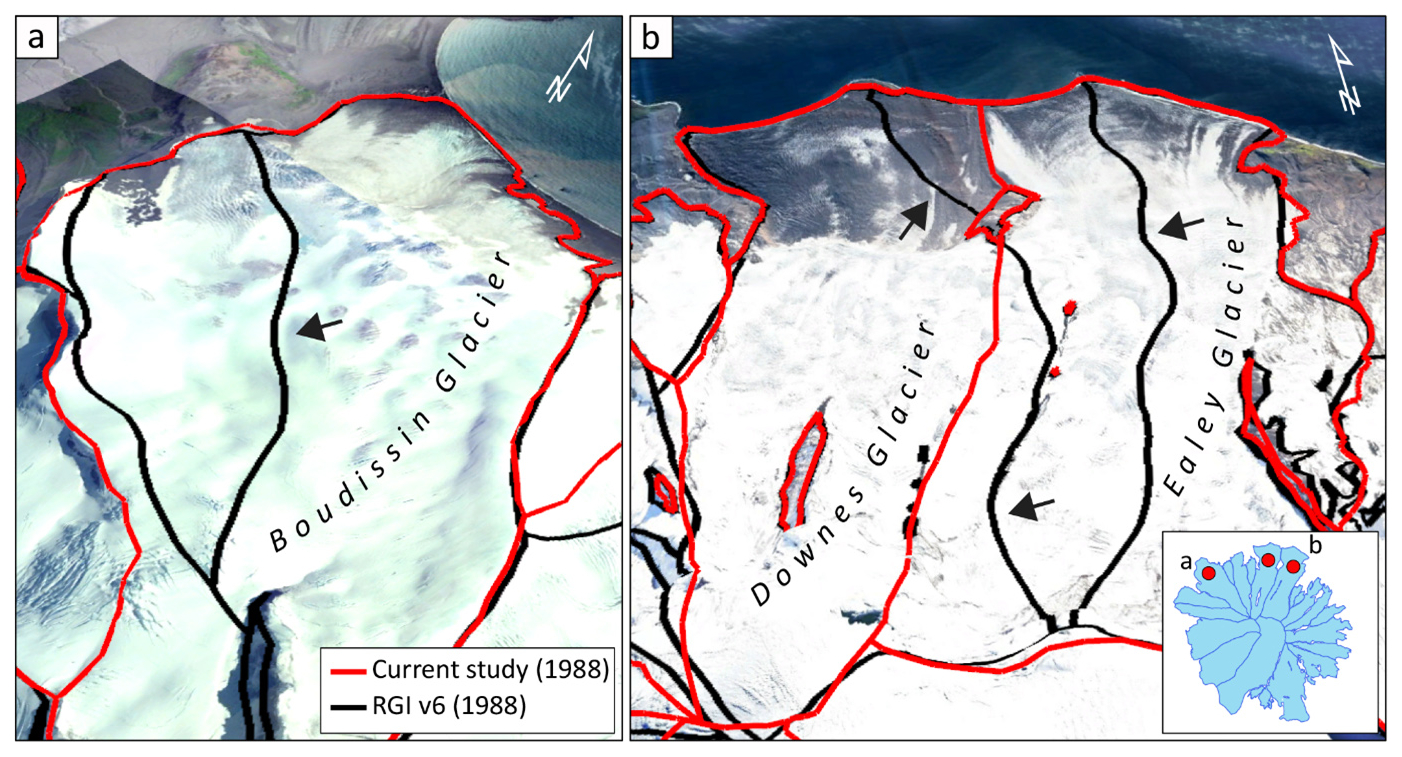
Figure 14Comparison of RGI v6–v7 (Pfeffer et al., 2014; Maussion et al., 2023) and our study for the Boudissin Glacier (a) and Downes and Ealey glaciers (b). Black arrows show inaccurate ice margins in RGI v6–v7 (due to misidentification of ice divides).
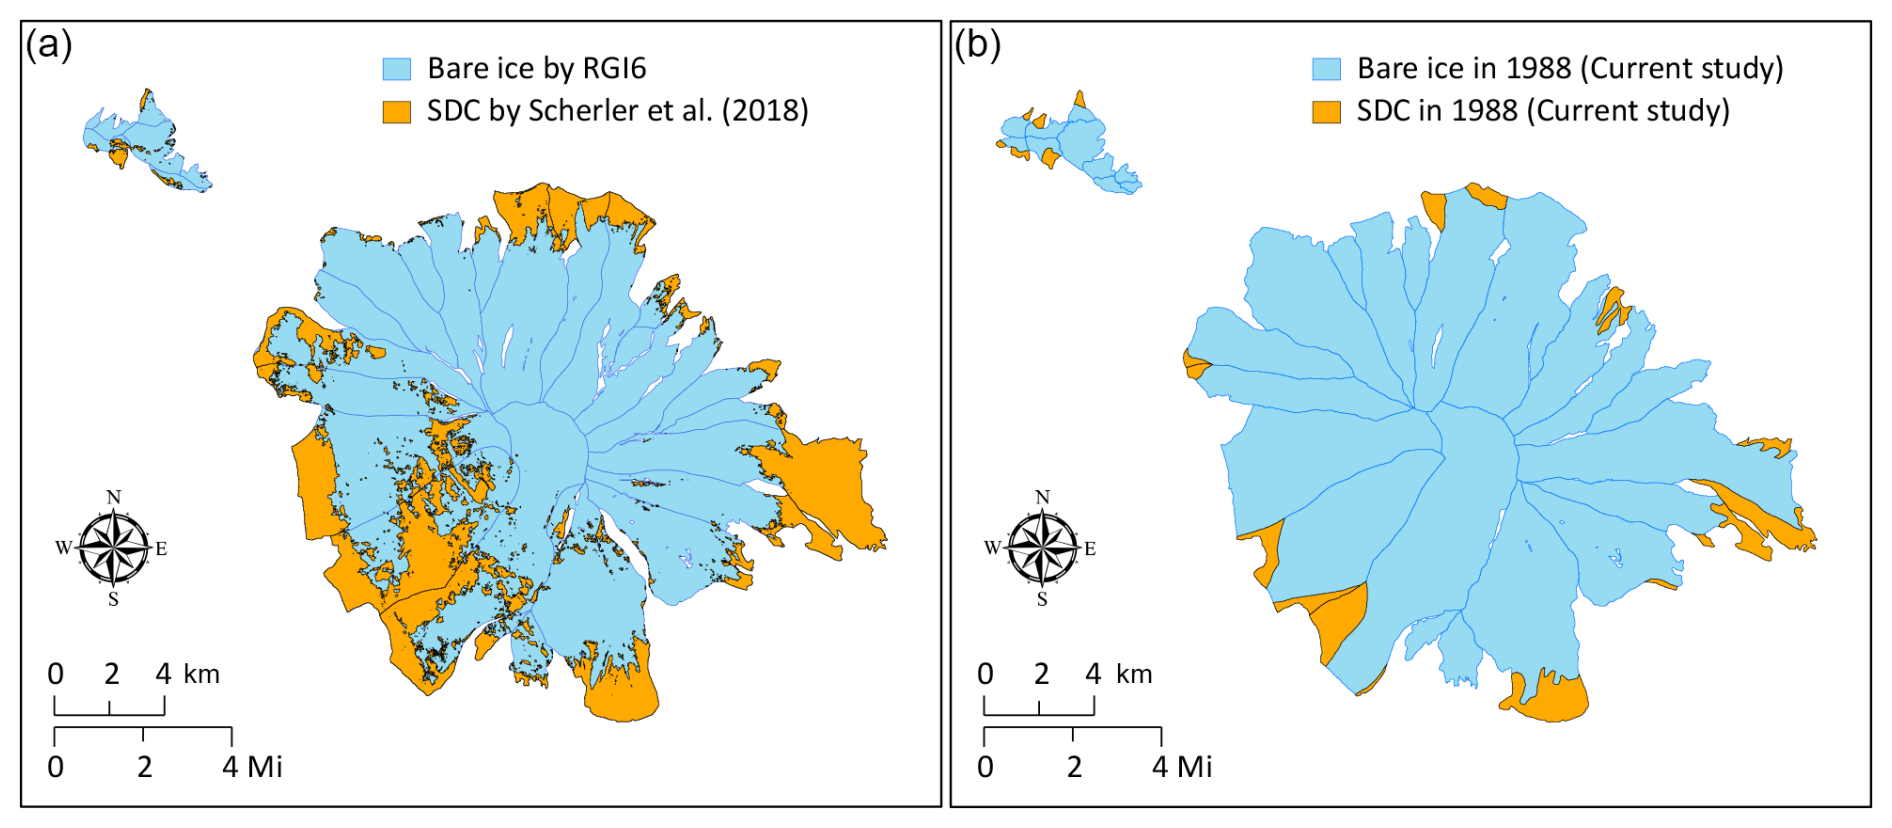
Figure 15(a) Extracted surface debris cover (SDC) data from Scherler et al. (2018). Glacier outlines from RGI v6 from 1988. (b) SDC from our study from 1988.
Despite an overall increase since 1988, surface debris has varied between individual glaciers and some glaciers have contradicted the overall trend; e.g. a substantial amount of surface debris cover was found on Stephenson Glacier in 1988 (∼14 %), mainly near the terminus, which had almost disappeared by 2019 (∼2.9 %). This could be because the glacier still had a low-angle tongue in 1988 that was favourable for debris accumulation (e.g. Mölg et al., 2019), but then this debris-laden ice subsequently calved into the lake.
The most significant increase in surface debris cover was observed on northeast-facing Downes Glacier from ∼9.8 % in 1988 to ∼31.6 % in 2019, while the total area of this glacier has only reduced by ∼4.3 % during the same period (Figs. 4 and 8). It is not clear what drove this increase (Fig. 13). However, as our debris cover trends are derived from only two satellite images, the differences in debris-covered area might only be related to different snow conditions rather than a real increase (e.g. if the snow line in 1988 was lower). More investigation is needed as there is no obvious process that can account for the observed development of surface debris cover at Downes Glacier relative to other glaciers on Heard Island.
6.4 Comparison with previous studies
The GLIMS book (Kargel et al., 2014) estimated 29 glaciers on Heard Island with a cumulative area of 257 km2 based on SPOT imagery from 1988 (Cogley et al., 2014), while the Randolph Glacier Inventory (RGI v6 and v7) database identifies 31 glaciers with a total area of 254.4 km2 (Pfeffer et al., 2014; Maussion et al., 2023) based on the same SPOT imagery from 1988. Both estimates fit within the uncertainty of our assessment of 260.3 ± 6.3 km2 in 1988. However, glaciers in RGI v6 and v7 databases are characterized by inaccurate ice margins (due to misidentification of ice divides), which have been rectified in our inventory (Fig. 14).
A global assessment of surface debris cover by Scherler et al. (2018) uses residual between RGI v6 outlines (which include manually mapped debris cover) and an automatically digitized clean ice map. We extracted these outlines from Scherler et al. (2018) for our glacier sample from 1988 to compare results (Fig. 15). We found that Scherler et al. (2018) reported a much higher percentage (25.2 %) of surface debris cover for Heard Island than our study (7.0 %) in 1988. This does not even fit within our uncertainty (±6.0 %). These differences are probably explained by the automatized method of global assessment of clean ice by Scherler et al. (2018); e.g. common problems in ice-cover mapping from optical imagery are related to shadows as well as cloud and snow cover and manual corrections are required (e.g. Paul et al., 2013), while our approach only uses accurate manual digitization.
We present a multi-year glacier inventory based on historic topographical maps, high- and very high-resolution satellite imagery, and digital elevation/surface models. Our findings show that glaciers on Heard Island experienced significant area loss (22 % or −0.31 % yr−1) over the 72-year period between 1947–2009, from 289.4 ± 6.1 km2 to 225.7 ± 4.2 km2 with an increasing rate of ice loss in recent decades. Our study also shows that the small and low-elevation glaciers at Laurens Peninsula have experienced the highest recession rates of −1.1 % yr−1 over the last 72 years.
We observed much higher glacier area decrease and terminus retreat on the east and southeast side of Heard Island. We suggest that this difference results from topographic influences on the island's climate as well as its glaciers; orographic processes lead to a warmer and drier climate on the eastern side of the island, and the low-angle glacier termini are more susceptible to lake calving. Stephenson Glacier is an exemplar of this behaviour. Surface debris cover has also increased on most Heard Island glaciers.
Our new glacier inventory for Heard Island tracks changes in glacier extent, providing insights into the impact of climate change in this remote and sensitive region. Further work is required to test some of the ideas we have put forward in this paper regarding the different roles of climatic and non-climatic factors in driving ice retreat. The new inventory will also help us to better understand how changes in glaciers affect biodiversity and ecosystems, which will inform conservation and management efforts at this World Heritage site.
Glacier outlines are available online at GLIMS (https://doi.org/10.7265/N5V98602, GLIMS Consortium, 2005) and can be used for future studies.
Heard Island Glacier Inventory includes satellite image screenshots (Landsat 7 ETM+ panchromatic bands) for the Stephenson Glacier terminus between 2001 and 2010, as well as animated changes in Stephenson Glacier in 3D, from 1947 to 2019. The supplement related to this article is available online at https://doi.org/10.5194/tc-19-2677-2025-supplement.
LGT and ANM designed the conceptual framework for the study. LGT mapped the glacier outlines and led the scientific interpretation and writing, with contributions from ANM and WY.
The contact author has declared that none of the authors has any competing interests.
Publisher's note: Copernicus Publications remains neutral with regard to jurisdictional claims made in the text, published maps, institutional affiliations, or any other geographical representation in this paper. While Copernicus Publications makes every effort to include appropriate place names, the final responsibility lies with the authors.
Medium-resolution SPOT and high-resolution Pléiades images acquired by the French Space Agency's (CNES) Spot World Heritage Programme and Pléiades Glacier Observatory. We are very grateful to Etienne Berthier for his help in obtaining the satellite images. We gratefully acknowledge the support of the editor, Caroline Clason. We would also like to thank Frank Paul and the anonymous reviewer for their thoughtful and constructive comments, which clearly improved the manuscript.
This research has been supported by the Australian Research Council (ARC) Special Research Initiative (SRI) Securing Antarctica's Environmental Future (grant no. SR200100005).
This paper was edited by Caroline Clason and reviewed by Frank Paul and one anonymous referee.
Allison, I. and Thost, D. E.: Heard Island glacier fluctuations and climatic change, Australian Antarctic Data Centre, https://data.aad.gov.au/metadata/records/ASAC_1158 (last access: January 2025), 2000.
Allison, I. F.: A preliminary investigation of the physical characteristics of the Vahsel Glacier, Heard Island, ANARE Scientific Reports Series A(4), Glaciology, Publication 128, Australian Government Publishing Service, Canberra, https://nla.gov.au/anbd.bib-an000066473398 (last access: December 2024), 1980.
Allison, I. F. and Keage, P. L.: Recent changes in the glaciers of Heard Island, Polar Rec., 23, 255–272, https://doi.org/10.1017/S0032247400007099, 1986.
Anderson, B. and Mackintosh, A.: Temperature change is the major driver of late-glacial and Holocene glacier fluctuations in New Zealand, Geology, 34, 121–124, https://doi.org/10.1130/G22151.1, 2006.
Anderson, B. and Mackintosh, A.: Controls on mass balance sensitivity of maritime glaciers in the Southern Alps, New Zealand: The role of debris cover, J. Geophys. Res., 117, F01003, https://doi.org/10.1029/2011JF002064, 2012.
Anderson, B., Mackintosh, A., Stumm, D., George, L., Kerr, T., Winter-Billington, A., and Fitzsimons, S.: Climate sensitivity of a high-precipitation glacier in New Zealand, J. Glaciol., 56, 114–128, https://doi.org/10.3189/002214310791190929, 2010.
Aubert de la Rue, E.: Un Voyage d'exploration dans les mers Australes. Iles Heard, Archipel de Kerguelen, ile St. Paul, Rev. Geogr. Phys. Geol., 11, 97–146, 1929.
Auger, M., Morrow, R., Kestenare, E., Sallée, J.-B., and Cowley, R.: Southern Ocean in-situ temperature trends over 25 years emerge from interannual variability, Nat. Commun., 12, 514, https://doi.org/10.1038/s41467-020-20781-1, 2021.
Barr, I. D., Lynch, C. M., Mullan, D., De Siena, L., and Spagnolo, M.: Volcanic impacts on modern glaciers: A global synthesis, Earth-Sci. Rev., 182, 0012-8252, https://doi.org/10.1016/j.earscirev.2018.04.008, 2018.
Berthier, E., Le Bris, R., Mabileau, L., Testut, L., and Rémy, F.: Ice wastage on the Kerguelen Islands (49° S, 69° E) between 1963 and 2006, J. Geophys. Res., 114, F03005, https://doi.org/10.1029/2008JF001192, 2009.
Berthier, E., Lebreton, J., Fontannaz, D., Hosford, S., Belart, J. M.-C., Brun, F., Andreassen, L. M., Menounos, B., and Blondel, C.: The Pléiades Glacier Observatory: high-resolution digital elevation models and ortho-imagery to monitor glacier change, The Cryosphere, 18, 5551–5571, https://doi.org/10.5194/tc-18-5551-2024, 2024.
Bhambri, R., Bolch, T., Chaujar, R. K., and Kulshreshtha, S. C.: Glacier changes in the Garhwal Himalaya, India, from 1968 to 2006 based on remote sensing, J. Glaciol., 57, 543–556, https://doi.org/10.3189/002214311796905604, 2011.
Bolch, T., Menounos, B., and Wheate, R.: Landsat-based inventory of glaciers in western Canada, 1985–2005, Remote Sens. Environ., 114, 127–137, https://doi.org/10.1016/j.rse.2009.08.015, 2010.
Bosson, J. B., Huss, M., Cauvy-Fraunié, S., Clément, J. C., Costes, G., Fischer, M., Poulenard, J., and Arthaud, F.: Future emergence of new ecosystems caused by glacial retreat, Nature, 620, 562–569, https://doi.org/10.1038/s41586-023-06302-2, 2023.
Budd, G. M.: Heard Island Expedition, 1963, Polar Rec., 12, 193–195, https://doi.org/10.1017/S0032247400054619, 1964.
Budd, G. M.: Heard Island Reconnaissance, 1969, Polar Rec., 15, 335–336, https://doi.org/10.1017/S0032247400061131, 1970.
Budd, G. M.: Changes in Heard Island glaciers, king penguins and fur seals since 1947, Papers and Proceedings of the Royal Society of Tasmania, 133, 47–60, https://doi.org/10.26749/rstpp.133.2.47, 2000.
Budd, G. M. and Stephenson, P. J.: Recent glacier retreat on Heard Island, in: Proceedings of the International Symposium on Antarctic Glaciological Exploration, edited by: Gow, A. J. and others, Hanover NH, 1968, 449–458, IAHS Publication 86, 1970.
Burgess, D. O. and Sharp, M. J.: Recent Changes in Areal Extent of the Devon Ice Cap, Nunavut, Canada, Arct. Antarct. Alp. Res., 36, 261–271, https://doi.org/10.1657/1523-0430(2004)036[0261:RCIAEO]2.0.CO;2, 2004.
Cogley, J. G., Berthier, E., and Donoghue, S.: Remote Sensing of Glaciers of the Subantarctic Islands, in: Global Land Ice Measurements from Space, edited by: Kargel, J., Leonard, G., Bishop, M., Kääb, A., and Raup, B., Springer Praxis Books, Springer, Berlin, Heidelberg, https://doi.org/10.1007/978-3-540-79818-7_32, 2014.
Davies, B., Golledge, N., Glasser, N., Carrivick, J. L., Ligtenberg, S. R. M., Barrand, N. E., van den Broeke, M. R., Hambrey, M. J., and Smellie, J. L.: Modelled glacier response to centennial temperature and precipitation trends on the Antarctic Peninsula, Nat. Clim. Change, 4, 993–998, https://doi.org/10.1038/nclimate2369, 2014.
DeBeer, C. M. and Sharp, M. J.: Recent changes in glacier area and volume within the southern Canadian Cordillera, Ann. Glaciol., 46, 215–221, https://doi.org/10.3189/172756407782871710, 2007.
Dehecq, A., Gourmelen, N., Gardner, A. S., Brun, F., Goldberg, D., Nienow, P. W., Berthier, E., Vincent, C., Wagnon, P., and Trouvé, E.: Twenty-first century glacier slowdown driven by mass loss in High Mountain Asia, Nat. Geosci., 12, 22–27, https://doi.org/10.1038/s41561-018-0271-9, 2019.
Deline, P., Linge, H., Ravanel, L., Tuestad, T., Lafite, R., Arnaud, F., and Bakke, J.: Mapping of morainic complexes and reconstruction of glacier dynamics north-east of Cook Ice Cap, Kerguelen Archipelago (49° S), Antarct. Sci., 36, 75–100, https://doi.org/10.1017/S0954102023000378, 2024.
Division of National Mapping: Topographic map of Heard Island. Scale 1:50 000. MAP G9182.H4. Produced by the Division of National Mapping, Dept. of National Development, https://nla.gov.au/nla.obj-2545184819 (last access: January 2025), 1964.
Dussaillant, I., Hugonnet, R., Huss, M., Berthier, E., Bannwart, J., Paul, F., and Zemp, M.: Annual mass change of the world's glaciers from 1976 to 2024 by temporal downscaling of satellite data with in situ observations, Earth Syst. Sci. Data, 17, 1977–2006, https://doi.org/10.5194/essd-17-1977-2025, 2025.
Eis, J., van der Laan, L., Maussion, F., and Marzeion, B.: Reconstruction of Past Glacier Changes with an Ice-Flow Glacier Model: Proof of Concept and Validation, Front. Earth Sci., 9, 595755, https://doi.org/10.3389/feart.2021.595755, 2021.
Farinotti, D., Huss, M., Fürst, J. J. Landmann, J., Machguth, H., Maussion, F., and Pandit, A.: A consensus estimate for the ice thickness distribution of all glaciers on Earth, Nat. Geosci., 12, 168–173, https://doi.org/10.1038/s41561-019-0300-3, 2019.
Favier, V., Verfaillie, D., Berthier, E., Menegoz, M., Jomelli, V., Kay, J. E., Ducret, L., Malbéteau, Y., Brunstein, D., Gallée, H., Park, Y. H., and Rinterknecht, V.: Atmospheric drying as the main driver of dramatic glacier wastage in the southern Indian Ocean, Sci. Rep.-UK, 6, 32396, https://doi.org/10.1038/srep32396, 2016.
Fox, J. M., McPhie, J., Carey, R. J., Jourdan, F., and Miggins, D. P.: Construction of an intraplate island volcano: The volcanic history of Heard Island, B. Volcanol., 83, 37, https://doi.org/10.1007/s00445-021-01452-5, 2021.
Freudiger, D., Mennekes, D., Seibert, J., and Weiler, M.: Historical glacier outlines from digitized topographic maps of the Swiss Alps, Earth Syst. Sci. Data, 10, 805–814, https://doi.org/10.5194/essd-10-805-2018, 2018.
GlaMBIE Team: Community estimate of global glacier mass changes from 2000 to 2023, Nature, 639, 382–388, https://doi.org/10.1038/s41586-024-08545-z, 2025.
GLIMS Consortium: GLIMS Glacier Database, NASA National Snow and Ice Data Center Distributed Active Archive Center [data set], https://doi.org/10.7265/N5V98602, 2005.
Gordon, J. E., Haynes, V. M., and Hubbard, A.: Recent glacier changes and climate trends on South Georgia, Global Planet. Change, 60, 72–84, https://doi.org/10.1016/j.gloplacha.2006.07.037, 2008.
Granshaw, F. D. and Fountain, A. G.: Glacier change (1958–1998) in the North Cascades National Park Complex, Washington, USA, J. Glaciol., 52, 251–256, https://doi.org/10.3189/172756506781828782, 2006.
Haeberli, W. and Hoelzle, M.: Application of inventory data for estimating characteristics of and regional climate-change effects on mountain glaciers: a pilot study with the European Alps, Ann. Glaciol., 21, 206–212, https://doi.org/10.3189/S0260305500015834, 1995.
Hall, D. K., Bayr, K. J., Schöner, W., Bindschadler, R. A., and Chien, J. Y. L.: Consideration of the errors inherent in mapping historical glacier positions in Austria from the ground and space (1893–2001), Remote. Sens. Environ., 86, 566–577, https://doi.org/10.1016/S0034-4257(03)00134-2, 2003.
HIMI (Heard Island and McDonald Islands) Management Plan: Marine Reserve Management Plan 2014–2024, Dep. of the Env. Canberra, 22, http://heardisland.antarctica.gov.au/ (last access: January 2025), 2014.
HIMI (Heard Island and McDonald Islands) official website: https://www.antarctica.gov.au/antarctic-operations/stations/other-locations/heard-island/climate-and-weather/, last access: August 2024.
Hock, R., Rasul, G., Adler, C., Cáceres, B., Gruber, S., Hirabayashi, Y., Jackson, M., Kääb, A., Kang, S., Kutuzov, S., Milner, A., Molau, U., Morin, S., Orlove, B., and Steltzer, H.: High Mountain Areas, in: IPCC Special Report on the Ocean and Cryosphere in a Changing Climate, edited by: Pörtner, H. O., Roberts, D. C., Masson-Delmotte, V., Zhai, P., Tignor, M., Poloczanska, E., Mintenbeck, K., Alegría, A., Nicolai, M., Okem, A., Petzold, J., Rama, B., and Weyer, N. M., Intergovernmental Panel on Climate Change (IPCC), 131–198, https://www.ipcc.ch/srocc/chapter/chapter-2/ (last access: June 2025), 2019.
Hugonnet, R., McNabb, R., Berthier, E., Menounos, B., Nuth, C., Girod, L., Farinotti, D., Huss, M., Dussaillant, I., Brun, F., and Kääb, A.: Accelerated global glacier mass loss in the early twenty-first century, Nature, 592, 726–731, https://doi.org/10.1038/s41586-021-03436-z, 2021.
Huss, M. and Hock, R.: Global-scale hydrological response to future glacier mass loss, Nat. Clim. Change, 8, 135–140, https://doi.org/10.1038/s41558-017-0049-x, 2018.
Kargel, J. S., Leonard, G. J., Bishop, M. P., Kääb, A., and Raup, B. (Eds.): Global Land Ice Measurements from Space (Springer-Praxis), Springer Berlin, Heidelberg, 876 pp., https://doi.org/10.1007/978-3-540-79818-7, 2014.
Kiernan, K. and McConnell, A.: Glacier retreat and melt-lake expansion at Stephenson Glacier, Heard Island World Heritage Area, Polar Rec., 38, 297–308, https://doi.org/10.1017/S0032247400017988, 2002.
Kirkbride, M. P. and Dugmore, A. J.: Glaciological response to distaltephra fallout from the 1947 eruption of Hekla, south Iceland, J. Glaciol., 49, 420–428, https://doi.org/10.3189/172756503781830575, 2003.
Korneva, I. A., Toropov, P. A., Muraviev, A. Y., and Aleshina, M. A.: Climatic factors affecting Kamchatka glacier recession, Int. J. Climatol., 44, 345–369, https://doi.org/10.1002/joc.8328, 2024.
Lambeth, A. J.: Heard Island. Geography and glaciology, Journal and Proceedings of the Royal Society of New South Wales, 84, 92–98, https://doi.org/10.5962/p.360589, 1951.
Lea, J. M., Mair, D. W. F., and Rea, B. R.: Evaluation of existing and new methods of tracking glacier terminus change, J. Glaciol., 60, 323–332, https://doi.org/10.3189/2014JoG13J061, 2014.
Li, Z., England, M. H., and Groeskamp, S.: Recent acceleration in global ocean heat accumulation by mode and intermediate waters, Nat. Commun., 14, 6888, https://doi.org/10.1038/s41467-023-42468-z, 2023.
Mackintosh, A., Anderson, B., Lorrey, A., Renwick, J. A., Frei, P., and Dean, S. M.: Regional cooling caused recent New Zealand glacier advances in a period of global warming, Nat. Commun., 8, 14202, https://doi.org/10.1038/ncomms14202, 2017.
Maussion, F., Hock, R., Paul, F., Raup, B., Rastner, P., Zemp, M., Andreassen, L., Barr, I., Bolch, T., Kochtitzky, W., McNabb, R., and Tielidze, L.: The Randolph Glacier Inventory version 7.0 User guide v1.0, Zenodo, https://doi.org/10.5281/zenodo.8362857, 2023.
Mawson, D.: The B. A. N. Z. Antarctic Research Expedition 1929–31, Geogr. J., 80, 105–106, 1932.
Mawson, D.: Some Historical Features of the Discovery of Enderby Land and Kemp Land, Geogr. J. 86, 526–530, https://doi.org/10.2307/1786261, 1935.
Millan, R., Mouginot, J., Rabatel, A., and Morlighem, M.: Ice velocity and thickness of the world's glaciers, Nat. Geosci., 15, 124–129, https://doi.org/10.1038/s41561-021-00885-z, 2022.
Mölg, N., Bolch, T., Walter, A., and Vieli, A.: Unravelling the evolution of Zmuttgletscher and its debris cover since the end of the Little Ice Age, The Cryosphere, 13, 1889–1909, https://doi.org/10.5194/tc-13-1889-2019, 2019.
Mortensen, J., Bendtsen, J., Motyka, R. J., Lennert, K., Truffer, M., Fahnestock, M., and Rysgaard, S.: On the seasonal freshwater stratification in the proximity of fast-flowing tidewater outlet glaciers in a sub-Arctic sill fjord, J. Geophys. Res.-Oceans, 118, 1382–1395, https://doi.org/10.1002/jgrc.20134, 2013.
Nagai, H., Fujita, K., Sakai, A., Nuimura, T., and Tadono, T.: Comparison of multiple glacier inventories with a new inventory derived from high-resolution ALOS imagery in the Bhutan Himalaya, The Cryosphere, 10, 65–85, https://doi.org/10.5194/tc-10-65-2016, 2016.
Nel, W., Hedding, D. W., and Rudolph, E. M.: The sub-Antarctic islands are increasingly warming in the 21st century, Antarct. Sci., 35, 124–126, https://doi.org/10.1017/S0954102023000056, 2023.
Nield, J. M., Chiverrell, R. C., Darby, S. E., Leyland, J., Vircavs, L. H., and Jacobs, B.: Complex spatial feedbacks of tephra redistribution, ice melt and surface roughness modulate ablation on tephra covered glaciers, Earth Surf. Proc. Land., 38, 95–102, https://doi.org/10.1002/esp.3352, 2013.
Paul, F., Barrand, N. E., Baumann, S., Berthier, E., Bolch, T., Casey, K., Frey, H., Joshi, S. P., Konovalov, V., Le Bris, R., Molg, N., Nosenko, G., Nuth, C., Pope, A., Racoviteanu, A., Rastner, P., Raup, B., Scharrer, K., Steffen, S., and Winsvold, S.: On the accuracy of glacier outlines derived from remote-sensing data, Ann. Glaciol., 54, 171–182, https://doi.org/10.3189/2013AoG63A296, 2013.
Perren, B. B., Hodgson, D. A., Roberts, S. J., Sime, L., Van Nieuwenhuyze, W., Verleyen, E., and Vyverman, W.: Southward migration of the Southern Hemisphere westerly winds corresponds with warming climate over centennial timescales, Communications Earth and Environment, 1, 58, https://doi.org/10.1038/s43247-020-00059-6, 2020.
Pfeffer, W. T., Arendt, A. A., Bliss, A., Bolch, T., Cogley, J. G., Gardner, A. S., Hagen, J., Hock, R., Kaser, G., Kienholz, C., Miles, E. S., Moholdt, G., Mölg, N., Paul, F., Radic, V., Rastner, P., Raup, B. H., Rich, J., Sharp, M. J., and The Randolph Consortium: The Randolph Glacier Inventory: a globally complete inventory of glaciers, J. Glaciol., 60, 537–552, https://doi.org/10.3189/2014JoG13J176, 2014.
Pockley, P.: Climate change transforms island ecosystem, Nature, 410, 616, https://doi.org/10.1038/35070741, 2001.
Pohl, B., Saucède, T., Favier, V., Pergaud, J., Verfaillie, D., Féral, J., Krasniqi, Y., and Richard, Y.: Recent climate variability around the Kerguelen Islands (Southern Ocean) seen through weather regimes, J. Appl. Meteorol. Clim., 60, 711–731, https://doi.org/10.1175/JAMC-D-20-0255.1, 2021.
Purdie, H., Anderson, B., Chinn, T., Owens, I., Mackintosh, A., and Lawson, W.: Franz Josef and Fox Glaciers, New Zealand: historic length records, Global Planet. Change, 121, 41–52, https://doi.org/10.1016/j.gloplacha.2014.06.008, 2014.
Purdie, H., Bealing, P., Gomez, C., Anderson, B., and Marsh, O. J.: Morphological changes to the terminus of a maritime glacier during advance and retreat phases: Fox Glacier/Te Moeka o Tuawe, New Zealand, Geogr. Ann. A, 103, 167–185, https://doi.org/10.1080/04353676.2020.1840179, 2020.
Radić, V., Bliss, A., Beedlow, A. C., Hock, R., Miles, E., and Cogley, J. G.: Regional and global projections of twenty-first century glacier mass changes in response to climate scenarios from global climate models, Clim. Dynam., 42, 37–58, https://doi.org/10.1007/s00382-013-1719-7, 2014.
Raup, B. H., Khalsa, S. J. S., Armstrong, R. L., Sneed, W. A., Hamilton, G. S., Paul, F., Cawkwell, F., Beedle, M. J., Menounos, B. P., Wheate, R. D., Rott, H., Shiyin, L., Xin, L., Donghui, S., Guodong, C., Kargel, J. S., Larsen, C. F., Molnia, B. F., Kincaid, J. L., Klein, A., and Konovalov, V.: Quality in the GLIMS glacier database, in: Global Land Ice Measurements from Space, edited by: Kargel, J. S., Leonard, G. J., Bishop, M. P., Kääb, A., and Raup, B. H., Springer Berlin Heidelberg, 163–182, https://doi.org/10.1007/978-3-540-79818-7_7, 2014.
Richardson, J. M. and Brook, M. S.: Ablation of debris-covered ice: someeffects of the 25 September 2007 Mt Ruapehu eruption, J. Roy. Soc. New Zeal., 40, 45–55, https://doi.org/10.1080/03036758.2010.494714, 2010.
Rivera, A., Bown, F., Carrion, D., and Zenteno, P.: Glacier responses torecent volcanic activity in southern Chile, Environ. Res. Lett., 7, 014036, https://doi.org/10.1088/1748-9326/7/1/014036, 2012.
Rounce, D. R., Hock, R., Maussion, F., Hugonnet, R., Kochtitzky, W., Huss, M., Berthier, E., Brinkerhoff, D., Compagno, L., Copland, L., and Farinotti, D.: Global glacier change in the 21st century: Every increase in temperature matters, Science, 379, 78–83, https://doi.org/10.1126/science.abo1324, 2023.
Scherler, D., Wulf, H., and Gorelick, N.: Global assessment of supraglacial debris-cover extents, Geophys. Res. Lett., 45 11798–11805, https://doi.org/10.1029/2018GL080158, 2018.
Shean, D. E., Bhushan, S., Montesano, P., Rounce, D. R., Arendt, A., and Osmanoglu, B.: A Systematic, Regional Assessment of High Mountain Asia Glacier Mass Balance, Front. Earth Sci, 7, 363, https://doi.org/10.3389/feart.2019.00363, 2020.
Soci, C., Hersbach, H., Simmons, A., Poli, P., Bell, B., Berrisford, P., Horányi, A., Muñoz-Sabater, J., Nicolas, J., Radu, R., Schepers, D., Villaume, S., Haimberger, L., Woollen, J., Buontempo, C., and Thépaut, J.-N.: The ERA5 global reanalysis from 1940 to 2022, Q. J. Roy. Meteor. Soc., 150, 4014–4048, https://doi.org/10.1002/qj.4803, 2024.
Son, S. W., Polvani, L. M., Waugh, D. W., Akiyoshi, H., Garcia, R., Kinnison, D., Pawson, S., Rozanov, E., Shepherd, T. G., and Shibata, K.: The impact of stratospheric ozone recovery on the Southern Hemisphere westerly jet, Science, 320, 1486–1489, https://doi.org/10.1126/science.1155939, 2008.
Stokes, C. R., Shahgedanova, M., Evans, I., and Popovnin, V. V.: Accelerated loss of alpine glaciers in the Kodar Mountains, south-eastern Siberia, Global Planet. Change, 101, 82–96, https://doi.org/10.1016/j.gloplacha.2012.12.010, 2013.
Straneo, F. and Cenedese, C.: The dynamics of Greenland's glacial fjords and their role in climate, Annu. Rev. Mar. Sci., 7, 89–112, https://doi.org/10.1146/annurev-marine-010213-135133, 2015.
Tachikawa, T., Hato, M., Kaku, M., and Iwasaki, A.: Characteristics of ASTER GDEM version 2, in: IEEE International Geoscience and Remote Sensing Symposium, Vancouver, BC, Canada, 24–29 July 2011, 3657–3660, https://doi.org/10.1109/IGARSS.2011.6050017, 2011.
Thost, D. E. and Truffer, M.: Glacier Recession on Heard Island, Southern Indian Ocean, Arct. Antarct. Alp. Res., 40, 199–214, https://doi.org/10.1657/1523-0430(06-084)[THOST]2.0.CO;2, 2008.
Tielidze, L. G.: Glacier change over the last century, Caucasus Mountains, Georgia, observed from old topographical maps, Landsat and ASTER satellite imagery, The Cryosphere, 10, 713–725, https://doi.org/10.5194/tc-10-713-2016, 2016.
Tielidze, L. G. and Wheate, R. D.: The Greater Caucasus Glacier Inventory (Russia, Georgia and Azerbaijan), The Cryosphere, 12, 81–94, https://doi.org/10.5194/tc-12-81-2018, 2018.
Tielidze, L. G., Bolch, T., Wheate, R. D., Kutuzov, S. S., Lavrentiev, I. I., and Zemp, M.: Supra-glacial debris cover changes in the Greater Caucasus from 1986 to 2014, The Cryosphere, 14, 585–598, https://doi.org/10.5194/tc-14-585-2020, 2020.
Tielidze, L. G., Nosenko, G. A., Khromova, T. E., and Paul, F.: Strong acceleration of glacier area loss in the Greater Caucasus between 2000 and 2020, The Cryosphere, 16, 489–504, https://doi.org/10.5194/tc-16-489-2022, 2022.
Truffer, M. and Motyka, R. J.: Where glaciers meet water: Subaqueous melt and its relevance to glaciers in various settings, Rev. Geophys., 54, 220–239, https://doi.org/10.1002/2015RG000494, 2016.
Von Drygalski, E.: Geogr. von Heard Eiland?, Deutsche Südpolar Exped., 1901–1903, Bd. 11, Heft 3, Geog. u. Geol. 223–239, 1908.
Weber, P., Andreassen, L. M., Boston, C. M., Lovell, H., and Kvarteig, S.: An ∼1899 glacier inventory for Nordland, northern Norway, produced from historical maps, J. Glaciol., 66, 259–277, https://doi.org/10.1017/jog.2020.3, 2020.
Williamson, R. A.: The Landsat legacy: Remote sensing policy and the development of commercial remote sensing, Photogramm. Eng. Rem. S., 63, 877–885, 1997.
Zemp, M., Huss, M., Thibert, E., Eckert, N., McNabb, R., Huber, J., Barandun, M., Machguth, H., Nussbaumer, S. U., Gärtner-Roer, I., Thomson, L., Paul, F., Maussion, F., Kutuzov, S., and Cogley, J. G.: Global glacier mass changes and their contributions to sea-level rise from 1961 to 2016, Nature, 568, 382–386, https://doi.org/10.1038/s41586-019-1071-0, 2019.