the Creative Commons Attribution 4.0 License.
the Creative Commons Attribution 4.0 License.
 | 02 Jul 2025
Brief communication: Reduced bandwidth improves the depth limit of the radar coherence method for detecting ice crystal fabric asymmetry
Álvaro Arenas-Pingarrón
Alex M. Brisbourne
Carlos Martín
Ice crystal orientation fabric strongly affects the viscous deformation of glacier ice. A popular technique to investigate ice fabric is radar polarimetry, often analysed using the coherence method. However, in fast-flowing areas with strong anisotropy, this method provides information of shallow areas below the surface only. This study proposes reducing radar bandwidth to enhance the depth limit for fabric asymmetry detection. Using data from two ice streams, we demonstrate that reduced bandwidth significantly increases the depth limit, depending on the centre frequency. This approach aims to improve the understanding of the spatial distribution of fabric, crucial for ice dynamics in fast-flowing regions.
- Article
(4368 KB) - Full-text XML
- BibTeX
- EndNote


The viscous deformation of glacier ice is controlled by its temperature and the bulk ice crystal orientation fabric (henceforth referred to as fabric). Due to the mechanical anisotropy of ice crystals, the influence of the fabric on the viscosity is directional: depending on the direction of deformation, the ice is softer or harder (Cuffey and Paterson, 2010). The orientation of the fabric depends on the past deformation of the ice and controls the present viscosity (Alley, 1988). However, little is known about the spatial and temporal distribution of the fabric, and, despite its importance, fabric is inadequately represented in large-scale ice flow models.
The most reliable method to determine the fabric is the analysis of ice cores (e.g. Weikusat et al., 2017). By analysing thin sections, the orientation of the crystallographic axis (c axis) of each grain can be determined and represented by a second-order orientation tensor. The difference in the horizontal eigenvalues λx and λy of this tensor gives the horizontal fabric asymmetry:
Because ice cores are rarely drilled in ice streams, little was known about the fabric orientation and strength of asymmetry in the fast-flowing areas of the Greenland and Antarctic ice sheets.
Since ice crystals exhibit both mechanical and dielectric anisotropy (birefringence), horizontal fabric asymmetry can also be estimated using polarimetric radar measurements (Hargreaves, 1978). Due to the dielectric anisotropy, the relative permittivity ε and thus the propagation velocity of the electromagnetic wave depend on the orientation of the polarised wave. By conducting two perpendicular measurements with polarisations in x′ and y′ directions, the difference in permittivities can be determined, allowing for the calculation of horizontal fabric asymmetry using the following relationship (Gerber et al., 2023):
with the maximum permittivity difference for ice-penetrating radar frequencies of (Matsuoka et al., 1997).
A widely used method for determining the difference in permittivities is the coherence method (Dall, 2010). This involves measuring the phase delay from the coherence of two perpendicular co-polarised signals, shh and svv, due to their propagation velocity differences. The coherence chhvv is calculated over depth segments containing N+1 bins, starting at bin in:
where ∗ indicates the complex conjugate. The magnitude |chhvv| indicates the degree of correlation, and the argument ϕhhvv=arg(chhvv) gives the phase shift (range −π to π). Its uncertainty can be estimated from the Cramér–Rao bound (Touzi et al., 1999; Jordan et al., 2019). From the depth gradient of the phase shift , the difference in permittivity can be calculated:
with the speed of light in vacuum c0, the mean (polarisation-averaged) permittivity , and the centre frequency fc. While the coherence method was used successfully at ice divides and other slow-flowing areas with weak anisotropy (Jordan et al., 2019; Young et al., 2021; Ershadi et al., 2022), it revealed the fabric asymmetry to only shallow depths in fast-flowing areas with strong anisotropy, such as ice streams (Jordan et al., 2022; Zeising et al., 2023). Due to propagation velocity differences, signals with the same two-way travel time are actually the result of scatterers at different depths. When this difference in scatterer depth exceeds the range resolution of the radar system, coherence is lost (Leinss et al., 2016). To address this, the co-registration method was developed, which shifts the depth segment of one signal to maximise overlap (Zeising et al., 2023).
In this study, we propose reducing the frequency bandwidth of the radar system to enhance the depth range for determining fabric asymmetry with the coherence method. We test various bandwidths and frequency ranges using data from a widely used ground-penetrating radar system at the EastGRIP drill site, comparing our results with ice core analyses. We then apply our improved method to the Rutford Ice Stream, aiming to extend the depth range of fabric asymmetry determination. In the discussion we address the frequency dependence of the measurement and of the coherence analysis.
2.1 Coherence depth limitation
The coherence method is based on the coherence of the range-resolution cells of shh and svv with the same two-way travel time. The magnitude of the coherence decreases when the two cells are not perfectly overlapping in depth and thus do not contain exactly the same scatterers. The overlap is positive as long as the depth deviation of the two cells Δr is smaller then the range resolution ΔR of the radar system (Leinss et al., 2016). While the range resolution depends only on the frequency bandwidth of the radar system B,
with the polarisation averaged permittivity , the depth deviation is bandwidth independent:
with the depth averaged permittivities and in x′ and y′ direction and depth z.
The coherence method cannot be applied beyond the depth at which the depth deviation exceeds the range resolution, and there is no overlap in the range bins. The overlap is zero when the depth deviation equals the range resolution, which gives the coherence depth limit as
Thus, the depth to which coherence can be calculated depends inversely on the difference in permittivity and on the bandwidth of the radar signal. Nevertheless, the coherence depth limit remains independent of the centre frequency.
2.2 Phase-sensitive radar data analysis
We test the effect of a reduced bandwidth on two different polarimetric phase-sensitive radar data sets acquired with ApRES (Nicholls et al., 2015) in fast-flowing ice:
-
multi-polarised measurements at the EastGRIP (East Greenland Ice-core Project) drill site on the Northeast Greenland Ice Stream (Data: PpRES_CL; Zeising and Humbert, 2022; Zeising et al., 2023)
-
quad-polarised measurements at the Rutford Ice Stream, Antarctica (Data: A3, Jordan et al., 2020, 2022).
The ApRES is a frequency-modulated continuous wave radar that is operated with a bandwidth of 200 MHz and a centre frequency of 300 MHz. It transmits chirps of 1 s length while it increases the frequency linearly from 200 to 400 MHz. For a quad-polarised measurement, two co-polarised (shh and svv) and two cross-polarised measurements (shv and svh) were made. The multi-polarised measurements at EastGRIP consist of the four quad-polarised measurements with different azimuthal orientations. The benefit of quad- or multi-polarised measurements is that the full radar return from any antenna orientation can be synthesised from the co- and cross-polarised measurements using a matrix transformation (Ershadi et al., 2022).
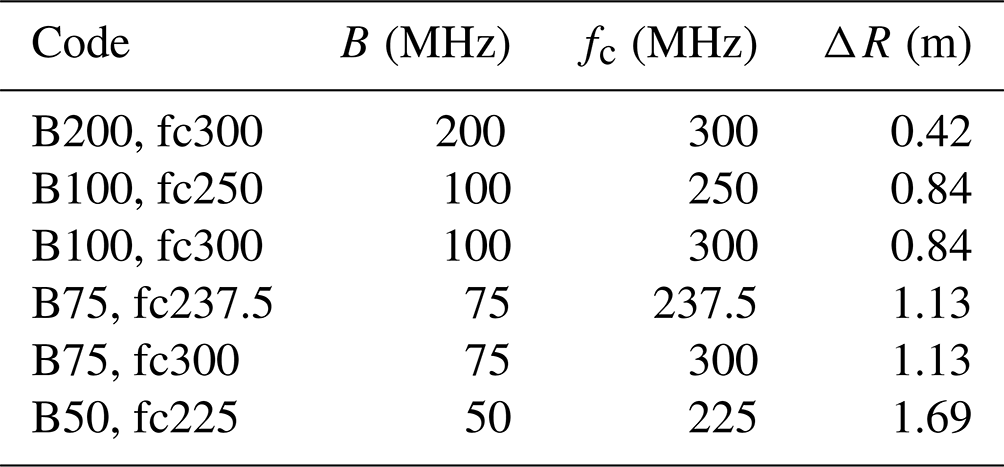
For the specified bandwidth and frequency range, only the corresponding part of the chirp was used for preprocessing, which follows the methods described in Zeising et al. (2023). We compared the full 200 MHz bandwidth with limited bandwidths of 100, 75, and 50 MHz for the centre frequencies of 300 MHz and for the respective minimum available centre frequencies (see Table 1).
Table 1Bandwidth B and centre frequency fc used in the tests for the coherence method with resulting range resolution ΔR.
After preprocessing, we synthesised shh and svv in 1° azimuthal intervals from 0 to 180°. For each azimuth, we calculated the coherence (Eq. 3), and hence the phase shift, with a moving depth segment of 20 m. We unwrapped the phase, smoothed it with a moving average of 100 m, and calculated its depth gradient with a moving window of 200 m. We then calculated the difference in permittivity and the horizontal fabric asymmetry.
We compare the results of the coherence method with the fabric asymmetry derived from the co-registration method (Zeising et al., 2023). Here, the full bandwidth of 200 MHz was used, since the co-registration method can be applied until the noise level depth limit, and it is thus independent of the coherence depth limit. At the EastGRIP site, we also performed a comparison of the coherence method with the fabric asymmetry derived from the EastGRIP ice core (Stoll et al., 2021; Weikusat et al., 2022). Based on the fabric asymmetry of the ice core, we calculated the coherence depth limit by using Eq. (2) to obtain the difference in permittivity from the fabric asymmetry. At the Rutford Ice Stream, the coherence depth limit was calculated assuming the permittivity difference derived with the co-registration method.
3.1 Northeast Greenland Ice Stream
At the EastGRIP drill site, the coherence depth limit for the standard bandwidth of 200 MHz is about 380 m (Fig. 1a). With decreasing bandwidth the depth limit increases. For bandwidths of 100, 75, and 50 MHz, the coherence depth limit is 530, 625, and 810 m respectively. Thus, at the EastGRIP drill site, the bandwidth reduction from 200 to 50 MHz increases the depth limit of the coherence method by a factor of ∼2.1.
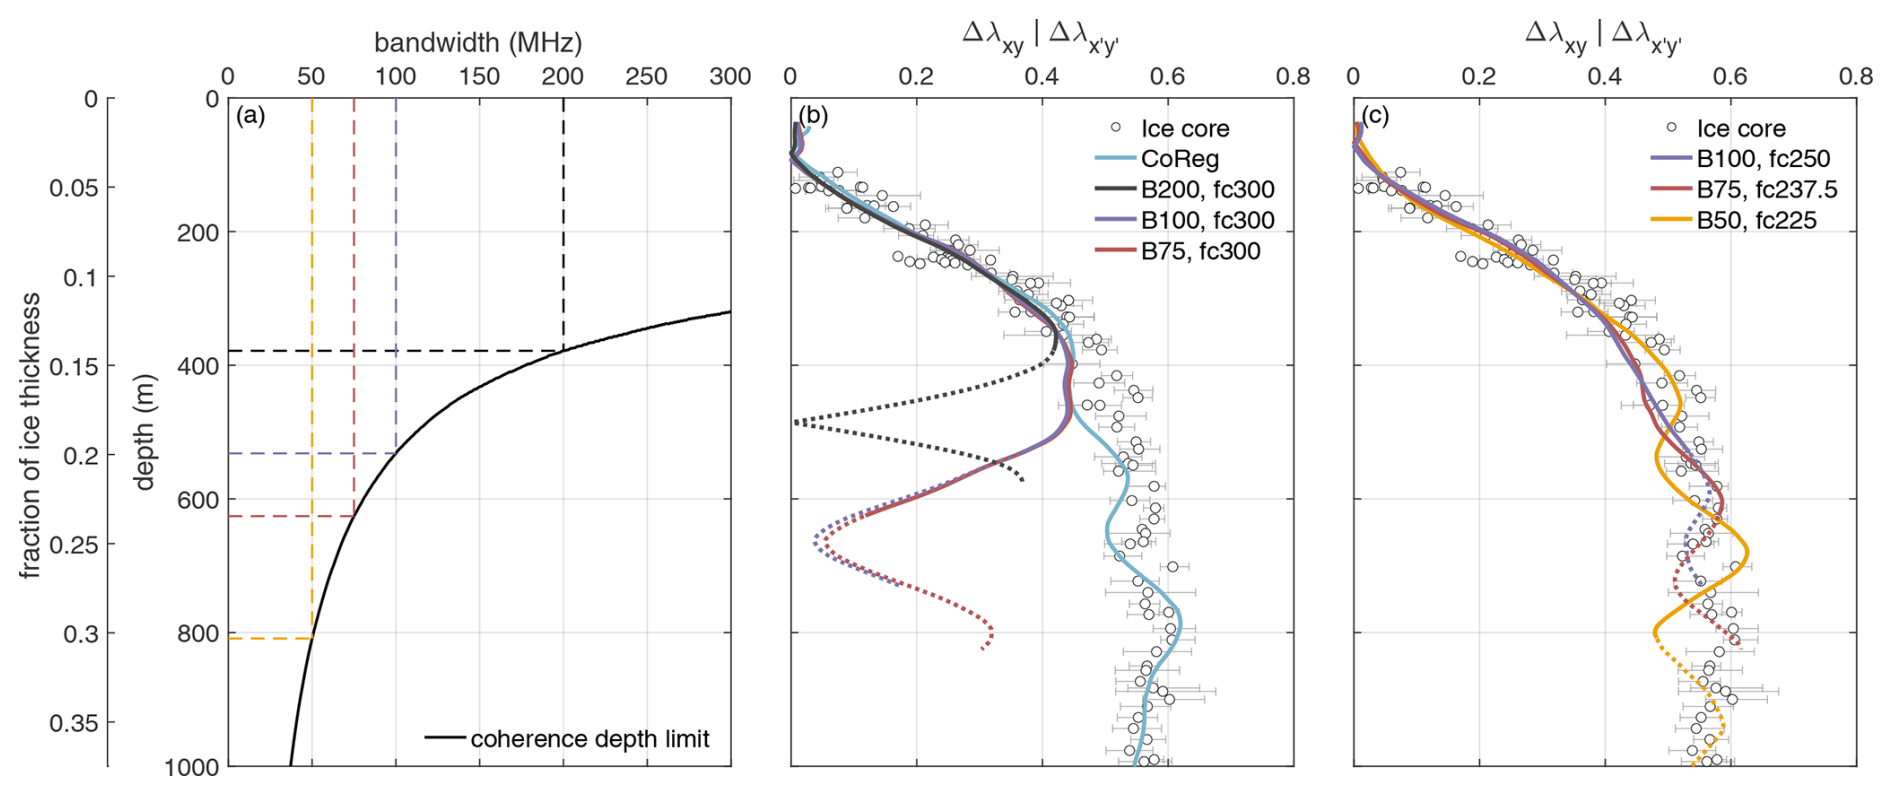
Figure 1Comparison of horizontal fabric asymmetry Δλ estimations. (a) Coherence depth limit of the coherence method as a function of bandwidth, calculated based on the permittivity difference derived from the fabric asymmetry of the EastGRIP ice core. Dashed lines show the depth limits for selected the bandwidths. (b) Fabric asymmetry determined from the co-registration (CoReg) and coherence method for the centre frequency of 300 MHz of polarimetric ApRES measurements at EastGRIP and from weighted horizontal eigenvalues from EastGRIP ice core (white dots) (Weikusat et al., 2022). (c) Fabric asymmetry determined from the coherence method for the respective minimum available centre frequencies of polarimetric ApRES measurements at EastGRIP. The solid part of the coherence lines is above the depth limit, while the dotted part shows the first 200 m below that limit.
The ice-core-derived horizontal fabric asymmetry at the EastGRIP drill site revealed a rapid increase from 0 to ∼0.5 within the upper 100–500 m (Fig. 1b). Below these depths it increases only slightly up to 0.6 at a depth of 800 m. The same general distribution is shown by the co-registration method to beyond 1000 m depth. All horizontal fabric asymmetries estimated with the coherence method (for details see Fig. A1) show the same rapid increase within the upper 350 m. At this depth, the fabric asymmetry for the full bandwidth of 200 MHz begins to differ from the ice-core-derived asymmetry and starts to decrease rapidly. The asymmetries derived from the smaller bandwidths of 100 and 75 MHz for a centre frequency of 300 MHz (Fig. 1b) deviate from the ice core-derived asymmetry from a depth of 480 m. However, the calculated coherence depth limit for a bandwidth of 75 MHz is 625 m, which is significantly deeper than the observed onset of mismatch. In contrast, the asymmetries derived from the same bandwidths but for the reduced centre frequencies agree with the asymmetry derived from the ice core up to at least the calculated coherence depth limit. However, the fabric asymmetry derived from ApRES data with 50 MHz bandwidth remains at a high level, similar to that from the other methods, but with larger deviations.
3.2 Rutford Ice Stream
At Rutford Ice Stream, a more detailed comparison of the coherence magnitude and phase shows a clear improvement for the limited bandwidth of 75 MHz compared to the full bandwidth (Fig. 2). The coherence based on the limited bandwidth shows higher magnitudes (Fig. 2a and e) and clearer visible nodes (phase difference becomes an odd multiple of π (Fujita et al., 2006)) in the wrapped phase (Fig. 2b and f) down to the depth at which the coherence depth limit is reached. Whilst the coherence depth limit is reached at 220 m for the standard bandwidth, it is twice this depth for the limited bandwidth case (440 m). Below these depth limits, the nodes fade out. The horizontal fabric asymmetry is based on the phase gradient of the unwrapped phase of a selected azimuth (Fig. 2c and g). Both the co-registration and the coherence methods show a rapid increase in horizontal fabric asymmetry to a value of 0.4. Whilst the fabric asymmetry from the co-registration method continues to increase to 0.6 at 300 m depth, the fabric asymmetry from the coherence method with standard bandwidth decreases (Fig. 2d). The asymmetry from the reduced bandwidth matches the fabric asymmetry of the co-registration method down to its calculated depth limit and beyond. Thus, applying the coherence method to reduced-bandwidth ApRES data as well as applying the co-registration method revealed the strong fabric asymmetry and its depth profile at the Rutford Ice Stream beyond the shallow depths.
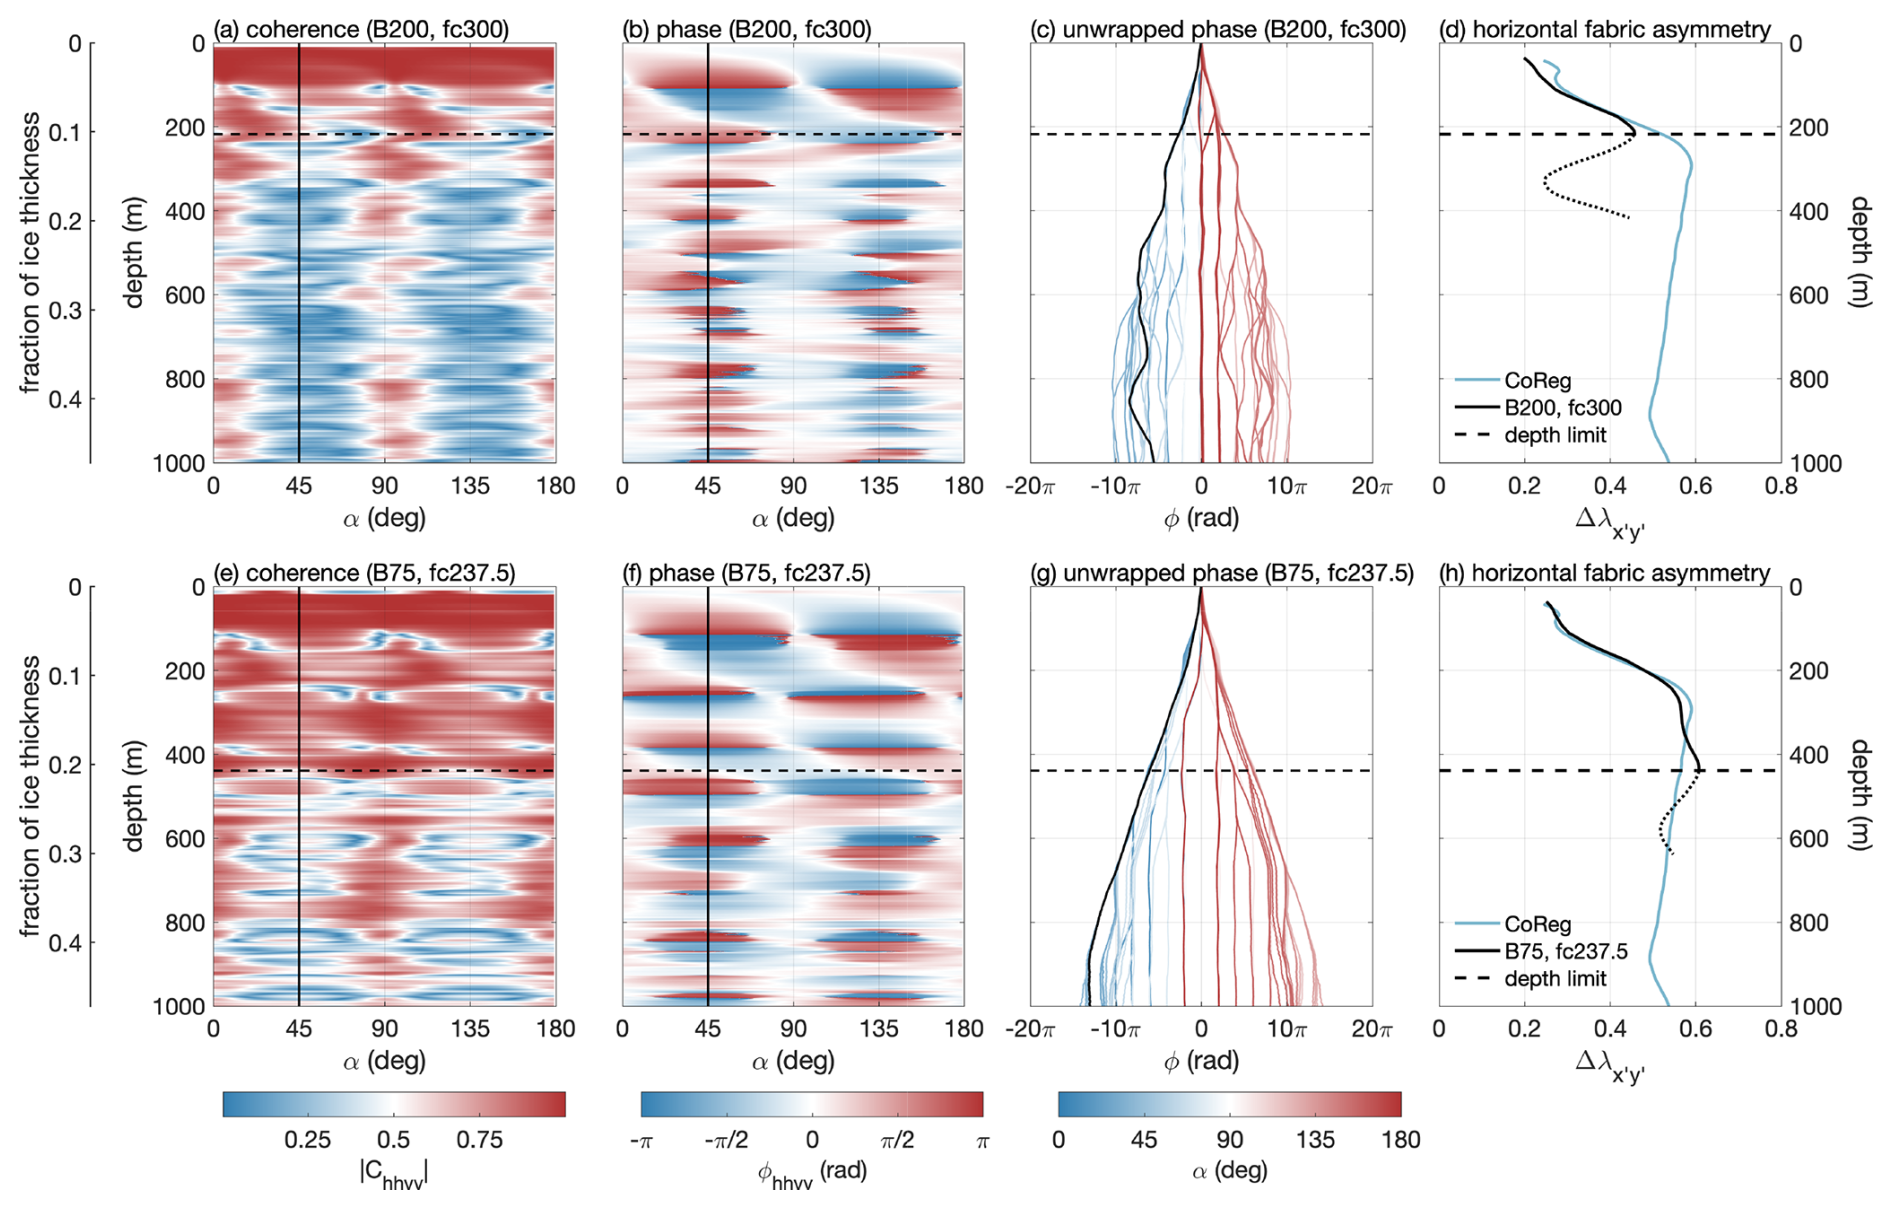
Figure 2Coherence analysis of quad-polarised ApRES measurement at Rutford Ice Stream. (a–d) Analysis of the standard 200 MHz bandwidth (fc=300 MHz) and (e–h) of 75 MHz bandwidth (fc=237.5 MHz). The columns show (a, e) the magnitude of coherence for synthesised azimuths, (b, f) the wrapped phase shift, (c, g) the unwrapped phase shift, and (d, h) the derived horizontal fabric asymmetry of selected azimuths. The selected azimuths are marked by solid black lines (a–c, e–g). The horizontal dashed lines mark the coherence depth limit, and the blue line shows the co-registration result.
By evaluating the impact of bandwidth on the coherence method, we show that limited bandwidth allows the determination of the horizontal fabric asymmetry to a significantly greater depth. However, we find that the selected centre frequency also affects the quality of the results. To further investigate the frequency dependence, we first computed the signal-to-noise (SNR) ratio of the polarimetric ApRES measurement conducted at the Rutford Ice Stream. To this end, we stacked the recorded chirps and calculated the power spectrum for subbands of 75 MHz with centre frequencies spanning from 237.5 to 362.5 MHz by applying a short-time Fourier transform. For each subband, we calculated the signal power as a function of depth and the noise power below the basal return. We then averaged the SNR across all four polarisations (Fig. 3a). However, the estimated SNR exhibits no frequency dependence. Next, we applied the coherence method to the same subbands but for an azimuth of 45° at which the maximum fabric asymmetry occurs (Fig. 3b–d). This analysis reveals that the derived horizontal fabric asymmetry is largely independent of the centre frequency for frequencies below 300 MHz. However, for higher centre frequencies, errors occur at shallow depth. Low coherence values at a depth of 150 m result in errors in the phase unwrapping, leading to an inaccurate estimation of the fabric asymmetry.
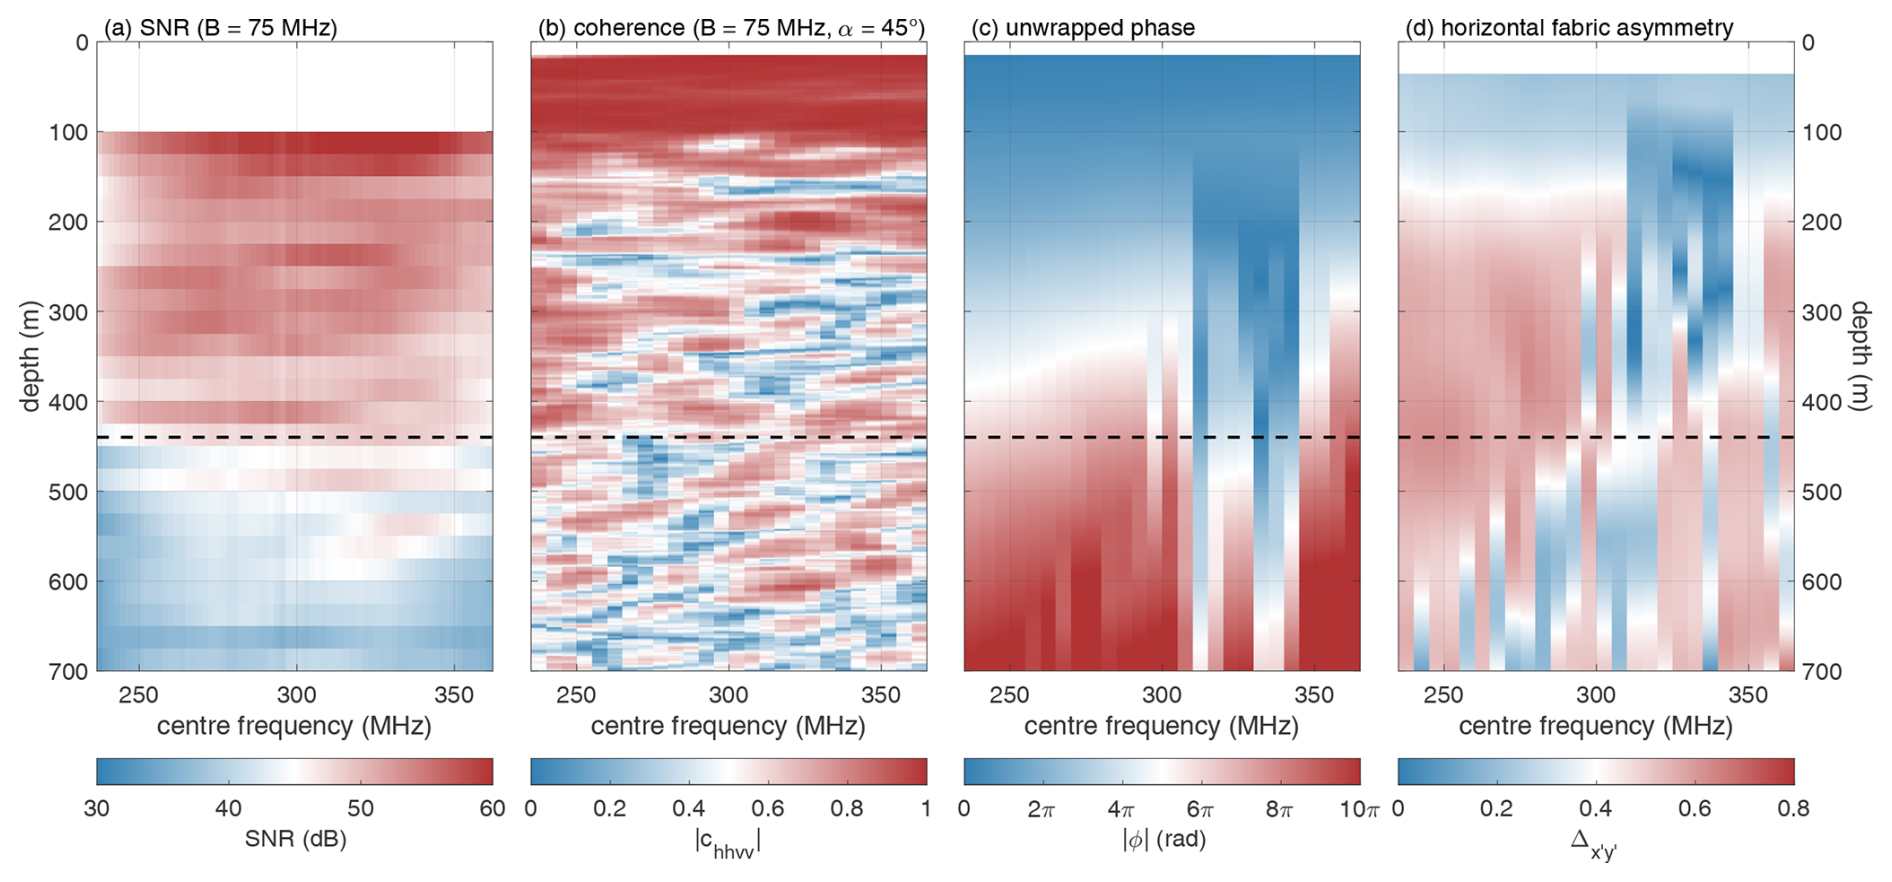
Figure 3Analysis of the dependence of the coherence method on the centre frequency for 75 MHz limited bandwidths, based on a polarimetric ApRES measurement at Rutford Ice Stream. (a) Signal-to-noise ratios of the original HH, HV, VH, and VV measurements; (b) magnitude of the coherence; (c) unwrapped phase; and (d) horizontal fabric asymmetry as a function of centre frequency. The coherence, unwrapped phase, and fabric asymmetry are based on an angle of α=45°. The horizontal dashed line represents the coherence depth limit.
The reason for the low coherence observed at a depth of 150 m for higher centre frequencies remains unclear. Enhanced roughness of radar layers can lead to frequency-dependent decorrelation or depolarisation, which was considered by Jordan et al. (2022) as a reason for the reduced coherence at Rutford Ice Stream. In addition, it is also possible that the antenna radiation pattern is dependent on the frequency range. The pattern of the skeleton slot antennas utilised for the polarimetric ApRES measurements has not been measured. We cannot discard that frequency-varying gain, in either nadir direction or off-vertical sidelobes, might greatly increase the clutter relative to the nadir signal.
The determined fabric asymmetry at EastGRIP using the bandwidth of 75 and 50 MHz corresponds to the fabric asymmetry of the ice core even deeper than the coherence depth limit. One possible reason could be the application of Blackman windowing before the Fourier transformation, which decreases the effective bandwidth by a factor of 1.6. Thus, the coherence depth limits for these frequencies shown in Fig. 1a would instead correspond to 47 and 31 MHz, with deeper limits than without windowing.
A reduced bandwidth is required to increase the overlap of the range-resolution cells in the coherence method. In the co-registration method (Zeising et al., 2023), the increase in overlap is achieved by shifting the cells. However, this requires a phase variation of less than 2π rad within the range-resolution cell, which is achieved by zero padding (Brennan et al., 2014). Our comparison of the coherence and the co-registration methods shows that the co-registration method is still preferable as it bypasses the depth limitation and provides higher resolution.
We show that the maximum depth at which ice fabric can be analysed using the coherence method on polarimetric radar data depends strongly on the frequency range used. We demonstrate that reducing both the bandwidth and centre frequency improves the depth to which coherence can be determined, which is particularly important in areas of strong anisotropy such as ice streams. Our findings are supported by radar theory and field observations. Existing high-bandwidth data, such as those acquired with the widely used ApRES radar system, allow the reduction of the bandwidth at the data processing stage. Therefore, the method presented in this study can be applied to improve measurements of fabric asymmetry, and thus ice viscosity, using existing data. Future studies should further investigate the reason behind the frequency dependence of the coherence method applied to ApRES data. Knowledge of the spatial distribution of fabric asymmetry, especially over greater depths, will be important in the future when large-scale ice flow models are able to account for the effects of fabric on viscosity.
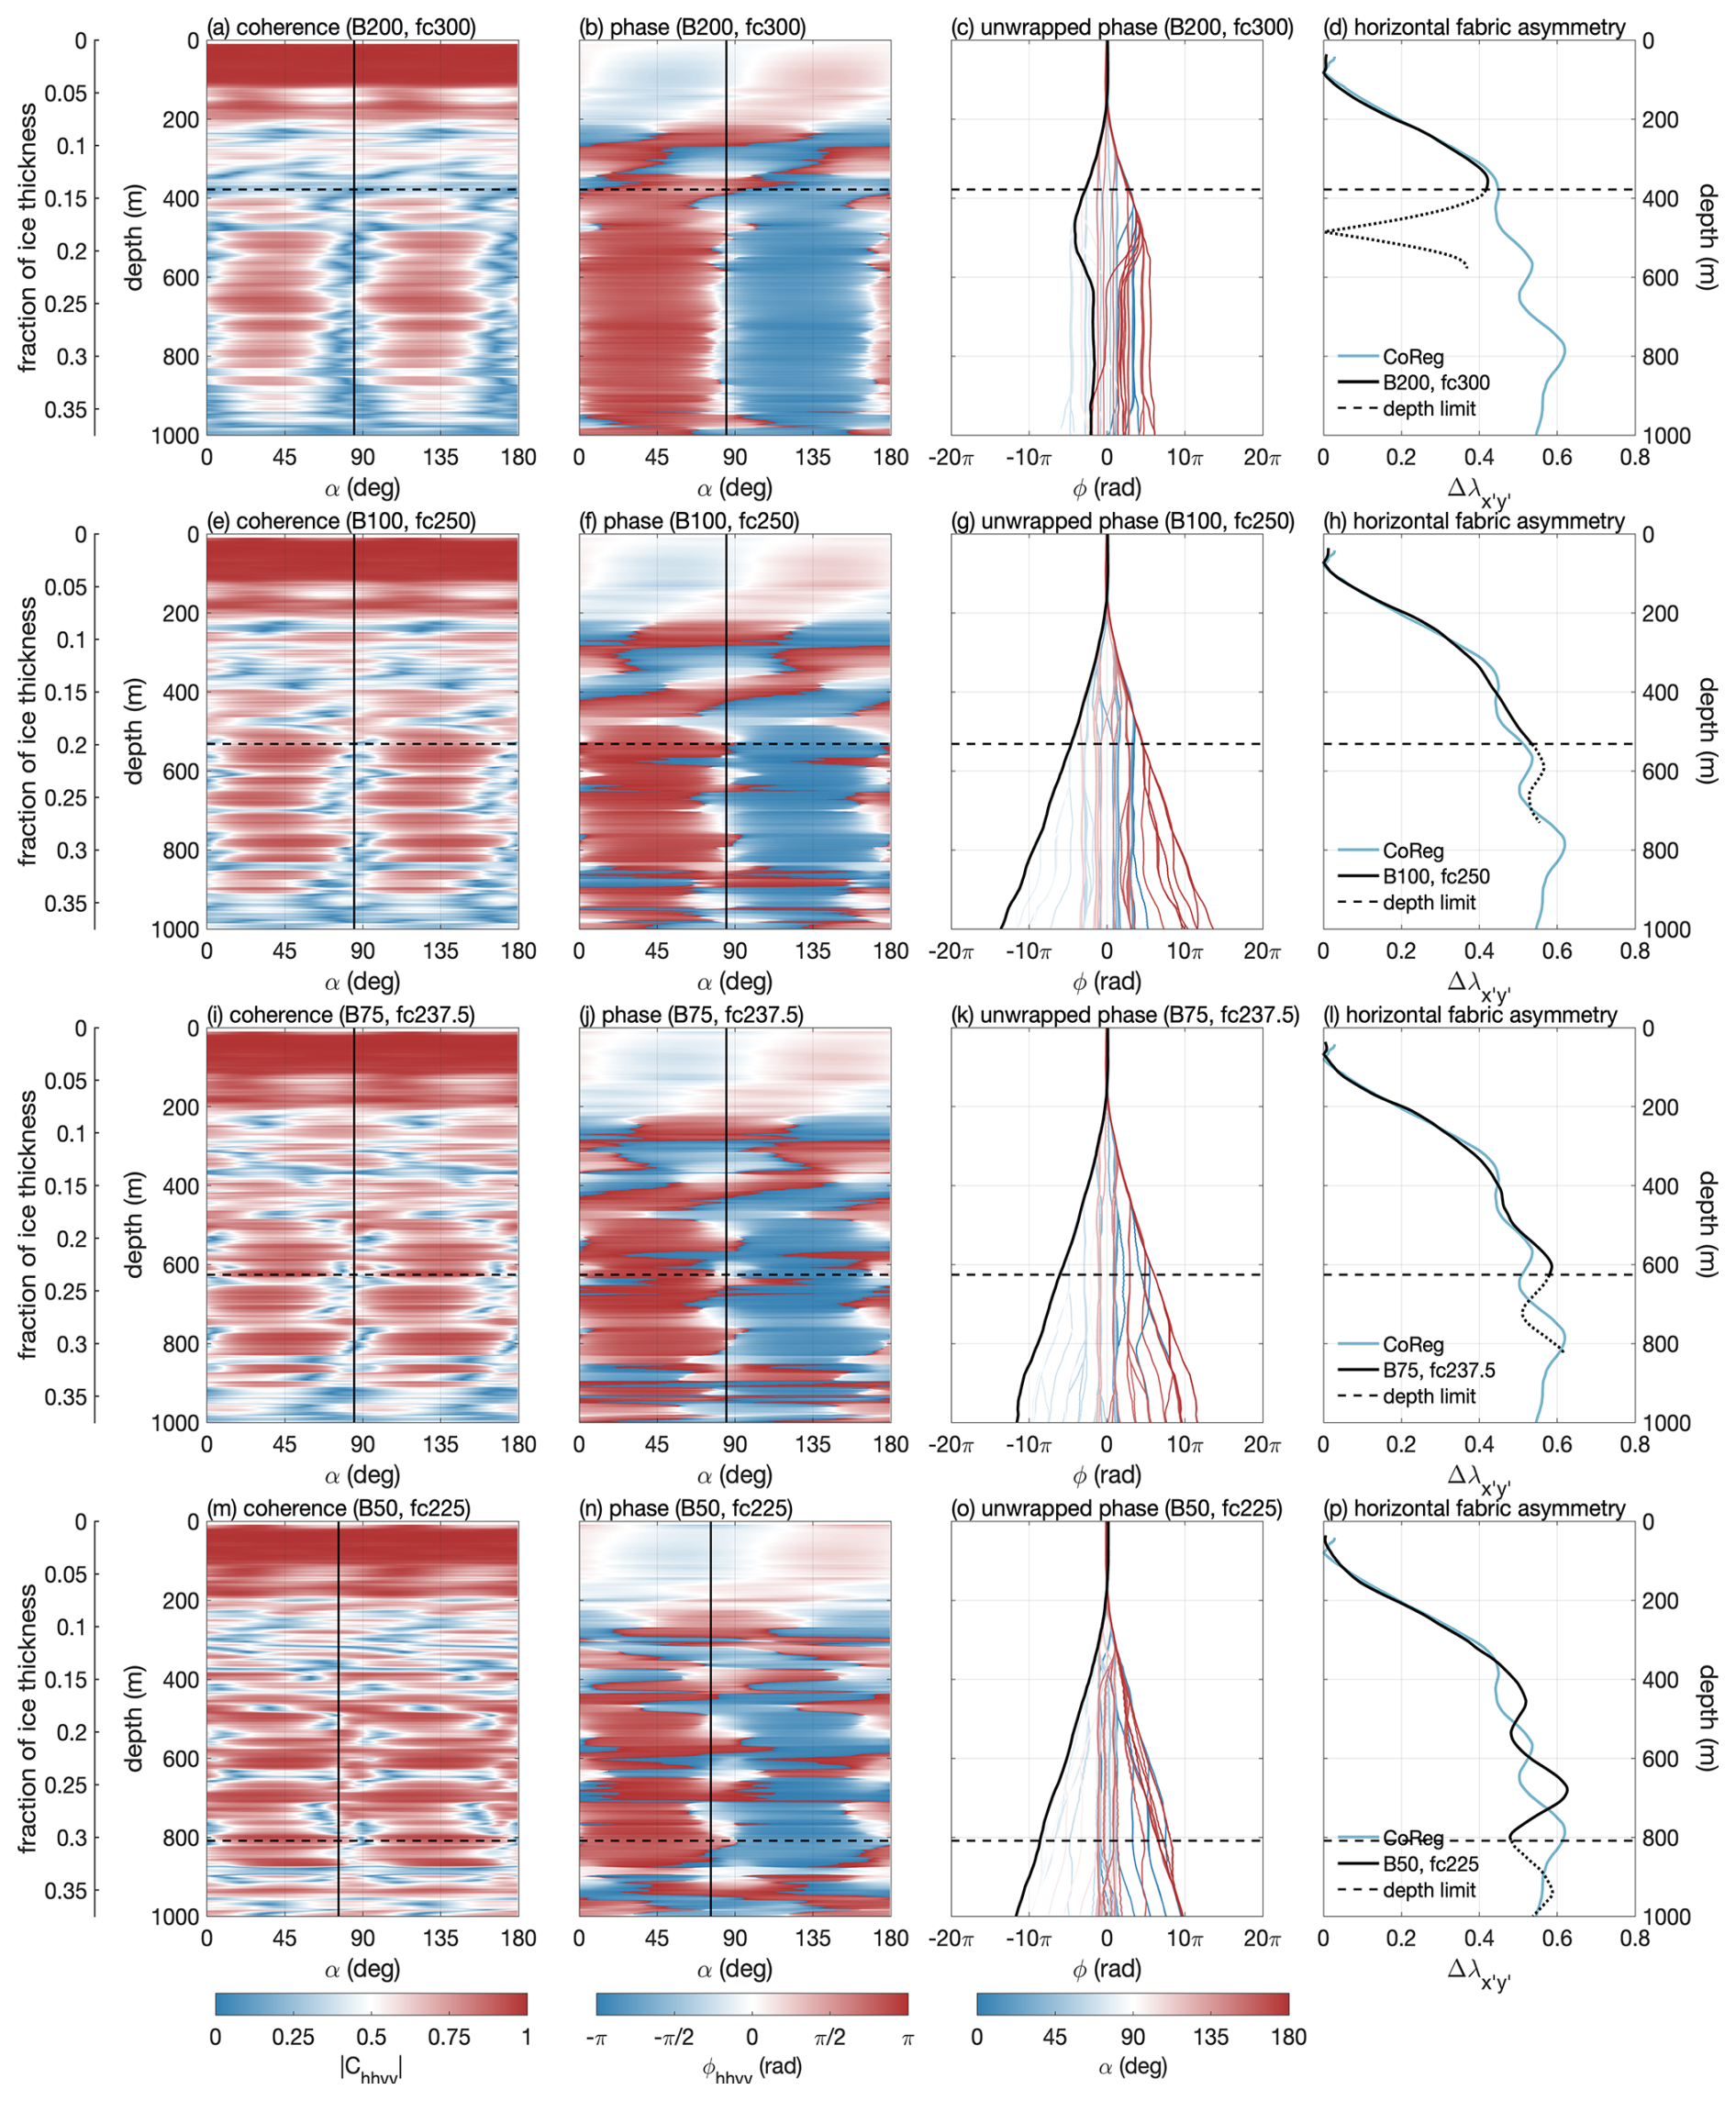
Figure A1Coherence analysis of multi-polarised ApRES measurements at EastGRIP drill site. (a–d) Analysis of the standard 200 MHz bandwidth (fc=300 MHz), (e–h) bandwidth 100 MHz (fc=250 MHz), (i–l) bandwidth 50 MHz (fc=237.5 MHz), and (m–p) bandwidth 50 MHz (fc=225 MHz). The columns show (a, e , i, m) the magnitude of coherence for synthesised azimuths, (b, f, i, n) the wrapped phase shift, (c, g, k, o) the unwrapped phase shift, and (d, h, i, p) the derived horizontal fabric asymmetry of selected azimuths. The selected azimuths are marked by solid black lines (a–c, e–g, i–k, m–o). The horizontal dashed lines mark the coherence depth limit, and the blue line shows the co-registration result.
Raw data of the multi-polarised ApRES measurements at EastGRIP (https://doi.org/10.1594/PANGAEA.951267, Zeising and Humbert, 2022) and crystal c axes of ice core samples are published at the World Data Center PANGAEA (https://doi.org/10.1594/PANGAEA.949248, Weikusat et al., 2022). Raw data of the quad-polarised ApRES measurements at Rutford Ice Stream are published at the NERC's Polar Data Centre (https://doi.org/10.5285/d5b7e5a1-b04d-48d8-a440-c010658ec146, Jordan et al., 2020).
OZ and AAP developed the methodology with contributions from AMB and CM. OZ wrote the manuscript, and it was reviewed by all authors.
At least one of the (co-)authors is a member of the editorial board of The Cryosphere. The peer-review process was guided by an independent editor, and the authors also have no other competing interests to declare.
Publisher's note: Copernicus Publications remains neutral with regard to jurisdictional claims made in the text, published maps, institutional affiliations, or any other geographical representation in this paper. While Copernicus Publications makes every effort to include appropriate place names, the final responsibility lies with the authors.
EastGRIP is directed and organised by the Centre for Ice and Climate at the Niels Bohr Institute, University of Copenhagen. It is supported by funding agencies and institutions in Denmark (A. P. Møller Foundation, University of Copenhagen), the USA (US National Science Foundation, Office of Polar Programs), Germany (Alfred Wegener Institute, Helmholtz Centre for Polar and Marine Research), Japan (National Institute of Polar Research and Arctic Challenge for Sustainability), Norway (University of Bergen and Trond Mohn Foundation), Switzerland (Swiss National Science Foundation), France (French Polar Institute Paul-Emile Victor, Institute for Geosciences and Environmental Research), Canada (University of Manitoba), and China (Chinese Academy of Sciences and Beijing Normal University). We thank John Paden and an anonymous reviewer for their constructive feedback, which improved the quality of the manuscript.
The Rutford Ice Stream data were acquired as part of the Beamish project funded by NERC AFI award numbers NE/G014159/1 and NE/G013187/1. The work of Ole Zeising was funded by the German Academic Exchange Service (DAAD) programme (Forschungsstipendien für promovierte Nachwuchswissenschaftlerinnen und -wissenschaftler; Kurzstipendien).
The article processing charges for this open-access publication were covered by the Alfred-Wegener-Institut Helmholtz-Zentrum für Polar- und Meeresforschung.
This paper was edited by Huw Horgan and reviewed by John Paden and one anonymous referee.
Alley, R. B.: Fabrics in polar ice sheets: development and prediction, Science, 240, 493–495, https://doi.org/10.1126/science.240.4851.493, 1988. a
Brennan, P. V., Lok, L. B., Nicholls, K., and Corr, H.: Phase-sensitive FMCW radar system for high-precision Antarctic ice shelf profile monitoring, IET Radar Sonar Nav., 8, 776–786, https://doi.org/10.1049/iet-rsn.2013.0053, 2014. a
Cuffey, K. M. and Paterson, W. S. B.: The Physics of Glaciers – 4th edn., Elsevier, ISBN 978-0-12-369461-4, 2010. a
Dall, J.: Ice sheet anisotropy measured with polarimetric ice sounding radar, in: 2010 IEEE International Geoscience and Remote Sensing Symposium, Honolulu, HI, USA, 25–30 July 2010, https://doi.org/10.1109/IGARSS.2010.5653528, 2507–2510, 2010. a
Ershadi, M. R., Drews, R., Martín, C., Eisen, O., Ritz, C., Corr, H., Christmann, J., Zeising, O., Humbert, A., and Mulvaney, R.: Polarimetric radar reveals the spatial distribution of ice fabric at domes and divides in East Antarctica, The Cryosphere, 16, 1719–1739, https://doi.org/10.5194/tc-16-1719-2022, 2022. a, b
Fujita, S., Maeno, H., and Matsuoka, K.: Radio-wave depolarization and scattering within ice sheets: a matrix-based model to link radar and ice-core measurements and its application, J. Glaciol., 52, 407–424, https://doi.org/10.3189/172756506781828548, 2006. a
Gerber, T. A., Lilien, D. A., Rathmann, N. M., Franke, S., Young, T. J., Valero-Delgado, F., Ershadi, M. R., Drews, R., Zeising, O., Humbert, A., Stoll, N., Weikusat, I., Grinsted, A., Hvidberg, C. S., Jansen, D., Miller, H., Helm, V., Steinhage, D., O'Neill, C., Paden, J., Gogineni, S. P., Dahl-Jensen, D., and Eisen, O.: Crystal orientation fabric anisotropy causes directional hardening of the Northeast Greenland Ice Stream, Nat. Commun., 14, 2653, https://doi.org/10.1038/s41467-023-38139-8, 2023. a
Hargreaves, N. D.: The radio-frequency birefringence of polar ice, J. Glaciol., 21, 301–313, https://doi.org/10.3189/S0022143000033499, 1978. a
Jordan, T. M., Schroeder, D. M., Castelletti, D., Li, J., and Dall, J.: A polarimetric coherence method to determine ice crystal orientation fabric from radar sounding: application to the NEEM ice core region, IEEE T. Geosci. Remote, 57, 8641–8657, https://doi.org/10.1109/TGRS.2019.2921980, 2019. a, b
Jordan, T., Martin, C., Brisbourne, A., Schroeder, D., and Smith, A.: Radar characterization of ice crystal orientation fabric and anisotropic rheology within Rutford Ice Stream, 2017–2019 (Version 1.0), UK Polar Data Centre, Natural Environment Research Council, UK Research and Innovation [data set], https://doi.org/10.5285/d5b7e5a1-b04d-48d8-a440-c010658ec146, 2020. a, b
Jordan, T. M., Martín, C., Brisbourne, A. M., Schroeder, D. M., and Smith, A. M.: Radar characterization of ice crystal orientation fabric and anisotropic viscosity within an Antarctic ice stream, J. Geophys. Res.-Earth, 127, e2022JF006673, https://doi.org/10.1029/2022JF006673, 2022. a, b, c
Leinss, S., Löwe, H., Proksch, M., Lemmetyinen, J., Wiesmann, A., and Hajnsek, I.: Anisotropy of seasonal snow measured by polarimetric phase differences in radar time series, The Cryosphere, 10, 1771–1797, https://doi.org/10.5194/tc-10-1771-2016, 2016. a, b
Matsuoka, T., Fujita, S., Morishima, S., and Mae, S.: Precise measurement of dielectric anisotropy in ice Ih at 39 GHz, J. Appl. Phys., 81, 2344–2348, https://doi.org/10.1063/1.364238, 1997. a
Nicholls, K. W., Corr, H. F., Stewart, C. L., Lok, L. B., Brennan, P. V., and Vaughan, D. G.: A ground-based radar for measuring vertical strain rates and time-varying basal melt rates in ice sheets and shelves, J. Glaciol., 61, 1079–1087, https://doi.org/10.3189/2015JoG15J073, 2015. a
Stoll, N., Eichler, J., Hörhold, M., Erhardt, T., Jensen, C., and Weikusat, I.: Microstructure, micro-inclusions, and mineralogy along the EGRIP ice core – Part 1: Localisation of inclusions and deformation patterns, The Cryosphere, 15, 5717–5737, https://doi.org/10.5194/tc-15-5717-2021, 2021. a
Touzi, R., Lopes, A., Bruniquel, J., and Vachon, P.: Coherence estimation for SAR imagery, IEEE T. Geosci. Remote, 37, 135–149, https://doi.org/10.1109/36.739146, 1999. a
Weikusat, I., Jansen, D., Binder, T., Eichler, J., Faria, S. H., Wilhelms, F., Kipfstuhl, S., Sheldon, S., Miller, H., Dahl-Jensen, D., and Kleiner, T.: Physical analysis of an Antarctic ice core – towards an integration of micro-and macrodynamics of polar ice, Philos. T. Roy. Soc. A, 375, 20150347, https://doi.org/10.1098/rsta.2015.0347, 2017. a
Weikusat, I., Stoll, N., Kerch, J., Eichler, J., Jansen, D., and Kipfstuhl, S.: Crystal c-axes (fabric analyser G50) of ice core samples (vertical thin sections) collected from the polar ice core EGRIP, 111–1714 m depth, PANGAEA [data set], https://doi.org/10.1594/PANGAEA.949248, 2022. a, b, c
Young, T. J., Martín, C., Christoffersen, P., Schroeder, D. M., Tulaczyk, S. M., and Dawson, E. J.: Rapid and accurate polarimetric radar measurements of ice crystal fabric orientation at the Western Antarctic Ice Sheet (WAIS) Divide ice core site, The Cryosphere, 15, 4117–4133, https://doi.org/10.5194/tc-15-4117-2021, 2021. a
Zeising, O. and Humbert, A.: Polarimetric phase-sensitive radar measurements at EastGRIP drill site, 2019, PANGAEA [data set], https://doi.org/10.1594/PANGAEA.951267, 2022. a, b
Zeising, O., Gerber, T. A., Eisen, O., Ershadi, M. R., Stoll, N., Weikusat, I., and Humbert, A.: Improved estimation of the bulk ice crystal fabric asymmetry from polarimetric phase co-registration, The Cryosphere, 17, 1097–1105, https://doi.org/10.5194/tc-17-1097-2023, 2023. a, b, c, d, e, f