the Creative Commons Attribution 4.0 License.
the Creative Commons Attribution 4.0 License.
 | 10 Jun 2025
Brief communication: Mimicking periglacial landforms and processes in an ice-rich layered permafrost system with polydisperse melamine materials – a new concept
Emmanuel Léger
François Costard
Rémi Lambert
Albane Saintenoy
Antoine Séjourné
Maxime Leblanc
This paper presents the results of testing polydisperse melamine material versus sand for a laboratory-based ice-rich layered soil system under thawing conditions. We demonstrate the potential of using polydisperse melamine particles for the aim of experimentally mimicking the permafrost geomorphological degradations and landslides found in periglacial field environments. We stress that these types of particles, designed for flow and sedimentary processes in rivers due to their light particle density and the granulometric sizes they span, are adequate for modeling more realistic geomorphological thawing features as observed in cryosphere environments such as slump blocks.
- Article
(2467 KB) - Full-text XML
-
Supplement
(50678 KB) - BibTeX
- EndNote


In cryosphere environments, the active-layer seasonal freeze–thaw cycle on downslope terrains may be associated with a wide range of mass movements, including creep, gelifluction, and plug-like flow (Ballantyne, 2018). The mechanisms influencing these mass-movement phenomena are dependent on soil properties, ice, and water contents (Hjort et al., 2014) and thermal regimes (Harris et al., 2001), as well as slope angle (Rowley et al., 2015). Observing and quantifying these phenomena in real environments have been done through remote sensing imagery, e.g., Mithan et al. (2021), while an excellent attempt at direct measurements has been made by Fiolleau et al. (2024) through a dense monitoring approach in Alaska, USA. In parallel, aiming for better constrains on the conditions triggering these destabilizations, laboratory-scale analog studies started at the beginning of the 1970s with the study of Higashi and Corte (1971), followed by numerous other experiments at different scales, e.g., Harris et al. (2001), and focusing on various ice-type bodies.
Among the large typology of cryospheric landforms and processes, one of the most significant markers affected by climate warming is retrogressive thaw slumps (RTSs): landslides caused by the thawing of ice-rich permafrost (Séjourné et al., 2015). As a consequence of the larger-amplitude warming at high latitudes, it is projected under RCP4.5 that there will be an increase in RTS formation to above 10 000 per decade after 2075 (Lewkowicz and Way, 2019). These RTSs represent large-scale active thermokarsts due to the thawing of exposed ground ice in the headwall to form landslide-like U-shaped scars (Lantuit and Pollard, 2008), with wide troughs and slump blocks (Swanson, 2012). The Batagay megaslump in Yakutia (Opel et al., 2019), with a length of more than 1000 m, a width of 800 m, and 60 m high headwalls, represents, in the present day, the largest and the most active identified RTS in periglacial environments.
The possible causes of present-day initiation of these RTSs are not well understood, especially when it comes to the role of the ice-rich permafrost layer in the efficiency of the process and its geometry. In addition, the various landforms observed to result from thawing are difficult to predict. One of the solutions to this includes conducting laboratory experiments that would allow us to simulate slope processes within thawing frozen fine-grained soils, with the ability to control environmental parameters, precise definition of experimental boundary conditions, and the capability to reduce the timescale of freeze–thaw cycling. This allows many years of field processes to be modeled in a relatively short time period (Harris et al., 2001). Most of the laboratory experimental studies, when done with one component mixture for the thawing-material soil, are done with sand. In the case of lightweight particles, clay or silt can be considered, but these lead to experimental difficulties due to their volatility and compactness after the melting since going back to their fine-powder initial version requires long drying and crushing. Here, we consider the solution brought about by very light polydisperse plastic particles (PPPs) due to their realistic mobility compared to fine sand particles at the scale of our simulation. We also point out the potential role of electrostatic forces between plastic particles, mimicking what we observe in the case of clay and silt materials. In addition, these types of particles are color coded according to their granulometric size and, as such, help in the visualization of cryo-induced morphological features. Our work was inspired by the study of Costard et al. (2020), in which the authors pointed out the role of the ice layer in the destabilization process by reproducing RTS analogs at the laboratory scale. Here, we continue this work with the aim of re-creating the distinctive 3D geomorphological features observed in large RTSs, such as slump blocks, using very light PPPs. Through this study, we aim to address the similitude between small-scale laboratory models and field observations. The main objective of this paper is to evaluate the applicability of this plastic media in re-creating specific 3D geomorphological thawing features, notably slump blocks, at the laboratory scale.
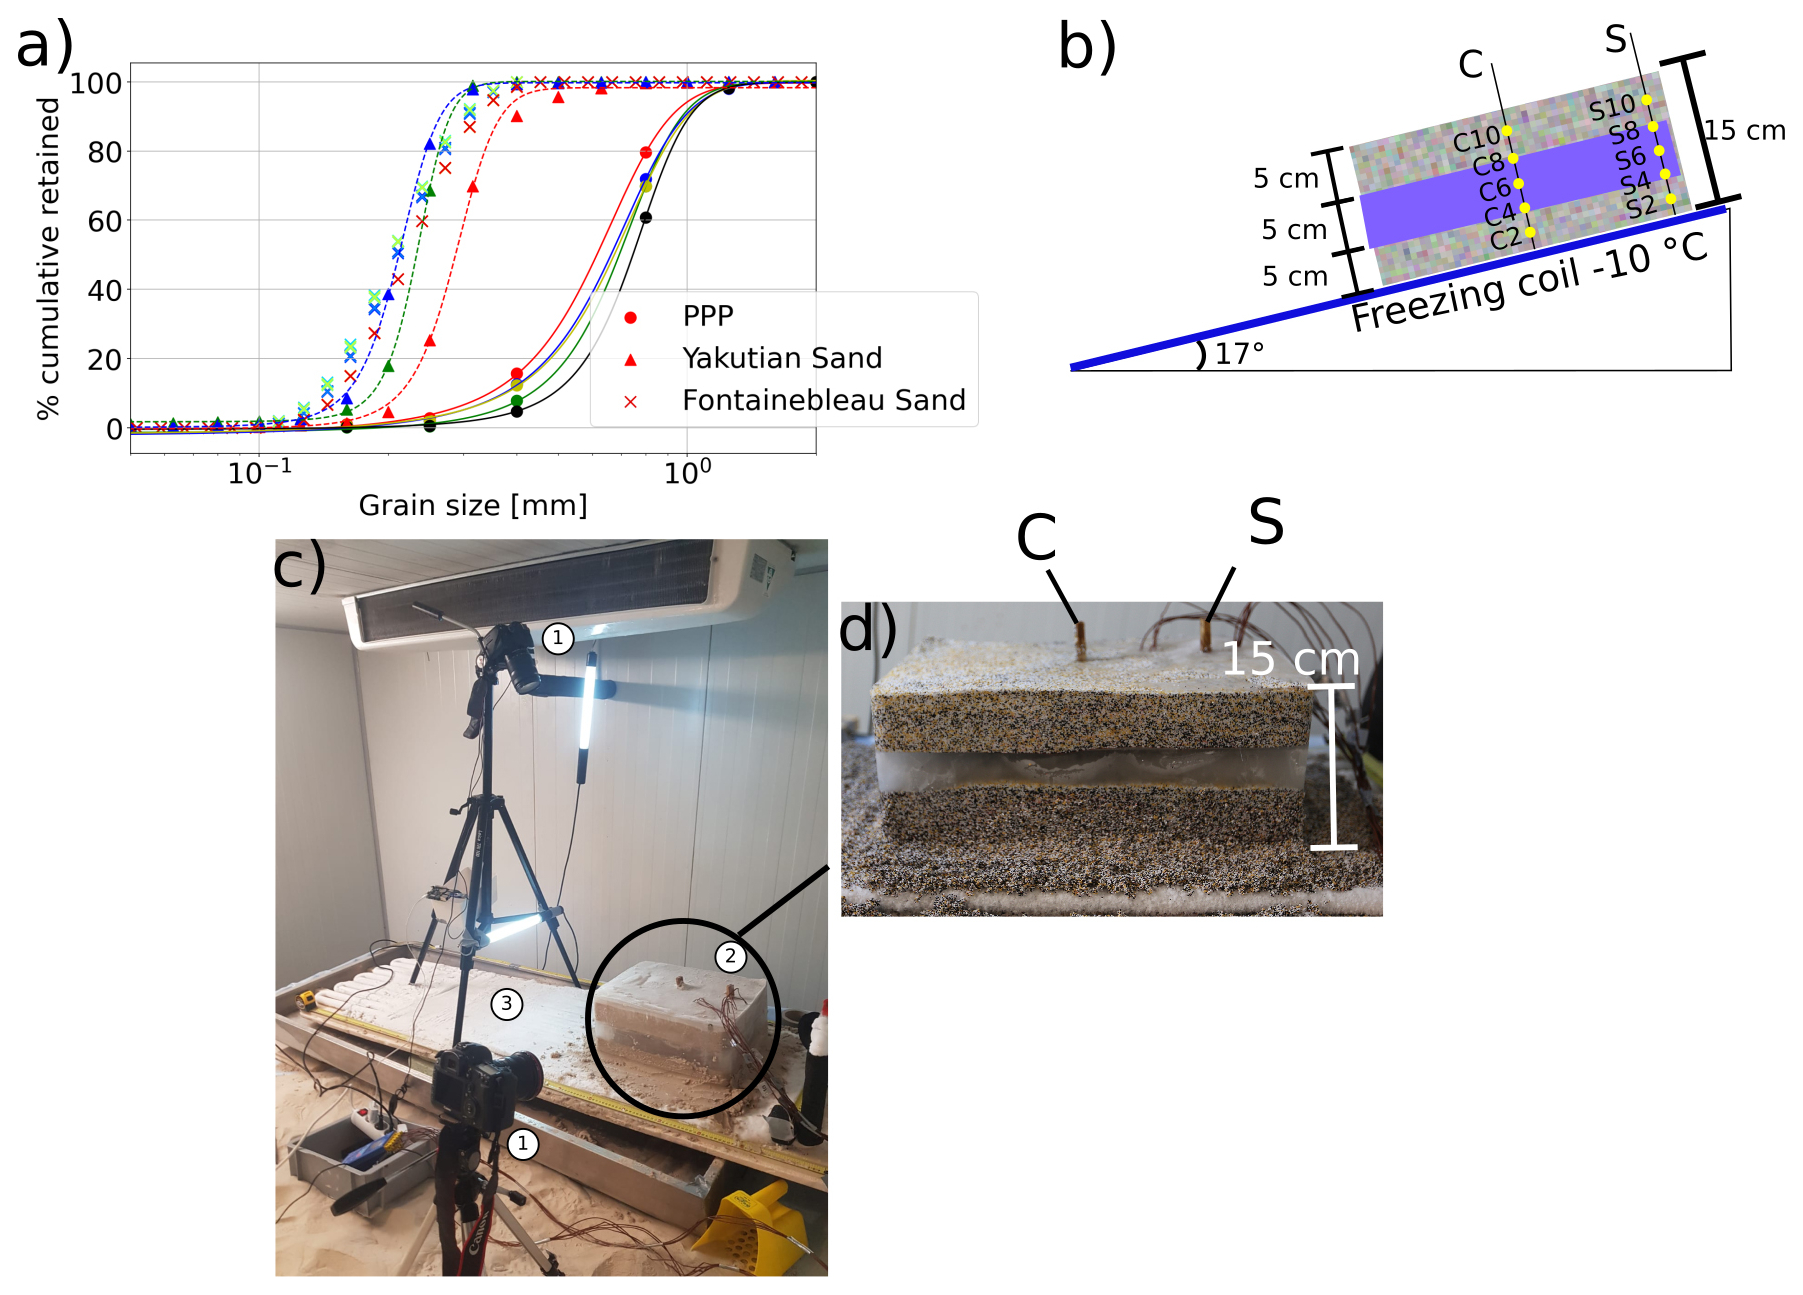
Figure 1Experimental setup: (a) granulometric curves for the polydisperse granular media (PPPs), the Fontainebleau sand (France), and the sand from central Yakutia (Gautier and Costard, 2000). The different colors represent different samples, while the dashed and plain lines represent the sigmoidal fitting. (b) Schematic of the experiment (side view), where the granular media is set on top of the cooling coil at a 17° angle relative to horizontal; the thermistors in the yellow circle at the center are labeled C, while those on the side are labeled S. (c) View of the full experiment with nadir and side cameras (1), granular material (30 cm wide × 40 cm long × 15 cm high) and thermistor strings (2), and (3) freezing coil covered with ice. (d) Zoomed-in image of the cuboid of polydisperse color-coded-by-size material before starting the thawing phase. The cables link the thermistor rods (S and C) to the data logger.
2.1 Thawing-layer material
The laboratory experiments were done with two types of material composing a frozen block where a pure-ice layer was present in the middle: Fontainebleau sand was considered here as our reference model, along with the polydisperse plastic particles (herein abbreviated to PPPs). For both materials, we manipulated the saturated sand–PPP mixtures to have a wet bulk density, in accordance with the “proctor compaction” technique (Costard et al., 2020), and froze them. We detail the two different media below.
2.1.1 Fontainebleau sand
The reference models were made of frozen saturated Fontainebleau sand from a nearby quarry made up of 99.9 % silica. The sand's physical and hydrodynamic parameters, such as the Mualem (1976) and van Genuchten (1980) parameters, ruling the soil-water hydrostatics and hydrodynamics, can be found in Léger et al. (2020), and two of them – α, ruling the capillary height and being inversely proportional to the air entry value, and Ks, the saturated hydraulic conductivity – are summarized in Table 1. The particle size distribution (PSD) was determined using a Mastersizer 3000 HYDRO-G (Malvern Panalytical Ltd.) laser diffraction particle size analyzer delivering liquid dispersion with an extended range of the particles, spanning from 0.01 to 3500 µm. The PSD is presented in Fig. 1a with cross symbology. As a comparison, we also show the PSD for Yakutian sand extracted from Gautier and Costard (2000), showing the close similarity compared to our laboratory sand. The Fontainebleau sand is particularly well defined in terms of grain size, having a ratio of 1.76, being poorly sorted, while the Yakutian sand has a ratio of about 1.3–1.4. The bulk density and porosity for the Fontainebleau sand were measured from samples using the same compaction used for the experiment, yielding 1.7 ± 0.1 g cm−3 and 0.39 ± 0.02 for porosity. The hydrodynamic and physical parameters are summarized in Table 1 under the label “Font. sand”.
2.1.2 Polydisperse plastic particles (PPPs)
We based our study on Hughes (1993)'s suggestion to use non-cohesive sediment with different densities at a lower scale for mimicking the fluvial dynamics of erosional and sedimentary processes observed in rivers at the laboratory macro-scale. Here, the novelty resides in using these particles to re-create cryo-induced geomorphological features. These polydisperse melamine particles (made from recycled plastic (Emriver, Carbondale, IL, USA)) were tested as frozen-layer material. Specific colors were associated with different particle sizes according to the manufacturer – red for 0.4 mm, brown for 0.7 mm, white for 1 mm, and yellow for 1.4 mm – for visualization purpose. These PPPs have more realistic mobility than fine sand particles at the scale of our simulation, which makes it possible to observe geomorphological analogs (Hughes, 1993) within a reasonable amount of experimental time. Since the polydispersity could induce a heterogeneous mixing, we performed particle size analysis using sieves, and the resulting PSD curves are presented in Fig. 1a with filled circles. The uniformity coefficient was calculated based on five different samples, giving an average value of 2.04, being synonymous with poorly graded soil. The bulk density and porosity for the PPPs were measured based on samples with the same compaction as the one used for the box experiment, giving 0.77 ± 0.02 g cm−3 and 0.50 ±0.02 for porosity. The saturated hydraulic conductivity Ks was determined using a KSAT apparatus (HYPROP, METER Group, Pullman, WA), giving large values of saturated hydraulic conductivity at m s−1, almost 1 order of magnitude higher than that of the Fontainebleau sand. The Mualem (1976) and van Genuchten (1980) parameter fittings of the soil–water retention function were determined using the Rosetta algorithm (Schaap et al., 2001) from the PSD. For PPP media, the α parameter was equal to 0.069 ± 0.006 cm−1, i.e., almost 3 times the value for Fontainebleau sand, synonymous to a factor of 3 in terms of the capillary height and/or air entry value. The parameters are summarized in Table 1 under the label “PPPs”.
Table 1Uniformity coefficient (Cu), particle and bulk densities (ρs and ρb), porosity (ϕ), and Mualem (1976) and van Genuchten (1980) hydrodynamic parameters for the Fontainebleau sand and the polydisperse plastic media (with α being proportional to the inverse of the air- entry value and saturated hydraulic conductivity Ks).
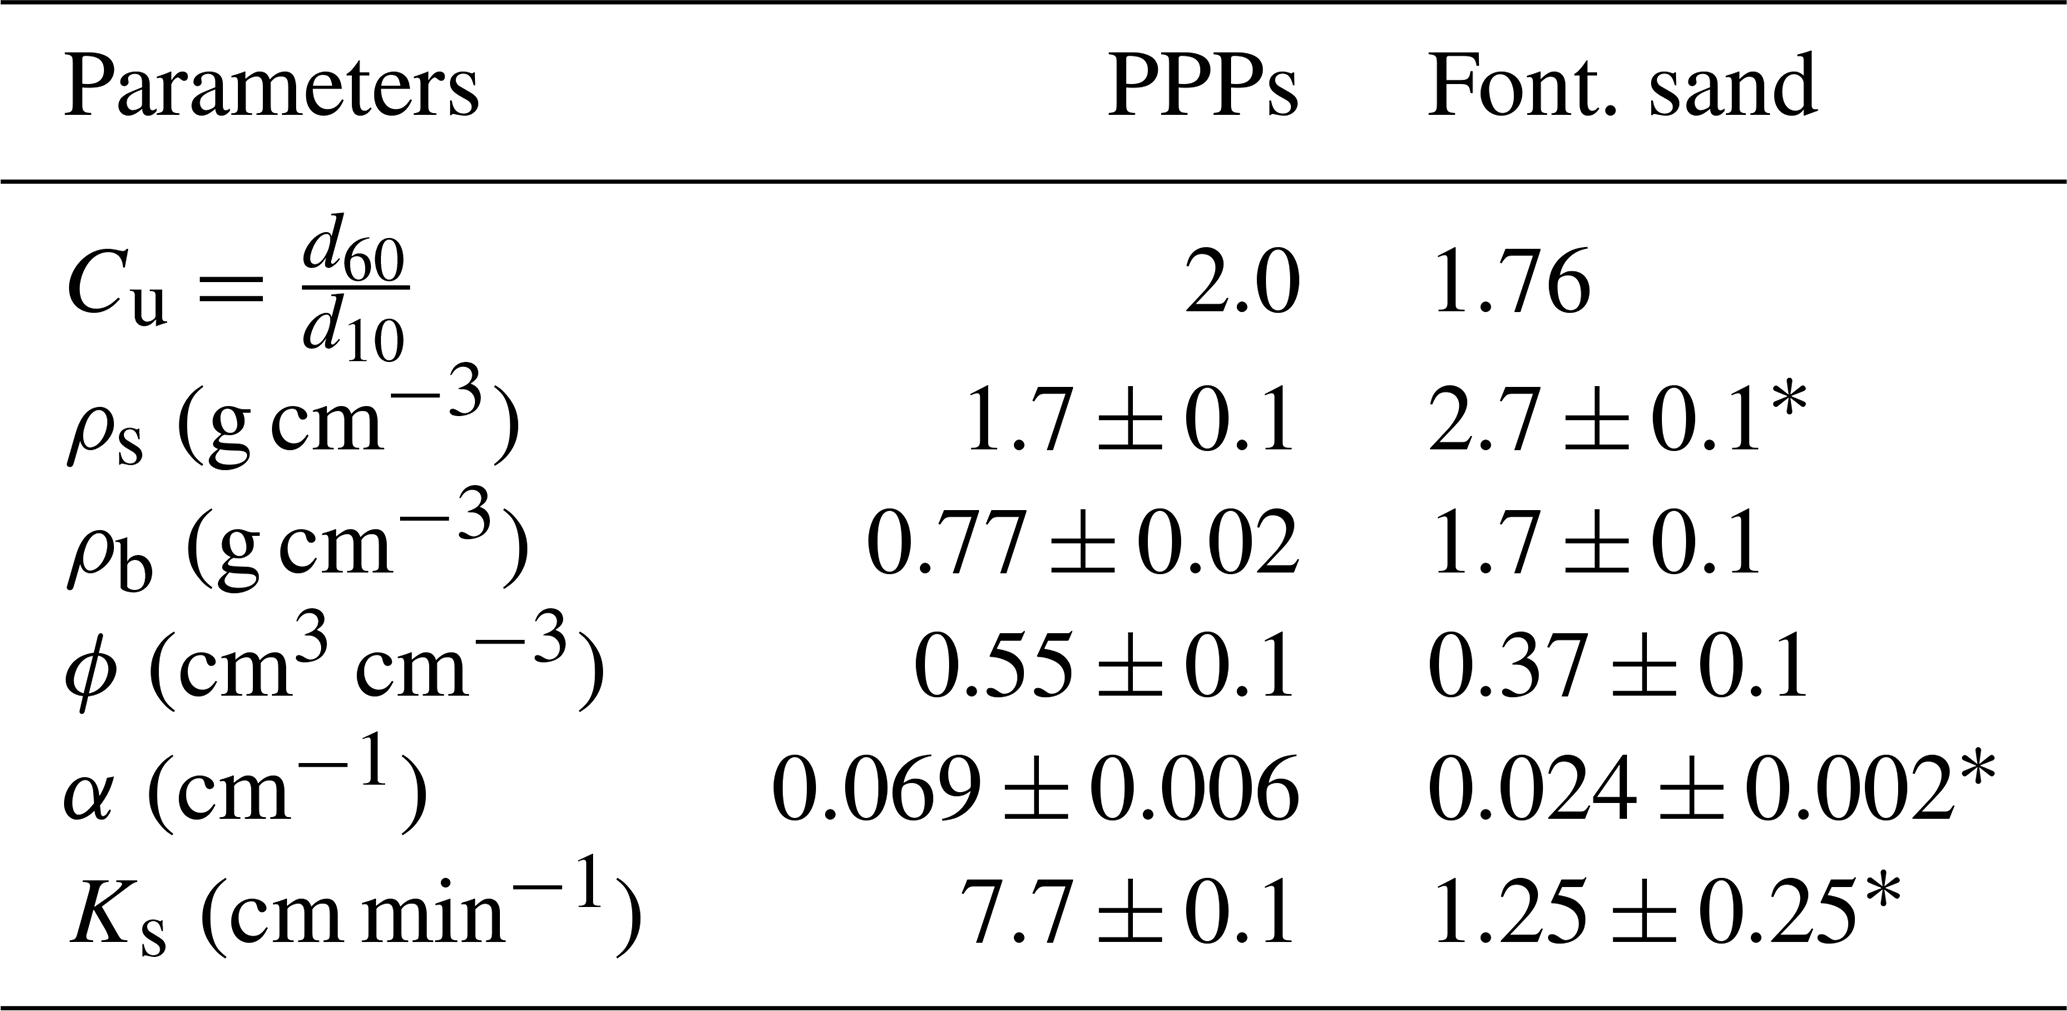
* From Léger et al. (2020).
2.2 Experimental setup
We used the cold room at the GEOPS laboratory (Paris-Saclay University, France) dedicated to the physical modeling of periglacial geomorphology (Costard et al., 2020; Léger et al., 2023). The specificity of the presented experiments resides in simulating the thawing of ice-rich frozen soil with a pure-ice layer inside, set on top of permafrost simulated with a cryostat coil at −10 °C to ensure the thermal homogeneity of the frozen sample during the first few hours of the initialization phase. The frozen layer was built with fully-water-saturated media (representing 0.55 % and 0.37 % of the volume for PPPs and Fontainebleau sand, respectively), previously frozen in a freezer at −18 °C in a cuboid plastic mold for 72 h and then set on top of the −10 °C permafrost table tilted at 17° (see Fig. 1b, c, and d). The obtained frozen material was a parallelepiped block of 30 cm width × 40 cm length × 15 cm thickness (see Fig. 1b and c); it was set on top of the dipping layer (17°) above the cryostat at −10 °C in a cold chamber maintained at atmospheric temperature (15–20 °C). The cryostat was maintained for a few hours during the initialization phase and then was shut off during the thawing process to simulate a deepening of the active layer and acceleration of the thawing. Two types of experiments were performed with both materials, the Fontainebleau sand and PPPs: layer thawing resulting from (i) frozen saturated sand–PPPs sandwiching a 5 cm pure-ice layer (5 cm sand–PPPs – 5 cm ice – 5 cm sand–PPPs), as presented here, and (ii) frozen saturated homogeneous sand–PPPs (15 cm thick), available in the Supplement.
2.3 Temperature and optical monitoring
Two thermal-monitoring positions were set vertically every 2 cm (with the origin at the permafrost table, the position are at 2, 4, 6, 8, and 10 cm height): in the center (labeled C) and on the upward side (labeled S) of the block to quantify the side effects (see Fig. 1b, c, and d). The sensors, a string of 10 thermistors (PT100, ± 0.1 °C), monitored the block temperature at 10 min intervals. The sensors were set inside the block before the initial freezing.
During the experiments, the block surface deformation was optically monitored with two Canon EOS 550D cameras triggered with Raspberry-Pi-based time lapse triggers (Witty-Pi board (UUGear) and gphoto2 library) at 30 min intervals (see the placement in Fig. 1c). These measurements were carried out until geomorphological activity ceased.
2.4 Degradation quantification
The degradation was measured based on the block surface variations observed at almost nadir angle using one of the cameras (camera labeled “1” in Fig. 1c). The degradation was compiled relative to the initial surface area in terms of area change percentages. We measured the area of each detached slump block through time, as well as the initial block deformation (Fig. 2a and b). We are aware that we were creating a bias in the degradation between the two thermal measurement rods (see Fig. 1b, c, and d), but no technical solution was found to maintain the sensor positions without keeping a vertical rod in place. We also stress that we are aware of the thermal side effects on the block; however, as all the experiments were carried out with the same bias, the inter-comparison was possible. We used QGIS (https://www.qgis.org, last access: May 2025) to geo-reference, with the local geometrical projected system, each picture by applying the same ortho-rectification to them based on the first picture (known initial dimension of 30 × 40 × 15 cm3) and using the measuring tapes present in pictures. We chose eight snapshots of each experiment to calculate the non-degraded area left in place, as well as the degraded-block area. As the pixel size represents 0.2 mm × 0.2 mm, we overestimated the uncertainty by assuming a 20-pixel uncertainty for each pick, propagating the uncertainty on the surface computation.
A total of 10 experiments have been carried out, testing the material–water mixing ratio, the temporal and spatial scales, and the time needed to freeze and thaw. In this paper, we present, in detail, only one set of experimental results for PPP and Fontainebleau sand materials and one scenario (ice layer cases), while the homogeneous cases are presented in the Supplement to illustrate the role of the ice layer in destabilization. The degradation experiments are presented in Fig. 2a and b for Fontainebleau sand and PPP material, respectively. In each sub-figure in Fig. 2, the inset (i) represents the temperature time series measured in the block (side and center), while insets (ii)–(ix) are snapshots monitoring the degradation at eight time slices.
3.1 Fontainebleau sand experiment
3.1.1 Temperature and degradation monitoring
The temperature time series measured for the Fontainebleau sand reference block are presented in Fig. 2a(i), accompanied by the colored degraded area for eight different time lapses and two pictures from which the degraded areas are calculated as an example (presented in Fig. 2a(ii) to (ix)). For the thermal time series, as in Fig. 2a(i), three main stages were recorded during the warming phase. The block started at −18 °C and was placed over the cryostat at −10 °C, followed by a rapid increase in the block temperature up to the phase change (approximately the first 5 h). The second stage corresponds to the latent heat release, with a typical zero-curtain effect (between 5 and 22 h). The third stage starts at the stop of the basal-cooling coil (“cryo-off” at 22 h, as presented in Fig. 2a), with a subsequent warming of the block up to positive temperatures. As expected, the center sensors (C2 to C10) follow a less steep temperature increase rate than the side sensors (S2 to S10). The experiment was shut down when geomorphological activity ceased completely. The forms of degradation exhibited (Fig. 2a(ii) to (ix)) – in particular, the pictures in (xi)–b – are similar to RTS phenomena, where the vertical structure of the detached block is not kept and where horizontal translation is strong. In addition, a vertical subsidence is observed in the main block due to the water draining out of it, as is in visible in the snapshot taken at 22.4 h in Fig. 2a(ix)–b). The homogeneous case, as presented in the Supplement, did not present any geomorphological activity or deterioration during the experiment.
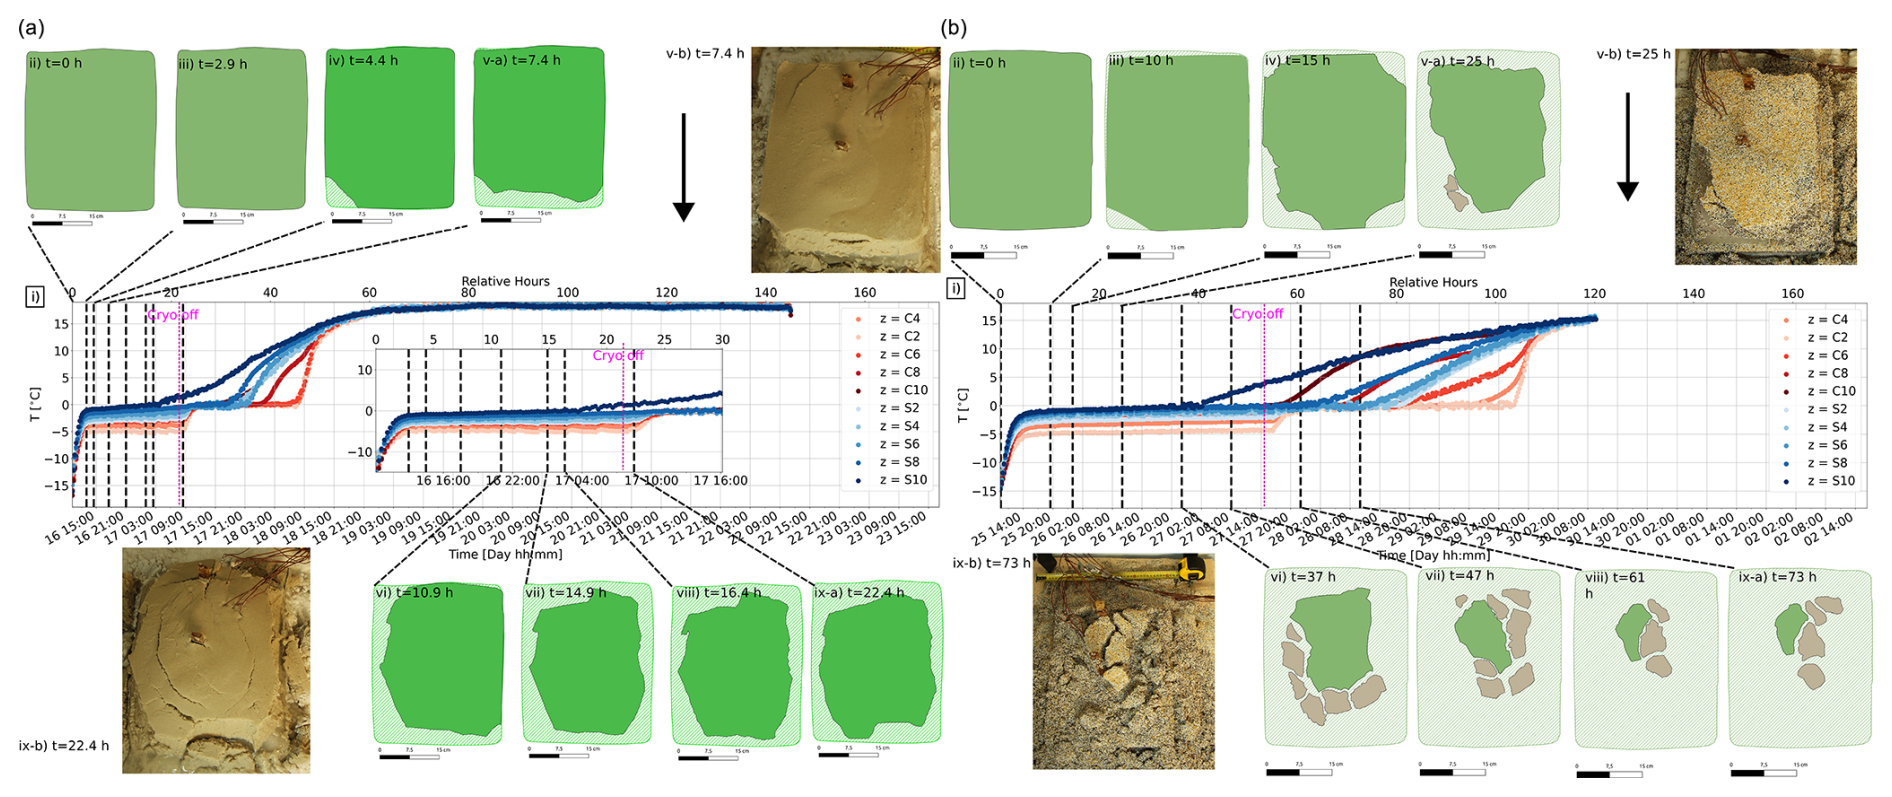
Figure 2(a) (i) Thermal and (ii)–(ix) degradation time series for the ice layer Fontainebleau sand case. In (i), the red color map represents the center thermal-monitoring positions in centimeters, while the blue color map represents the upper side-monitoring position in centimeters. The inset is a zoomed-in image of the first 30 relative hours. The cryo-off vertical purple line symbolizes the stop of the cold basal coil. Insets (ii)–(ix) symbolize the degradation area extracted from the snapshots, where the stripped green is the initial area, while the green is what is left in place at each time lapse. Two pictures ((v)–b and (ix)–b) from which the degradation areas at 7.4 and 22.4 h are extracted are shown. The black arrow symbolizes slope direction. (b) (i) Thermal and (ii)–(ix) degradation time series for the ice layer case using PPPs. The red color map represents the center thermal-monitoring positions in centimeters, and the blue color map represents the upper-side-monitoring position in centimeters. The cryo-off vertical purple line symbolizes the stop of the cold basal coil. Drafts symbolize the degradation area extracted from snapshots, where the stripped green is the initial area, the green is what is left in place at each time lapse, and the light gray corresponds to the detached slump block. Two pictures from which the degradation areas at 25 and 73 h are extracted are shown. A side close-up is available in Fig. S1 in the Supplement.
3.2 PPP experiment
3.2.1 Temperature and degradation monitoring
The temperature time series measured for the PPP block are presented in Fig. 2b, accompanied by the colored degraded area at eight different time lapses and two pictures from which the degraded areas are calculated (Fig. 2b(ii) to (ix)). Similarly to what has been observed for the reference Fontainebleau sand case, three main stages during the thawing phase were recorded. In the first stage, we observe a rapid increase in the block temperature up to the phase change (approximately the first 8 h). The second stage corresponds to the latent heat release, with a typical zero-curtain effect (between 8 and 55 h for the ice layer case presented in Fig. 2b). The third stage starts at the stop of the basal-cooling coil (“cryo-off” at 55 h, as presented in Fig. 2b), with a subsequent warming of the block up to positive temperatures. In all cases, the experiment was shut down when geomorphological activity ceased. Similarly to what has been observed for the Fontainebleau sand cases, the temperature is warmer on the side (in blue) of the block compared to at the center, as expected (warming faster on the sides) due to side effects. The geomorphological degradation is strong and illustrated by a vertical block separated from the main block. The vertical structure of the block is kept for a certain time before it loses its cohesion. These blocks are similar to slump blocks observed in the field (Swanson, 2012). They start to appear after 10 h of experiment time, even before the shutdown of the cooling coil. Compared with the homogeneous case in the Supplement, the temperature dynamic seems to be similar in terms of thawing. One can observe, however, that the thawing and the destabilization are faster in the ice layer case, indicating that the ice layer is disturbing the integrity of the block by decreasing its cohesion (Costard et al., 2020).
3.3 Fontainebleau sand versus PPP experiment comparisons
For both materials, there is a stable phase after the cryo-off and then a rapid increase in soil temperature, which is notably faster for frozen sand (with steeper thermal curves) than for frozen PPPs (see Fig. 2a and b). This stable phase after the cryo-off can be explained by the presence of the ice layer, which maintains a low temperature, as already pointed out by Costard et al. (2020), and by comparing with the homogeneous cases presented in the Supplement. We calculated the onset and the evolution of degradation for each experimental setup using the area percentage extracted from snapshots. The degradation evolution for the two types of shown experiments (the two homogeneous cases are available in the Supplement) is summarized in Fig. 3. The degradation is dramatic for the PPPs in comparison to the Fontainebleau sand case. The ice layer induces a longer onset of degradation than the one for the homogeneous model for sand and PPPs. In more detail, it appears to be the case that the impact of the warming phase is more progressive with the PPPs than for the sand experiment. Beyond the degradation, the geomorphological features observed with the PPPs are similar to slump blocks, while the sand thawing does not allow for the creation of such features (a zoomed-in side view of the slump block is visible in Fig. S1).
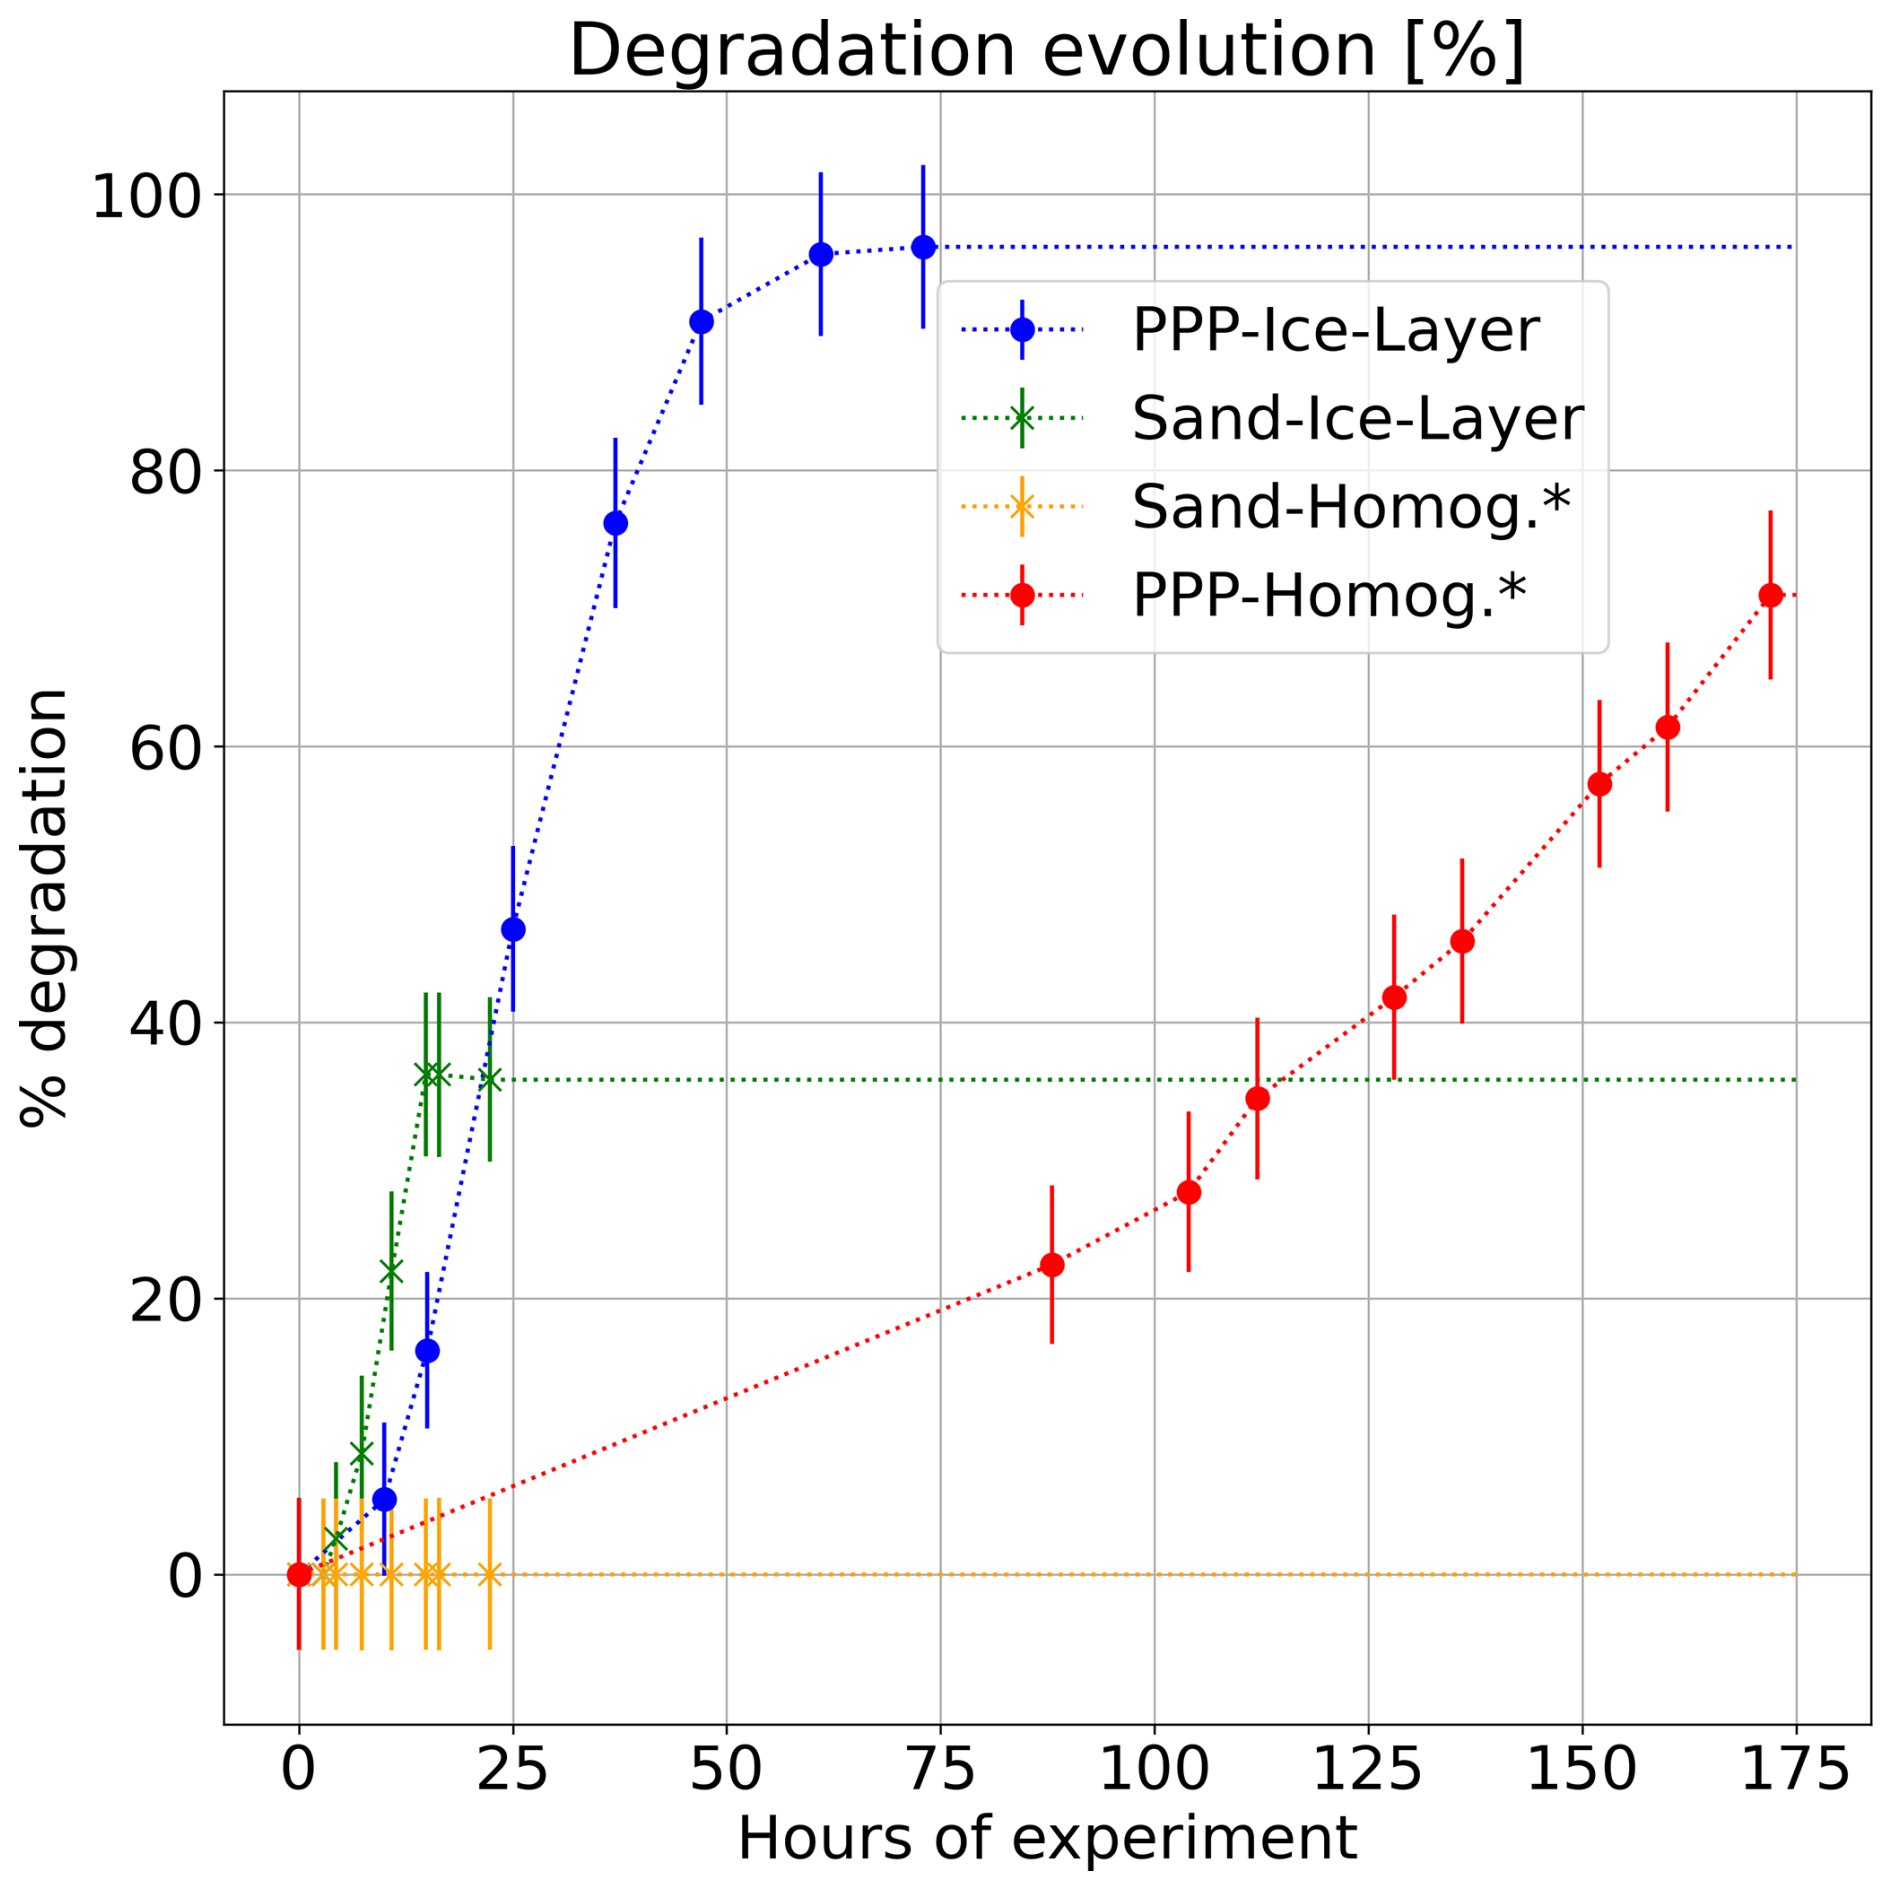
Figure 3Percentage of degradation through time for the four types of experiments. Filled circles correspond to the PPP experiments (red for the homogeneous case in the Supplement and blue for the ice layer cases in Fig. 2b), while the crosses correspond to the sand experiments (yellow for the homogeneous case in the Supplement and green for the ice layer case in Fig. 2a). The * marks experiments available in the Supplement.
The experiments using PPPs induce a larger thermal degradation than those done with the reference sand model and, most importantly, allow us to simulate the creation of a fracture network and slump blocks, features not present in the sand experiment (see Figs. 2b and S1). The presence of an ice layer induces a higher onset of erosional degradation (earlier start and longer phase of degradation) than is the case in the homogeneous model due to the melting of the ice layer, as already pointed out by Costard et al. (2020).
The size, geometry, and ice layer within the frozen soil represent a simplification of the natural settings, but the main objective here was to test the influence of lightweight material in permafrost degradation from a 3D geomorphological point of view. The reference model (Fontainebleau sand) exhibits a slight evolution mostly based on destabilization processes, while the heterogeneous one with PPPs showed dramatic evolutions (slump blocks).
The analysis of the time lapse images showed that the evolution of the individual slump block towards a rather hummocky morphology, similarly to the development of RTSs in natural periglacial environments. Our experiments clearly show the individual detachments and vertical subsidence of individual blocks and the subsequent formation of slope destabilization due to the cohesionless particles during thawing of the ice-rich frozen sample.
In these experiments, we assumed that the scale effect was not a limiting factor. The size of the block allows for reasonable side effects. During the warming phase, the collapsed blocks along the sides remain low (up to 2 cm from the side). Here, we restricted our approach to the relative importance of the PPP material versus fine sand material and their ability to produce 3D degradation morphologies like the ones observed along the RTS in the field. The study of the size influence on the flow and sedimentary behavior is beyond the scope of this research. We focused, here, on mimicking experimentally special geomorphological features using PPPs as a first test.
Beyond the PSD difference between the two types of used material, we clearly benefit from the size variability of the PPPs compared to the very narrowly defined PSD of the Fontainebleau sand; we stress that the saturated hydraulic conductivity Ks and capillary forces (α and air entry values) play a major role in the degradation phenomena we observe. Indeed, there is a difference of almost 1 order of magnitude in the saturated hydraulic function and a 300 % difference in the α parameter, synonymous with the air entry value. These large differences in the water retention favor the creation of fractures for the PPP media, allowing for easier creation of the slump blocks. In addition, the bulk density difference allows us to create phenomena only observed in the case of clay particles in active layer. We also point out the potential role of electrostatic forces between plastic particles, mimicking, to a certain extent, what we observe in the case of clay layer and probably allowing for the cohesion of the block through time. We do believe that using these types of plastic or melamine particles is an excellent alternative for modeling geomorphologically cryo-induced degradation. Our laboratory results are in agreement with recent investigations along the Batagay thaw slump in Yakutia, where the presence of an icy layer is the precondition for its deep incision (Opel et al., 2019).
Our experiments demonstrate the ability of polydisperse plastic material to replicate specific features of permafrost degradation, notably slump blocks, at the laboratory scale within a reasonable amount of experimental time. We compared this material with classical sand used in laboratory analogs and different interfaces (homogeneous, ice layer) to observe the geomorphological advantages in using such particles. Considering their light density and peculiar hydrodynamic parameters, we showed that new geomorphological cryo-induced features could be modeled at the laboratory scale within thawing experiment.
We demonstrate the potential of using polydisperse melamine particles for the aim of mimicking the permafrost degradation and the landslide processes found in periglacial environments. The use of PPP media demonstrates its ability to correctly mimic typical periglacial morphologies in 3D, such as slump blocks under warming conditions at a relatively short timescale. Even if the permafrost thawing process is simplified in our experiments, we have highlighted how the presence of an ice layer deeply influences the efficiency of the thermokarst phases that are qualitatively relevant to the evolution of periglacial systems under recent warming. Further investigations are needed to determine the scaling relations between parameters, which allow the transposition of similarity between models and prototypes. This implies the use of dimensionless parameters, such as the densimetric Froude number, the grain size Reynolds number, and the Engelund–Hansen formula; this is similar between the analog and the field model. We also plan to complement the surface change with time lapse 3D reconstructions using photogrammetry or laser scanning. We are aware that the role of positive pore pressure is crucial for the development of RTSs and that the rheological properties of sand vs. PPPs are needed to fully quantify the dynamics of thaw vs. flow. This will be the subject of further studies.
Codes are available from the corresponding author upon request.
Data are available upon from the corresponding author request.
The supplement related to this article is available online at https://doi.org/10.5194/tc-19-2037-2025-supplement.
EL, FC, and RL performed the cold-room experiments. EL, RL, ASa, and ML performed the lab experiments. EL, FC, and RL performed data curation. EL, FC, RL, and ASé did the formal analysis. EL and FC provided the experimental resources. EL and FC performed the funding acquisition. EL and FC wrote the original paper, and all of the authors conducted the reviews and editing.
The contact author has declared that none of the authors has any competing interests.
Publisher’s note: Copernicus Publications remains neutral with regard to jurisdictional claims made in the text, published maps, institutional affiliations, or any other geographical representation in this paper. While Copernicus Publications makes every effort to include appropriate place names, the final responsibility lies with the authors.
We thank Anne Morgenstern for her excellent work as the editor of this paper, and we thank one anonymous reviewer and Di Wang for the reviews and remarks which improved the paper substantially. The authors thank the PANOPLY analytical platform (GEOPS-LSCE). This article is dedicated to Élie Lambert-Bieuzent.
This paper was edited by Anne Morgenstern and reviewed by Di Wang and one anonymous referee.
Ballantyne, C. K.: Periglacial geomorphology, John Wiley & Sons, 472 pp., ISBN 978-1-4051-0006-9, 2018. a
Costard, F., Dupeyrat, L., Séjourné, A., Bouchard, F., Fedorov, A., and Saint-Bézar, B.: Retrogressive Thaw Slumps on Ice-Rich Permafrost Under Degradation: Results From a Large-Scale Laboratory Simulation, Geophys. Res. Lett., 48, e2020GL091070, https://doi.org/10.1029/2020GL091070, 2020. a, b, c, d, e, f
Fiolleau, S., Uhlemann, S., Shirley, I. A., Wang, C., Wielandt, S., Rowland, J., and Dafflon, B.: Insights on seasonal solifluction processes in warm permafrost Arctic landscape using a dense monitoring approach across adjacent hillslopes, Environ. Res. Lett., 19, 044021, https://doi.org/10.1088/1748-9326/ad28dc, 2024. a
Gautier, E. and Costard, F.: Les systèmes fluviaux à chenaux anastomosés en milieu périglaciaire: la Léna et ses principaux affluents (Sibérie centrale), Géogr. Phys. Quatern., 54, 327–342, https://doi.org/10.7202/005647ar, 2000. a, b
Harris, C., Rea, B., and Davies, M.: Scaled physical modelling of mass movement processes on thawing slopes, Permafrost Periglac., 12, 125–135, 2001. a, b, c
Higashi, A. and Corte, A. E.: Solifluction: a model experiment, Science, 171, 480–482, 1971. a
Hjort, J., Ujanen, J., Parviainen, M., Tolgensbakk, J., and Etzelmüller, B.: Transferability of geomorphological distribution models: Evaluation using solifluction features in subarctic and Arctic regions, Geomorphology, 204, 165–176, 2014. a
Hughes, S. A.: Physical models and laboratory techniques in coastal engineering, vol. 7, World Scientific, 588 pp., https://doi.org/10.1142/2154, 1993. a, b
Lantuit, H. and Pollard, W.: Fifty years of coastal erosion and retrogressive thaw slump activity on Herschel Island, southern Beaufort Sea, Yukon Territory, Canada, Geomorphology, 95, 84–102, 2008. a
Léger, E., Saintenoy, A., Coquet, Y., Tucholka, P., and Zeyen, H.: Evaluating hydrodynamic parameters accounting for water retention hysteresis in a large sand column using surface GPR, J. Appl. Geophys., 182, 104176, https://doi.org/10.1016/j.jappgeo.2020.104176, 2020. a, b
Léger, E., Saintenoy, A., Serhir, M., Costard, F., and Grenier, C.: Brief communication: Monitoring active layer dynamics using a lightweight nimble ground-penetrating radar system – a laboratory analogue test case, The Cryosphere, 17, 1271–1277, https://doi.org/10.5194/tc-17-1271-2023, 2023. a
Lewkowicz, A. G. and Way, R. G.: Extremes of summer climate trigger thousands of thermokarst landslides in a High Arctic environment, Nat. Commun., 10, 1329, https://doi.org/10.1038/s41467-019-09314-7, 2019. a
Mithan, H., Hales, T., and Cleall, P.: Topographic and ground-ice controls on shallow landsliding in thawing Arctic Permafrost, Geophys. Res. Lett., 48, e2020GL092264, https://doi.org/10.1029/2020GL092264, 2021. a
Mualem, Y.: A new model for predicting the hydraulic conductivity of unsaturated porous media, Water Resour. Res., 12, 513–522, 1976. a, b, c
Opel, T., Murton, J. B., Wetterich, S., Meyer, H., Ashastina, K., Günther, F., Grotheer, H., Mollenhauer, G., Danilov, P. P., Boeskorov, V., Savvinov, G. N., and Schirrmeister, L.: Past climate and continentality inferred from ice wedges at Batagay megaslump in the Northern Hemisphere's most continental region, Yana Highlands, interior Yakutia, Clim. Past, 15, 1443–1461, https://doi.org/10.5194/cp-15-1443-2019, 2019. a, b
Rowley, T., Giardino, J. R., Granados-Aguilar, R., and Vitek, J. D.: Periglacial processes and landforms in the critical zone, in: Developments in earth surface processes, vol. 19, 397–447, Elsevier, https://doi.org/10.1016/B978-0-444-63369-9.00013-6, 2015. a
Schaap, M., Feike, J., and van Genuchten, M.: ROSETTA: a computer program for estimating soil hydraulic parameters with hierarchical pedutransfert functions, J. Hydrol., 251, 163–176, 2001. a
Séjourné, A., Costard, F., Fedorov, A., Gargani, J., Skorve, J., Massé, M., and Mège, D.: Evolution of the banks of thermokarst lakes in Central Yakutia (Central Siberia) due to retrogressive thaw slump activity controlled by insolation, Geomorphology, 241, 31–40, 2015. a
Swanson, D.: Monitoring of retrogressive thaw slumps in the Arctic Network, 2011: Three-dimensional modeling of landform change, Natural Resource Report NPS/ARCN/NRDS–2012/247. National Park Service, Fort Collins, Colorado, 60 pp., https://doi.org/10.13140/RG.2.2.23389.00489, 2012. a, b
van Genuchten, M. T.: A Closed form equation for predicting the hydraulic conductivity of unsaturated soils, Soil Sci. Soc. Am. J., 44, 892–898, 1980. a, b, c