the Creative Commons Attribution 4.0 License.
the Creative Commons Attribution 4.0 License.
 | 07 Apr 2025
Separating the albedo-reducing effect of different light-absorbing particles on snow using deep learning
Lou-Anne Chevrollier
Adrien Wehrlé
Joseph M. Cook
Norbert Pirk
Liane G. Benning
Alexandre M. Anesio
Martyn Tranter
Several different types of light-absorbing particles (LAPs) darken snow surfaces, enhancing snowmelt on glaciers and snowfields. LAPs are often present as a mixture of biotic and abiotic components at the snow surface, yet methods to separate their respective abundance and albedo-reducing effects are lacking. Here, we present a new optimisation method enabling the retrievals of dust, black carbon, and red algal abundances and their respective darkening effects from spectral albedo. This method includes a deep-learning emulator of a radiative transfer model (RTM) and an inversion algorithm. The emulator alone can be used as a fast and lightweight alternative to the full RTM with the possibility to add new features, such as new light-absorbing particles. The inversion method was applied to 180 ground field spectra collected on snowfields in southern Norway, with a mean absolute error on spectral albedo of 0.0056, and surface parameters that closely matched expectations from qualitative assessments of the surface. The emulator predictions of surface parameters were used to quantify the albedo-reducing effect of algal blooms, mineral dust, and dark particles represented by black carbon. Among these 180 surfaces, the albedo reduction due to light-absorbing particles was highly variable and reached up to 0.13, 0.21, and 0.25 for red algal blooms, mineral dust, and dark particles respectively. In addition, the effect of a single LAP was attenuated by the presence of other LAPs by up to 2–3 times. These results demonstrate the importance of considering the individual types of light-absorbing particles and their concomitant interactions for forecasting snow albedo.
- Article
(3992 KB) - Full-text XML
- BibTeX
- EndNote


Snow albedo is a key component of the Earth's radiation budget; therefore it is important to both understand and model the drivers of snow albedo variability to project future snowmelt and climate (Flanner et al., 2011). In particular, the darkening effect of light-absorbing particles (LAPs) constitutes a major source of uncertainty for snow albedo in regional and global climate models (Skiles et al., 2018; Dumont and Tuzet, 2022). This uncertainty is notably due to the variability in the apparent optical properties of LAPs, which determine their impact on surface albedo. The apparent optical properties depend on microscopic and macroscopic parameters, such as the size distribution, shape, and refractive index of the particles; the mixing state of the particles with the snow grains; the distribution and abundance of the particles in the snowpack; the shape and size of the snow grains; the surface roughness; and the snowpack depth and illumination conditions (Flanner et al., 2021; He, 2022). It is clearly challenging to both measure all these parameters in the field and constrain all of these parameters in models. Hence, uncertainties in field measurements and model parameterisations are propagated in forward-modelling experiments aiming at quantifying the impact of LAPs on snow surface albedo.
By contrast, inverse modelling approaches consider the impact of LAPs in snow directly from their measured apparent optical properties instead of prescribing all the above parameters, circumventing some of the uncertainty associated with forward-modelling experiments. In addition, inverse methods offer a remote-only approach to detecting and quantifying LAPs in hard-to-access areas and/or over spatial scales that are too large to cover on foot. They are hence particularly relevant in the context of ongoing (e.g. PRISMA, EnMAP) and emerging (e.g. SBG) satellite missions, providing remotely sensed reflectance imagery at high spectral resolution. Inverse methods using physically based models have been developed to retrieve the abundance and impact of LAPs using look-up tables (e.g. Donahue et al., 2023; Chevrollier et al., 2023) or simplified analytical formulas (e.g. Dumont et al., 2017; Kokhanovsky et al., 2021), but these methods are limited in the number of parameters that can be accounted for. They therefore focus on a single LAP type or merge all LAPs together. In particular, methods using look-up tables are advantageous in that they compare observations with model outputs directly, but the size of look-up tables grows exponentially as new parameters are included; hence they are usually not adapted to discriminate between LAPs. To our knowledge, only one study has developed an inverse method to discriminate between biotic and abiotic LAPs, using optimal estimation (Bohn et al., 2021). However, consideration of LAPs separately is necessary because (1) each type of LAP impacts snow albedo differently; (2) the impact of a given LAP depends on the presence of other LAPs (Skiles and Painter, 2018; Kaspari et al., 2014); and (3) their future presence, abundance, and impact on snow surfaces depend on different processes, although feedbacks between LAPs can exist (McCutcheon et al., 2021; Harrold et al., 2018). For example, the presence of black carbon depends mainly on the burning of fossil fuels and forests (Bond et al., 2013), while the presence of dust and algae is more dependent on the climate, such as droughts, dust storms, or environmental conditions sustaining microbial life (Skiles et al., 2018). Developing inverse methodologies discriminating between LAPs is therefore necessary to deepen our understanding of snow surfaces and the role of LAPs in future snowmelt and to improve and validate existing albedo models, particularly in their representation of snow algae (Flanner et al., 2021).
Here, we aim at building an efficient, robust, and unbiased inversion scheme able to simultaneously retrieve red algal, mineral dust, and black carbon abundances and darkening effects from spectral surface albedo. We first integrated new empirical optical properties for red snow algae and snow liquid water content (LWC) in the radiative transfer model (RTM) BioSNICAR, then we built a deep-learning emulator of the model and an inversion algorithm utilising this emulator. We present the performance and benefits of the emulator in comparison to the original RTM, explore the robustness of the inversion algorithm, and then apply this new method to field spectra collected in Norway. Finally, we discuss the potential of the method to be upscaled to airborne imagery.
2.1 Inversion scheme
The inversion scheme is based on the open-source RTM BioSNICAR v2.2 (Cook et al., 2025), a Python translation of the SNICAR model (Flanner et al., 2021). Directly optimising BioSNICAR would have been too computationally expensive; hence we built and used a deep-learning neural network emulator of the RTM in order to improve the efficiency of the inversion and notably (1) accelerate the forward runs used in the optimisation algorithm prior to the gradient computation and (2) accelerate the gradient computation by leveraging the automatic differentiation framework of TensorFlow (Jouvet, 2023). A training dataset of simulations of the original RTM was first generated (Sect. 2.1.1) and used to build the emulator (Sect. 2.1.2), which was then coupled to an optimising algorithm (Sect. 2.1.3) to invert spectral albedo for surface properties, including the darkening effect of light-absorbing particles.
2.1.1 Radiative transfer model simulations
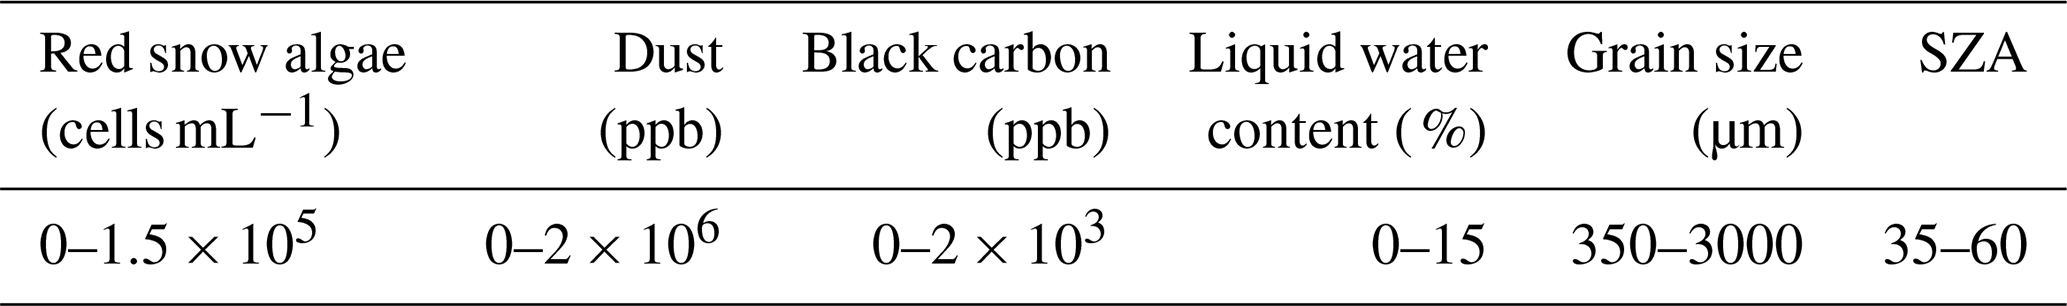
The RTM BioSNICAR simulates the bihemispherical albedo of snow and ice surfaces by solving the two-stream radiative transfer equations. The model regards the snowpack as homogeneous and plane-parallel, and an infinite number of layers with varying snow grain size and shape, density, and light-absorbing particle concentrations can be prescribed. Several types of incident irradiance can be selected in the model, notably varying with the solar zenith angle. The capabilities and physical equations of the model are similar to the latest SNICAR version and are detailed in Flanner et al. (2021) and Whicker et al. (2022). Here, the RTM was parameterised with two snow layers of 0.02 and 100 m with varying physical and biological properties (LAP concentrations, snow grain size, liquid water content, and solar zenith angle), representing snow as a granular medium. The upper layer contained black carbon, mineral dust, and red snow algae, and the two snow layers had the same snow grain size and liquid water content. Snow grains were represented by spheres as per the original formulation of the SNICAR model (Wiscombe and Warren, 1980; Flanner et al., 2021). Recent work showed that light penetration in snow is better represented using irregularly shaped grains (e.g. Robledano et al., 2023), notably yielding more accurate retrievals of snow specific surface area (SSA), but here we chose to use spherical grains mainly because (1) one objective of this study was to incorporate liquid water in snow using the validated framework of Donahue et al. (2022), which is based on spherical grains, and (2) the main focus of the study was the retrieval of light-absorbing particles rather than snow physical properties; hence spherical-equivalent snow SSAs were deemed appropriate. Future developments of the emulator may consider more realistic physical representations of snow, such as a collection of hexagonal plates (Whicker et al., 2022), irregularly shaped grains (Picard and Libois, 2024), or a random mixture of ice and air phases characterised by their mean chords (Malinka, 2023). A 2 cm depth was chosen for the upper layer, as this depth was used to quantify algal cells in recent field studies (Engstrom et al., 2022; Healy and Khan, 2023); hence the LAP concentrations represent 2 cm equivalents. The second layer was chosen as semi-infinite to remove the dependency of the spectral albedo on the underlying surface; hence the simulations do not represent very thin snowpacks. The illumination was set as direct-beam mid-latitude summer irradiance for different solar zenith angles (SZAs). The density was kept constant at 600 kg m−3 because it minimally impacts the spectral albedo in comparison to the snow grain size, which is here an effective optical grain size (Warren, 1982; Gardner and Sharp, 2010) that covers realistic ranges of snow specific surface area for melting snow (1–10 m2 kg−1; Dumont et al., 2017; Tuzet et al., 2020). The parameter ranges for the simulations are given in Table 1. These ranges were not linear but rather manually designed by creating homogeneous meshes, accounting for radiative transfer non-linearity.
Table 1Parameter ranges used in the RTM simulations for the training of the emulator.
The liquid water content (LWC) in snow was implemented in the RTM following the methodology of Flanner et al. (2021) and Donahue et al. (2022). Firstly, the optical properties of 5000 individual water and ice spheres with log-spaced radii ranging from 0.05 to 10000 µm were generated from water and ice refractive indices using the miepython package (Prahl, 2023). The ice refractive index was the one compiled from Picard et al. (2016) and Warren and Brandt (2008) as described in Flanner et al. (2021), and the water refractive index was a compilation between the dataset at 0 °C from Rowe et al. (2020) beyond 0.7 µm and the dataset from Segelstein (1981) below 0.7 µm. Then, the optical properties of log-normally distributed water and ice spheres were computed for a given effective radius (Flanner et al., 2021) and mixed using a volume-weighted average depending on the LWC (Donahue et al., 2022). For the light-absorbing particles, the optical properties of black carbon (BC) and dust were directly available in the model. For BC, we used the uncoated BC optical properties from Flanner et al. (2012), and for the dust we used the optical properties of the dust mixture from Skiles et al. (2017) in the size bin 10–50 µm, which is representative of measurements from dust in snowpacks (Skiles et al., 2017; Flanner et al., 2021). For red snow algae, new empirical optical properties were integrated in the RTM. The single-scattering properties of red snow algae were directly derived empirically instead of using Mie theory to avoid making assumptions on the pigmentation, refractive index, and size distribution of the algae. The absorption coefficient was measured using the filter-pad transmission method (Stramski et al., 2015), the extinction coefficient was measured on a regular spectrophotometer from normal–normal transmittance (Kandilian et al., 2016), and the asymmetry parameter was assumed constant at 0.96 (Dauchet et al., 2015). The absorption coefficient was corrected from the instrument scattering biases with a baseline at 0.8 µm, a smoothing in the 0.3–0.5 µm range where the signal was noisy, and curve-sharpening where scattering effects distorted the spectrum. The optical properties are representative of algal bloom from the Greenland ice sheet, where the samples were collected (Chevrollier et al., 2023), and are assumed to generalise to all red algal blooms, since red snow is caused by only a few species sharing a similar pigmentation (Lutz et al., 2016).
The RTM outputs spectral albedo in the 0.205–4.995 µm range with steps of 0.01 µm, and only the spectral range of 0.295–2.405 µm was used here because (1) the sun irradiance is negligible below 0.295 µm; (2) radiometric sensors on ground, airborne, or spaceborne platforms rarely detect signals above 2.5 µm; (3) BioSNICAR produces discontinuities around 2.5 µm; and (4) reducing the spectral range allows us to reduce the training time of the emulator (see Sect. 2.1.2). In addition, the simulated albedos were converted to float16 to reduce the size of the look-up table files. The RTM-derived dataset contained 5 827 464 simulations, with six input features (grain size, LWC, BC concentration, dust concentration, red algal concentration, and SZA) and 212-band albedo target. We used 90 % of the dataset for training and 10 % for testing the emulator. Prior to training, the input features were normalised to values between 0 and 1 to avoid biases in emulator training that would focus the learning on the parameters with the largest values.
2.1.2 Neural network
A feed-forward neural network was designed using the Keras library (Chollet et al., 2015). The number of layers and neurons per layer, which determines the number of weights, was optimised from repeated runs of the Bayesian optimisation Keras tuner, which searches for the model architecture with the lowest associated error among prescribed architectures. The chosen network had 12 hidden layers with different numbers of neurons for a total of 266 031 trainable parameters. The activation function for all layers was the exponential linear unit (ELU), chosen to avoid a vanishing gradient problem, except for the last one, for which the activation function was linear. The performance of the model was monitored with three evaluation metrics: the mean absolute error (MAE), the mean absolute percentage error (MAPE), and the mean squared error (MSE). The loss of the model training was the mean absolute error, as it yielded the lowest values for all built-in evaluation metrics of Keras. The optimiser of the neural network was the Adaptive Moment Estimation (Adam) optimiser with an adaptive learning rate decreasing exponentially, starting from 0.001. The model was trained for 200 epochs with a batch size of 256. For each epoch, the training dataset was shuffled and 10 % was used for validation.
2.1.3 Inversion algorithm
The inversion algorithm was a gradient descent algorithm built using the GradientTape TensorFlow object, following the methodology of Jouvet (2023). The goal of the algorithm is to iteratively minimise the cost between a target spectrum and the neural network's predicted spectrum in order to find the closest albedo curve and associated surface properties. The gradient of the cost is computed (and stored) with regard to each variable for 1000 iterations, except for the SZA, which was fixed because the sun angle can be calculated prior to inversion for a given spectrum. The gradient is then applied to the variables using the built-in AdaGrad optimiser from Keras, and the values of the features are kept positive to prevent the gradient descent from entering non-physical parameter spaces, i.e. negative surface properties. To avoid the retrieval of local minima, a pseudo-random sampling approach was implemented, where the inversion was computed for 20 different initialisation points sampled randomly, in order to increase the chances of reaching a cost as low as possible by exploring different areas of the parameter space. The algorithm then selects the retrieval with the lowest cost out of the 20 initialisations as the final retrieval.
2.2 Ground spectroscopy
Hemispherical–conical reflectance factor (HCRF) measurements were collected on snowfields around the Finse Alpine Research Center in summer 2023. In total, 185 measurements were collected using an ASD FieldSpec 4 (spectral range 0.35–2.5 µm) and a black tripod, following the methodology of Cook et al. (2017). Each measurement was acquired with the bare fibre (field of view of 25 degrees) in 10 replicates, immediately (<10 s) after a reference spectrum was measured using a calibrated Spectralon panel. All measurements were performed at nadir view (viewing zenith angle θ=0 °) with the tripod oriented towards the sun to avoid shadow effects. Most (80 %) of the measurements were taken for a solar zenith angle between 38 and 50 °, and the remaining measurements (20 %) were taken for a solar zenith angle below 59 °. The spectra were corrected for the panel spectral response and the step at 1 µm caused by the misalignment of the SWIR and NIR sensors in the ASD FieldSpec, following Painter (2011). For all spectra, the step at 1 µm was, however, not visible, probably because the instrument was warmed up for at least 1 h prior to the measurements and the selected surfaces were homogeneous enough (Painter, 2011). We removed 5 spectra from the analysis because clear calibration errors were detected.
HCRF measurements have several benefits over using a cosine collector at our specific site: (a) the measurements are faster to execute, making it easier to avoid error due to changing illumination conditions; (b) the incoming irradiance is fully re-diffused by the reflectance panel, avoiding errors arising from the cosine property and levelling of the collector (Aoki et al., 2000); and (c) the restricted field of view allowed us to select relatively homogeneous and flat surfaces, reducing the error arising from microtopography and shadow effects. Since the measurements are theoretically not equivalent to spectral albedo, the impact of snow anisotropy on the inversion retrievals was estimated by applying the anisotropy reflectance factor (ARF) measured by Dumont et al. (2010) to the HCRF spectra. We selected the ARFs measured by Dumont et al. (2010) over a surface with high visible impurity content at nadir viewing to best fit the type of surface and measurement setup of this study, with incident radiation angles bounding the minimum and maximum solar zenith angle at the time of our measurements.
2.3 Albedo reduction and radiative forcing (RF) calculations
Broadband albedo (BBA) was calculated as
with λ as the wavelength in the spectral range of the emulator (0.295–2.405 µm), α(λ) as the spectral albedo output by the emulator, and I(λ) as the spectral irradiance from the RTM for a given SZA. The SZA corresponding to each HCRF measurement was calculated using the Pysolar Python package (Stafford et al., 2023). The SZA was set at 50 ° for measurements taken under overcast conditions (48 %), since it approximates the spectral albedo under diffuse irradiance (Wiscombe and Warren, 1980). The BBA reduction associated with a given LAP was calculated by differencing the BBA of the retrieved spectrum with the BBA calculated with the exact same conditions (grain size, SZA, LWC, etc.) except the concentration of the given LAP, which was set to 0. The daily and instantaneous radiative forcings (RFs; W m−2) were calculated by multiplying the BBA reduction with respectively the 24 h daily averaged and instantaneous short-wave incoming radiation, as measured with a four-component radiometer (CNR4, Kipp & Zonen, the Netherlands) at the local weather station (Pirk et al., 2023).
3.1 Performance, benefits, and uncertainties of the inversion method
3.1.1 Forward emulator
The neural network reproduced the original RTM simulations very accurately, with a mean absolute error (MAE), mean absolute percentage error (MAPE), and mean squared error (MSE) on the spectral albedo of respectively , 0.047 %, and for both the training and testing sets, indicating that the emulator does not overfit. The maximum MAE of the 5 827 464 samples of the training and testing sets was 5.8×10⁻⁴, with 99 % of the dataset predicted with an MAE below 8×10⁻⁵ (Fig. 1a). The spectral residuals of the prediction associated with the highest MAE are below 5.0×10⁻³ (Fig. 1b), and they are below 2.0×10⁻⁵ for the lowest MAE (Fig. 1c).
The emulator has several benefits over and above running the full RTM: (1) it executes faster; (2) it is a portable and lightweight Keras model occupying just 1 MB of disk space, whereas the full RTM package occupies ∼1 GB of disk space due to the large optical property database and look-up tables that come bundled with it; (3) it enables the exploration of quasi-continuous spaces for all parameters, in comparison to the original RTM Python package, which relies on the optical property database, for example, for the snow grain size or SZA; and (4) it is a Keras model that can be loaded into scripts written in several popular programming languages (including Python, C, and Fortran), potentially enabling straightforward RTM integration into larger climate models. The emulator is therefore a practical and efficient alternative to the full RTM for the majority of use cases.
The computation efficiency of the emulator in comparison to the original RTM grows when predicting several spectral albedos at once, but this improvement depends on the number of simulations and the use of multiprocessing. For example, the look-up table of +5 000 000 spectral albedos produced in this study can be generated with fully vectorised operations within the neural network (i.e. happen simultaneously in-memory), which makes the computation speed 4 orders of magnitude faster than running the original RTM on a single thread. In the context of this study, the computation efficiency of the emulator also offers the possibility to carry out spectral inversions in a reasonable time.
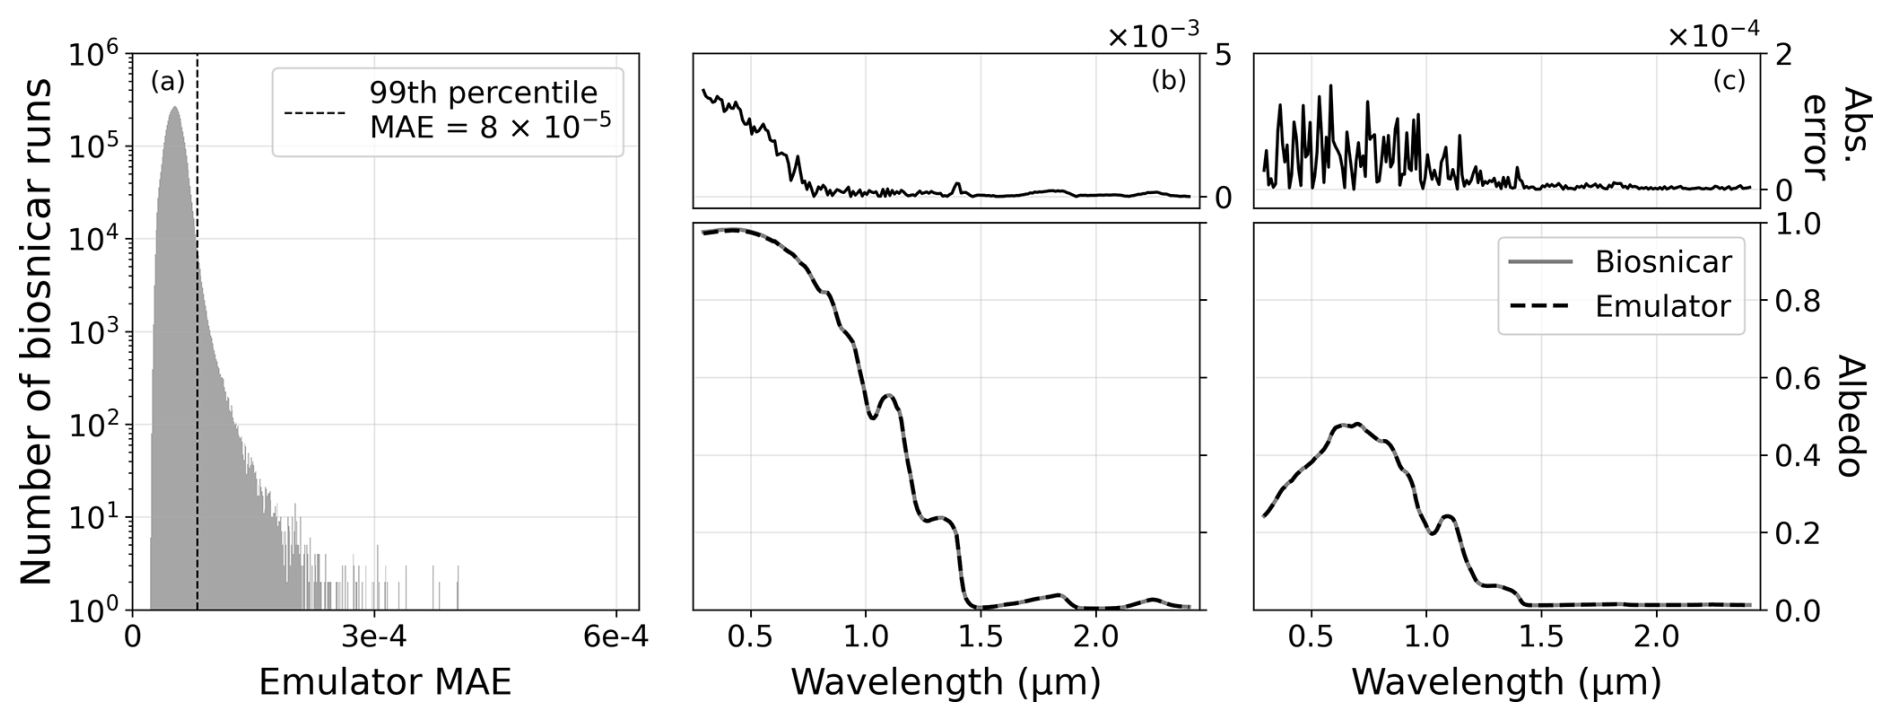
Figure 1Performance of the emulator in reproducing the RTM simulations. (a) Distribution of the mean absolute error (MAE) of the residuals between the original RTM model runs and the predictions of the emulator. Emulator-predicted vs. RTM-simulated albedos corresponding to the (b) highest and (c) lowest mean absolute residuals, with the associated spectral residuals above. Note that the scale on the MAE distribution is logarithmic.
3.1.2 Inversion algorithm
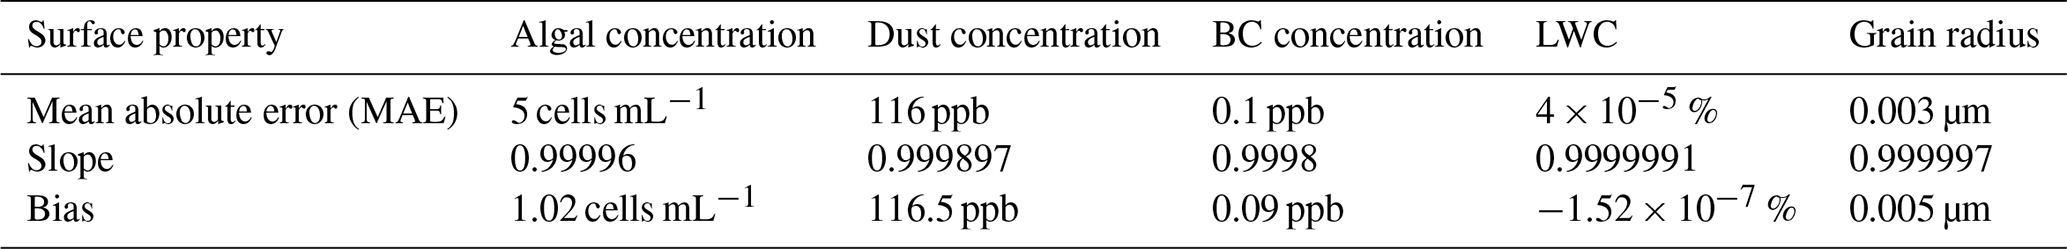
The neural network was incorporated into an inversion algorithm that retrieves the surface parameters required by the RTM to best reproduce a spectrum given as input. The inversion algorithm was evaluated on an ideal dataset with known surface properties to assess its ability to converge to an optimal solution, when it exists. Altogether, 2000 sets of surface properties were sampled pseudo-randomly and fed into the emulator to produce a synthetic dataset of 2000 spectral albedos, which were then inverted. The inversion algorithm reproduced the 2000 albedo curves with a mean absolute error (MAE) of 5×10⁻⁷ and the retrieved surface properties matched those of the synthetic dataset almost perfectly (Table 2), indicating that the algorithm is capable of reaching an optimal solution if one exists. The standard deviation between the 20 different initialisation points for the albedo MAE, the algal concentration, the dust concentration, the BC concentration, the LWC, and the grain radius was respectively , 497 cells mL−1, 1.3×10⁴ ppb, 14 ppb, 0.03 %, and 4 µm. These variations are low and produce nearly undetectable effects on the spectral albedo in our model configuration, indicating that the algorithm is stable and reaches a similar solution despite starting from a different and random point. At present, the inversion method is fast enough to be scaled to satellite observations, with a computation time of about 50 mn to invert 100 km2 of Sentinel-2 imagery at 60 m resolution (benchmark using TensorFlow v2.16.0, CPU AMD Ryzen 7 7700X and 64 GB RAM). The method is hence efficient enough in speed and accuracy to open the possibility of separating the abundance and impact of LAPs at a large scale.
Table 2Mean error between the original and retrieved surface properties; slope and bias of the correlations between the original and retrieved surface properties.
3.2 Application to ground spectra
The inversion algorithm successfully reproduced the ground HCRF spectra measured on snowfields in southern Norway (N=180, average MAE = 0.0056, max. MAE = 0.0089), including the apparent optical properties of LAPs (Fig. 2). Figure 2 shows the retrievals for four different surface types with distinct signatures: (a) relatively clean old snow with low concentrations of LAPs, (b) red snow surface with high algal concentration, (c) brown snow surface with high dust concentrations, and (d) dark snow surface with high BC concentrations. The model accurately reproduces the red algal pigment features, and the retrieved concentrations of algae for the entire dataset covered the range of typically measured values (up to 1.2×10⁵ cells mL−1), with higher concentrations being associated with visibly redder surfaces (Fig. A1). The typical UV-absorbing feature of dust and the UV–VIS flattening signature of black particles were equally well reproduced (Fig. 2c, d). No measurements were performed to know whether BC was present in the snow, and the retrieved BC concentrations are likely to represent dark particles of different origin, most of them coming from the vegetation around the snowfields. Therefore, BC is hereafter referred to as dark particles.
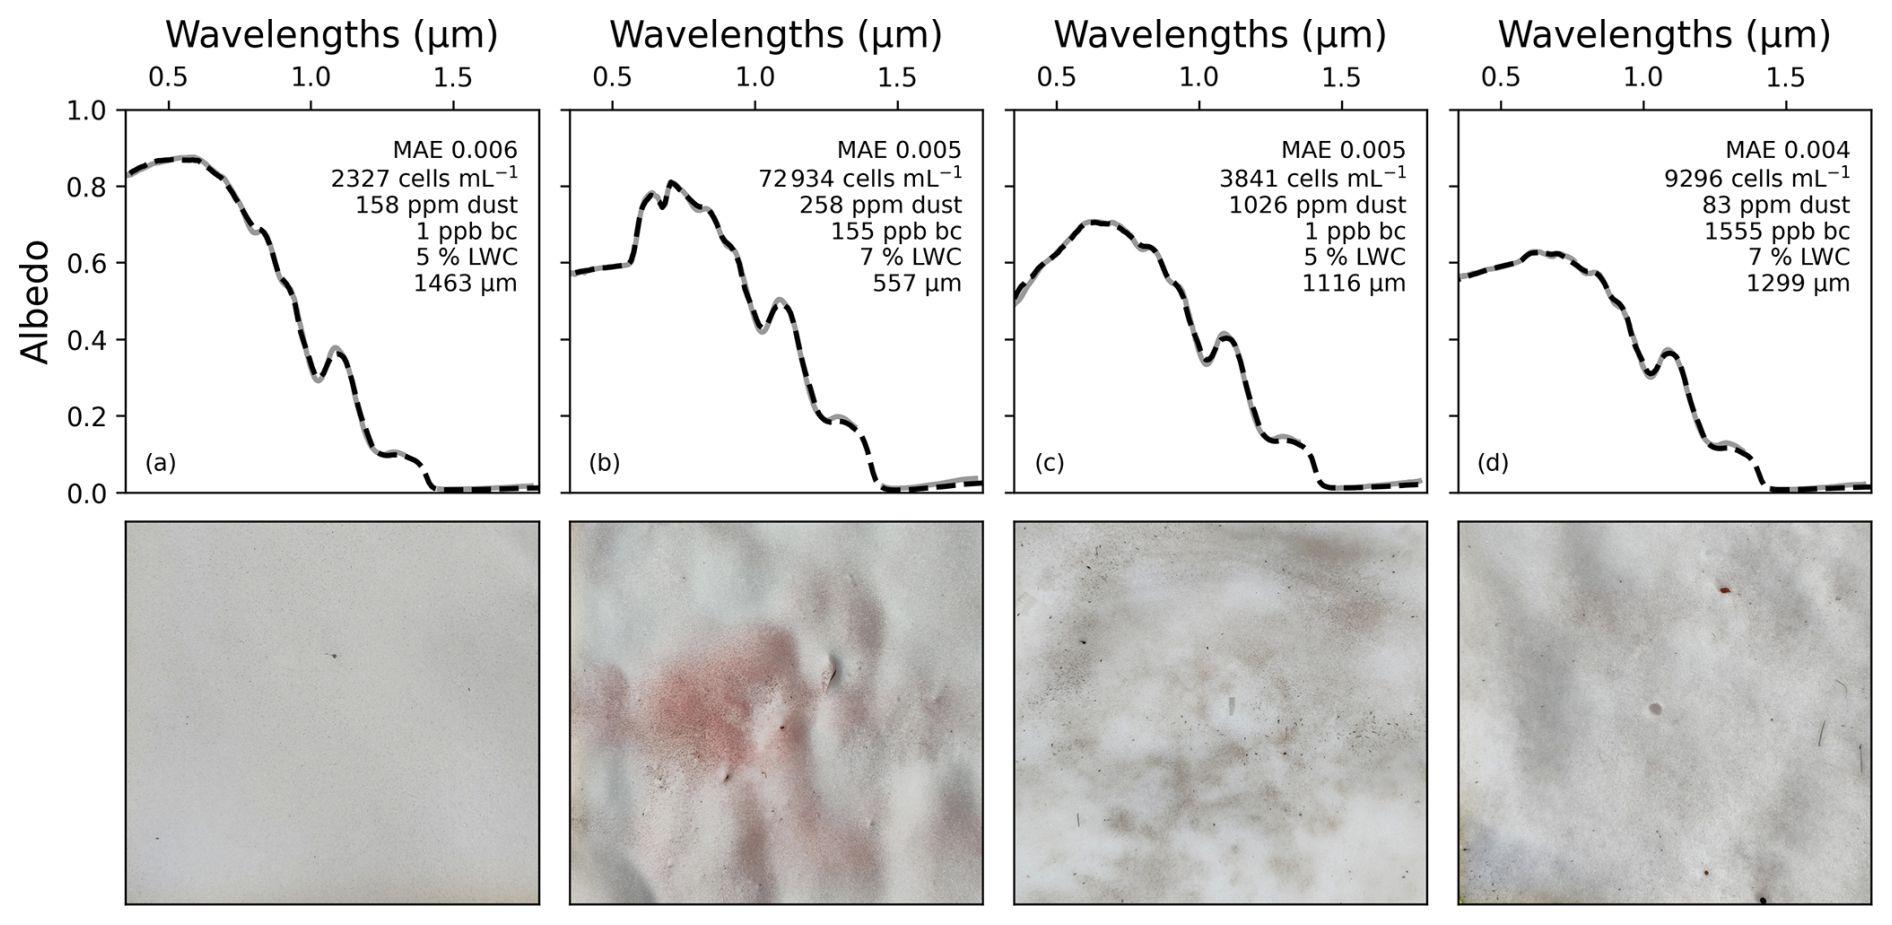
Figure 2Field reflectances (grey lines) vs. retrieved spectral albedos (dashed black lines) and associated surface properties for four different surface snow types: (a) relatively clean snow, (b) very red snow, (c) dust-loaded snow, and (d) dark particle-loaded snow. The scale of the images at the bottom is approximately 45×45 cm and is centred on the middle point of the footprint of the reflectance measurements.
The standard deviation on the dust, algal, and dark particle concentrations between the 20 random initialisations of the inversion algorithm was 514 ppb, 25 cells mL−1, and 0.6 ppb respectively. This variability produces negligible effects on the spectral albedo, which shows that the uncertainties of the inversion method are primarily related to the assumptions on the field data rather than the randomness of the inversion algorithm. In particular, HCRF measurements are not strictly equivalent to hemispherical spectral albedo modelled by the RTM due to reflectance anisotropy (Cook et al., 2017), but no anisotropy correction exists for the type of wet, rough, aged, and heterogeneous snow surface targeted by this study. The anisotropy of snow is more pronounced beyond 1.4 µm (Aoki et al., 2000), and its effect is lower for measurements taken at nadir view and incident angles below 60 ° (Dumont et al., 2010). Sensitivity analyses indicate that the effect of anisotropy on the retrievals was different for each type of LAP and that this effect can be positive or negative depending on the LAP concentration and the incident angle (Fig. A2). The algal concentrations were the least affected by the anisotropy correction (Fig. A2). Beyond anisotropy, the slope of the surface can have a significant effect on snow albedo, and corrections exist if the spectral diffuse and direct partitioning of the incoming irradiance and the slope inclination and aspect have been measured (Picard et al., 2020). Future work could therefore include measurements of the slope and roughness of the surfaces, along with the LAP concentrations, to distinguish between the error related to the abundance of LAPs and the geometry of the surface. In this study, given the variability in the effect of anisotropy, the effort to select flat and homogeneous surfaces during sampling and keep the solar zenith angle below 60 °, the nadir viewing, and the fact that our sample surfaces had varying physical configurations that would require different corrections, HCRF measurements are considered to be equivalent to hemispherical albedo for BBA and radiative forcing calculations presented herein.
The BBA reduction caused by LAPs ranged from 0.04 to 0.25 for the 180 data points, equivalent to a daily radiative forcing (RF) of 7–44 W m−2 for the average daily summer illumination conditions at the field site (Fig. 3a) and 15–83 W m−2 for the sunniest day of the season. These values cover the range of reported values for the maximum daily radiative forcing of LAPs in Europe and North America (Skiles et al., 2018) and compare well with the recent estimation of 58 W m−2 reported in Col du Lautaret, France (Tuzet et al., 2020). Red algal blooms alone reduced the albedo by up to 0.13 (mean: 0.05), dust reduced the albedo by up to 0.21 (mean: 0.02), and dark particles reduced the albedo by up to 0.25 (mean: 0.03). The albedo-reducing effect of each LAP was lower than if it was present alone because the darkening caused by the presence of a LAP is lower when the background surface is also darkened by other LAPs. In this case, the impact of algal blooms, dust, and dark particles was on average 39, 62, and 45 % lower, and up to 2.8, 3.2, and 2.6 times lower, than if each type of LAP had been present alone. These results align with previous observations for dust and black carbon (Skiles and Painter, 2018; Kaspari et al., 2014) and emphasise the need to study LAPs concomitantly.
The daily average RF caused by dust, red algae, and dark particles was respectively up to 36 W m−2 (mean: 4.0 W m−2), 22 W m−2 (mean: 9.0 W m−2), and 44 W m−2 (mean: 6.1 W m−2) and reached up to 72 W m−2, 44 W m−2, and 87 W m−2 during the sunniest day. In comparison, the dust-specific daily RF estimates from surfaces in the upper basin of the Colorado River were of the same order of magnitude, although higher, as the surfaces were visibly more dust-loaded there (Skiles and Painter, 2018), and the red-algal-specific daily RF was comparable to the effect of red blooms in Antarctica (13 W m−2; Khan et al., 2021). The maximum instantaneous radiative forcing (IRF) due to LAPs for the entire dataset was 337 W m−2. The maximum dust IRF was 277 W m−2, which is of the same order of magnitude as those reported in the Alps (up to 154 W m−2; Di Mauro et al., 2015) and in the upper basin of the Colorado River (525 W m−2; Skiles and Painter, 2018). In comparison, the maximum algal IRF was 169 W m−2, which closely matched the values reported for Alaska (up to 175 W m−2; Ganey et al., 2017) and for the North Cascades at the end of July (156.9 W m−2; Healy and Khan, 2023) but was lower than those reported in British Columbia at the end of July (up to 295 W m−2; Engstrom et al., 2022) and in the North Cascades at the beginning of July (359.95 W m−2; Healy and Khan, 2023). Differences in maximum IRF for a given LAP can be due to a different LAP abundance, the presence of other LAPs at the surface, a different surface distribution, and/or a higher maximum irradiance.
Finally, the 180 data points presented here are representative of small footprints of ∼0.1 m2 and were not specifically collected to be representative of larger surface areas, yet they serve as an illustration of the range of impact and relative contribution that LAPs can have. Indeed, the new method employed here enables the retrieval of surface properties that are otherwise not accessible, such as the separate impact of each type of light-absorbing particle. This dataset therefore demonstrates the high variability in the impact of LAPs, emphasising the need to study them both separately and concomitantly and highlighting the important role of biotic LAPs in snow surface albedo reduction (Fig. 3b). Eventually, other LAPs could be integrated in the model for it to be applicable to other locations, where ashes, brown carbon, green algae, or different types of dust are present on the snow surfaces.
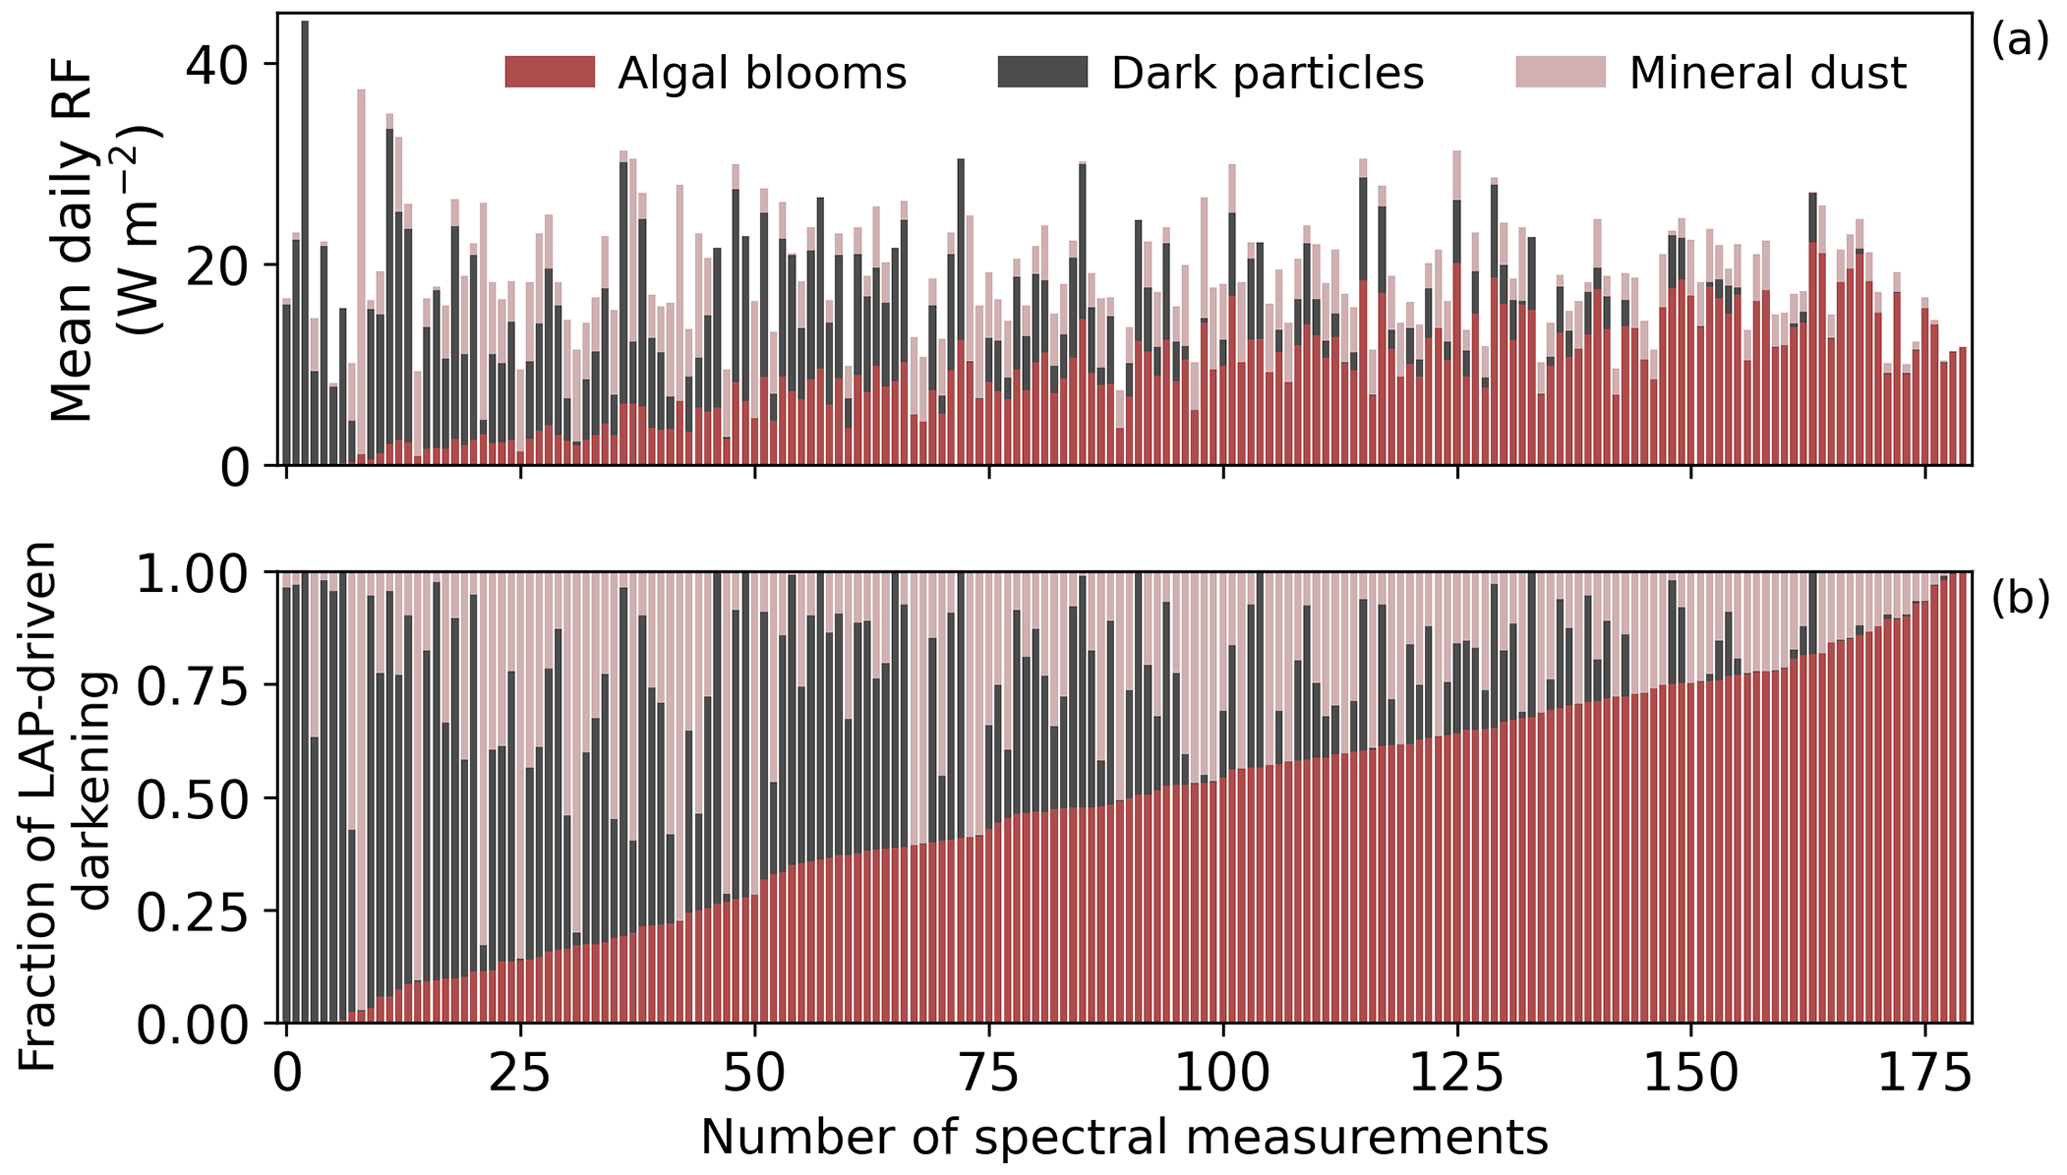
Figure 3Radiative forcing (a) and contribution to LAP-driven albedo reduction (b) associated with the presence of each LAP for the 180 spectra analysed.
Light-absorbing particles have varying apparent optical properties, challenging the quantification of their albedo-reducing effect using forward modelling and making inverse methods relevant for their detection. Here we present an efficient, robust, and portable method aimed at simultaneously retrieving the abundance of LAPs and their albedo-reducing effects on snow surfaces from spectral albedo measurements. It consists of a neural network emulating a radiative transfer model and an inversion algorithm. We found that the neural network added negligible error compared to using the full RTM and ran significantly faster. We used the neural network in inverse mode to retrieve the surface properties that best explain observed field spectra and calculate how much albedo change and radiative forcing can be attributed to red algae, dust, or dark particles. The results highlight a wide range, magnitude, and co-dependency of LAP impacts, illustrating the subsequent need to study LAPs both separately and concomitantly. The high and stable performance of this inversion algorithm on field spectra indicates that it could also be applied to imagery obtained from drones or satellites to improve the diversity of information captured from regional-scale mapping of snow. To facilitate future usage and development of the method, the full code running the model and the inversion was made available in an open-source Python package. Ongoing developments currently focus on making the inversion algorithm resolution-agnostic and hence adaptable to several remote sensing products, along with adding the possibility to prescribe sensor-specific spectral responses. The application of the method to new areas using remotely sensed imagery will present additional challenges to consider, such as (i) the variability in mineral dust optical properties that may require new mineral mixtures in the model; (ii) the presence of shallow snowpacks of which the signature could be confounded with that of black carbon (Warren, 2013); and (ii) the variability in spectral resolution between sensors, where lower-resolution imagery may require stronger constraints on the inverse problem.
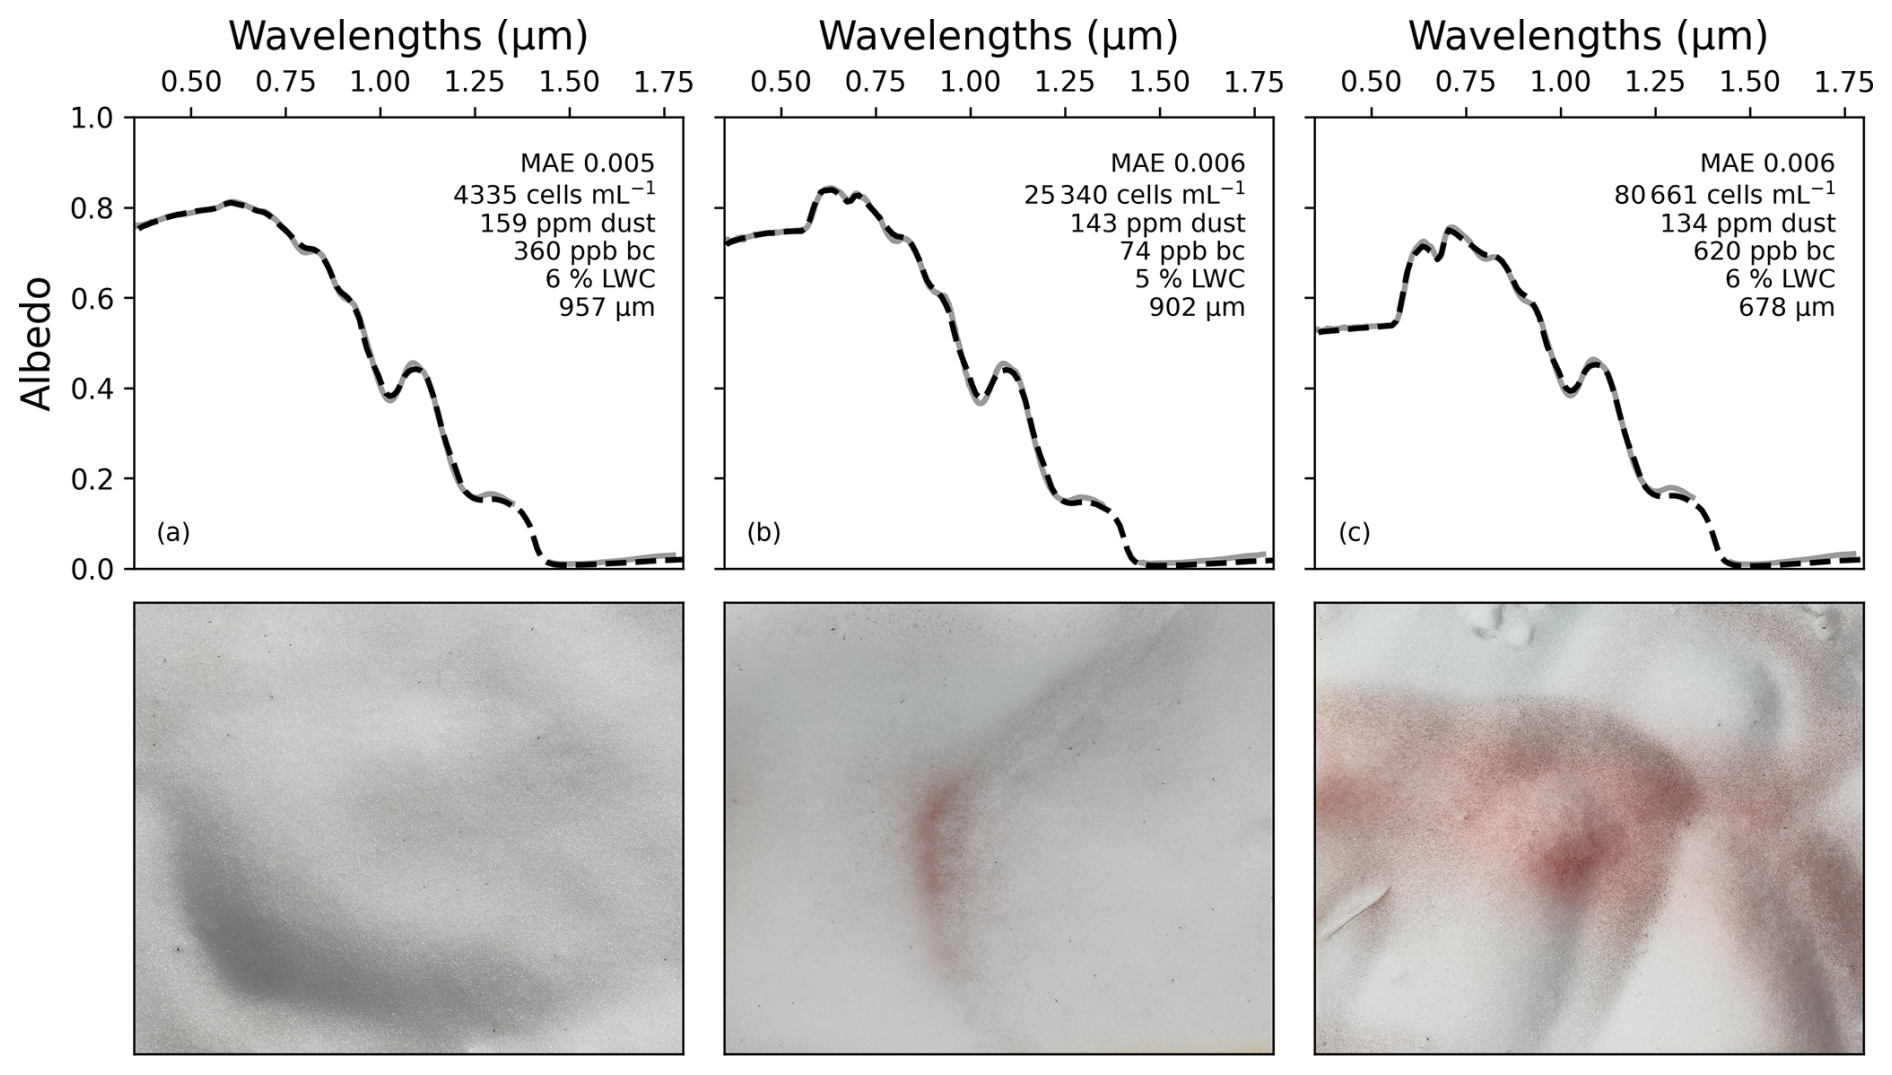
Figure A1Field reflectances (grey lines) vs. retrieved spectral albedos (dashed black lines) and associated surface properties for three surfaces visibly more and more red. The scale of the images at the bottom is approximately 45×45 cm and is centred on the middle point of the footprint of the reflectance measurements.
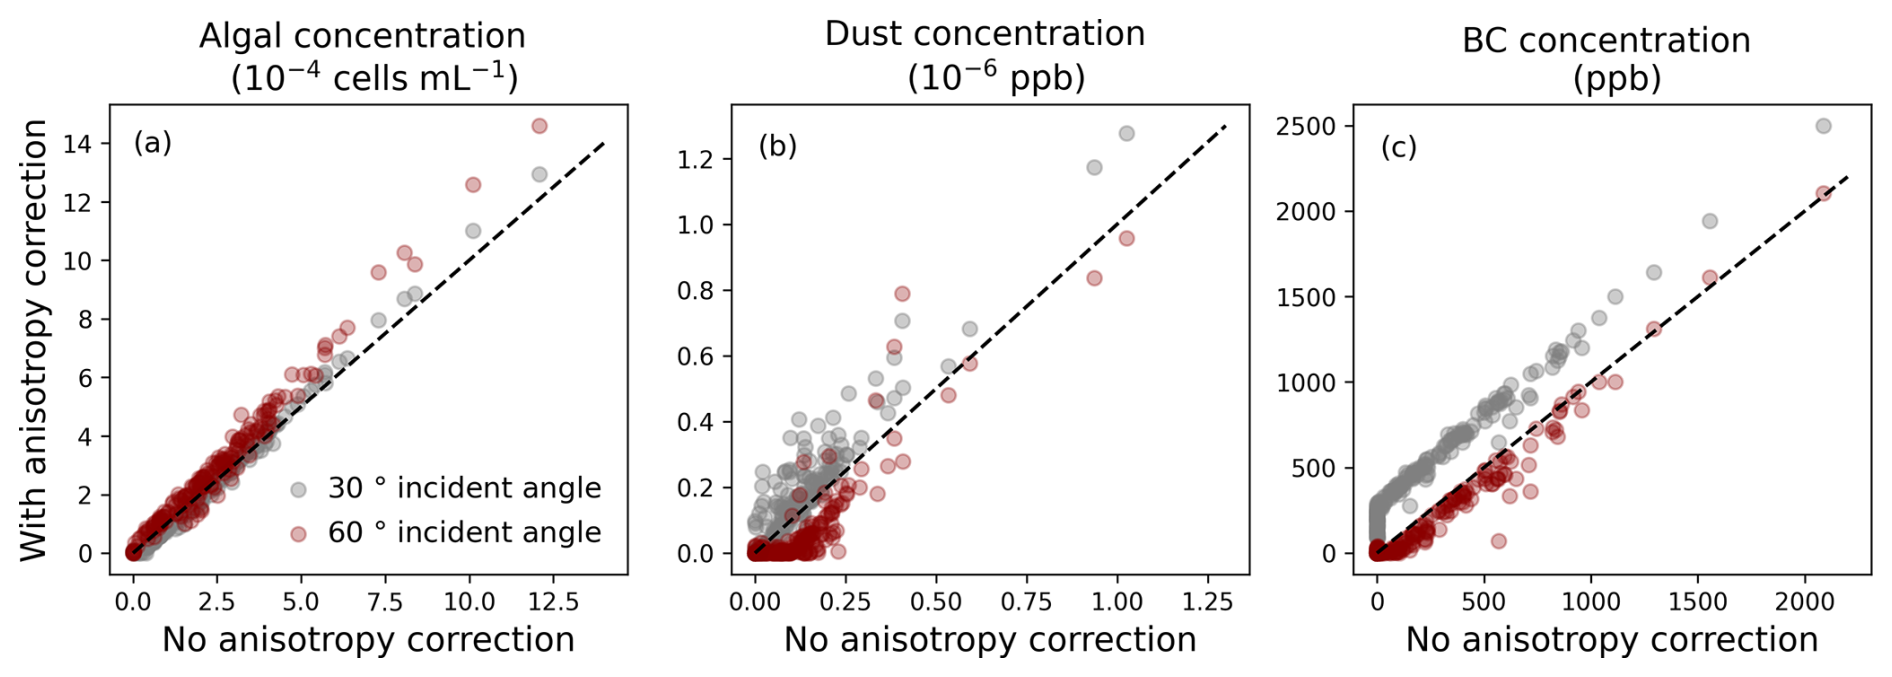
Figure A2Sensitivity tests to evaluate the potential effect of snow anisotropy on the retrievals of (a) algal, (b) dust, and (c) black carbon concentrations with the inversion algorithm. The retrievals of the inversions on LAP concentrations are compared to the retrievals when applying ARFs from Dumont et al. (2010), measured over a flat snow surface with impurities at incident angles of 30 and 60 °.
The inversion framework developed in this study is available as the Python package snowlaps online on GitHub at https://github.com/openosmia/snowlaps (last access: 3 April 2025), which also contains the hyperspectral dataset produced in this study. Version 0.1.0 of the software used in this study, along with the hyperspectral data, is also archived in a Zenodo repository at https://doi.org/10.5281/zenodo.14639602 (Wehrlé et al., 2025). The BioSNICAR model version 2.2 is available at https://github.com/jmcook1186/biosnicar-py (last access: 3 April 2025) and is stored in a Zenodo archive at https://doi.org/10.5281/zenodo.15118252 (Cook et al., 2025).
Conceptualisation: LC, AW. Data collection: LC, AW, NP. Data curation: LC, AW, NP. Algorithm development: LC, AW. BioSNICAR maintenance: LC, JMC. Visualisation: LC, AW. Writing (original draft preparation): LC. Funding acquisition: LGB, AMA, MT. Writing (review and editing): all authors.
The contact author has declared that none of the authors has any competing interests.
Publisher’s note: Copernicus Publications remains neutral with regard to jurisdictional claims made in the text, published maps, institutional affiliations, or any other geographical representation in this paper. While Copernicus Publications makes every effort to include appropriate place names, the final responsibility lies with the authors.
Joseph M. Cook was supported by National Geographic/Microsoft AI for Earth. Lou-Anne Chevrollier thanks Marie Dumont for guidance and suggestions related to the treatment of snow anistropy and thanks Mark Flanner and Chloe A. Whicker-Clarke for the guidance in generating optical property files. Lou-Anne Chevrollier and Adrien Wehrlé thank Guillaume Jouvet for guidance on the development of the inversion algorithm; Jens Ådne Rekkedal Haga for facilitating fieldwork logistics; the organisers of the Machine Learning in Glaciology Workshop (https://github.com/Machine-Learning-in-Glaciology-Workshop, last access: 10 August 2024); and the Finse Alpine Research Center, which is maintained by the University of Oslo and the University of Bergen. Importantly, all analyses relied on the Python libraries NumPy (Harris et al., 2020), pandas (pandas development team, 2024; Wes McKinney, 2010), TensorFlow (Developers, 2024), Keras (Chollet et al., 2015), Matplotlib (Hunter, 2007), SciPy (Virtanen et al., 2020), and scikit-learn (Pedregosa et al., 2011).
This research has been supported by the European Research Council, H2020 European Research Council (grant no. 856416).
This paper was edited by Nora Helbig and reviewed by Urs Niklas Bohn and two anonymous referees.
Aoki, T., Aoki, T., Fukabori, M., Hachikubo, A., Tachibana, Y., and Nishio, F.: Effects of snow physical parameters on spectral albedo and bidirectional reflectance of snow surface, J. Geophys. Res.-Atmos., 105, 10219–10236, 2000. a, b
Bohn, N., Painter, T. H., Thompson, D. R., Carmon, N., Susiluoto, J., Turmon, M. J., Helmlinger, M. C., Green, R. O., Cook, J. M., and Guanter, L.: Optimal estimation of snow and ice surface parameters from imaging spectroscopy measurements, Remote Sens. Environ., 264, 112613, https://doi.org/10.1016/j.rse.2021.112613, 2021. a
Bond, T. C., Doherty, S. J., Fahey, D. W., Forster, P. M., Berntsen, T., DeAngelo, B. J., Flanner, M. G., Ghan, S., Kärcher, B., Koch, D., and Kinne, S.: Bounding the role of black carbon in the climate system: A scientific assessment, J. Geophys. Res.-Atmos., 118, 5380–5552, 2013. a
Chevrollier, L.-A., Cook, J. M., Halbach, L., Jakobsen, H., Benning, L. G., Anesio, A. M., and Tranter, M.: Light absorption and albedo reduction by pigmented microalgae on snow and ice, J. Glaciol., 69, 333–341, 2023. a, b
Chollet, F. and others: Keras, https://keras.io (last access: 3 April 2025), 2015. a, b
Cook, J. M., Hodson, A. J., Gardner, A. S., Flanner, M., Tedstone, A. J., Williamson, C., Irvine-Fynn, T. D. L., Nilsson, J., Bryant, R., and Tranter, M.: Quantifying bioalbedo: a new physically based model and discussion of empirical methods for characterising biological influence on ice and snow albedo, The Cryosphere, 11, 2611–2632, https://doi.org/10.5194/tc-11-2611-2017, 2017. a, b
Cook, J. M., Tedstone, A. J., Williamson, C., McCutcheon, J., Hodson, A. J., Dayal, A., Skiles, M., Hofer, S., Bryant, R., McAree, O., McGonigle, A., Ryan, J., Anesio, A. M., Irvine-Fynn, T. D. L., Hubbard, A., Hanna, E., Flanner, M., Mayanna, S., Benning, L. G., van As, D., Yallop, M., McQuaid, J. B., Gribbin, T., and Tranter, M.: Glacier algae accelerate melt rates on the south-western Greenland Ice Sheet, The Cryosphere, 14, 309–330, https://doi.org/10.5194/tc-14-309-2020, 2020.
Cook, J. M., Chevrollier, L.-A., Gölles T., and Bohn N: jmcook1186/biosnicar-py: 2.2 (2.2), Zenodo [code], https://doi.org/10.5281/zenodo.15118252, 2025. a, b
Dauchet, J., Blanco, S., Cornet, J.-F., and Fournier, R.: Calculation of the radiative properties of photosynthetic microorganisms, J. Quant. Spectrosc. Ra., 161, 60–84, 2015. a
Developers, T.: TensorFlow, Zenodo [software], https://doi.org/10.5281/zenodo.12726004, 2024. a
Di Mauro, B., Fava, F., Ferrero, L., Garzonio, R., Baccolo, G., Delmonte, B., and Colombo, R.: Mineral dust impact on snow radiative properties in the European Alps combining ground, UAV, and satellite observations, J. Geophys. Res.-Atmos., 120, 6080–6097, https://doi.org/10.1002/2015jd023287, 2015. a
Donahue, C., Skiles, S. M., and Hammonds, K.: Mapping liquid water content in snow at the millimeter scale: an intercomparison of mixed-phase optical property models using hyperspectral imaging and in situ measurements, The Cryosphere, 16, 43–59, https://doi.org/10.5194/tc-16-43-2022, 2022. a, b, c
Donahue, C. P., Menounos, B., Viner, N., Skiles, S. M., Beffort, S., Denouden, T., Arriola, S. G., White, R., and Heathfield, D.: Bridging the gap between airborne and spaceborne imaging spectroscopy for mountain glacier surface property retrievals, Remote Sens. Environ., 299, 113849, https://doi.org/10.1016/j.rse.2023.113849, 2023. a
Dumont, M. and Tuzet, F.: Light-absorbing Particles in Snow and Climate, in: Chemistry in the Cryosphere (In 2 Parts), 795–830, World Scientific, https://doi.org/10.1142/9789811230134_0016, 2022. a
Dumont, M., Brissaud, O., Picard, G., Schmitt, B., Gallet, J.-C., and Arnaud, Y.: High-accuracy measurements of snow Bidirectional Reflectance Distribution Function at visible and NIR wavelengths – comparison with modelling results, Atmos. Chem. Phys., 10, 2507–2520, https://doi.org/10.5194/acp-10-2507-2010, 2010. a, b, c, d
Dumont, M., Arnaud, L., Picard, G., Libois, Q., Lejeune, Y., Nabat, P., Voisin, D., and Morin, S.: In situ continuous visible and near-infrared spectroscopy of an alpine snowpack, The Cryosphere, 11, 1091–1110, https://doi.org/10.5194/tc-11-1091-2017, 2017. a, b
Engstrom, C. B., Williamson, S. N., Gamon, J. A., and Quarmby, L. M.: Seasonal development and radiative forcing of red snow algal blooms on two glaciers in British Columbia, Canada, summer 2020, Remote Sens. Environ., 280, 113164, https://doi.org/10.1016/j.rse.2022.113164, 2022. a, b
Flanner, M. G., Shell, K. M., Barlage, M., Perovich, D. K., and Tschudi, M.: Radiative forcing and albedo feedback from the Northern Hemisphere cryosphere between 1979 and 2008, Nat. Geosci., 4, 151–155, 2011. a
Flanner, M. G., Liu, X., Zhou, C., Penner, J. E., and Jiao, C.: Enhanced solar energy absorption by internally-mixed black carbon in snow grains, Atmos. Chem. Phys., 12, 4699–4721, https://doi.org/10.5194/acp-12-4699-2012, 2012. a
Flanner, M. G., Arnheim, J. B., Cook, J. M., Dang, C., He, C., Huang, X., Singh, D., Skiles, S. M., Whicker, C. A., and Zender, C. S.: SNICAR-ADv3: a community tool for modeling spectral snow albedo, Geosci. Model Dev., 14, 7673–7704, https://doi.org/10.5194/gmd-14-7673-2021, 2021. a, b, c, d, e, f, g, h, i
Ganey, G. Q., Loso, M. G., Burgess, A. B., and Dial, R. J.: The role of microbes in snowmelt and radiative forcing on an Alaskan icefield, Nat. Geosci., 10, 754–759, https://doi.org/10.1038/ngeo3027, 2017. a
Gardner, A. S. and Sharp, M. J.: A review of snow and ice albedo and the development of a new physically based broadband albedo parameterization, J. Geophys. Res.-Earth, 115, F01009, https://doi.org/10.1029/2009JF001444, 2010. a
Harris, C. R., Millman, K. J., van der Walt, S. J., Gommers, R., Virtanen, P., Cournapeau, D., Wieser, E., Taylor, J., Berg, S., Smith, N. J., Kern, R., Picus, M., Hoyer, S., van Kerkwijk, M. H., Brett, M., Haldane, A., del Río, J. F., Wiebe, M., Peterson, P., Gérard-Marchant, P., Sheppard, K., Reddy, T., Weckesser, W., Abbasi, H., Gohlke, C., and Oliphant, T. E.: Array programming with NumPy, Nature, 585, 357–362, https://doi.org/10.1038/s41586-020-2649-2, 2020. a
Harrold, Z. R., Hausrath, E. M., Garcia, A., Murray, A. E., Tschauner, O., Raymond, J. A., and Huang, S.: Bioavailability of mineral-bound iron to a snow algal-bacterial coculture and implications for albedo-altering snow algal blooms, Appl. Environ. Microb., 84, e02322–17, https://doi.org/10.1128/AEM.02322-17, 2018. a
He, C.: Modelling light-absorbing particle–snow–radiation interactions and impacts on snow albedo: fundamentals, recent advances and future directions, Environ. Chem., 19, 296–311, 2022. a
Healy, S. M. and Khan, A. L.: Albedo change from snow algae blooms can contribute substantially to snow melt in the North Cascades, USA, Communications Earth & Environment, 4, 142, https://doi.org/10.1038/s43247-023-00768-8, 2023. a, b, c
Hunter, J. D.: Matplotlib: A 2D graphics environment, Comput. Sci. Eng., 9, 90–95, https://doi.org/10.1109/MCSE.2007.55, 2007. a
Jouvet, G.: Inversion of a Stokes glacier flow model emulated by deep learning, J. Glaciol., 69, 13–26, 2023. a, b
Kandilian, R., Soulies, A., Pruvost, J., Rousseau, B., Legrand, J., and Pilon, L.: Simple method for measuring the spectral absorption cross-section of microalgae, Chem. Eng. Sci., 146, 357–368, 2016. a
Kaspari, S., Painter, T. H., Gysel, M., Skiles, S. M., and Schwikowski, M.: Seasonal and elevational variations of black carbon and dust in snow and ice in the Solu-Khumbu, Nepal and estimated radiative forcings, Atmos. Chem. Phys., 14, 8089–8103, https://doi.org/10.5194/acp-14-8089-2014, 2014. a, b
Khan, A. L., Dierssen, H. M., Scambos, T. A., Höfer, J., and Cordero, R. R.: Spectral characterization, radiative forcing and pigment content of coastal Antarctic snow algae: approaches to spectrally discriminate red and green communities and their impact on snowmelt, The Cryosphere, 15, 133–148, https://doi.org/10.5194/tc-15-133-2021, 2021. a
Kokhanovsky, A., Di Mauro, B., Garzonio, R., and Colombo, R.: Retrieval of dust properties from spectral snow reflectance measurements, Frontiers in Environmental Science, 9, 644551, https://doi.org/10.3389/fenvs.2021.644551, 2021. a
Lutz, S., Anesio, A. M., Raiswell, R., Edwards, A., Newton, R. J., Gill, F., and Benning, L. G.: The biogeography of red snow microbiomes and their role in melting arctic glaciers, Nat. Commun., 7, 11968, https://doi.org/10.1038/ncomms11968, 2016. a
Malinka, A.: Stereological approach to radiative transfer in porous materials. Application to the optics of snow, J. Quant. Secptrosc. Ra., 295, 108410, https://doi.org/10.1016/j.jqsrt.2022.108410, 2023. a
McCutcheon, J., Lutz, S., Williamson, C., Cook, J. M., Tedstone, A. J., Vanderstraeten, A., Wilson, S., Stockdale, A., Bonneville, S., Anesio, A. M., and Yallop, M. L.: Mineral phosphorus drives glacier algal blooms on the Greenland Ice Sheet, Nat. Commun., 12, 570, https://doi.org/10.1038/s41467-020-20627-w, 2021. a
Painter, T. H.: Comment on Singh and others, “Hyperspectral analysis of snow reflectance to understand the effects of contamination and grain size”, J. Glaciol., 57, 183–185, 2011. a, b
pandas development team, T.: pandas-dev/pandas: Pandas, Zenodo [software], https://doi.org/10.5281/zenodo.10957263, 2024. a
Pedregosa, F., Varoquaux, G., Gramfort, A., Michel, V., Thirion, B., Grisel, O., Blondel, M., Prettenhofer, P., Weiss, R., Dubourg, V., Vanderplas, J., Passos, A., Cournapeau, D., Brucher, M., Perrot, M., and Duchesnay, E.: Scikit-learn: Machine Learning in Python, J. Mach. Learn. Res., 12, 2825–2830, 2011. a
Picard, G. and Libois, Q.: Simulation of snow albedo and solar irradiance profile with the Two-streAm Radiative TransfEr in Snow (TARTES) v2.0 model, Geosci. Model Dev., 17, 8927–8953, https://doi.org/10.5194/gmd-17-8927-2024, 2024. a
Picard, G., Libois, Q., and Arnaud, L.: Refinement of the ice absorption spectrum in the visible using radiance profile measurements in Antarctic snow, The Cryosphere, 10, 2655–2672, https://doi.org/10.5194/tc-10-2655-2016, 2016. a
Picard, G., Dumont, M., Lamare, M., Tuzet, F., Larue, F., Pirazzini, R., and Arnaud, L.: Spectral albedo measurements over snow-covered slopes: theory and slope effect corrections, The Cryosphere, 14, 1497–1517, https://doi.org/10.5194/tc-14-1497-2020, 2020. a
Pirk, N., Aalstad, K., Yilmaz, Y. A., Vatne, A., Popp, A. L., Horvath, P., Bryn, A., Vollsnes, A. V., Westermann, S., Berntsen, T. K., Stordal, F., and Tallaksen, L. M.: Snow–vegetation–atmosphere interactions in alpine tundra, Biogeosciences, 20, 2031–2047, https://doi.org/10.5194/bg-20-2031-2023, 2023. a
Prahl, S.: miepython: Pure python implementation of Mie scattering, Zenodo [software], https://doi.org/10.5281/zenodo.8023972, 2023. a
Robledano, A., Picard, G., Dumont, M., Flin, F., Arnaud, L., and Libois, Q.: Unraveling the optical shape of snow, Nat. Commun., 14, 3955, https://doi.org/10.1038/s41467-023-39671-3, 2023. a
Rowe, P., Fergoda, M., and Neshyba, S.: Temperature-dependent optical properties of liquid water from 240 to 298 K, J. Geophys. Res.-Atmos., 125, e2020JD032624, https://doi.org/10.1029/2020JD032624, 2020. a
Segelstein, D. J.: The complex refractive index of water, Ph.D. thesis, University of Missouri–Kansas City, http://hdl.handle.net/10355/11599, 1981. a
Skiles, S. M. and Painter, T. H.: Assessment of radiative forcing by light-absorbing particles in snow from in situ observations with radiative transfer modeling, J. Hydrometeorol., 19, 1397–1409, 2018. a, b, c, d
Skiles, S. M., Painter, T., and Okin, G. S.: A method to retrieve the spectral complex refractive index and single scattering optical properties of dust deposited in mountain snow, J. Glaciol., 63, 133–147, 2017. a, b
Skiles, S. M., Flanner, M., Cook, J. M., Dumont, M., and Painter, T. H.: Radiative forcing by light-absorbing particles in snow, Nat. Clim. Change, 8, 964–971, 2018. a, b, c
Stafford, B., Louis, R., Wilson, R., Rejeté, F., Steinmetz, F., Borsetti, M., Bachmann, A., Aronovitch, A., Blennerhassett, E., Hardy, W., steelman, Kiselev, A., Firing, E., Semeniuc, E., Kundert, P., Arron-Walker, T., McNaughton, W., solarjoe, Wallace, A., bfrobin446, Luiten, C., Rackwitz, C., Sharma, D., Maliarik, D., Hasan, Deane, J., van Haarst, J., Heikkilä, J., Maron, J., and Contreras, J. L. L.: pingswept/pysolar: 0.11, Zenodo [software], https://doi.org/10.5281/zenodo.8184359, 2023. a
Stramski, D., Reynolds, R. A., Kaczmarek, S., Uitz, J., and Zheng, G.: Correction of pathlength amplification in the filter-pad technique for measurements of particulate absorption coefficient in the visible spectral region, Appl. Opt., 54, 6763–6782, 2015. a
Tuzet, F., Dumont, M., Picard, G., Lamare, M., Voisin, D., Nabat, P., Lafaysse, M., Larue, F., Revuelto, J., and Arnaud, L.: Quantification of the radiative impact of light-absorbing particles during two contrasted snow seasons at Col du Lautaret (2058 m a.s.l., French Alps), The Cryosphere, 14, 4553–4579, https://doi.org/10.5194/tc-14-4553-2020, 2020. a, b
Virtanen, P., Gommers, R., Oliphant, T. E., Haberland, M., Reddy, T., Cournapeau, D., Burovski, E., Peterson, P., Weckesser, W., Bright, J., van der Walt, S. J., Brett, M., Wilson, J., Millman, K. J., Mayorov, N., Nelson, A. R. J., Jones, E., Kern, R., Larson, E., Carey, C. J., Polat, İ., Feng, Y., Moore, E. W., VanderPlas, J., Laxalde, D., Perktold, J., Cimrman, R., Henriksen, I., Quintero, E. A., Harris, C. R., Archibald, A. M., Ribeiro, A. H., Pedregosa, F., van Mulbregt, P., and SciPy 1.0 Contributors: SciPy 1.0: Fundamental Algorithms for Scientific Computing in Python, Nat. Methods, 17, 261–272, https://doi.org/10.1038/s41592-019-0686-2, 2020. a
Warren, S. G.: Optical properties of snow, Rev. Geophys., 20, 67–89, 1982. a
Warren, S. G.: Can black carbon in snow be detected by remote sensing?, J. Geophys. Res.-Atmos, 118, 779–786, 2013. a
Warren, S. G. and Brandt, R. E.: Optical constants of ice from the ultraviolet to the microwave: A revised compilation, J. Geophys. Res.-Atmos., 113, D14220, https://doi.org/10.1029/2007JD009744, 2008. a
Wehrlé, A., Chevrollier, L.-A., and Antsalacia: openosmia/snowlaps: v0.1.0 (v0.1.0), Zenodo [code], https://doi.org/10.5281/zenodo.14639602, 2025. a
Wes McKinney: Data Structures for Statistical Computing in Python, in: Proceedings of the 9th Python in Science Conference, edited by: van der Walt, S. and Millman, J., 56–61, https://doi.org/10.25080/Majora-92bf1922-00a, 2010. a
Whicker, C. A., Flanner, M. G., Dang, C., Zender, C. S., Cook, J. M., and Gardner, A. S.: SNICAR-ADv4: a physically based radiative transfer model to represent the spectral albedo of glacier ice, The Cryosphere, 16, 1197–1220, https://doi.org/10.5194/tc-16-1197-2022, 2022. a, b
Wiscombe, W. J. and Warren, S. G.: A model for the spectral albedo of snow. I: Pure snow, J. Atmos. Sci., 37, 2712–2733, 1980. a, b