the Creative Commons Attribution 4.0 License.
the Creative Commons Attribution 4.0 License.
The source, quantity, and spatial distribution of interfacial water during glide-snow avalanche release: experimental evidence from field monitoring
Amelie Fees
Michael Lombardo
Alec van Herwijnen
Peter Lehmann
Jürg Schweizer
Glide-snow avalanches release at the soil–snow interface due to a loss friction which is suspected to be linked to interfacial water. Presently, the formation and distribution of the interfacial water are not well understood and glide-snow avalanches are considered unpredictable. We investigated the source, quantity, and spatial distribution of interfacial water before and during avalanche release through spatio-temporal field monitoring. The measurement setup consists of a sensor grid covering a slope with frequent glide-snow avalanche activity. The 24 grid sensors measured the soil temperature and liquid water content (LWC) throughout seasons 2021/22 to 2023/24. Snow and interfacial temperature and LWC were monitored locally with a vertical sensor profile ranging from the soil into the snow. Seven glide-snow avalanches released over the sensor grid and their investigation showed the following: (i) interfacial water originated from geothermal heat, rain, and meltwater percolation; (ii) the quantity of snow LWC was lower for glide-snow avalanches that released in early winter than in spring; (iii) soil temperatures in the release area were higher than in the remaining slope if interfacial water originated from geothermal heat; (iv) if interfacial water originated from rain and/or melt, we observed (locally) higher soil LWC in the release area; and (v) for the majority of observed avalanches the spatial variability in soil LWC across the slope reached a local minimum at the time of avalanche release. In the future, with continued monitoring, the spatio-temporal investigation of the soil LWC and temperature will help to quantify the drivers of glide-snow avalanche release at the slope scale. This will contribute to improved glide-snow avalanche forecasting and mitigation.
- Article
(4949 KB) - Full-text XML
- BibTeX
- EndNote
Glide-snow avalanches release at the soil–snow interface and endanger infrastructure in mountain regions (e.g., Clarke and McClung, 1999; Mitterer and Schweizer, 2012a). The snow-gliding process has been reported on since the early 20th century (Fankhauser, 1918; Haefeli, 1939). Since then, many phenomenological observations have led to our current understanding that snow gliding is favored by (i) a smooth ground surface, (ii) sufficiently steep slopes above 15° (typically above 28° for glide-snow avalanches), and (iii) water at the soil–snow interface that causes a reduction in basal friction (Ancey and Bain, 2015; in der Gand and Zupančič, 1966). Glide-snow avalanches have been observed both in early winter and in spring, which led to the classification of “cold” and “warm” glide-snow avalanches based on the prevailing air and snow temperature (Clarke and McClung, 1999; Dreier et al., 2016). It is generally assumed that the source of interfacial water differs between cold and warm events depending on the interplay of meteorological, snowpack, and soil parameters. This motivated a similar but more process-based separation of glide-snow avalanches into “interface” and “surface” events (Fees et al., 2025). Surface events (surface-generated interfacial water) are avalanches where the water at the soil–snow interface originated from the snow surface through the percolation of meltwater or rain (Lackinger, 1987; Clarke and McClung, 1999). Interface events (interface-generated interfacial water) are avalanches where the liquid water layer was formed at the soil–snow interface. Possible sources of water for interface events include geothermal melting of the lowermost snow layer (McClung, 1987; Newesely et al., 2000; Höller, 2001) or capillary suction of water from the soil into the snow due to the hydraulic soil and snow properties (Mitterer and Schweizer, 2012a; Lombardo et al., 2025).

Figure 1(a) Map and (b) picture of Dorfberg indicating the location of the weather station (AWS), the reference location (R), the Seewer Berg slope with the spatio-temporal monitoring setup (square), and the direction towards the Weissfluhjoch measurement site (WFJ). Map: Federal Office of Topography, CH1903+.
While there have been numerous phenomenological observations of snow gliding and glide-snow avalanche release (e.g., McClung et al., 1994; Reardon et al., 2006; Höller, 2001), we still lack process understanding which results in limited forecasting capabilities (Simenhois and Birkeland, 2010; Jones, 2004) and hampers mitigation measures (Sharaf et al., 2008; Jones, 2004). The review papers on snow gliding and glide-snow avalanches (Ancey and Bain, 2015; Höller, 2014; Jones, 2004) agree that “the crux of the problem is the proper determination of what happens at the interface between the snowpack and ground” (Ancey and Bain, 2015). The connection of soil conditions, basal friction, and avalanche activity “is primarily based on observations and not yet confirmed by relevant investigations” (Höller, 2014). As a result, the number of in situ observations of soil liquid water content (LWC), soil temperature (Ceaglio et al., 2017; Maggioni et al., 2019; Mitterer and Schweizer, 2012b), and snow LWC (Fromm et al., 2018) has increased recently. Findings included increasing glide rates with increasing soil LWC (Ceaglio et al., 2017) and a significant influence of soil LWC and soil temperature on snow gliding (Fromm et al., 2018). The available in situ soil and snow measurements (e.g., temperature, LWC) were recorded as single point measurements. While the temporal resolution of these measurements was high, the sensors were rarely located below a glide crack or avalanche (Fromm et al., 2018; Ceaglio et al., 2017). A recent approach to modeling the distribution of glide-snow avalanche release areas (Fees et al., 2024b) suggested that the spatial variability in the basal friction is important for glide-snow avalanche release. We suspect that the basal friction is linked to the presence of interfacial water, but to the best of our knowledge, the influence of spatio-temporal soil–snow LWC on snow gliding has not been investigated in the field.
To investigate the source, quantity, and spatial distribution of the interfacial water before and during avalanche release, we installed a sensor grid for spatio-temporal measurements within a slope with frequent glide-snow avalanche activity. The 24 grid sensors measured the soil temperature and LWC across the slope at a soil depth of 5 cm. Temperature and LWC at the interface and in the snow were monitored locally on the slope with a vertical sensor profile ranging from the soil into the snow. During seasons 2021/22 to 2023/24 a total of seven glide-snow avalanches released over the sensor grid. These events provide the basis for our phenomenological investigation into the source, quantity, and spatial distribution of interfacial water before and during avalanche release.
The study area is located on the mostly southeast-facing hillslope of the Salezer Horn called Dorfberg (1650 to 2100 , Davos, Switzerland, Fig. 1). Meteorological data are recorded at four automated weather stations (AWSs) in close proximity, ranging in elevation from Davos to Weissfluhjoch (1563–2536 , Table 1). The average sum of new snow height is 4 m in Davos and 7 m at Weissfluhjoch (16-year average for seasons 2009 to 2024, Fig. 2, season 2009 refers to winter season 2008/09). The glide-snow avalanche activity on Dorfberg has been monitored with time-lapse photography since season 2009 and was extracted using a semi-automated pixel detection algorithm, which was introduced by Fees et al. (2025). In addition, we simulated the snowpack at 11 representative virtual stations on Dorfberg using the meteorological data from the AWSs of Weissfluhjoch and Klosters-Madrisa as input and of Dorfberg as validation (Table 1) (Fees et al., 2025). The simulation was initiated without soil and with the bucket approach for meltwater percolation (for SNOWPACK setup and validation, see Fees et al., 2025). The SNOWPACK simulations were used to classify the avalanches into surface and interface events. Surface events were defined as events where the water at the soil–snow interface originated from the snow surface through the percolation of meltwater or rain. In interface events, the liquid water forms at the soil–snow interface, which was defined by a lack of simulated meltwater formation (Fees et al., 2025).

Figure 2Observed number of glide-snow avalanches on Dorfberg (yellow) and sum of new snow height (November to April) at Weissfluhjoch (2536 , green) and in Davos (1563 , blue) for seasons 2009 to 2024. The average is indicated with the corresponding horizontal line. Seewer Berg was monitored from seasons 2022 to 2024, which includes season 2023, when only one glide-snow avalanche was recorded on Dorfberg.
Table 1Weather stations in proximity to Dorfberg. IMIS: Intercantonal Measuring and Information System.

The slope we monitored on Dorfberg is called Seewer Berg. This southeast-facing slope (46.8183° N, 9.8367° E; 1765 to 1818 ; slope of (31±5)°; Fig. 1) experiences frequent glide-snow avalanche activity which is well documented through time-lapse photographs (Fees et al., 2025). The slope is mostly covered in long grass (Fig. 3d) with interspersed shrubs and small rocky areas (Feistl et al., 2014). There is no superficial water source within the slope, making it a suitable choice to investigate the source of interfacial water while excluding influences from groundwater sources. Approximately 100 m northwest of the Seewer Berg slope is a shallow slope (≈20°) that was used as a reference site. The reference site is protected from glide-snow avalanches that originate from higher-elevation slopes by a small hill located just above the site. The reference site was used to record (bi)weekly manual snow profiles (Fig. 3). Two soil profiles, taken on the Seewer Berg slope (location of vertical sensor profiles, Fig. 3a) and in the reference location, indicated that the upper 30 cm of the soil is a sandy loam with relatively low densities ranging between 390 and 890 kg m−3 (Soil Survey Staff, 1999; Lombardo et al., 2025).
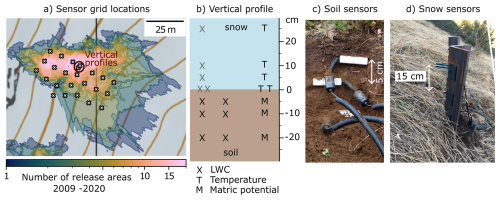
Figure 3(a) The Seewer Berg slope with the location of the soil LWC sensors (×). The maroon circle indicates the location of the vertical profiles across the soil–snow interface. (b) Schematic of the vertical soil–snow profile. The soil LWC sensors and matric potential sensors have an integrated temperature sensor. (c) Picture of a vertical soil LWC profile. (d) Picture of the wedges for snow LWC and temperature monitoring. Map: Federal Office of Topography, north up, contour line spacing of 10 m.
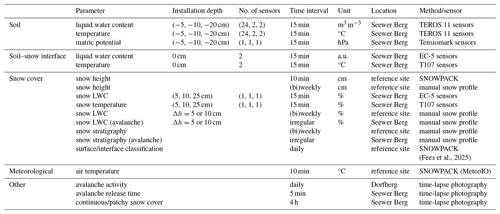
From seasons 2022 to 2024, we continuously monitored the soil and snow conditions on the Seewer Berg slope using a total of 44 sensors across the entire slope (Table 2). The time interval between measurements was 15 min for all sensors, and all liquid water content (LWC) measurements were capacity based.
(Fees et al., 2025)Soil. The soil was monitored in 24 locations across the entire slope using a grid of combined soil LWC and temperature sensors (TEROS 11, Meter Group). The sensors were installed at a soil depth of −5 cm. At this depth, the sensor's measurement volume (1010 cm3, Meter Group, 2024) is covered by soil but is positioned as close to the soil–snow interface as possible. The grid spacing between sensors was approximately 8 m by 8 m (Fig. 3a), and the maximum distance between two sensors is 52 m.
Interface. The soil–snow interface was monitored with a vertical profile of sensors ranging from a soil depth of −20 cm to a snow height of 25 cm (Fig. 3b). The location of the vertical profile was in a common glide-snow avalanche release path (Fig. 3a), which was selected based on 13 years (2009–2021) of glide-snow avalanche activity extracted from time-lapse photographs (Fees et al., 2025). The vertical profiles included the following sensors. (i) In the soil (depths of −5, −10, −20 cm) there were two LWC and temperature sensors (TEROS 11, Fig. 3b and c) and one matric potential sensor at each depth (Tensiomark, ecoTech Umwelt-Messsysteme GmbH). The matric potential sensors were installed in summer 2022. (ii) At the soil–snow interface (depth of 0 cm) there were two LWC sensors (EC-5, Meter Group) and two temperature sensors (T107, Campbell Scientific). (iii) In the snow (heights of 5, 10 and 20 cm) there were one LWC (EC-5) and one temperature (T107) sensor at each height. The sensors in the snow were mounted on two vertical iron wedges (Fig. 3d) with 3D-printed inlets to prevent metal from the wedges from affecting the sensor's measurement volume. We used the EC-5 sensors for measurements in the snow and at the interface due to their smaller measurement volume (240 cm3), allowing for more localized measurements.
Snow. The snowpack was observed through (bi)weekly manual snow profiles at the reference site (Fig. 1). Snow stratigraphy, including grain size and grain type, were recorded using a magnifying glass and grid (Fierz et al., 2009). Density and relative permittivity were measured every 5 to 10 cm to derive LWC (Denoth, 1994). Snow density was obtained from the average of two measurements per height with a cylindrical density cutter (100 cm3). The relative permittivity was determined with a capacitive probe (Denoth, 1994). In the case of a glide-snow avalanche on the Seewer Berg slope, an additional manual snow profile was recorded close to the fracture line, typically within 1 or 2 d after release.
4.1 Measurements
Soil. We evaluated the reliability of the sensors using data from summer rainfalls. Four soil LWC sensors (locations indicated in Fig. 4) responded slowly to the infiltrating water compared to the rest of the sensors. These sensors may not have been fully connected to the soil matrix, and we excluded them from soil LWC observations during the winter seasons. When an avalanche released over the sensor grid, we separated the grid sensors into sensors within the release area and sensors outside the release area (Fig. 4). To identify the sensors within the release area, we extracted the release area from time-lapse photographs. However, we previously observed that extracting the release area from the time-lapse photographs tends to underestimate the release area, especially for small avalanches (Fees et al., 2025). We manually added sensors when we observed additional snow-free sensors in the field while recording the manual snow profiles in the release area.
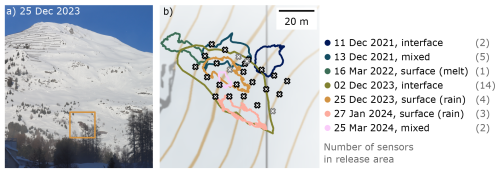
Figure 4(a) Picture of the release area on the Seewer Berg slope (rectangle) on 25 December 2023. (b) Release areas extracted from time-lapse photographs for glide-snow avalanches on the sensor grid. Every avalanche was classified based on the source of interfacial water: interface (water originated from the soil–snow interface), surface (water originated from the snow surface), and mixed (combined interface and surface). Grid sensors (×) that were not used for soil LWC observations are marked in gray. The number of sensors within the release area after manual modification (without excluded gray sensors) is given in parentheses for every avalanche. Map: Federal Office of Topography, north up, contour line spacing of 10 m.
Interface. The interface LWC sensors were installed within the vegetation. The measurement volume of these sensors extended from the soil, across the (vegetation) interface, and into the snow. As a result, they measured a combination of soil, vegetation, and snow LWC, making a sensor calibration for quantitative analysis difficult. We used the raw values (arbitrary units: a.u.) to investigate relative changes.
Snow. To monitor the LWC within the snow, we deployed three sensors on metal wedges (Fig. 3d). When the snow cover did not sufficiently cover the wedges, preferential melt occurred around the wedges and the sensors measured the permittivity of air and meltwater instead of snow. To exclude these measurements, time periods with positive temperature recordings on the wedges were excluded. Such periods occurred frequently due to a generally shallow snow cover through season 2022 (Fig. 2) and repeated avalanche release in season 2024. The snow LWC sensors were calibrated for snow in the laboratory (prediction uncertainty of 1.7 %, Koch, 2023). To account for small inter-sensor or setup-induced variations, the air permittivity was determined in situ by the mean measurement during a dry summer time period. When we use the term “snow LWC” we refer to the liquid water content of the interfacial snow. We defined the interfacial snow as the lowermost 20 cm of the snowpack. For the manual snow profiles, we calculated the snow LWC as the mean of all measurements (capacitive probe) within the lowermost 20 cm of the snowpack. To calculate the mean, we excluded measurements in dry snow (0 % LWC).
Snow cover. The snow cover across the Seewer Berg slope was manually classified into time periods of a continuous snow cover and a patchy snow cover using the time-lapse photographs. A pixel in the time-lapse photographs corresponds to an area of approximately 0.25 m2 (Fees et al., 2025). The snow cover was considered patchy when more than one grid sensor was snow free. Only time periods with a continuous snow cover were taken into account for measurement aggregation such as season mean values.
4.2 Measurement uncertainties, averages, and significance test
The measurement uncertainty in aggregated sensor measurements consists of the sensor accuracy for a single measurement and a statistical component (e.g., the standard deviation). Unless otherwise indicated, the uncertainty visualized and given in the results refers to the standard deviation. The sensor accuracies are listed in Table B1. For context, we compare measurements to the winter season average. The winter season was defined as the snow-covered time period between 15 October and 15 April. For the soil LWC–temperature measurements, the winter season average was calculated as the average across all soil LWC sensors and across all time steps. The standard deviation indicates the fluctuations in the average sensor measurements. When we compared data from two different groups (e.g., interface/surface, inside/outside the release area), we used the Mann–Whitney U test.
4.3 Spatial dependence: variogram
We determined the degree of spatial dependence between measurements across the sensor grid using the variogram. A variogram relates the variances of observations at different spatial separations (Oliver and Webster, 2015). We calculated the overall variance (σ2) from the measurements and binned the differences between observations of our sensors uniformly by sensor distances. An exponential function was fitted to the experimental data to determine the range (r) (details in Appendix A). The range indicates the distance above which measurements are no longer spatially correlated (Oliver and Webster, 2015). A small variance and a large range indicate high spatial uniformity (i.e., low spatial variability). We calculated the range and variance for every time step (15 min) to investigate the spatio-temporal development recorded by the sensor grid before avalanche release.
We observed seven glide-snow avalanches over the sensor grid on the Seewer Berg slope during season 2022 and season 2024 (Fig. 4). In this section, we first show an overview of the winter seasons and their avalanche activity, which indicated that water at the soil–snow interface was a prerequisite for avalanche release. We then analyzed the source, quantity, and spatial distribution of the interfacial water based on the recorded glide-snow avalanche events on the Seewer Berg slope.
5.1 Seasonal overview and interfacial water
The 2022 winter season (Fig. 5a) was characterized by below-average new snow totals (Fig. 2). The first large snowfall in December was followed by a mostly dry and warm January. At the beginning of February, there was another large snowfall followed by a relatively dry February and March (Fig. 5a2). The average soil LWC was (0.35 ± 0.01) m3 m−3, and the average soil temperature was (1.5 ± 0.5) °C. On Dorfberg, a total of 46 glide-snow avalanches were recorded, which is slightly below the 16-year average of 62 avalanches (Fig. 2).
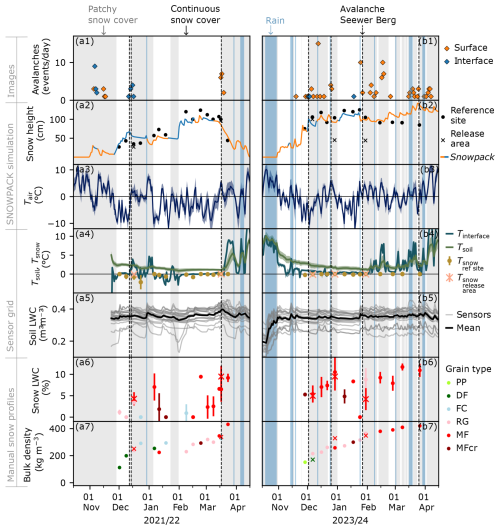
Figure 5Overview (daily mean values) of (a) season 2022 and (b) season 2024. The background colors indicate patchy snow cover (gray), continuous snow cover (white), or rain (blue). The dashed line indicates the time of avalanche release on the Seewer Berg slope. (a1, b1) Avalanche activity on Dorfberg derived from time-lapse photographs classified as surface (orange) or interface (blue) events based on the SNOWPACK simulation. (a2, b2) Snow height simulated at the reference location (line, classified as surface/interface with SNOWPACK) and snow heights from manual snow profiles at the reference location (⋅) or from avalanches on the Seewer Berg slope (×). (a3, b3) Air temperature at the reference location (SNOWPACK). (a4, b4) Mean soil temperature across the sensor grid, the mean interface temperature, and the interfacial snow temperature from the manual snow profiles. (a5, b5) Soil LWC recorded by the individual sensors (gray) and the mean across all grid sensors (black). (a6, b6) Snow LWC observed in the manual snow profiles in the reference location (⋅) and behind the fracture line of avalanches on the Seewer Berg slope (×). The color indicates the grain type of the lowermost snow layer. (a7, b7) Snowpack bulk density colored by the dominant grain type within the snow profile. Grain types: precipitation particles (PP), decomposing and fragmented precipitation particles (DF), faceted crystals (FC), rounded grains (RG), melt forms (MF), melt–freeze crust (MFcr).
The 2023 winter season was characterized by below-average snowfall (Fig. 2). On Dorfberg, the snow cover was sparse and intermittent, and we observed one glide-snow avalanche. This was the season with the lowest glide-snow avalanche activity recorded on Dorfberg since the start of observations in season 2009 (Fig. 2).
The 2024 winter season (Fig. 5b) was characterized by a first snowfall in the beginning of November followed by a large snowfall at the end of November and continuous snowfalls throughout December. This was followed by a warm and mostly dry January and February. The sum of new snow height was above average, and the number of recorded glide-snow avalanches (104) was the second highest since the start of observations in season 2009 (Fig. 2). Overall, the season was characterized by continuous glide-snow avalanche activity with 2 d of exceptionally high activity on 12 December 2023 and 25 January 2024, both after a rain-on-snow event. The average soil LWC was comparable to season 2022 with (0.35±0.01) m3 m−3. The average soil temperature of (3±1) °C was significantly higher than in season 2022 (p<0.01, Fig. 5a4 and b5).
The glide-snow avalanche activity in season 2022 occurred in three distinct clusters (Fig. 5a1). Around the December and March clusters, we observed a snow LWC of 4 % and 9 % respectively (Fig. 5a6). Between the two clusters, either the snow LWC was generally low (<4 %) or low air temperatures caused a quick decrease in snow LWC due to refreezing (6 January 2022). In comparison, glide-snow avalanche activity in season 2024 occurred continuously throughout the season (Fig. 5b1) and we observed overall higher snow LWC (Fig. 5b6). Throughout the season, we only observed one manual snow profile without snow LWC (24 January 2024). This snow profile was followed by a rain-on-snow event the following day. The rain reintroduced water to the soil–snow interface, which we observed through water percolation into the soil (Fig. 5b5). The comparison of the time of glide-snow avalanche activity and the snow LWC indicated that water at the soil–snow interface was a prerequisite for avalanche activity in both seasons.
5.2 Source of interfacial water
As shown above, the observation of snow LWC in manual snow profiles at the reference location coincided with the occurrence of glide-snow avalanches on Dorfberg, suggesting that interfacial water is a prerequisite for glide-snow avalanche activity. In the following, we investigate the source of interfacial water in detail based on the seven glide-snow avalanches that released over the sensor grid on the Seewer Berg slope (Fig. 4).
5.2.1 Interface events
We classified four glide-snow avalanches (11 December 2021, 13 December 2021, 2 December 2023, 25 March 2024) as interface events (Fig. 4). The possible sources of interfacial water for interface events are melting of the basal snow layer by geothermal heat and/or capillary suction from the soil into the snow (Mitterer and Schweizer, 2012a).
All interface events released several (13, 15, 8, 2) days after snowfall on bare ground. In the continuously snow-covered periods 8 d preceding the avalanche, the interface events showed constant (Fig. 6a3 and c3) and above-average soil temperatures across the sensor grid (Fig. 6a3, c3, and f3). For all avalanches, the soil temperatures in the release area were higher than in the remaining sensor grid (Fig. 7a). These observations indicate that the interface events were driven by geothermal heat melting the lowermost snow layer due to high soil temperatures. In addition to the above-average soil temperatures, we observed indications of interfacial meltwater being drawn upwards into the interfacial snow and remaining there for several days (Fig. 6a4 and c4).
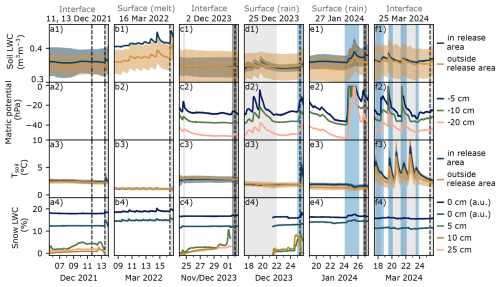
Figure 6(a–f) Soil and snow measurements throughout the 8 d before avalanche release. The background color indicates patchy (gray) or continuous (white) snow cover or rain (blue). The dashed line indicates the time of avalanche release on the Seewer Berg slope with the range of uncertainty in dark gray. Results from sensor groups (inside/outside the release area) are visualized as the mean (line) and standard deviation (shading) between the sensors within the group. The parameters include the following: (a1–f1) the soil LWC for sensors located inside (blue) and outside (yellow) the release area. (a2–f2) The soil matric potential which has been recorded since summer 2022. (a3–f3) The soil temperature inside (blue) and outside (yellow) the release area. (a4–f4) The snow LWC sensors at the interface (arbitrary units) and at three snow heights. When there are no measurements available (b4, e4, f4), this was due to insufficient snow heights which caused preferential melt around the wedges.
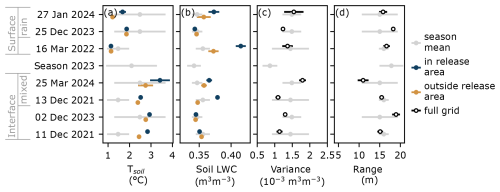
Figure 7Comparison of the soil properties before avalanche release with the season mean (gray) sorted by the source of interfacial water. The mean soil properties were calculated as the mean across the sensors by group and all snow-covered time steps within 8 d before avalanche release. For rain-on-snow events the average was calculated from the start of the rain to the time of avalanche release. The season mean was calculated across all sensors and snow-covered measurements recorded between 15 October and 15 April. The standard deviation refers to the temporal distribution of mean sensor measurements. The (a) soil temperature and (b) soil LWC were separated in sensors inside (blue) and outside (yellow) the release area. The spatial distribution of the soil LWC was quantified across the entire grid (black) using (c) the soil LWC variance and (d) the soil LWC range (Appendix A).
A large snowfall (60 cm) on 24 November 2023 fully covered the wedges with the snow LWC sensors. The sensor at 5 cm height measured an increase in snow LWC shortly after the initial snowfall until the snow LWC reached around (2.6±0.1) % (average for 26 November). A slower, time-shifted increase in snow LWC was observed at 10 cm which reached (1.9±0.1) % and at 25 cm which reached (1.7±0.1) %. The snow LWC remained elevated for several days before the sensors broke shortly before the avalanche released (2 December 2023) (Fig. 6c4). The snow LWC sensors likely broke due to small glide or creep movements of the snowpack. However, no visible indications of glide-crack formation were observed on the time-lapse photographs. The snow LWC sensor at 5 cm peaked shortly before breaking (1 December). It is currently unclear if this peak was due to an increase in snow LWC or from the deformation of the sensor shortly before breaking. The snow LWC observed in the release area 4 d after avalanche release was (5±1) %, comparable to the snow LWC measured at the wedges before release (Figs. 5b6 and 6c4). This increase in snow LWC before avalanche release was not observed for the other interface events due to shallow snow heights which did not sufficiently cover the snow LWC sensors. However, the manual snow profiles in the release areas showed melt forms in the lowermost snow layer for all interface events independent of the majority grain type in the remaining profile (Fig. 5a6, a7, b6, and b7). This indicates that water existed in the lowermost snowpack layer before avalanche release.
Capillary suction of water from the soil into the snow has been suggested as another potential source of interfacial water (Mitterer and Schweizer, 2012b). For two events (11 December 2021, 2 December 2023), we observed that the soil LWC leading up to glide-snow avalanche release was constant and its quantity was comparable between the release area, the remaining sensor grid, and the season mean (Figs. 6a1, c1, and f1 and 7b). Based on the measured saturation, capillary suction was unlikely to contribute substantial amounts of interfacial water across the sensor field (Lombardo et al., 2025).
For the other two interface events (13 December 2021, 25 March 2024), we observed above-average soil LWC in the release area (13 December 2021) and across the entire grid (25 March 2024). The 13 December 2021 avalanche released shortly after the 11 December 2021 avalanche, which was classified as an interface event. However, on the day before avalanche release (12 December 2021), positive air temperatures occurred in combination with the shallow snowpack (27 cm, 16 December) which could have caused surface meltwater formation and percolation (Fig. 5a2, a3, and a5). We therefore classified this avalanche as a mixed event, i.e., a combination of interface and surface events.
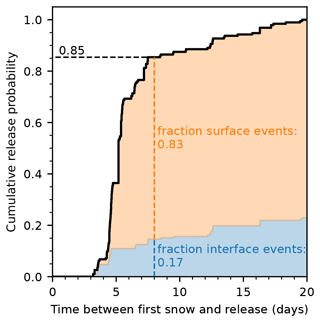
The 25 March 2024 avalanche differed from the other interface events as it occurred in spring after a snowfall on snow-free ground. Several rain events on bare ground in the 8 d leading up to the release resulted in a soil LWC above the season mean (Fig. 7b). However, soil LWC, matric potential, and interface sensors showed no indication of meltwater percolation (Fig. 6f1, f2, and f4) after the snowfall occurred. Due to the high soil temperatures, we suspect that the main source of interfacial water was due to geothermal heat. However, due to the positive air temperatures and shallow snowpack, contributions from meltwater percolation are also possible (Fig. 5b3). The snowpack across the Seewer Berg slope melted out within the day of avalanche release, which prevented us from recording a manual snow profile in the release area. This event was also classified as a mixed event. The long-term observations of avalanches on Dorfberg suggest that such mixed events occur frequently. A majority (85 %) of glide-snow avalanches that released within the first 8 d after the first major snowfall of the season showed surface meltwater formation in the SNOWPACK simulations. These events are likely mixed events where water originates from geothermal heat and surface melt (Fig. C1).
5.2.2 Surface events
We classified three avalanches as surface events. These included one event due to meltwater percolation (16 March 2022) and two events due to rain (25 December 2023, 27 January 2024).
For the meltwater-driven glide-snow avalanche (16 March 2022), we observed diurnal peaks of meltwater infiltration into the soil during the 7 d preceding avalanche release. These peaks occurred around 13:00 local time (LT), coinciding with the expected time for diurnal meltwater percolation across the soil–snow interface (Fig. 6b1 and b4). The vertical soil sensor profiles showed that the meltwater percolated through the soil (Fig. 8a). The diurnal observation of water infiltration in the soil indicates that water reached the soil–snow interface several days before the avalanche released. The soil LWC across the entire slope was substantially above the season mean, and the soil LWC in the release area was significantly higher than the soil LWC in the remaining slope (p<0.01, Fig. 7b).
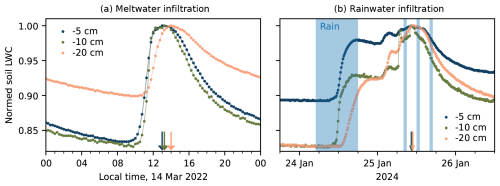
Figure 8Normalized LWC for three soil depths which show (a) meltwater and (b) rainwater infiltration. The soil LWC was normalized with the maximum value to better visualize the time shift in the percolation. The arrows indicate the time of the maximum. The time of rain (blue) was extracted from the SNOWPACK simulation at the reference location.
For both rain-on-snow events (25 December 2023, 27 January 2024), we observed that the rain percolated through the snowpack into the soil. The soil LWC, matric potential, and interface sensors all showed an increase in available water at the interface and in the soil (Fig. 6d1, d2, d4, e1, e2, and e4). For the 27 January event, the cold percolating water (Fig. 8b) also caused the soil temperature to decrease for a short time (Fig. 6e3) and the matric potential sensors showed that soil saturation (−1 hPa) was reached temporarily (Fig. 6e2). Both avalanches released after the initial observation of water percolation into the soil and 1 d (25 December 2023) and 2 d (27 January 2024) after the rain. This indicates that water reached the soil–snow interface for around 0.5 to 1.5 d before the avalanche released.
The soil LWC for the rain event of 27 January 2024 was significantly higher in the release area compared to the rest of the grid, a pattern we did not observe for the 25 December 2023 avalanche (Fig. 7b). It has to be noted that the 25 December avalanche occurred 4 d after the previously snow-free Seewer Berg slope was covered again by snow. As a result, the snowpack was likely comparable to an early-season (interface event) snowpack with a low bulk density (Fig. 5a7 and b7) before the rain occurred. We suspect that, due to the early-season snowpack, smaller quantities of interfacial snow LWC were sufficient for avalanche release (Fig. 9). This could explain why we observed an onset of water percolation into the soil but not yet above-average soil LWC.
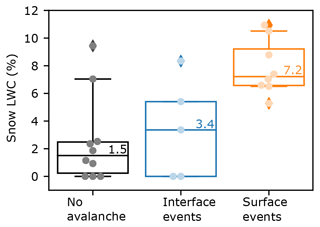
Figure 9Snow LWC observed in the manual snow profile (reference location) grouped by the activity (no avalanche (n=10), surface event (n=8), interface event (n=5)) which occurred within ±4 d of the manual snow profile. The suspected source of interfacial water (surface/interface) was classified based on the SNOWPACK simulation. The median value is given, and the whiskers indicate the 5th and 95th percentile. Surface events showed significantly higher snow LWC than interface events (p=0.04). Snow profiles were filtered manually to exclude the end of the season and a lack of continuous snow cover.
Geothermal heat or capillary suction likely did not contribute to the formation of interfacial water for the observed surface events. For all surface events, we observed that the soil temperatures across the grid were below average, reducing the potential water contribution through geothermal heat (Fig. 7a). For the 25 December 2023 rain event, soil LWC was not close enough to saturation to allow for capillary suction (Fig. 7b). For the 27 January 2024 rain event, the matric potential sensors indicated that the soil was close to saturation (−1 hPa, Fig. 6e2), which would technically allow for capillary suction from the soil into the snow (Lombardo et al., 2025). However, the high saturation was only reached when the water from the soil–snow interface percolated into the soil, so the water was already present at the soil–snow interface.
5.3 Quantity of interfacial water
The snow LWC that we observed for interface events was (3±1) % 3 d before release (snow LWC sensor, 2 December 2023), (5±1) % (6 December 2023), and (3±2) % (16 December 2021) in the release area.
The snow LWC that we observed for surface events was (9±2) % (surface melt, 16 March 2022), (9±1) % (29 December 2023), and (9±3) % (30 January 2024), measured at the reference location. The release area profile likely underestimated snow LWC due to cold air temperatures during the night before the profile was recorded. Overall, the observed snow LWC in the reference profile around the time of avalanche release was significantly higher than for the interface events (p=0.04, Fig. 9).
5.4 Spatio-temporal distribution of interfacial water
We analyzed the spatio-temporal distribution of soil LWC to assess its variability for interface and surface events. In general, based on a geostatistical analysis, it can be expected that spatio-temporal variability decreases with increasing range and/or decreasing variance. A low spatial variability indicates a more uniform distribution of soil LWC across the slope. We excluded the avalanche of 13 December 2021 from this analysis because the avalanche 2 d prior (11 December 2021) caused patchy snow cover and the grid sensors subsequently experienced variable conditions.
Across all seasons, the observed average range during snow-covered periods was (17±1) m and the variance was . The average values were comparable between seasons (Fig. 7c and d). The observed glide-snow avalanches showed an average range of (16±3) m and an average variance of at the time of release. The spatio-temporal development of the soil LWC variability before avalanche release showed three distinct spatio-temporal behaviors.
The first behavior was observed for one interface event (11 December 2021), one mixed event (25 March 2024), and one rain-on-snow event (25 December 2023). For these events, the time of avalanche release coincided with a local minimum in soil LWC variability (low variance and/or large range, Fig. 10a, c, and e). The variability decreased throughout the day(s) prior to release, and we observed fluctuations in increasing/decreasing range at similar variances before release. For these events, no water infiltration occurred from the interface into the soil. It is currently unclear what drives the spatio-temporal evolution of the soil LWC variability without water infiltration from the snowpack.

Figure 10Temporal evolution of the spatial soil LWC variability before avalanche release (red, t=0). The spatial variability decreases with decreasing soil LWC variance and/or increasing soil LWC range. Low spatial variability indicates a more uniform soil LWC distribution. More than one red point indicates the uncertainty in the time of release due to limited visibility in the time-lapse photographs.
Another version of the first behavior was observed for an interface event (2 December 2023). We observed increases and decreases in range but no substantial decreases in variance (Fig. 10b). The avalanche finally released during a heavy snowfall with rapidly increasing snow load. The increasing snow load may have contributed to the critical conditions resulting in glide-snow avalanche release.
The second behavior was observed for the surface event driven by melt (16 March 2022, Fig. 10d). The recurring diurnal meltwater percolation into the soil resulted in a repeating pattern of decreasing and increasing spatial variability. The avalanche released when the overall soil LWC variability decreased as part of the diurnal pattern. However, the avalanche did not release at the minimum soil LWC variability, which had been reached several days prior to release. It is currently unclear if a change in conditions, for example, of the snowpack, was necessary to cause avalanche release.
The third behavior was observed for the rain-on-snow event of 27 January 2024 (Fig. 10f). The soil LWC uniformity 7 d before avalanche release was quantitatively comparable to the uniformity at the time of release. However, there was no interfacial water available 7 d before release (0 % snow LWC, 24 January 2024, Fig. 5b6). The rain not only percolated to the soil–snow interface and into the soil but also initially increased the soil LWC variability. We suspect that this increase in soil LWC variability was due to the rainwater percolation along preferential flow paths through the snowpack that was not isothermal yet. This would introduce a heterogeneous pattern of water percolation into the soil and increase variability. The avalanche released once the soil LWC variability had decreased again substantially within the next 2 d.
We observed snow and soil conditions in space and time for seven glide-snow avalanches before and during avalanche release. This allowed us to investigate the source, quantity, and spatial distribution of the interfacial water involved in glide-snow avalanche release. The small number of observed glide-snow avalanches currently limits the generalization of findings. However, when possible we supported our findings with the 16-year dataset of Dorfberg (Fees et al., 2025).
6.1 Source and quantity of liquid water
We observed a wide range of sources for interfacial water for glide-snow avalanches including geothermal heat (n = 2), meltwater (n=1), rain (n=2), and mixed types with geothermal heat and melt (n=2). We considered contributions of interfacial water due to capillary suction of water from the soil into the snowpack to be unlikely due to low soil saturation (detailed investigation in Lombardo et al., 2025). Sufficient soil saturation for capillary suction was mostly observed when water originated from melt or rain and percolated into the soil. This observation was in contrast to Ceaglio et al. (2017), who observed indications of capillary suction. This difference may be due to the presence of a groundwater source at the field site in Ceaglio et al. (2017) and no groundwater source on the Seewer Berg slope.
We used a combination of meteorological, snow, and soil observations to classify the avalanches based on their suspected source of interfacial water. These proxies were needed due to the lack of available measurement methods that allowed for spatio-temporal snow LWC monitoring. Locally, it was possible to measure the snow LWC using a capacitive LWC sensor mounted on a wedge. This sensor measured one instance where we suspect geothermal heat melted the new snow at the soil–snow interface and the available water was sucked into the snow and remained there for several days before avalanche release (Fig. 6c4). This is our only observation of this process because the wedge (height of 30 cm, Fig. 3d) introduced preferential melt in its proximity if it was not sufficiently covered by snow.
Another method to measure the snow LWC is through snow profiles. Using snow profiles, we found non-zero snow LWC during times of avalanche activity, in line with observations by Fromm et al. (2018) and Ceaglio et al. (2017). In addition, we observed that snow LWC was significantly lower for interface events than for surface events (Fig. 9), in line with Maggioni et al. (2019). This observation may be related to the snow cover below the release area, called the stauchwall. It is suspected that interface events driven by geothermal heat are common when the relatively warm soil is newly covered in snow. This new snow has a lower density than the snow cover in early spring (Fig. 5a7 and b7). Bartelt et al. (2012) suggested that lower snow densities are associated with a weaker stauchwall. As a result, less interfacial water may be needed for a glide-snow avalanche to release.
For two out of four interface events, we observed that interfacial water may have originated from meltwater percolation, in addition to geothermal heat. Our long-term observations of avalanche activity with time-lapse photography and SNOWPACK simulations support this finding (Fig. C1). These common mixed events (interface and surface events) could explain why Dreier et al. (2016) found higher air and snow surface temperatures for avalanches that released in early winter (before mid February).
6.2 Spatial variability
Previous studies (Fromm et al., 2018; Ceaglio et al., 2017; Maggioni et al., 2019) found that the soil temperature and the soil LWC were related to snow gliding. Generally, we observed higher local soil temperatures or soil LWC (or both) in the release areas compared to the rest of the slope. This suggests that the local temperature/soil LWC may indicate the location of glide-snow avalanche release. These local differences highlight the importance of spatio-temporal monitoring. Further investigation focusing on the cause of local differences such as soil inhomogeneities, plant cover inhomogeneities, and preferential flow patterns is necessary to narrow down the cause and timing for glide-snow avalanche release at the slope scale.
The investigation of the soil LWC across the grid showed that spatial variability often decreased before avalanche release (Fig. 10). This supports the hypothesis from recent pseudo-3D modeling (Fees et al., 2024b) that the spatial variability in the basal friction is important for glide-snow avalanche release. The range across the Seewer Berg slope varied at the meter length scale within the days to hours before avalanche release. When interpreting the soil LWC variability, interface and surface events have to be separated. For surface events, we observed water percolation from the interface into the soil. In this case, soil LWC uniformity may be a good proxy for the interfacial water distribution. The percolation may indicate locations with more interfacial water and thus reflect the spatial variability in water at the soil–snow interface. For interface events, we did not observe water percolation from the interface into the soil. Instead, we observed the capillary rise in water (formed at the soil–snow interface through geothermal heat) into the snow (Fig. 6c4). The relationship between the soil LWC variability and the interfacial water is not yet clear and requires further investigation.
Table 3Overview of observed behavior for interface and surface events. Mixed events showed characteristics of interface and surface events. Spatial refers to the differences in measurements inside and outside the release area. Temporal refers to measurements within 8 d before avalanche release.
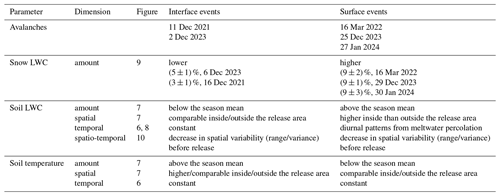
The spatial distribution of soil temperature may be a suitable proxy for the interfacial water distribution in interface events. However, the soil temperature did not fulfill the assumption of a random field necessary to assess spatial variability using the variogram. While the 8 m×8 m sensor grid spacing was suitable for an initial investigation of spatial variability, smaller distances between sensors would provide more detailed spatial information. More available measurements would also allow for the investigation of potential directional anisotropies across the slope.
Overall, our results indicate that a sufficient quantity (snow LWC interface events of ∼3 %, surface events of ∼7 %) and low spatial variability in water are needed for glide-snow avalanche release. During seasons with continuous glide-snow avalanche activity (e.g., season 2024), these potentially critical conditions prevailed throughout most of the season. When those potentially critical conditions exist, snow loading with new snow may then facilitate avalanche release (e.g., 2 December 2023). Dreier et al. (2016) also found that avalanches often released after snowfalls based on observations of season 2012 on Dorfberg, which was characterized by continuous glide activity (Fig. 2) and likely prevailing critical conditions.
Our classification into interface and surface events based on SNOWPACK simulations generally agreed well with our field observations. However, to quantify the snow LWC leading up to interface events, the soil has to be implemented (ideally driven with measured soil LWC and temperature) in the simulations. To investigate, predict, or monitor avalanches at the slope scale, spatio-temporal monitoring of soil LWC, temperature, and if possible snow LWC seems promising and necessary.
We installed a spatio-temporal monitoring setup for soil and local snow in an avalanche-prone slope. During seasons 2022 to 2024, we observed seven glide-snow avalanche releases over our sensor grid. We analyzed these avalanches in detail to investigate the source, quantity, and spatial distribution of liquid water before and during avalanche release (Table 3). The interfacial water we observed originated from (i) geothermal heat (n=2), (ii) meltwater percolation from the surface (n=1), (iii) rain (n=2), and (iv) a combination of geothermal heat and meltwater percolation (n=2). Our results show that the amount of snow liquid water content and its spatial distribution are important for glide-snow avalanche release. For interface (geothermal heat) events, we observed lower snow LWC (∼3 %) before/after avalanche release than for surface (melt, rain-on-snow) events (∼7 %). For most events, the release area locally showed (i) higher soil temperatures during the 8 d preceding an avalanche associated with geothermal heat and (ii) higher soil LWC in the release area during the 8 d preceding a surface event. The spatial variability in soil LWC repeatedly (four out of six avalanches) showed a local minimum at the time of release. In the future, with continued observation, the spatio-temporal investigation of the soil will help to quantify the drivers for glide-snow avalanche release depending on the source of liquid water at the slope scale. Linking the quantity and spatial distribution of interfacial water to its drivers will be an important step towards more accurate prediction of avalanche release timing. In addition to improved process understanding, continued spatio-temporal monitoring is a promising approach to narrow down length and timescales as well as suitable proxies for glide-snow avalanche monitoring that could be used for mitigation or forecasting.
We determined the degree of spatial dependence between measurements using the variogram. A variogram relates variances of observations at different spatial separations (Oliver and Webster, 2015). We calculated the overall variance (σ2) from the measurements and binned the distances of our sensors uniformly. We fitted an exponential function to our observations:
which does not take into account a nugget effect. As the exponential function asymptotically approaches the variance (σ2), the range was defined as r=3a, where 95 % of the variance was exceeded (Oliver and Webster, 2015).
Sensor specifications are listed in Table B1.
ecoTech Umwelt-Messsysteme GmbH (2014)Meter Group (2024)Meter Group (2023)Campbell Scientific Inc. (2018)We investigated the source of interfacial water for glide-snow avalanches that released within 20 d after the first snowfall of the season on bare ground. The first snowfall of the season was defined as the snowfall that starts the season's snowpack and does not melt within a few days. This investigation was based on the long-term Dorfberg observations (2009–2024), which consist of glide-snow avalanche activity extracted from time-lapse photographs and SNOWPACK simulations (Fees et al., 2025). The avalanches were classified as interface/surface events using the SNOWPACK simulations. The cumulative avalanche release probability increased substantially within the 8 d after the first snowfall (85 %, Fig. C1), and for most avalanches meltwater was a potential source of interfacial water (83 %, surface events). These events are likely mixed events, where contributions from geothermal heat and meltwater formation contributed interfacial water.
All sensor measurements are available on Envidat (https://doi.org/10.16904/envidat.583; Fees et al., 2024a).
Conceptualization: all authors. Methodology: all authors. Formal analysis: AF. Investigation: AF, AvH, ML. Data curation: AF. Writing – original draft: AF. Writing – review and editing: all authors. Visualization: AF. Supervision: AvH, JS. Funding acquisition: JS, PL.
At least one of the (co-)authors is a member of the editorial board of The Cryosphere. The peer-review process was guided by an independent editor, and the authors also have no other competing interests to declare.
Publisher's note: Copernicus Publications remains neutral with regard to jurisdictional claims made in the text, published maps, institutional affiliations, or any other geographical representation in this paper. While Copernicus Publications makes every effort to include appropriate place names, the final responsibility lies with the authors.
Color maps by Crameri et al. (2020). The authors would like to thank Katrin Meusburger for help with installing the first sensors; Grégoire Bobillier for helpful discussions; the electronics group at SLF (Chasper Buchli) for help with the field setup; and Flavia Mäder, Moritz Altenbach, and Leonardo Stapelfeldt for help with fieldwork. We would also like to thank the two referees and the editor Guillaume Chambon, who helped improve the manuscript.
This research has been supported by the Schweizerischer Nationalfonds zur Förderung der Wissenschaftlichen Forschung (grant no. 200021-212949).
This paper was edited by Guillaume Chambon and reviewed by two anonymous referees.
Ancey, C. and Bain, V.: Dynamics of glide avalanches and snow gliding, Rev. Geophys., 53, 745–784, https://doi.org/10.1002/2015RG000491, 2015. a, b, c
Bartelt, P., Feistl, T., Bühler, Y., and Buser, O.: Overcoming the stauchwall: viscoelastic stress redistribution and the start of full-depth gliding snow avalanches, Geophys. Res. Lett., 39, L16501, https://doi.org/10.1029/2012GL052479, 2012. a
Campbell Scientific Inc.: Instruction manual: model 107 temperature probe, Campbell Scientific Inc., https://s.campbellsci.com/documents/ca/manuals/107_man.pdf (last access: 5 August 2024), 2018. a
Ceaglio, E., Mitterer, C., Maggioni, M., Ferraris, S., Segor, V., and Freppaz, M.: The role of soil volumetric liquid water content during snow gliding processes, Cold Reg. Sci. Technol., 136, 17–29, https://doi.org/10.1016/j.coldregions.2017.01.007, 2017. a, b, c, d, e, f, g
Clarke, J. and McClung, D.: Full-depth avalanche occurrences caused by snow gliding, Coquihalla, British Columbia, Canada, J. Glaciol., 45, 539–546, https://doi.org/10.1017/S0022143000001404, 1999. a, b, c
Crameri, F., Shephard, G. E., and Heron, P. J.: The misuse of colour in science communication, Nat. Commun., 11, 5444, https://doi.org/10.1038/s41467-020-19160-7, 2020. a
Denoth, A.: An electronic device for long-term snow wetness recording, Ann. Glaciol., 19, 104–106, https://doi.org/10.3189/s0260305500011058, 1994. a, b
Dreier, L., Harvey, S., van Herwijnen, A., and Mitterer, C.: Relating meteorological parameters to glide-snow avalanche activity, Cold Reg. Sci. Technol., 128, 57–68, https://doi.org/10.1016/j.coldregions.2016.05.003, 2016. a, b, c
ecoTech Umwelt-Messsysteme GmbH: Manual for installation and use of Tensiomarks, ecoTech GmbH, https://www.stevenswater.com/resources/documentation/Stevens_Tensiomark_Manual.pdf (last access: 5 August 2024), 2014. a
Fankhauser, F.: Die Notwendigkeit einer Umgestaltung unseres Aufforstungsverfahrens im Gebirge, Schweiz Zeitschrift für Forstwesen, 69, 25–34, 1918. a
Fees, A., Lombardo, M., van Herwijnen, A., Lehmann, P., and Schweizer, J.: Spatio-temporal soil and local snow monitoring in a glide-snow avalanche prone slope above Davos, Switzerland, Envidat [data set], https://doi.org/10.16904/envidat.583, 2024a. a
Fees, A., van Herwijnen, A., Lombardo, M., Schweizer, J., and Lehmann, P.: Glide-snow avalanches: a mechanical, threshold-based release area model, Nat. Hazards Earth Syst. Sci., 24, 3387–3400, https://doi.org/10.5194/nhess-24-3387-2024, 2024b. a, b
Fees, A., van Herwijnen, A., Altenbach, M., Lombardo, M., and Schweizer, J.: Glide-snow avalanche characteristics at different timescales extracted from time-lapse photography, Ann. Glaciol., 95, e3, https://doi.org/10.1017/aog.2023.37, 2025. a, b, c, d, e, f, g, h, i, j, k, l
Feistl, T., Bebi, P., Dreier, L., Hanewinkel, M., and Bartelt, P.: Quantification of basal friction for technical and silvicultural glide-snow avalanche mitigation measures, Nat. Hazards Earth Syst. Sci., 14, 2921–2931, https://doi.org/10.5194/nhess-14-2921-2014, 2014. a
Fierz, C., Armstrong, R., Durand, Y., Etchevers, P., Greene, E., McClung, D., Nishimura, K., Satyawali, P., and Sokratov, S.: The international classification for seasonal snow on the ground, UNESCO, IHP–VII, Technical Documents in Hydrology, no. 83; IACS contribution no. 1, 80, 2009. a
Fromm, R., Baumgärtner, S., Leitinger, G., Tasser, E., and Höller, P.: Determining the drivers for snow gliding, Nat. Hazards Earth Syst. Sci., 18, 1891–1903, https://doi.org/10.5194/nhess-18-1891-2018, 2018. a, b, c, d, e
Haefeli, R.: Schneemechanik mit Hinweisen auf die Erdbaumechanik, PhD thesis, ETH Zürich, https://doi.org/10.3929/ethz-a-000096665, 1939. a
Höller, P.: Snow gliding and avalanches in a south-facing larch stand, Proceedings of the Symposium, 18–27 July 2001, Maastricht, International Association of Hydrological Sciences Publication, 270, 355–358, ISBN 1-901502-61-9, 2001. a, b
Höller, P.: Snow gliding and glide avalanches: a review, Nat. Hazards, 71, 1259–1288, https://doi.org/10.1007/s11069-013-0963-9, 2014. a, b
in der Gand, H. and Zupančič, M.: Snow gliding and avalanches, Proceedings of the Symposium, 5–10 April 1965, Davos, International Association of Hydrological Sciences Publication, 69, 230–242, 1966. a
Jones, A. S. T.: Review of glide processes and glide avalanche release, Avalanche News, 69, 53–60, 2004. a, b, c
Koch, R. A.: Glide-snow avalanches: Experimental investigation of water transport across the ground-snow interface, M.Sc. Thesis, Department of Civil, Environmental and Geomatic Engineering, ETH Zürich, Zürich, Switzerland, 1–50, 2023. a
Lackinger, B.: Stability and fracture of the snow pack for glide avalanches, Proceedings of the Symposium, 14–19 September 1986, Davos, International Association of Hydrological Sciences Publication, 162, 229–241, 1987. a
Lombardo, M., Fees, A., Udke, A., Meusburger, K., van Herwijnen, A., Schweizer, J., and Lehmann, P.: Capillary suction across the soil-snow interface as a mechanism for the formation of wet basal layers under gliding snowpacks, J. Glaciol., accepted, 1–46, https://doi.org/10.1017/jog.2025.2, 2025. a, b, c, d, e
Maggioni, M., Godone, D., Frigo, B., and Freppaz, M.: Snow gliding and glide-snow avalanches: recent outcomes from two experimental test sites in Aosta Valley (northwestern Italian Alps), Nat. Hazards Earth Syst. Sci., 19, 2667–2676, https://doi.org/10.5194/nhess-19-2667-2019, 2019. a, b, c
McClung, D.: Mechanics of snow slab failure from a geotechnical perspective, Proceedings of the Symposium, 14–19 September 1986, Davos, International Association of Hydrological Sciences Publication, 162, 475–508, 1987. a
McClung, D., Walker, S., and Golley, W.: Characteristics of snow gliding on rock, Ann. Glaciol., 19, 97–103, https://doi.org/10.1017/s0260305500011046, 1994. a
Meter Group: Instruction manual: Ec5, Meter Group, https://publications.metergroup.com/Manuals/20431_EC-5_Manual_Web.pdf (last access: 5 August 2024), 2023. a
Meter Group: Instruction manual: TEROS11/12, Meter Group, https://publications.metergroup.com/Manuals/20587_TEROS11-12_Manual_Web.pdf (last access: 5 August 2024), 2024. a, b
Mitterer, C. and Schweizer, J.: Glide snow avalanches revisited, The Avalanche Journal, 102, 68–71, 2012a. a, b, c
Mitterer, C. and Schweizer, J.: Towards a better understanding of glide-snow avalanche formation, Proceedings of the International Snow Science Workshop, 16–21 September 2012, Anchorage, Alaska, 610–616, 2012b. a, b
Newesely, C., Tasser, E., Spadinger, P., and Cernusca, A.: Effects of land-use changes on snow gliding processes in alpine ecosystems, Basic Appl. Ecol., 1, 61–67, https://doi.org/10.1078/1439-1791-00009, 2000. a
Oliver, A. M. and Webster, R.: Basic Steps in Geostatistics: The Variogram and Kriging, Springer Cham, https://doi.org/10.1007/978-3-319-15865-5, 2015. a, b, c, d
Reardon, B. A., Fagre, D. B., Dundas, M., and Lundy, C.: Natural glide slab avalanches, Glacier National Park, USA: a unique hazard and forecasting challenge, Proceedings of the International Snow Science Workshop, 1–6 October 2006, Telluride, CO, USA, 778–785, 2006. a
Sharaf, D., Glude, B., and Janes, M.: Snettisham powerline avalanche – Juneau, Alaska, The Avalanche Review, 27, 1 and 20, 2008. a
Simenhois, R. and Birkeland, K.: Meteorological and environmental observations from three glide avalanche cycles and the resulting hazard management technique, Proceedings of the International Snow Science Workshop, 17–22 October 2010, Lake Tahoe, CA, USA, 846–853, 2010. a
Soil Survey Staff: Soil Taxonomy: A Basic System of Soil Classification for Making and Interpreting Soil Surveys, Agriculture handbook, US Department of Agriculture, Natural Resources Conservation Service, ISBN 0160608295, 1999. a
- Abstract
- Introduction
- Field site
- Spatio-temporal monitoring setup
- Data processing
- Results
- Discussion
- Conclusions and outlook
- Appendix A: Variogram
- Appendix B: Sensor specifications
- Appendix C: Source of water in avalanches after first snowfall
- Data availability
- Author contributions
- Competing interests
- Disclaimer
- Acknowledgements
- Financial support
- Review statement
- References


