the Creative Commons Attribution 4.0 License.
the Creative Commons Attribution 4.0 License.
 | 24 Mar 2025
The glaciers of the Dolomites: the last 40 years of melting
Costanza Del Gobbo
Giovanni Baccolo
Carlo Barbante
Michele Citterio
Fabrizio De Blasi
Marco Marcer
Mauro Valt
Renato R. Colucci
Small Alpine glaciers located below the regional equilibrium line altitude are experiencing considerable ice loss and are expected to fragment into smaller glacial bodies and eventually disappear. Monitoring such glaciers by satellite remote sensing is often challenging because their size and surrounding topography are incompatible with the current spatial resolution of non-commercial satellites. The Italian Dolomites (southeastern Alps) are a region clearly illustrating such challenges and where no long-term glacier mass balance data are available. This renowned Alpine sector hosted tens of glaciers up until a few decades ago, with now only 12 remaining. This study presents a multi-decadal (1980s–2023) estimation of surface elevation change and geodetic mass balance of the current mountain glaciers present in the area. Calculations are based on geodetic data: high resolution and accuracy are obtained with uncrewed aerial vehicle (UAV), structure from motion (SfM), and airborne light detection and ranging (lidar) methods, from 2010 to 2023. SfM on historical aerial imagery is used for previous decades. We found an average cumulative surface elevation change of m from 1980s to 2023, 33 % of which occurred between 2010–2023. The average geodetic mass balance rate for the whole period is (water equivalent), varies widely among sites, and is less negative than the Alpine reference glaciers' mass balance. Regionally, 66 % of the volume loss is related to the Marmolada glacier alone. Losses of ice mass and area show that the Dolomites are rapidly losing their glaciers.
- Article
(14856 KB) - Full-text XML
-
Supplement
(1353 KB) - BibTeX
- EndNote


Glaciers worldwide have been losing mass at alarming rates over the past decades (Zemp et al., 2019; Hugonnet et al., 2021). This is particularly evident in regions where warming is occurring at a faster rate than the global average (Rantanen et al., 2022; ICCI, 2022). Among these regions are the European Alps (Hock et al., 2019), where severe impacts on the cryosphere have been observed because of rising temperature (Auer et al., 2007), changes in seasonal precipitation patterns, total radiation, humidity, and snow accumulation (Gobiet et al., 2014; Rumpf et al., 2022).
The European Alps can effectively be considered the birthplace of modern glaciology (Clarke, 1987). Despite the progressive improvement of in situ (Huss et al., 2015; WGMS, 2021) and remotely sensed cryosphere monitoring efforts for the European Alps (Davaze et al., 2020; Paul et al., 2020; Sommer et al., 2020), areas remain where only scattered data and observations are available. One of those regions is the Italian Dolomites (southeastern Alps).
The Dolomites are mostly known for their landscapes, resulting from an extremely rich geological diversity (Panizza, 2009). They represent a complex area from a socio-economic, geographical, and cultural point of view, and for this reason they have been studied intensively in terms of geology, geomorphology, and biodiversity (Bosellini et al., 2003; Panizza, 2009; Pignatti and Pignatti, 2014). However, glaciers of this region have always remained on the margins of scientific exploration.
Glaciers in the Dolomite region were numerous until a few decades ago (CGI-CNR, 1962). The complex topography of the area ensures that many sites are orographically protected from direct sunlight and favour the accumulation of snow through avalanches. Until recently, such a context allowed for the existence of glaciers well below the environmental equilibrium line altitude (envELA) (Castiglioni, 1925; Žebre et al., 2021), which in the Eastern Alps during the 20th century ranged from 2700 to 3100 (above sea level) (Žebre et al., 2021). Only a few massifs had an accumulation basin located above the envELA, allowing for larger ice bodies to develop, such as the Marmolada and Fradusta glaciers.
Assessing the state of glaciers through their mass balance is considered an essential component in the global-climate-related set of observations (Zemp et al., 2009). At the regional scale, this involves generating large composite datasets through in situ measurements and remote sensing campaigns. Various techniques have been developed over the last few decades to improve remote measurements of glacier mass change (Berthier et al., 2023). Workflows involving sensors mounted on uncrewed aerial vehicles (UAVs) or helicopters are particularly effective for monitoring smaller topography-bounded glaciers. Among such settings, one technique that has been successfully used is structure from motion (SfM) (Carrivick et al., 2016). SfM allows for both terrestrial (e.g. Piermattei et al., 2015; Marcer et al., 2017) and aerial (e.g. Smith et al., 2016) high-resolution surveys relying on photos taken from different positions. The same workflow can be applied to historical imagery initially acquired for mapping purposes, allowing for the retrieval of past glacier change (Mertes et al., 2017; Knuth et al., 2023). Despite the large improvements in the applications of SfM, the state of the art for high-resolution topographic surveys remains light detection and ranging (lidar) (Bhardwaj et al., 2016). Lidar is an active remote sensing technique that uses a laser pulse and its two-way travel time to reconstruct the surrounding scene. It can be used to monitor surface elevation changes at different scales, depending on the sensor and platform used (e.g. Knoll and Kerschner, 2009; Fischer et al., 2016; Okyay et al., 2019; Securo et al., 2022).
To the best of our knowledge, no specific studies have been conducted regarding the current status of Dolomite glaciers or their decadal change. The aim of our work is to fill this gap, providing a description of the mountain glaciers in the region and quantifying their evolution during the last 40 years. To achieve these objectives, surface elevation changes and the geodetic mass balance of the 12 current Dolomite mountain glaciers were calculated from the 1980s to 2023, with almost one measurement per decade. Available temperature, precipitation, and snow accumulation data from the regional network of weather stations are used to contextualise the results.
The first study to mention the Dolomite glaciers dates to 1888 (Richter, 1888). In his volume, the Austrian glaciologist described the then-known glaciers in the eastern Alpine region, including two of the largest ice bodies of the Dolomites: the Marmolada and Travignolo glaciers. However, the first work introducing topographical maps and quantitative information was compiled by Olinto Marinelli (Marinelli, 1910). Thereafter, the available information about the glaciers of the Dolomites mostly comes from works that have dealt generally with glaciers in the Italian Alps (e.g. Porro, 1925; CGI-CNR, 1962; Smiraglia et al., 2015).
Data presented for the wider Italian Alps or pan-Alpine products are not always accurate for the Dolomites. In the past, only sporadic attention, from a glaciologic point of view, has been paid to specific massifs (Castiglioni, 1925, 1930; Nangeroni, 1938; Del Longo et al., 2001; Cibien et al., 2007). Some more information is available from institutional reports edited for administrative regions, but considering the incompleteness of these dispatches, they are not discussed here. According to the Italian Glacier Inventory (CGI-CNR, 1962), in the late 1950s, the Dolomites hosted 33 glaciers, with a total surface of 8.19 km2.
The last partial survey of the Dolomite glacier area was carried out by the Agency for Environmental Prevention and Protection of Veneto (ARPAV), which analysed the surface variations for the 27 main glacial bodies of the Dolomites (Crepaz et al., 2013), representing the 72 % of the total glacierised area in the region. Results show an area loss of approximately 50 % from 1910 to 2009. The most recent inventory available for Italian glaciers (Smiraglia et al., 2015) reports that 51 glacial bodies were present in the Dolomites in 2009, spanning a total area of 5.04 km2 and making up 1.4 % of the total Italian glacierised area. Among the 51 glacial bodies, 13 are classified as mountain glaciers, while 38 are considered snow or ice patches. When we use the term ice patch, we refer to the description of ice patch of glacial origin proposed in Serrano et al. (2011).
The only glacier of the Dolomites that has been extensively studied in the past years is the largest in the area, the Marmolada Principale glacier. It was surveyed with ground-penetrating radar in 2004 and 2014, revealing a 30 % reduction in thickness, hinting at an imminent fragmentation and a likely complete disappearance before 2050 (Santin et al., 2019). The transition between glacial and periglacial landforms in the area is discussed in Seppi et al. (2014), while studies focused on rock glaciers (Krainer et al., 2010, 2012) and debris-covered glaciers (Securo et al., 2024a) have also been done recently. Despite their limited size, the glaciers and glacial bodies in the Dolomites are also investigated in relation to geohazards. This is firstly confirmed by the deadly Marmolada ice and rock avalanche that occurred on 3 July 2022 (Olivieri and Bettanini, 2023; Bondesan and Francese, 2023) but also by debris flow events on Monte Pelmo, closely related to the Val d'Arcia glacial body (Del Longo et al., 2001; Chiarle et al., 2007), and by the instability of moraines from the Little Ice Age (Zanoner et al., 2017).
As this work specifically focuses on the remaining mountain glaciers of the Dolomite area, attention is given to the following ranges (Fig. 1): Popera, Cristallo, Sorapiss, Antelao, Marmolada, and Pale di San Martino. Other Dolomite massifs still host minor ice deposits, but now being devoid of any dynamics (Smiraglia et al., 2015), they are not considered in this work. The Fradusta and Marmolada glaciers, which recently experienced fragmentation, will still be treated as single glaciers (Table S1 in the Supplement).
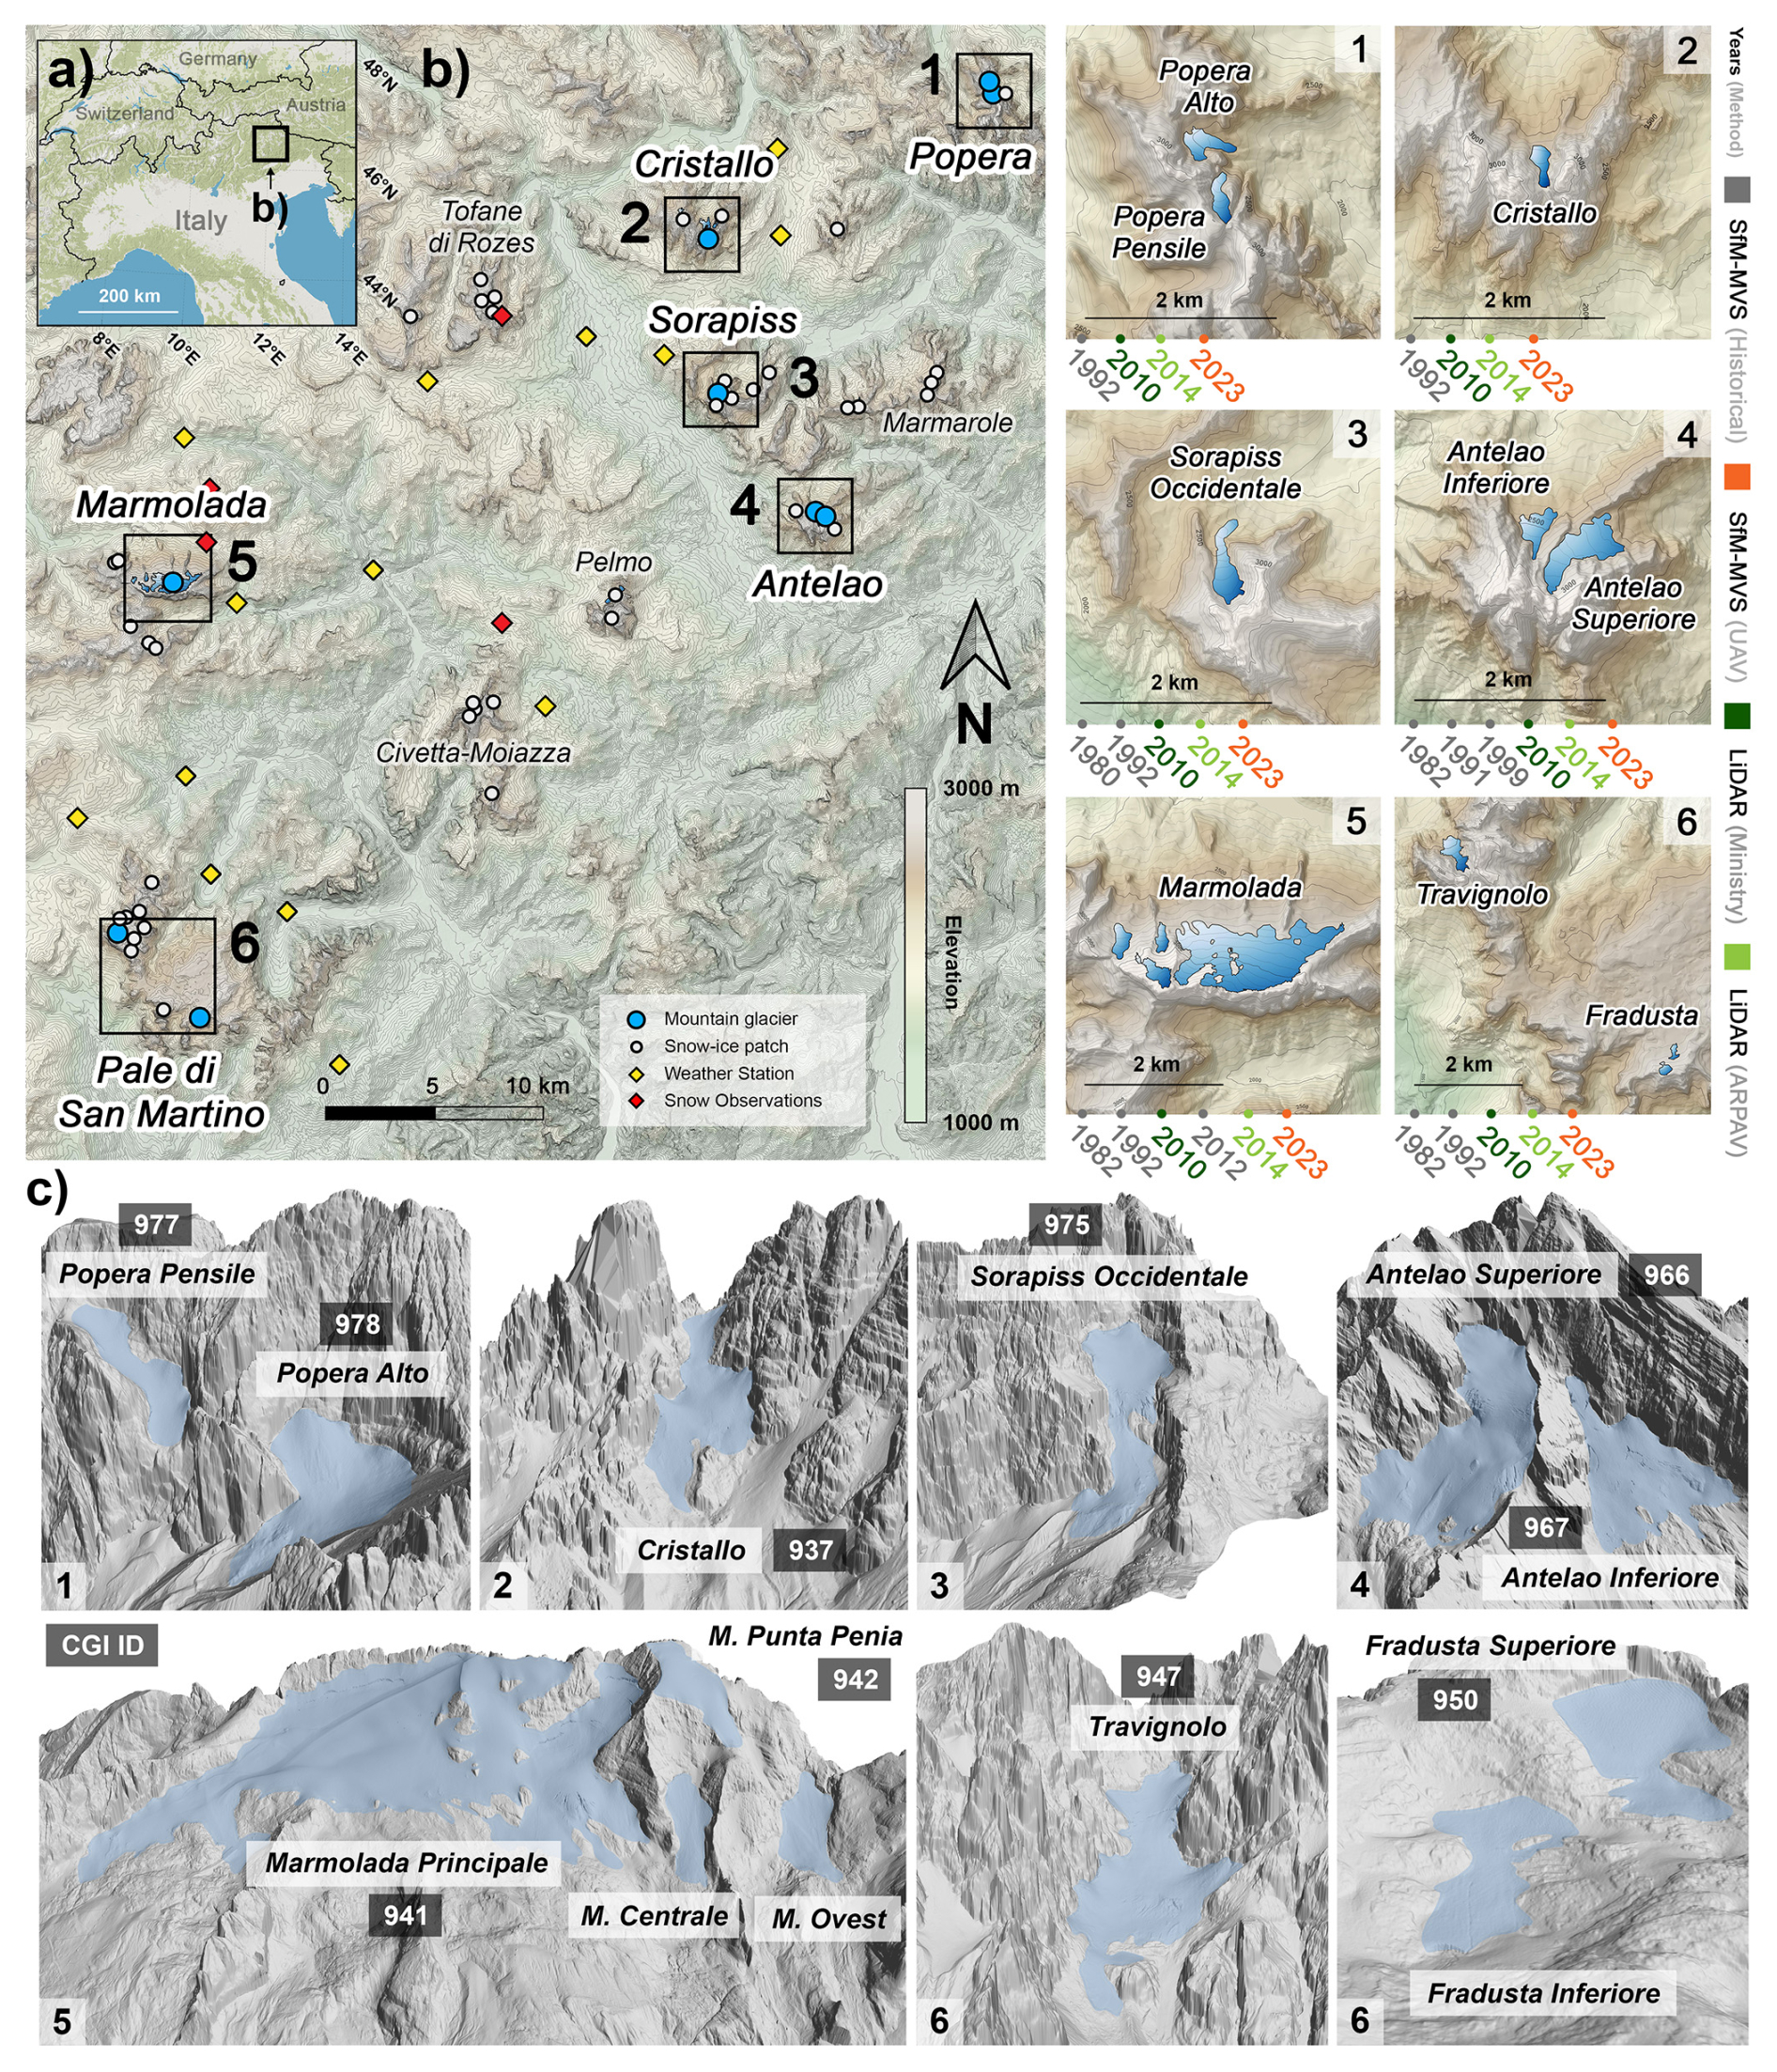
Figure 1(a) The Dolomites in the European Alps (© Map Tiler; © OpenStreetMap contributors 2023, distributed under the Open Data Commons Open Database License (ODbL) v1.0). (b) Location of the six mountain areas hosting active glaciers in the region; location of snow ice patches (white dots), mountain glaciers (light-blue dots) (Smiraglia et al., 2015), automatic weather stations (AWSs) (yellow), and snow depth observations stations (red). (c) 3D views of the Dolomite glaciers derived from 2014 lidar data and IDs of the glaciers from the Italian Glacier Inventory (CGI) (Smiraglia et al., 2015). A few AWSs used in this study are located outside of the map in (b).
In this study aerial photographs spanning 3 decades (1980–2012), airborne lidar (2010–2014), and UAV and aerial surveys (2023) were used to produce dense point clouds of the Dolomite glaciers and assess their change through time. Data acquisition and pre-processing, point cloud generation, point cloud alignment and error assessment, and weather station data processing are described in four separate sections (Fig. S1 in the Supplement). When decades such as the 1980s, 1990s, and 2000s are mentioned in the text, we are always referring to multiple years of available data (Fig. 1).
3.1 Acquisition and pre-processing
All imagery used was pre-processed using Adobe Photoshop (v2023) to improve the exposure of heavily shadowed areas. The archive photos span from the 1980s to 2012 (Table S2 and Fig. S2). Digital photos from 2010 and 2012 have an optimal quality for SfM processing but lack metadata. Older analogue aerial imagery was scanned with a non-photogrammetric scanner and therefore lacks distortion and internal orientation information that should be used for camera calibration.
Airborne lidar surveys were performed in 2010 and 2014 using an Optech ALTM 3100 instrument mounted on a helicopter. The produced dense point clouds included areas outside of the glaciers. The ground control points (GCPs) used during georeferencing of all aerial photos were retrieved manually from 2010 lidar point clouds using the tool for point list picking in the open-source software CloudCompare (v2.12). Prior to GCP retrieval, the PCV (portion de ciel visible) plug-in, a generalisation of Tarini et al. (2003) algorithms, was used to improve 3D visualisation. Preference was given in picking points that were steady and well recognisable over time also in older photos, such as big boulders and bedrock features. The number of GCPs per area varied between 6 and 30 depending on glacier size and image quality. The 2023 UAV and aerial surveys lacked GCPs collected on site and therefore needed the same use of lidar-derived points to improve accuracy and precision.
3.2 Structure from motion (SfM) workflow and area mapping
This work used structure from motion (SfM) to retrieve the former glacier surface as dense point clouds, which were later compared with 2010 lidar data, taken as the most reliable reference. The SfM workflow was entirely performed using the software Agisoft Metashape (v2.0.4) and is similar to part of the processing of photos by Knuth et al. (2023) that have no camera calibration information or fiducial marks available. The archive images were adjusted and standardised by manually picking pseudo-fiducial markers (i.e. a consistent point in the photo frame notches) from each photo frame and performing the calibration in Agisoft Metashape. The subsequent photo alignment was done using 200 000 tie points and 20 000 key points with the maximum quality, generating for each scene a sparse point cloud. GCPs were manually placed and adjusted in all the photos.
GCP known-coordinate input allowed for the adjustment of the sparse-point-cloud position, scale, camera positions, and subsequent dense-point-cloud generation. A few scenes also required the computation of a triangular mesh generated by linear interpolation of points to close data voids in the dense point clouds. The same mesh with additional texture can be used for visual interpretation of results (Fig. 2). Digital elevation models (DEMs) and orthophotos were also generated for each survey to enable the manual mapping of glacier areas during all reconstructed time steps, done in QGIS (v3.28). We used the surface lowering observed during the multi-temporal comparisons combined with direct observations on site to assess the glaciers' end when the presence of debris cover prevented the delineation of the glaciers' perimeter using mapping alone. The report of SfM output is available in Table S3.
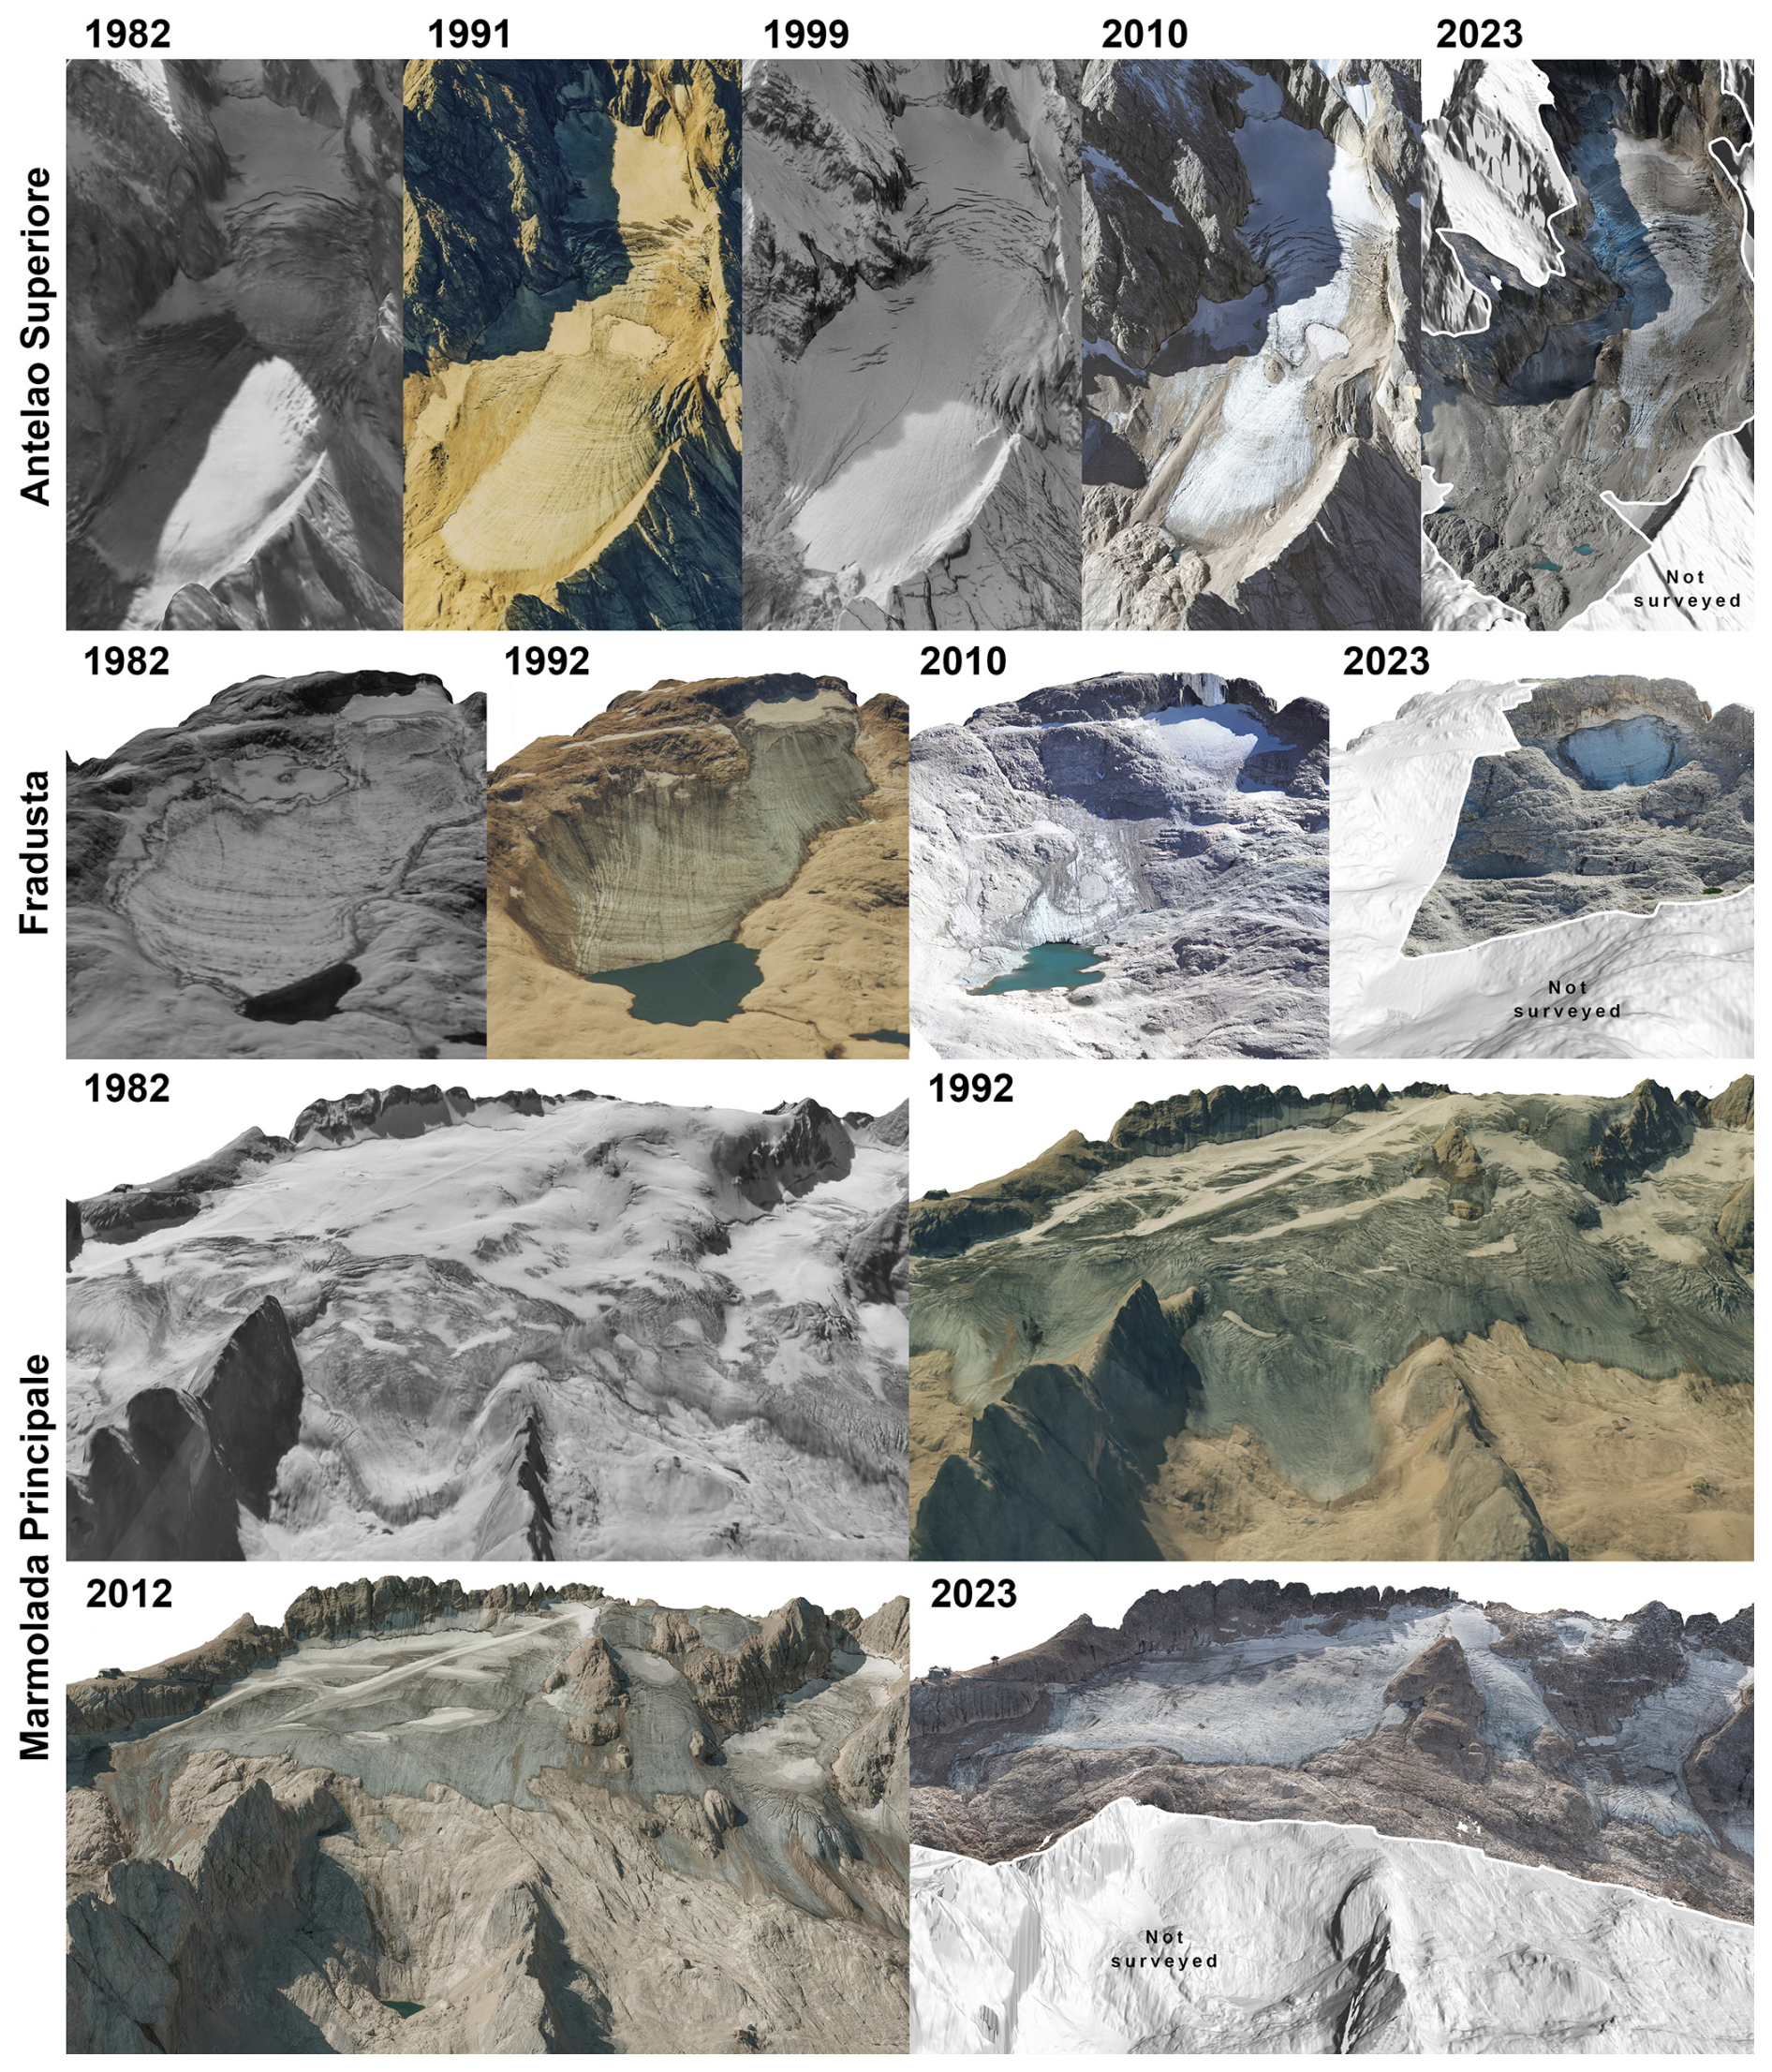
Figure 2Examples of the reconstructed 3D textured meshes of the Antelao Superiore, Fradusta, and Marmolada Principale glaciers during different decades. Reconstructions of the Popera, Sorapiss Occidentale, Cristallo, Antelao Inferiore, and Travignolo glaciers are shown in Fig. S3.
3.3 Point cloud comparison and error assessment
SfM and lidar dense point clouds were used to detect and quantify surface elevation change. All of the processing was conducted in CloudCompare (v2.12). The 2010 lidar point clouds are the most reliable product available in this study and were used to refine alignment through manual point picking, adjusting the misaligned 1980s, 1990s, and 2000s point clouds. Once aligned, point clouds from different years were compared to 2010 lidar using the Multiscale Model to Model Cloud Comparison (M3C2; Lague et al., 2013) algorithm. M3C2 is a robust solution to assess the differences between point clouds without the need for surface meshing or DEM generation. The M3C2 workflow efficiently manages complex terrain features like flat and vertical surfaces within a single scene and was already used in similar applications (e.g. Midgley and Tonkin, 2017; Mishra et al., 2022). In certain reconstructions of the older scenes (1980s), the point cloud output of solely SfM contained small void areas in correspondence with the underexposed sectors or because of snow. In those cases we used the Metashape-produced 3D triangular meshes that were sampled and processed in CloudCompare as the other point clouds thereafter.
The M3C2 output that holds the computed differences was rasterised and imported in QGIS (v3.28). Here, we used the mapped polygons of the glaciers during all available time steps to compute zonal statistics. The statistics were computed on two different polygons for each site: common area (i.e. the smaller and more recent outline of the glacier, in times of glacier retreat) and total area (i.e. largest glacier area between the two time steps of each comparison). A density conversion factor of 850 kg m−3 (Huss, 2013) was used to convert surface elevation change values of the common area to geodetic mass balance. Each comparison included 2010 lidar data as a reference, and the comparisons were never done using two historical SfM point clouds at a time to reduce sources of uncertainties.
The error in surface elevation change varies for each comparison and comes from different sources: (i) lidar vertical accuracy (δL), (ii) alignment error between the point clouds on stable terrain (δAL), and (iii) measurement error (i.e. distance uncertainty, δM3C2). δL was quantified by the lidar surveyors that compared the dataset's vertical accuracy with known points measured with differential GPS and was ±0.12 m. δAL was measured for each individual comparison using M3C2 in the frontal and lateral areas outside of the glaciers that share an average slope value to the latter. Slope similarity between glaciers and the stable terrain was calculated in CloudCompare using the geometric feature verticality (Harshit et al., 2022), computed on a cylinder with a search radius of 5 m for all point clouds. Areas of the point clouds above and below the mean glacier verticality ±2σ (95 % confidence interval) and inside the glaciers area were filtered out before using M3C2 again, this time for δAL calculation. δM3C2 was available as a direct output of the previous processing (i.e. distance uncertainty), and its mean value per glacier was retrieved using zonal statistics. δL, δAL, and δM3C2 were summed in quadrature to estimate the overall uncertainty in surface elevation change (δS). The contribution of uncertainties in the area was not considered during this phase.
The error in geodetic mass balance (δMB) estimations included an additional uncertainty interval in density conversion (δρ) of (Huss, 2013). This was added to the δS using the product error propagation formula of Eq. (1) (Taylor, 1997):
Considering our dataset, the reconstruction of older glaciers' surface using scanned imagery was limited in accuracy because of (i) a lack of photogrammetric quality scans of the negatives, (ii) the presence of heavily shaded zones or clean snow, and (iii) the reduced availability of suitable spots for GCP picking in some scenes. These sources of errors are harder to quantify and reduced the number of historical photos suitable for such an application. Further sources of uncertainty may be related to the temporal coverage of aerial photography that was not uniform over all glacial bodies and years (Table S2).
3.4 Weather station network
Precipitation and temperature time series from 20 automatic weather stations (AWSs) of the ARPAV network were integrated with the datasets from two AWSs managed by the autonomous province of Bolzano, which altogether guarantee an adequate spatial coverage of the study area (Fig. 1). The selection of the AWSs was based both on their spatial distribution and proximity to the six mountain areas hosting Dolomite glaciers, as well as on the availability of continuous time series of temperature and precipitation starting at least 20 years before 2022. A linear interpolation was employed to fill temperature gaps of 3 d or fewer, while no reconstruction was performed on precipitation data. Additionally, years with missing data exceeding 5 % of the accumulation (November to April) or ablation (June to August) season were excluded from the analysis. This was implemented at the level of individual AWSs, ensuring the availability of data for each year after averaging across all stations. All the time series begin between 1985 and 2001 and end between 2020 and 2022, with 77 % of them spanning over more than 30 years and 9 % spanning less than 26 years. Due to fewer AWSs being deployed in the 1980s and as a consequence of data cleaning, only 36 % to 64 % of the stations present temperature (23 %–64 % for precipitation) data from 1985 to 1991. However, from 1992 onwards, the data coverage increases drastically.
For each station the standardised anomaly index (SAI) (Katz and Glantz, 1986) was calculated, defined in Eq. (2):
where xa is either the total precipitation during the accumulation season (for the precipitation SAI, Pr SAI) or the mean temperature during the ablation season (for the temperature SAI, T SAI). xm and σ are the mean and standard deviation of temperature and precipitation over the reference period 1991–2020. The accumulation and ablation seasons were defined according to the local climatology, taking into account that on average snow cover increases between November and April and decreases from May onward. Finally, SAI values were averaged across all weather stations, resulting in unique Pr and T SAI time series representing the entire region. The pre-processing applied to AWS data may result in an underestimation of total precipitation and therefore of the Pr SAI. Conversely, with regards to temperatures, we expect that the reconstructed data do not significantly alter the mean, as they are prone to distribute randomly both above and below the average.
Daily snow depth measurements from four stations managed by ARPAV provided snowfall information between the 1980s–1990s and 2023, occurring above 1900 (Fig. 1). These measurements were obtained from both automatic and manual snow monitoring stations. The automatic stations deploy an ultrasound sensor and record a value every 30 min, while the manual measurements are taken once per day at 08:00. The Fedaia station has the longest time series, starting in 1980, while Ra Vales, Monti Alti di Ornella, and Col dei Baldi began recording data in 1993, 1986, and 1987, respectively. Using these data, we show the October–June snow depth on the ground for the most relevant years of our study (1982, 1992, 2010, 2014, 2023). Additionally, we calculated the October–June snow depth on the ground averaged over the five reference years for each station, as well as the total annual snow accumulation from the 1980s to 2023.
The dataset used in this study allowed for obtaining the topographic surface and area changes in Dolomite glaciers from the 1980s to 2023, enabling the estimation of their geodetic mass balance. Regarding the nine glaciers analysed, the surface of Sorapiss Occidentale has been reconstructed since 1980; that of Antelao Superiore, Antelao Inferiore, Marmolada, Travignolo, and Fradusta has been reconstructed since 1982; and that of Popera Alto, Popera Pensile, and Cristallo has been reconstructed since 1992 (Figs. 2 and S3).
4.1 Area loss
The manually mapped areas of the Dolomite glaciers (Table S4) showed a retreat from 4.11 to 1.81 km2 between the 1980s and 2023 (−56 %). The loss during the last 13 years (2010–2023) was 0.88 km2 (Fig. 3), corresponding to a relative reduction of 33 %. The area losses presented here only refer to the glaciers selected in this study and as such are an underestimation of the total area loss involving all the ice bodies in the Dolomites. In the 1980s and 1990s the Dolomite glaciers were more numerous, with several of them having completely melted, having turned into permanent ice patches without apparent ice dynamics, or having been buried by debris.
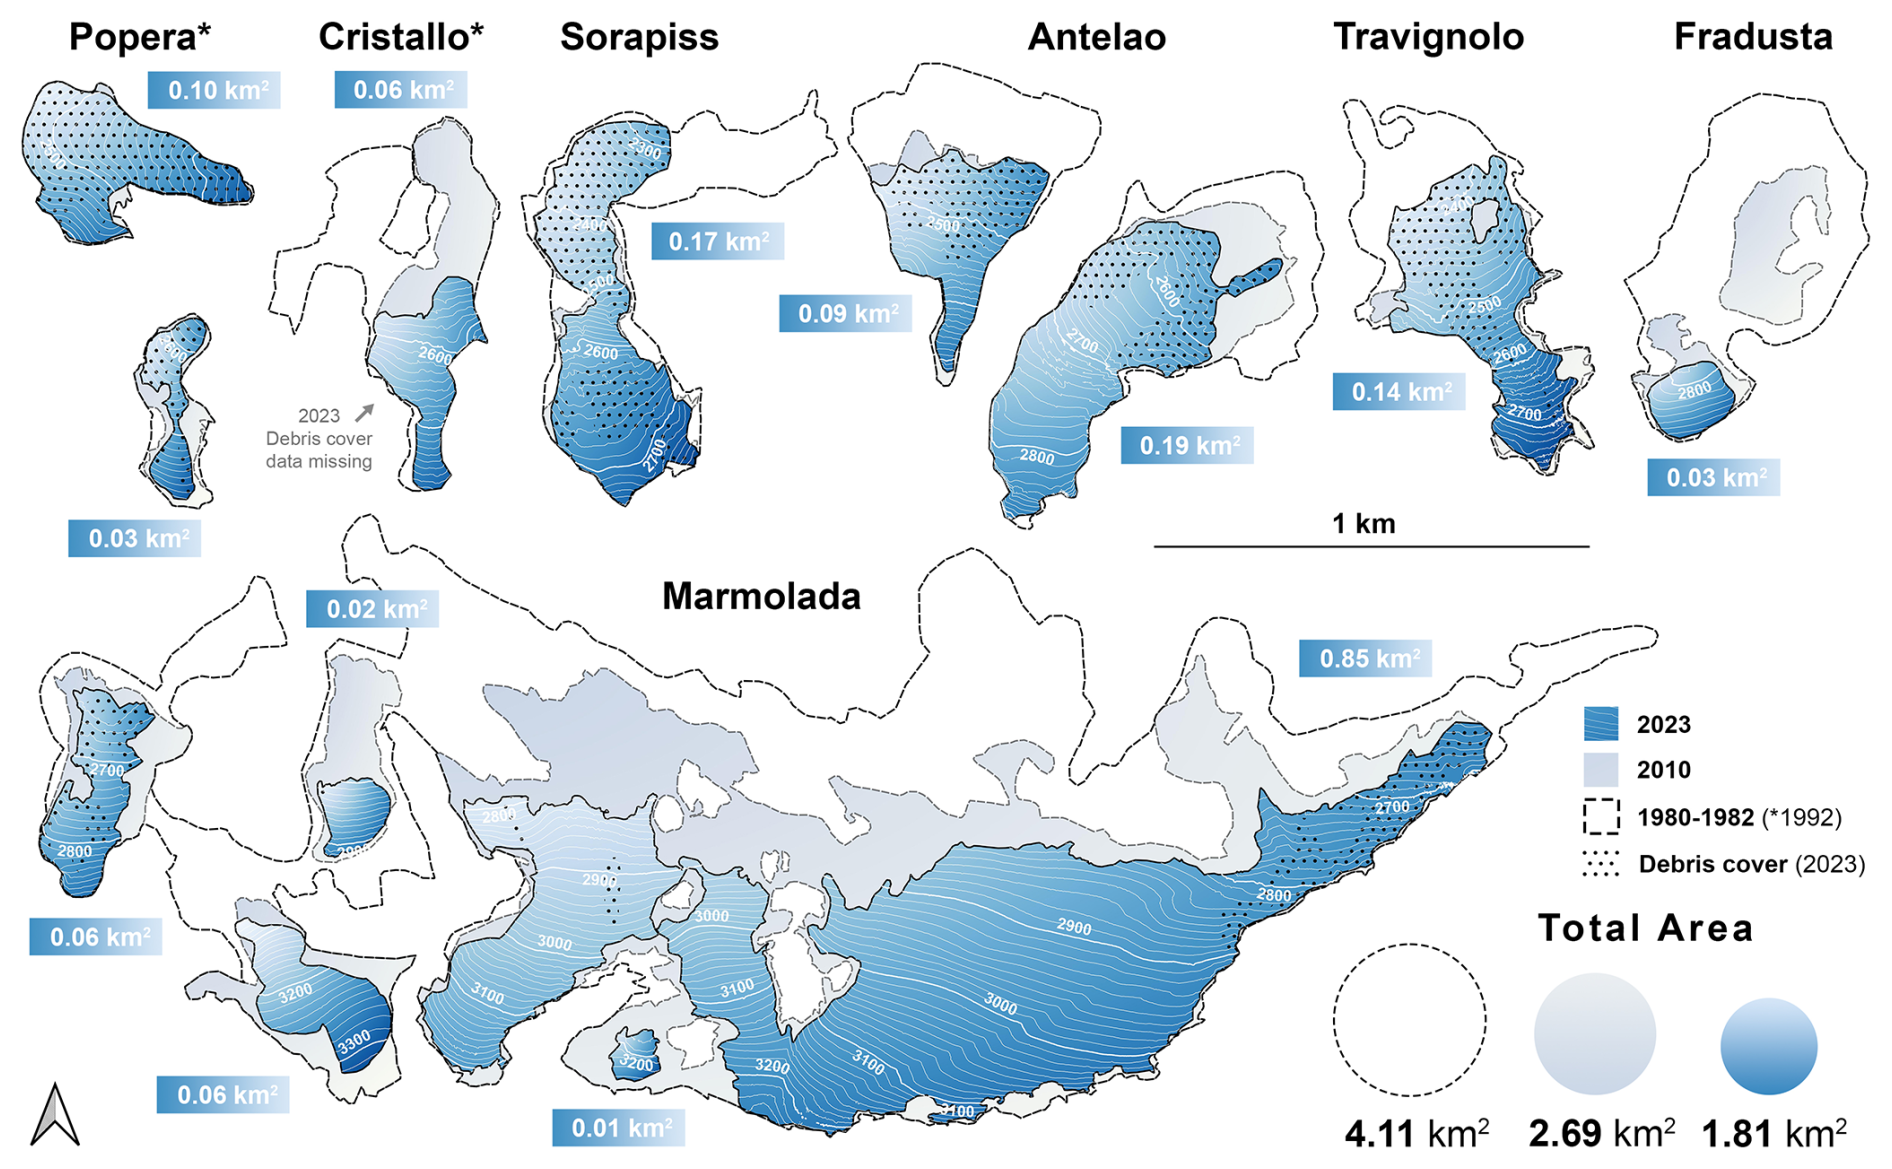
Figure 3Areas of the Dolomite glaciers in 1980–1982 (dashed line), 2010 (grey), and 2023 (blue) and debris cover in 2023 (dots). The oldest year available for Popera and Cristallo is 1992 (*). Cristallo 2023 debris cover data are not available due to the presence of snow of negligible thickness at the time of acquisition.
Relative area loss (1980s–2023) showed a wide range of values, between 9 % and 89 %. Where surface debris cover was abundant like in Popera Alto, Travignolo, and Sorapiss, we observed only minor area losses, especially during the last decade. The glaciers less surrounded by steep topography were the two affected by the largest area change from the 1980s: Fradusta (−89 %) and Marmolada (−60 %). The latter were also the only glaciers that underwent fragmentation, with the lower part of Fradusta (F. Inferiore) being the only ice body completely extinct among our dataset. All area variations were almost completely related to glacier fronts except for Marmolada, where even the upper portions were affected by retreat.
The Marmolada glacier still remains the largest glacier of the Dolomites, contributing to 66 % of total area losses from 1980s and currently representing 55 % of the total glacier area of the Dolomites.
4.2 Surface elevation change and mass balance
The average surface elevation change per site was calculated for three periods: 1980s with −5.2 m, 1990s–2010s with −14.1 m, and 2010s with −9.3 m. Due to the lack of data in 1999 and 2001 it was not possible to resolve the 1990s–2000s period at decadal frequency (Table S5).
Between 1980s and 2010 the Dolomite glaciers experienced the greatest reduction in thickness in their frontal parts, except for Popera Pensile and Sorapiss Occidentale, which instead showed greater losses in their upper portions (Fig. 4). The Marmolada, Fradusta, and Antelao Superiore glaciers showed the highest cumulative thickness losses, exceeding 50 m at their former fronts.
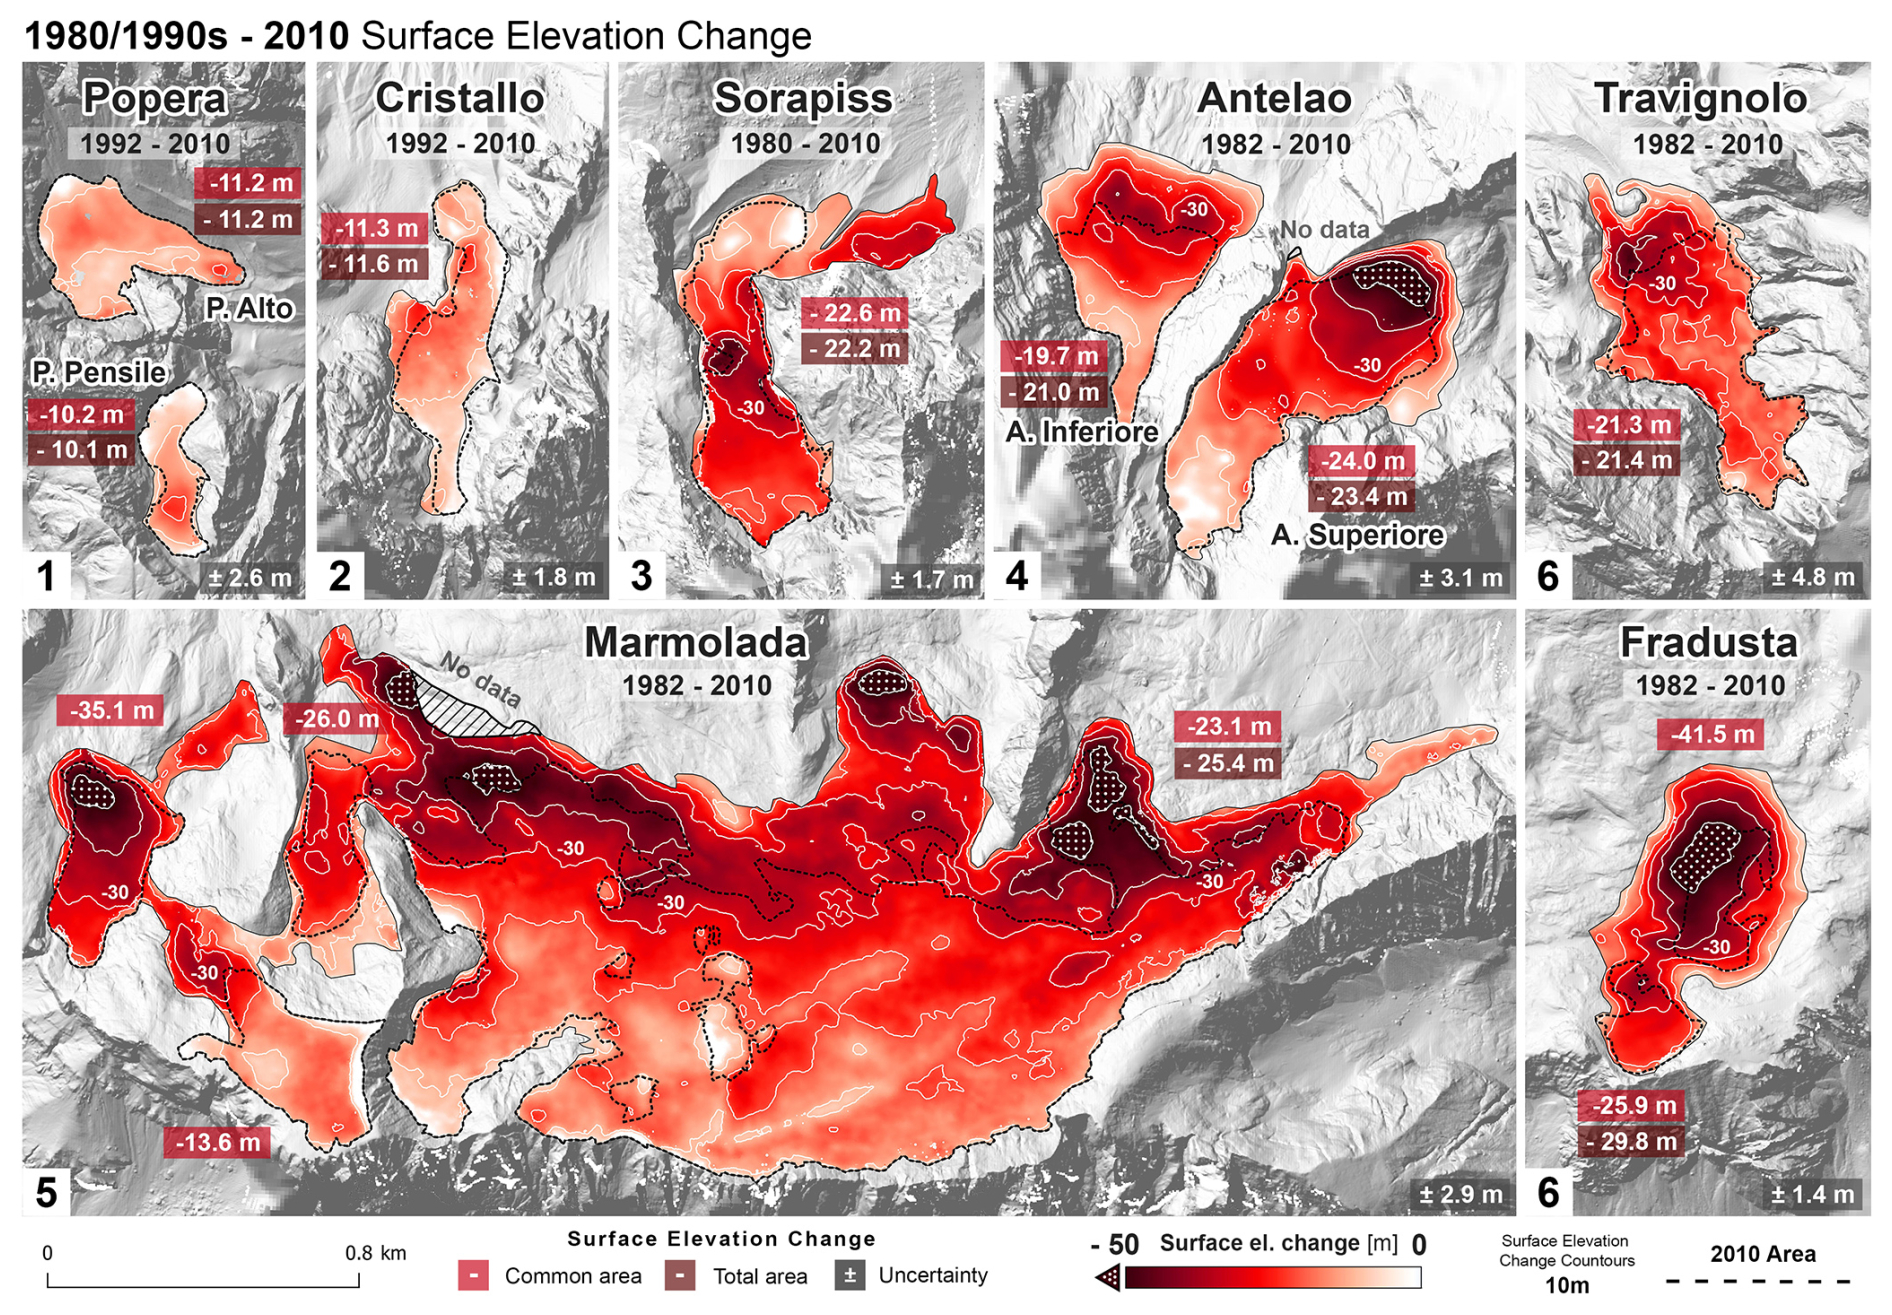
Figure 4Surface elevation change (m) of the Dolomite glaciers from 1982 (1980 for Sorapiss, 1992 for Popera and Cristallo) to 2010. Average surface elevation change is reported for every glacier using the common area (red) and total area (brown). Surface elevation change uncertainty (δS) is reported for each comparison in grey.
The largest values of glacier surface elevation loss between 1980s and 2023 can be observed in the Fradusta glacier, with an average loss of 49.70 m. The smallest changes occurred in the Popera Pensile and Popera Alto glaciers, with −17.0 and −19.9 m, respectively (Table S5).
Surface elevation change calculations during the 2010–2023 interval were more accurate than for the 1980s–2010 period, with an uncertainty δS ranging between 0.3–0.4 m, and allowed for a uniform comparison of the glacier behaviour during the last decade. Overall, δS measurements do not show an evident relationship with slope and have a high variability between sites (Fig. S4), influenced by the uneven distribution of samples across slope bins. During 2010–2023 the acquisition was consistent with dates close to the end of the ablation season, and all glaciers were surveyed (Fig. 5a). The average surface elevation changes between 2010 and 2014 are shown in Fig. S5, with five glaciers (Popera Alto and Pensile, Sorapiss, Antelao Inferiore, and Marmolada) that recorded a surface elevation increase since 2010. During 2010–2023 Marmolada Principale, Marmolada Ovest, and Antelao Superiore experienced greater losses, exceeding 30 m. The highest absolute values, corresponding to almost −35 m, were reached in the area involved in the ice avalanche that happened in a detached part of Marmolada Principale, on 3 July 2022 (Olivieri and Bettanini, 2023; Bondesan and Francese, 2023). These are shown by the kernel density plots of surface elevation loss (Fig. 5b, Marmolada Collapse). The Fradusta Inferiore glacier was not included in the common area measurements as it had already disappeared before 2023 surveys took place.
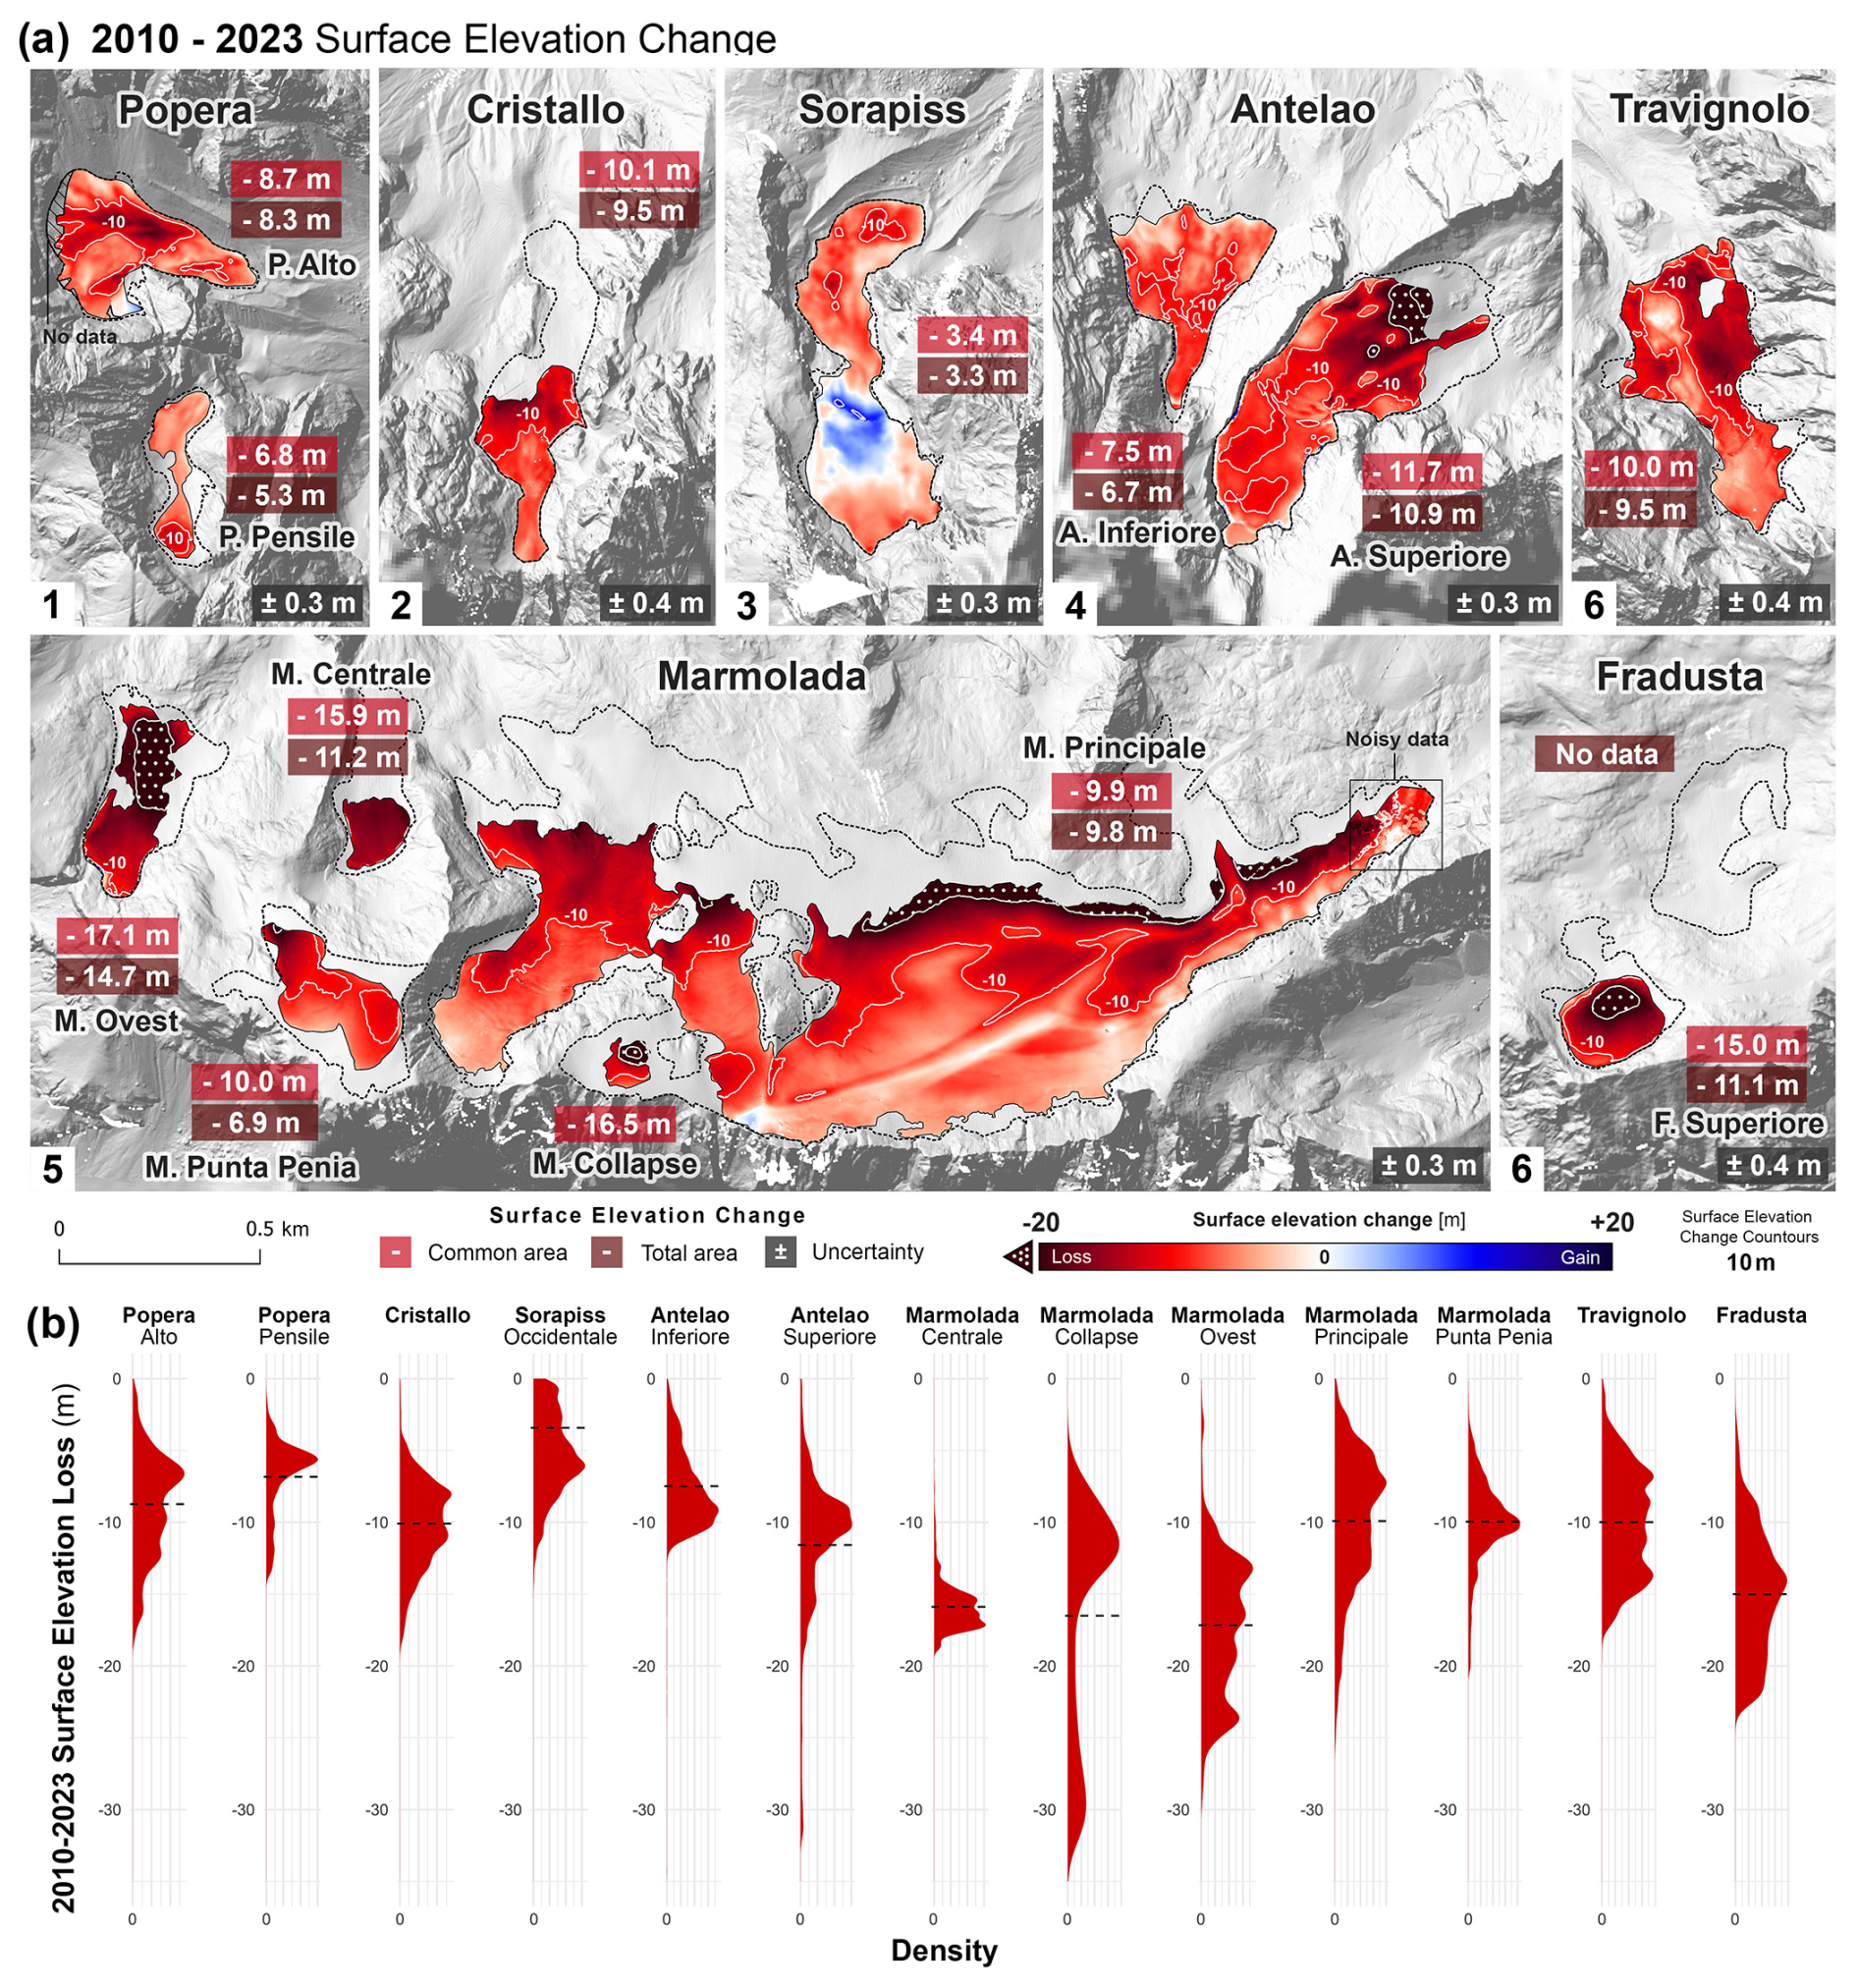
Figure 5Surface elevation change (m) measured across the Dolomite glaciers from 2010 to 2023. (a) Average surface elevation change is reported for every glacier using common area and total area. Surface elevation change uncertainty (δS) is reported for each comparison in grey. (b) Kernel density distribution plot for surface elevation loss with mean loss (dotted black line), with all former Marmolada glacier sections presented as divided plots.
During the last 13 years we observed the only thickness increases in the central part of the Sorapiss Occidentale glacier, which is currently debris covered (Fig. 3). On that glacier a rise of more than 10 m was observed close to a wide serac whose presence is possibly related to a small surge induced by a recent rockfall (Fig. 5a) in the accumulation area as well as by internal glacier dynamics. Rockfall debris and boulders may also have contributed to the increase in surface elevation. A very small area of the Marmolada Principale glacier retained a surface elevation similar to that of 2010. This is visible in Fig. 5a, where it appears as an oblique line crossing the glacier from the southwest to northeast. This feature is not natural, being related to the artificial redistribution of snow to maintain ski routes on the glacier.
The average annual geodetic mass balance rate for the Dolomite glaciers varied from (water equivalent) in the 1980s to between the 1990s and 2010 and in the last 13 years (Fig. 6 and Table S6).
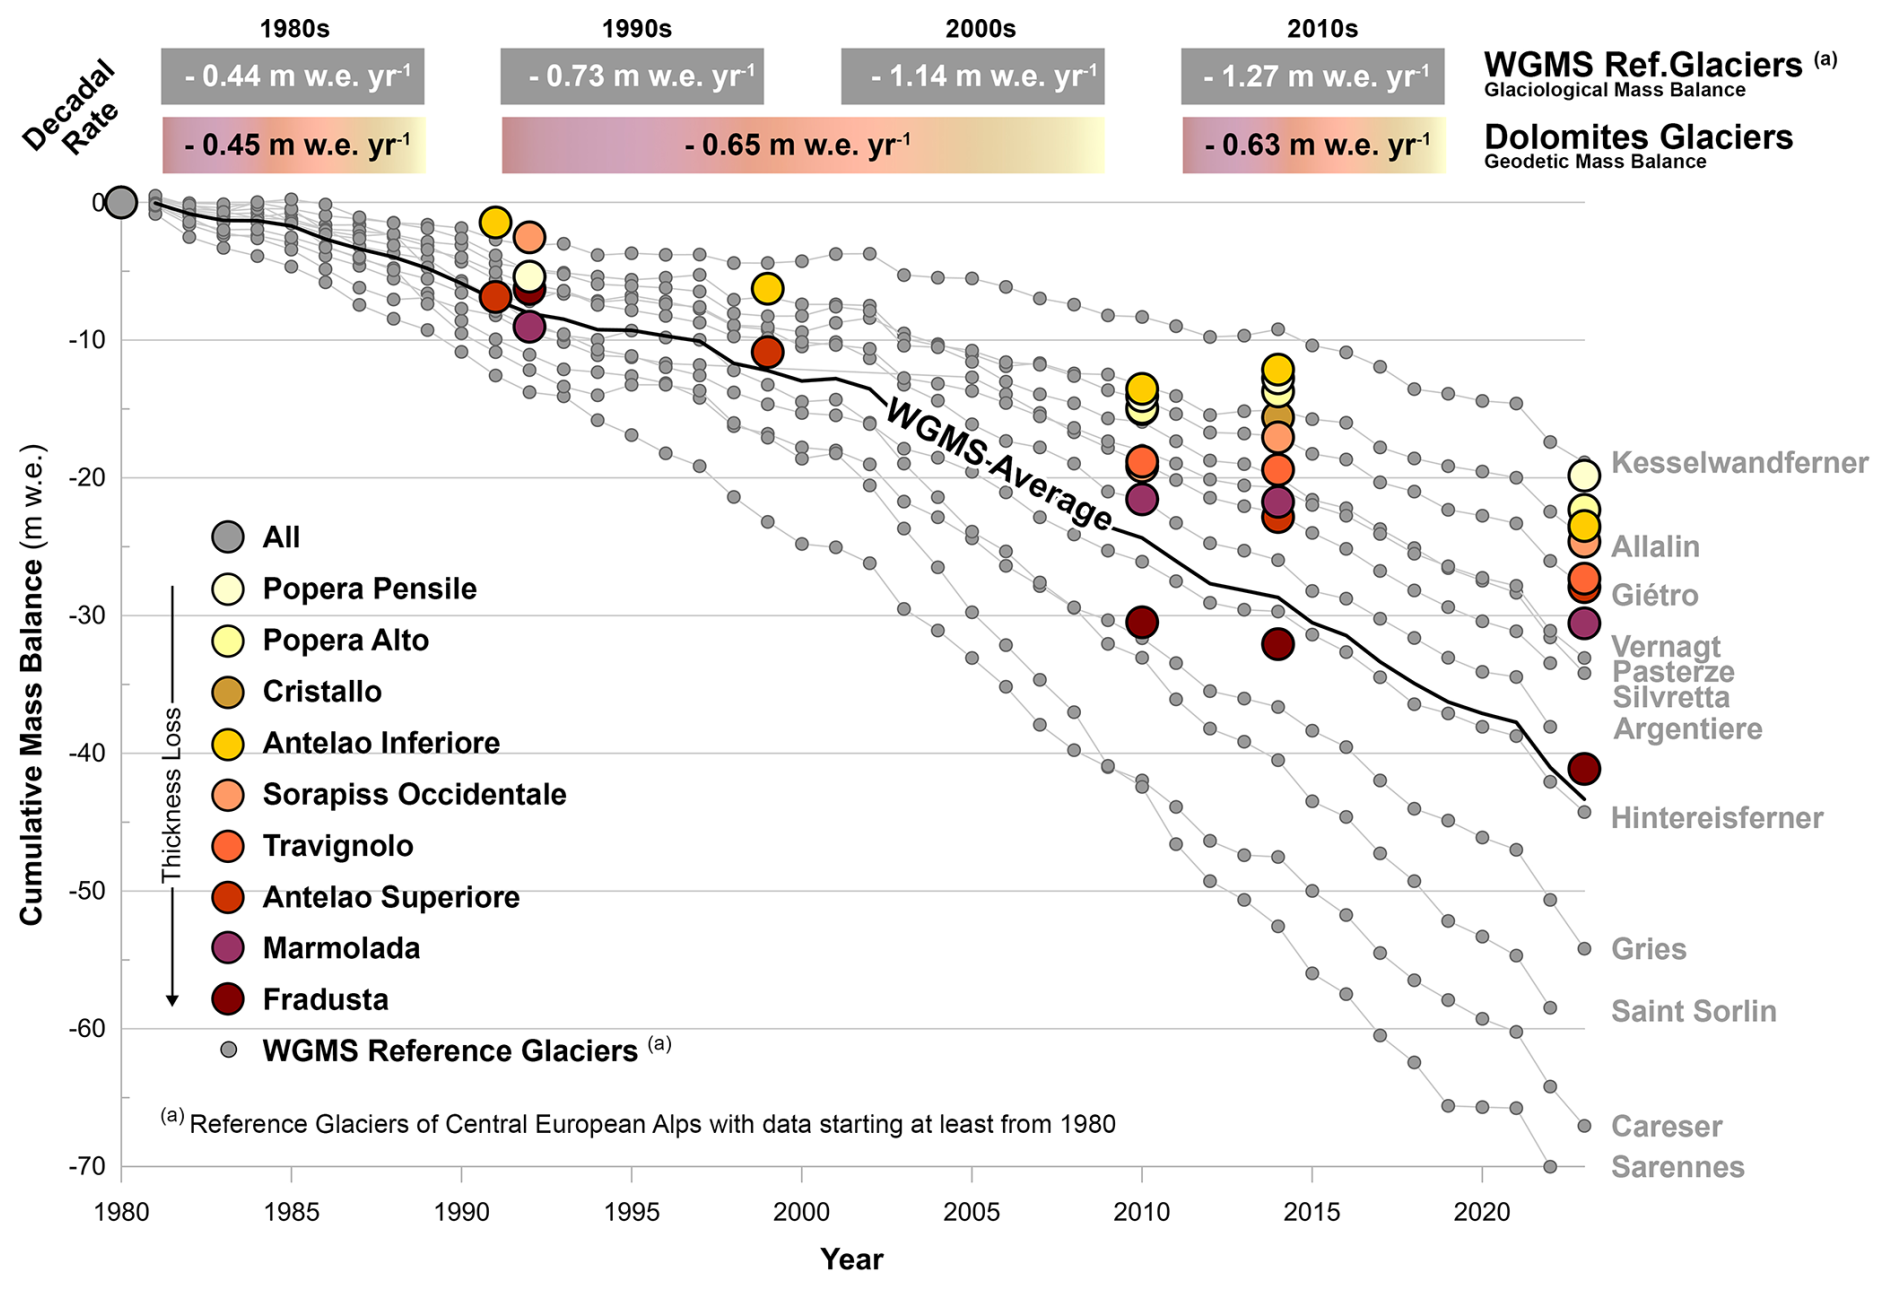
Figure 6Mass balance (MB) rates of World Glacier Monitoring Service (WGMS, 2021) reference glaciers (RGs) with in situ data starting in 1980 and the Dolomite glaciers. For our MB data, measurements starting in 1982 were corrected to 1980 using the average MB loss. Dolomite glacier MB with measurements starting in the 1990s were calculated back to the 1980s using the average MB rate of all Dolomite glaciers during the 1980s (i.e. 0.45 ). Three RGs lack 2023 data (i.e. Argentière, Saint Sorlin, Serennes).
Total volume loss in the entire observation period was approximately 0.105 Gt, with 0.083 Gt lost between the 1980s and 2010 and 0.022 Gt lost during the 2010–2023 interval (Table S7). The Marmolada glacier by itself accounted for 65.7 % of total volume losses. Other major contributors included the Antelao Superiore and Fradusta glaciers with 7.9 % and 7.3 %, respectively.
Our results show that the use of total area among each comparison in the geodetic mass balance leads to an underestimation of the loss () when compared to calculations based on common area. In our case the bias introduced by total area led to an underestimation between 1 % and 31 % of the common area geodetic mass balance, depending on the site and considered time step. There were some cases of decadal comparison (1980s–2010 in Cristallo, Antelao Inferiore, and Marmolada) where the total glacier area produced larger geodetic mass balance losses than calculations using the common area.
4.3 Climate data
The general trend for temperature and precipitation SAI showed more frequent positive values towards the end of the 1985–2022 time frame (Fig. 7a), meaning long-term above-average temperatures and precipitation. On the contrary, a negative SAI means long-term below-average temperature or precipitation. The nine lowest T SAI values fell within the first 15 years (1985–2000), with the only exception of 2014 (T SAI ). Among the 10 highest events, 7 were in the last 15 years (2007–2022). Exceptions were the years 1994, 1998, and 2003, with the latter showing the highest T SAI with a value of 2.74. The minimum T SAI was recorded in 1989 with −2.18. Concerning the Pr SAI, the rising trend was less pronounced than for temperature but still showed a clear increase. Indeed p values were for Pr SAI and for T SAI. In this case, 6 of the 10 lowest Pr SAI values were before 2000 and 8 of the highest were recorded after 2008. The Pr SAI was greatest in 2014 with a value of >2 and lowest in 1996 with −1.22. In the first half of the time series the T SAI tended to be lower than the Pr SAI, while in the second half, this trend progressively reversed. Furthermore, SAI values, particularly regarding temperature, were more positive towards the end of the time frame. Temperatures rose by 0.4–0.6 °C per decade since 1985, while precipitation showed an increase that lasted about 15 years from 1995, culminating in the extremely snowy year of 2014 (Fig. 7b). Fedaia station, the only one providing data since 1980, did not show any trend for the total snow accumulation (p value of 0.61; Fig. 7c); however, increased extreme events could be observed in the last decade of its time frame. The snow monitoring stations did not show any trend for the total snow accumulation (p values of 0.54–0.95; Fig. 7c); however, extreme events (above the 95th percentile) were observed in 2013 and 2014 for all the stations.
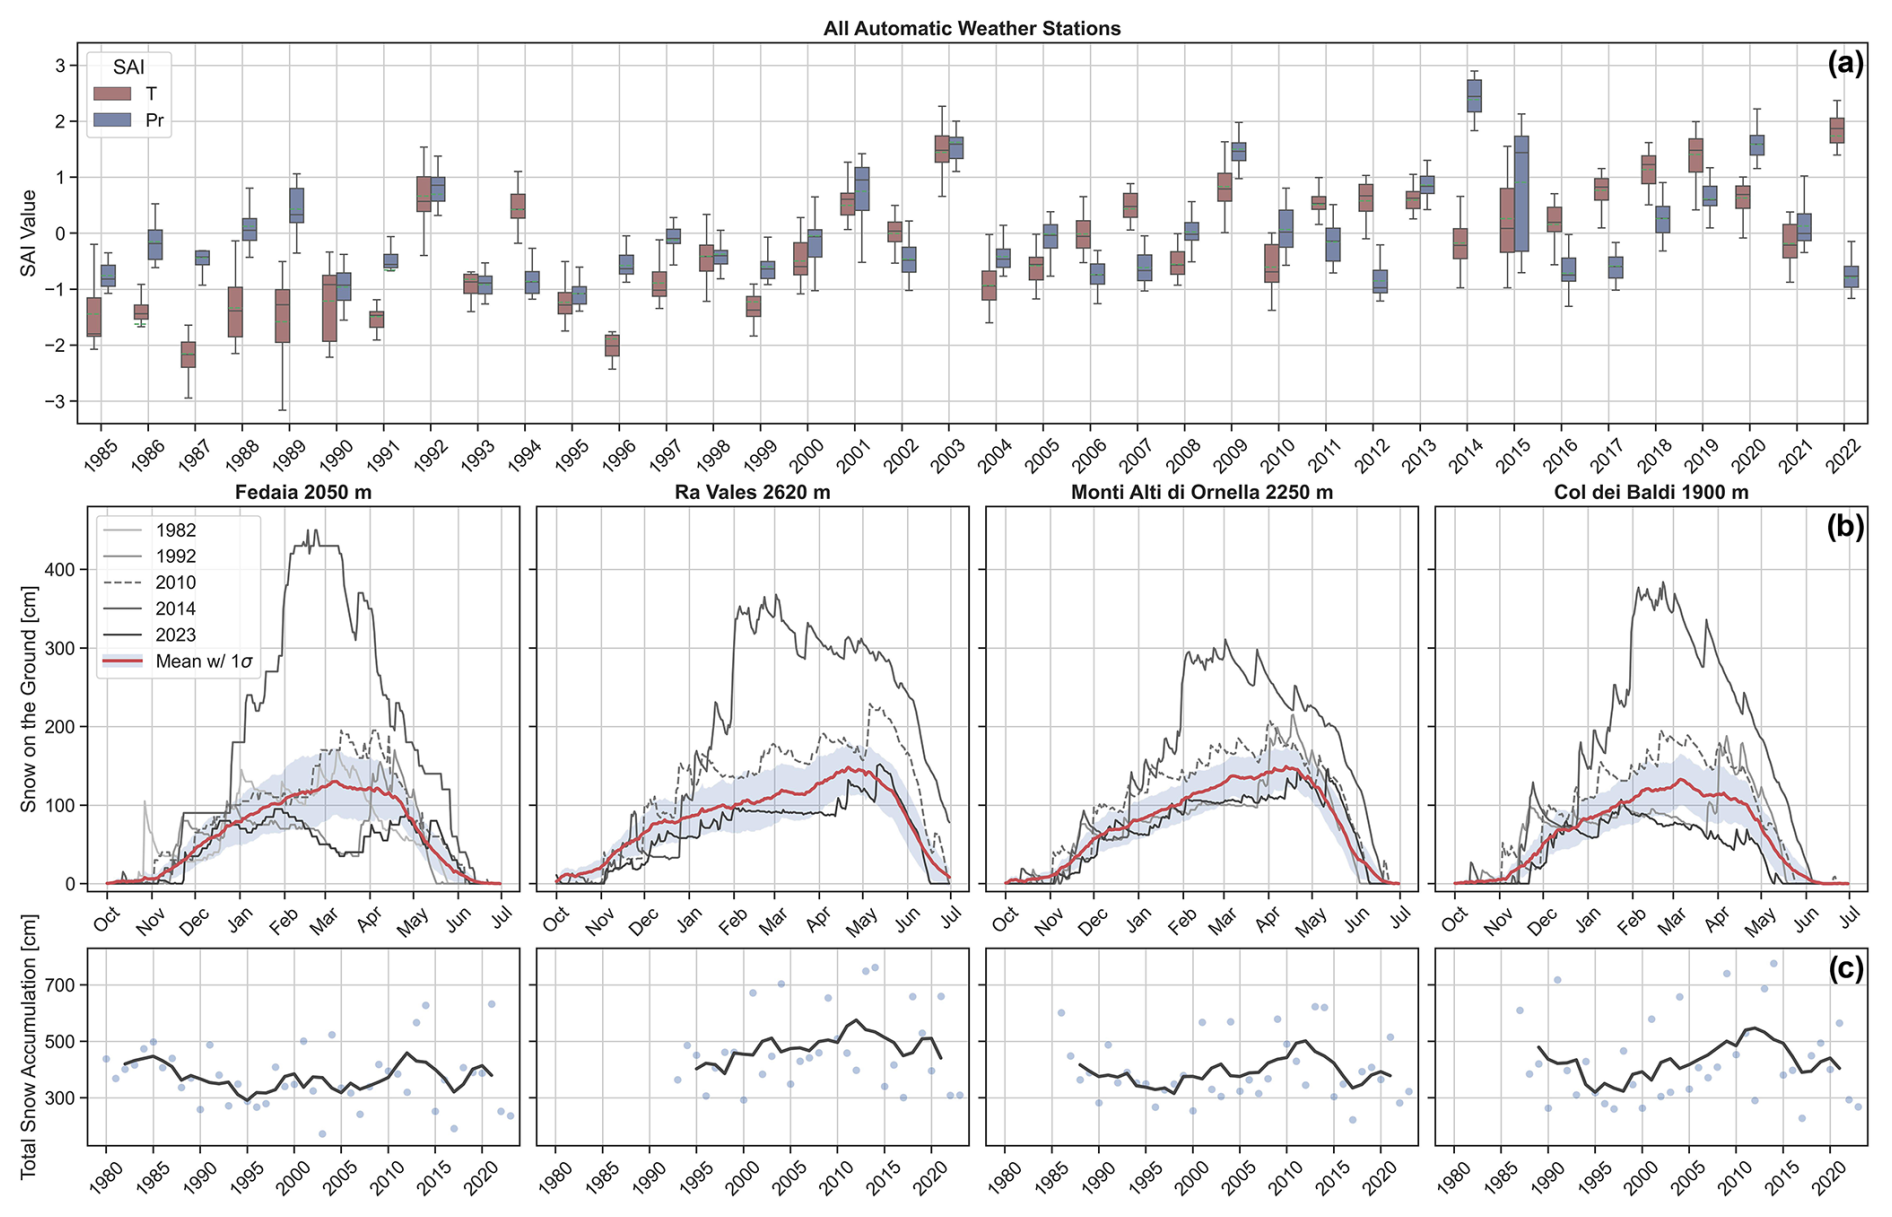
Figure 7(a) T SAI (red boxes) and Pr SAI (blue boxed) calculated between 1985 and 2022 and averaged over 22 AWSs. The boxes show the quartile (Q) of the dataset, with the central black line representing the median and green line the mean. The whiskers extend to and , where Q1 and Q3 are the first and third quartiles. (b) Snow depth on the ground between October and June for the most relevant years of the study and the 1980s/1990s–2023 mean ±1σ (red line and grey shade) for the Fedaia, Ra Vales, Monti Alti di Ornella, and Col dei Baldi stations. (c) Total annual snow accumulation and 5-year centred running mean (black line) for the same snow monitoring stations. The years shown in the plot refer to hydrological years; e.g. 2023 refers to 2022/23.
Snow height on the ground showed a peak in March or April depending on the station altitude (Fig. 7b). Among the investigated years, 2023 and 1992 values were below the mean for most of the accumulation season, getting close to or even overtaking the mean only in April (April and May for the highest stations of Ra Vales and Monti Alti di Ornella).
5.1 Climate trends impacting the Dolomite cryosphere
There are numerous studies describing the characteristics of the recent climate regime change occurring in the Alps (Huss et al., 2017; Hock et al., 2019). The main parameters influencing the response of the Alpine cryosphere are linked to the increase in summer temperatures and modifications in precipitation and snowfall patterns (Žebre et al., 2021). In the Eastern Alps mean summer temperature has increased by about 2.0 °C since 1979, leading to an increased ablation with more effective results also due to the extension of the ablation season (Colucci and Guglielmin, 2015; Colucci et al., 2021). Mean annual air temperature increased by 0.3±0.2 °C per decade. On the other hand, while the fraction of precipitation falling as rain has increased compared to that of snow in low- and mid-altitude areas, this effect has not yet been observed in winter in high-altitude glacial basins. Additionally, there is generally an average increase in snowfall amounts during the winter season at high altitudes in the Alps from 1971 (Matiu et al., 2021). However, the increase in snow, particularly linked to extreme events (e.g. the winter of 2014), has not been able to counterbalance the increase in summer temperatures, resulting in consistently negative mass balances after 2001 (Hugonnet et al., 2021). Only in very limited areas where the highest mean annual precipitation is recorded have some small residual glacial bodies slowed their reduction (Scotti et al., 2014; Colucci et al., 2021).
Using the SAI, it is possible to observe how in the last 2 decades unfavourable conditions for glaciation have prevailed. Only a few exceptions exist, notably 2014 which shows a winter precipitation anomaly with Pr SAI >2. That year was very favourable for glaciation in all of the Eastern Alps (Colucci et al., 2021), although the overall Alpine mass balance remained negative (WGMS, 2021). On the contrary, the mass loss of the glaciers was particularly noteworthy in the hydrological year 2021/22 (Voordendag et al., 2023). 2022 was by far the most extreme melting year among those analysed, with an extremely effective ablation season (T SAI =2.24) and a dry accumulation season (Pr SAI ). Within Alpine mass balance records, the results of the ablation season of 2022 were unprecedented.
Overall, in the Dolomites we can observe an extreme form of the ablation period with higher mean and extreme temperatures associated with a slight increase in snowfall on glacial basins, which is however insufficient to counterbalance the temperature increase. According to such a climatic evolution, the Dolomites are rapidly turning from being mountains hosting sites favourable to local glaciation to areas where periglacial processes will progressively gain importance.
5.2 The Dolomite glaciers within the European Alps
The European Alps are home to 12 reference glaciers (RGs) with available glaciological mass balance data from before 1980 (WGMS, 2021). These can be used as benchmarks for our results, considering that the study area lacks any long-term mass balance monitoring programme. All the Dolomite glaciers exhibit a geodetic mass balance within the range of the RGs, with values at the upper end, similar to the RGs that have had less loss () during the last 4 decades (Fig. 6). The Fradusta glacier is the only site that presents a cumulative mass balance close to the 1980–2023 RG average. Glaciers with debris cover (Popera Alto and Pensile and Sorapiss Occidentale) or which are topographically shadowed (Cristallo, Antelao Inferiore) display mass balances that are comparable to those of other RGs (e.g. Kesselwandferner, Allalin, Giétro), although these are larger and lie at higher altitudes. In terms of decadal mass balance rates, the Dolomites match the behaviour of RGs during the 1980s (−0.45 ), while they are always lower than the average rates during the following decades. Dolomite glacier mass balance rates are half of the average RG rate during the last 13 years, with −0.63 compared to −1.27 . If we consider all 17 RGs available in central Europe from 2010 to 2023 the average mass balance rate equals −1.44 (WGMS, 2021).
Calculations of glacier mass change from space are constantly evolving and improving in terms of spatial and temporal resolution (Berthier et al., 2023) and are now able to provide a valid solution for monitoring glaciers over time (Berthier et al., 2024). However, global studies with resolutions generally on the order of tens of metres (e.g. Hugonnet et al., 2021) are not suitable for monitoring very small glaciers. These glaciers, such as those in the Dolomites, have a lower degree of accuracy mainly due to their size and often present artefacts related to the surrounding steep topography. It is therefore important that global studies, which are of fundamental importance, do not replace higher-resolution measurements (e.g. close-range airborne remote sensing) for monitoring smaller glaciers.
The apparent resistance of the Dolomite glaciers to climate change is due to several factors: (i) the orographic protection offered by the complex topography of these mountains, (ii) the importance of avalanches in the dynamics of these glaciers, and (iii) the abundant debris cover that affects the remaining glacial volumes. All these factors contribute to dampening the effects of climate change, as observed in similar contexts in the Alps. Glaciers behaving similarly are for example found in the easternmost sector of the Alps (Julian Alps) or in the Orobic Alps (southern-central Alps), where topography feedback and conditions similar to the ones characterising the Dolomite glaciers are found. The Montasio Occidentale glacier and Canin East ice patches, in the Julian Alps, share less negative mass balance rates, with −0.09 (2006–2019; De Marco et al., 2020) and −0.10 (2010–2023; Colucci et al., 2021). The Lupo glacier, the only glacier in the Orobic Alps which is routinely monitored by the Servizio Glaciologico Lombardo (SGL), instead exhibits a mass balance rate of −1.08 (2010–2023), although it is heavily negatively influenced by the 2022 and 2023 seasons (Hagg et al., 2017).
Cumulative geodetic mass balance measurements derived from single years during different decades, as used in this study, can be impacted by seasonal variability influencing the surveys. The presence of residual snow on glacier surface and firn can alter the measurements introducing a bias. This bias is already partially included in the ±60 kg m−3 used as density conversion factor uncertainty (δρ). From our observations, this might have influenced data in 1980s and the ensuing geodetic results with a negative bias in the mass balance, albeit within the methodology error. 1991–1992 glacier conditions at the time of the survey instead appear optimal. The same issues that affected the 1980s surveys may have influenced the 2010 surveys too, although with less intensity. Data from 2014 cannot be considered useful for assessing the state of glaciers, as thick residual snow was present on almost all the considered sites. Surveys from 2023 were carried out during the best possible time window and present no bias.
5.3 Local glaciological variability within the Dolomites
The glaciers of the Dolomites are all classified as very small glaciers (<0.5 km2), except for Marmolada Principale. Their short-term mass balance is influenced by local topography and avalanche accumulation, rather than by climate conditions alone.
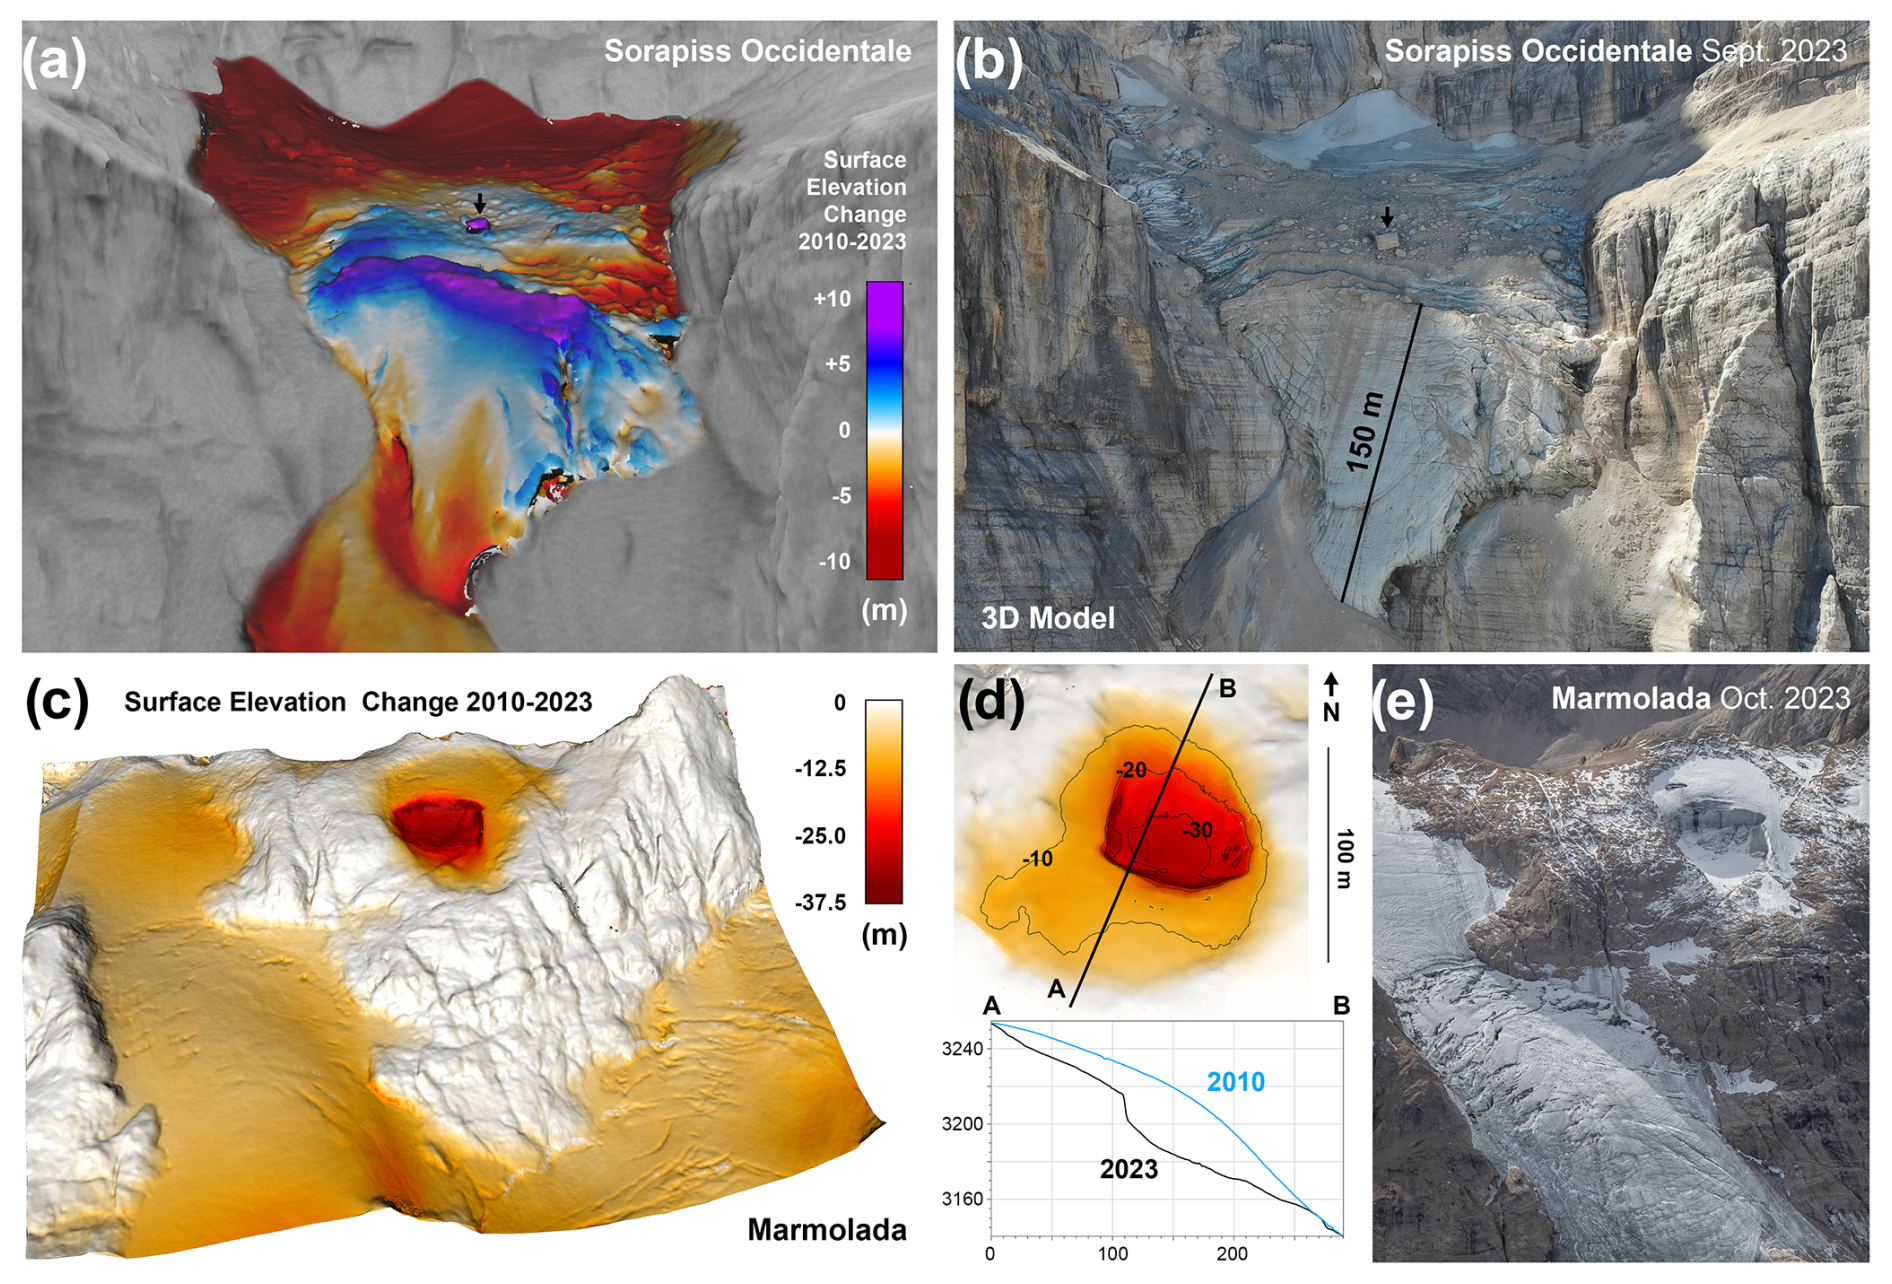
Figure 8Sorapiss Occidentale (a) surface elevation change and (b) 3D model. The black arrow is used as a reference between subplots (a) and (b). (c) Surface elevation change in the Marmolada glacier, with (d) a magnification of the area of interest regarding the ice avalanche that happened on 3 July 2022 with a vertical profile in 2010 and 2023 and (e) an aerial photo of the release zone.
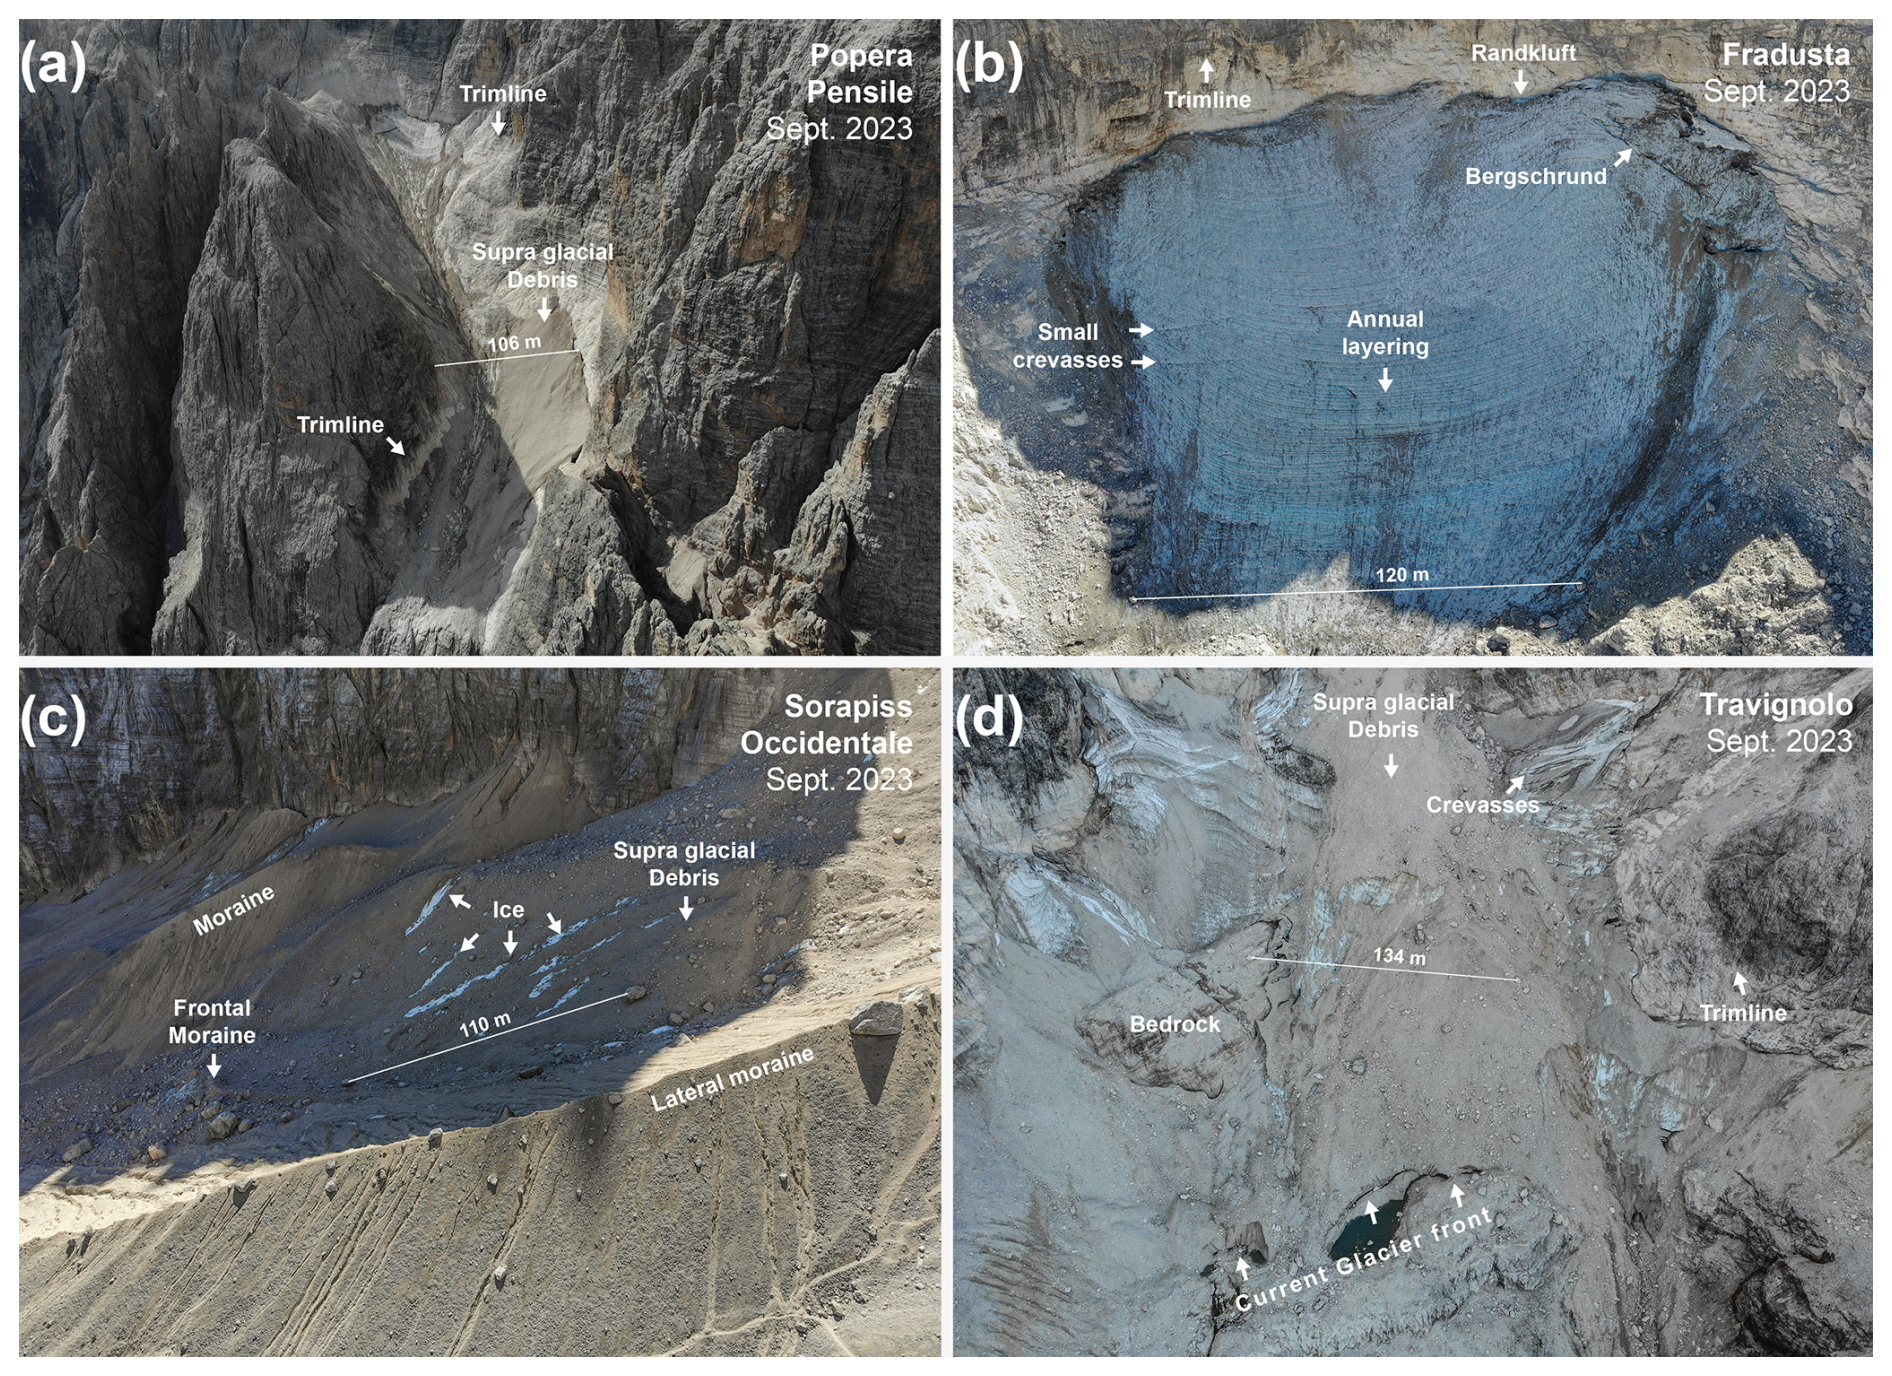
Figure 9Photos of different settings of the Dolomite glaciers and their relationship with local topography: (a) Popera Pensile, (b) Fradusta Superiore (multiple photos merged together), (c) frontal part of Sorapiss Occidentale, and (d) Travignolo glacier front.
An example of the influence of local topography on glacier evolution is Sorapiss Occidentale, where a steep rock wall separates the upper cirque from the lower portion of the glacier. The upper portion, where the highest thickness losses are observed, was completely debris free until a recent rockfall, which occurred after 2010 (Fig. 8a). The lower part of the glacier, where a thick layer of debris is present, extends almost up to the frontal moraine. The overload caused by the recent rockfall appears to have produced a small surge in its central crevassed portion, as proven by the advanced position of the crevasses between the 2010 and 2023 surveys. The increases in the surface elevation are related to the volume of the rock and debris fallen but cannot explain the relative elevation gain values larger than 10 m by itself (Fig. 8a). Similar processes, involving actual surges and not only partial advances, have been observed for other Alpine glaciers before on rare occasions (e.g. Deline, 2001).
The Marmolada glacier, in its main sector, Marmolada Principale, is by far the largest of the area. Thickness losses here appear to be inversely proportional to their elevation during all 4 decades of our study, although the maximum losses measured in the recent period (2010–2023) are linked to the ice avalanche detached from one of its highest portions (Fig. 8b). The former Marmolada glacier is now divided into six different parts, each with varying degrees of thickness loss (Fig. 5b). The presence of cold ice has been detected in some of them (Forte et al., 2020). It should be noted that the thickness losses of Marmolada Principale may have been reduced by anthropic activities related to the ski slope maintenance and the use of geotextile sheets, as reported during some ablation seasons (e.g. Baroni et al., 2015).
Typically, relative uncertainties of the glacier area are increasingly higher for smaller glaciers (Fischer et al., 2014). Lower uncertainties can be obtained with higher-resolution imagery (e.g. ±2.3 %, Linsbauer et al., 2021), even for regional glacier inventories. In our study, area uncertainties are not considered a relevant factor for the bare ice surface from 2010 to 2023, as we have very high-resolution multi-source datasets (i.e. point clouds, multi-temporal change, orthophotos) that do not have cloud or shadow problems and are accompanied by field observations. Therefore, the influence of area uncertainty in the subsequent mass balance calculation is limited. The issue is instead relevant to the older imagery (1980s–1990s) and for debris-covered glacier portions like Popera Alto and Sorapiss Occidentale, where mapping is not straightforward. In particular, dead-ice patches in front of the actual debris-covered glacier are not always easy to distinguish from the main glacial body if additional data (e.g. ground-penetrating radar) are not available (Santin et al., 2023) (e.g. Fig. 9a and c). Another challenging issue regards evaluating the dynamic behaviour of these debris-covered fronts. To address this, we have used the approach of Paul et al. (2009), including adjacent debris-covered areas and dead-ice bodies in the so-called “potential” glacier area. An additional verification has been done using multi-temporal data and field observations.
Some of the Dolomite glaciers, such as Fradusta Superiore, Popera Pensile, and Antelao Inferiore, are now at the border between the classification of mountain glaciers and ice patches. Despite this, they can still be classified as glaciers due to the evidence of recent dynamics and internal deformation through the presence of open crevasses. For example, Antelao Inferiore still presents visible crevasses and Popera Pensile and Fradusta Superiore show the presence of a bergschrund and annual layering (Fig. 9a and b). The outcropping ice/firn surface is often characterised by irregularly spaced convex bands of ice rich in fine sediment. These features are consistent with variations in ice/firn velocity across the glacier, with the fastest flow being observed away from the ice margins (Hughes, 2007; Colucci and Guglielmin, 2015), suggesting the presence of ice movement.
Projecting our mass balance trends into the future is not straightforward due to the high range of morphological differences in each ice body considered here. Processes like debris cover increase or glacier segmentation may contribute to different responses to ongoing warming, making these glaciers more resilient. The shrinkage and rapid disappearance of glaciers in the Dolomites may find a counterpart behaviour exhibited since the Little Ice Age in glaciers of the Julian Alps (e.g. Canin and Triglav glaciers, Colucci, 2016; Colucci and Žebre, 2016) or in other minor glacial bodies in the Prokletije (Albania), Durmitor (Montenegro), and Pirin (Bulgaria) mountain ranges (Hughes, 2010, 2018; Hughes and Woodward, 2016; Gachev et al., 2016). A similar evolution awaits all glaciers sharing a low elevation and small size in the European Alps (Cook et al., 2023).
We quantified the last 40 years of ice melting in the remaining Dolomite glaciers, highlighting how local topography can act as positive feedback in slowing mass loss compared to the larger reference glaciers of the European Alps. The existing glaciers in the region lost 56 % of their area and 0.64±0.06 from the early 1980s to 2023. The cumulative estimated volume loss is 0.105 Gt, of which 0.022 Gt was in the last 13 years (2010–2023). In the late 1950s the Dolomites hosted 33 glaciers, of which only 9 are still considered mountain glaciers today (Smiraglia et al., 2015).
All the glaciers in the Dolomites currently have their accumulation areas below the envELA and are projected to disappear or segment into minor glacial bodies in a few decades. Their fate appears inevitable even if a 1991–2020 steady-state climate is assumed. Only locally may favourable feedback be brought by the debris coverage. A few glacial bodies may eventually shift from glacial to periglacial, thus becoming more resilient in a warming climate.
Although this work adds new quantitative information that fills part of the existing gap, we strongly encourage more specific monitoring for some if not all these sites at least on an annual basis. This is of even greater importance in the context of the present climate trend, which is leading to a rapid degradation of the Dolomite glacial bodies. As evidenced by e.g. the ice avalanche of the Marmolada glacier in July 2022, the final stages of the disappearance of these glaciers may result in parossistic events, which in turn pose risks in an extremely popular tourist area.
Archival imagery is accessible online (https://idt2.regione.veneto.it/portfolio/aereofototeca/, Regione Del Veneto, 2024). Lidar and AWS data can be made available upon request to ARPAV (https://www.arpa.veneto.it, ARPAV, 2024). 2023 surveys will be made available on request. Processed data are accessible on Zenodo (https://doi.org/10.5281/zenodo.11109783, Securo et al., 2024b).
The supplement related to this article is available online at https://doi.org/10.5194/tc-19-1335-2025-supplement.
Conceptualisation: AS, RRC. Investigation: AS. Methodology: AS, CDG, RRC. Supervision: RRC. Visualisation: AS, CDG. Writing – original draft preparation: AS, CDG, RRC, GB. Writing – review and editing: all authors.
The contact author has declared that none of the authors has any competing interests.
Publisher's note: Copernicus Publications remains neutral with regard to jurisdictional claims made in the text, published maps, institutional affiliations, or any other geographical representation in this paper. While Copernicus Publications makes every effort to include appropriate place names, the final responsibility lies with the authors.
The authors would like to acknowledge ARPAV and Fabrizio Tagliavini for the availability of the dataset of the lidar survey campaign of the Dolomite glaciers and their weather station; the Alpine-Adriatic Meteorological Society for financing the 2023 Marmolada and Popera surveys; Justin Perry for the English editing of an earlier version of the paper; Daniele Fontana for support and help during the 2023 survey campaign; Gerry De Zolt for logistical support during the flight above the Marmolada glacier in 2023; and Marco Basso Bondini, Luca Baggio, Luca Virili, Maria Luisa Miotti, Samanta Miotti, and Joao Gomez Ilha for help during fieldwork.
This paper was edited by Ben Marzeion and reviewed by two anonymous referees.
ARPAV: Dati ambientali, https://www.arpa.veneto.it, last access: 28 February 2024. a
Auer, I., Böhm, R., Jurkovic, A., Lipa, W., Orlik, A., Potzmann, R., Schöner, W., Ungersböck, M., Matulla, C., Briffa, K., Jones, P., Efthymiadis, D., Brunetti, M., Nanni, T., Maugeri, M., Mercalli, L., Mestre, O., Moisselin, J.-M., Begert, M., Müller-Westermeier, G., Kveton, V., Bochnicek, O., Stastny, P., Lapin, M., Szalai, S., Szentimrey, T., Cegnar, T., Dolinar, M., Gajic-Capka, M., Zaninovic, K., Majstorovic, Z., and Nieplova, E.: HISTALP – historical instrumental climatological surface time series of the Greater Alpine Region, Int. J. Climatol., 27, 17–46, https://doi.org/10.1002/joc.1377, 2007. a
Baroni, C., Bondesan, A., and Mortara, G.: Campagna glaciologica annuale dei ghiacciai italiani, Geogr. Fis. Din. Quat., 38, 229–304, 2015. a
Berthier, E., Floriciou, D., Gardner, A. S., Gourmelen, N., Jakob, L., Paul, F., Treichler, D., Wouters, B., Belart, J. M., Dehecq, A., Dussaillant, I., Hugonnet, R., Kæb, A., Krieger, L., Pálsson, F., and Zemp, M.: Measuring glacier mass changes from space – a review, Rep. Prog. Phys., 86, 036801, https://doi.org/10.1088/1361-6633/acaf8e, 2023. a, b
Berthier, E., Lebreton, J., Fontannaz, D., Hosford, S., Belart, J. M.-C., Brun, F., Andreassen, L. M., Menounos, B., and Blondel, C.: The Pléiades Glacier Observatory: high-resolution digital elevation models and ortho-imagery to monitor glacier change, The Cryosphere, 18, 5551–5571, https://doi.org/10.5194/tc-18-5551-2024, 2024. a
Bhardwaj, A., Sam, L., Bhardwaj, A., and Martín-Torres, F. J.: LiDAR remote sensing of the cryosphere: present applications and future prospects, Remote Sens. Environ., 177, 125–143, https://doi.org/10.1016/j.rse.2016.02.031, 2016. a
Bondesan, A. and Francese, R. G.: The climate-driven disaster of the Marmolada Glacier (Italy), Geomorphology, 431, 108687, https://doi.org/10.1016/j.geomorph.2023.108687, 2023. a, b
Bosellini, A., Gianolla, P., and Stefani, M.: Geology of the Dolomites, Episodes, 26, 181–185, https://doi.org/10.18814/epiiugs/2003/v26i3/005, 2003. a
Carrivick, J. L., Smith, M. W., and Quincey, D. J.: Current Applications of Structure from Motion in the Geosciences, John Wiley and Sons, Ltd, https://doi.org/10.1002/9781118895818.ch6, 2016. a
Castiglioni, B.: Alcuni ghiacciai nelle Dolomiti e il loro ambiente orografico e climatico, Bollettino C.A.I., 42, 323–379, 1925. a, b
Castiglioni, B.: Risultati di una recente visita ai ghiacciai Cadorini, Mem. Geol. E Geogr. Di G. Dainelli, 1, 291–317, 1930. a
CGI-CNR: Catasto dei Ghiacciai Italiani, 4 (Ghiacciai delle Tre Venezie e dell'Appennino), Comitato Glaciologico Italiano, Torino, 1962. a, b, c
Chiarle, M., Iannotti, S., Mortara, G., and Deline, P.: Recent debris flow occurrences associated with glaciers in the Alps, Global Planet. Change, 56, 123–136, https://doi.org/10.1016/j.gloplacha.2006.07.003, 2007. a
Cibien, M., Ferrarese, L., and Meneghel, F.: The Glaciers of Mount Antelao (Dolomites, Italy) since the Little Ice Age, Geogr. Fis. Din. Quat., 30, 131–139, 2007. a
Clarke, G. K.: A short history of scientific investigations on glaciers, J. Glaciol., 33, 4–24, https://doi.org/10.3189/s0022143000215785, 1987. a
Colucci, R. R.: Geomorphic influence on small glacier response to post-Little Ice Age climate warming: Julian Alps, Europe, Earth Surf. Proc. Land., 41, 1227–1240, https://doi.org/10.1002/esp.3908, 2016. a
Colucci, R. R. and Guglielmin, M.: Precipitation-temperature changes and evolution of a small glacier in the southeastern European Alps during the last 90 years, Int. J. Climatol., 35, 2783–2797, https://doi.org/10.1002/joc.4172, 2015. a, b
Colucci, R. R. and Žebre, M.: Late Holocene evolution of glaciers in the southeastern Alps, J. Maps, 12, 289–299, https://doi.org/10.1080/17445647.2016.1203216, 2016. a
Colucci, R. R., Žebre, M., Torma, C. Z., Glasser, N. F., Maset, E., Gobbo, C. D., and Pillon, S.: Recent increases in winter snowfall provide resilience to very small glaciers in the Julian Alps, Europe, Atmosphere-Basel, 12, 1–26, https://doi.org/10.3390/atmos12020263, 2021. a, b, c, d
Cook, S. J., Jouvet, G., Millan, R., Rabatel, A., Zekollari, H., and Dussaillant, I.: Committed Ice Loss in the European Alps Until 2050 Using a Deep-Learning-Aided 3D Ice-Flow Model With Data Assimilation, Geophys. Res. Lett., 50, e2023GL105029, https://doi.org/10.1029/2023GL105029, 2023. a
Crepaz, A., Cagnati, A., and Luca, G. D.: Evoluzione dei ghiacciai delle Dolomiti negli ultimi cento anni, Neve e Valanghe, 80, 20–25, 2013. a
Davaze, L., Rabatel, A., Dufour, A., Hugonnet, R., and Arnaud, Y.: Region-wide annual glacier surface mass balance for the European Alps from 2000 to 2016, Front. Earth Sci., 8, 149, https://doi.org/10.3389/feart.2020.00149, 2020. a
De Marco, J., Carturan, L., Piermattei, L., Cucchiaro, S., Moro, D., Fontana, G. D., and Cazorzi, F.: Minor imbalance of the lowermost Italian glacier from 2006 to 2019, Water-Sui., 12, 2503, https://doi.org/10.3390/w12092503, 2020. a
Del Longo, M., Finzi, E., Galgaro, A., Godio, A., Luchetta, A., Pellegrini, G. B., and Zambrano, R.: Responses of the Val D' Arcia small dolomitic glacier (Mount Pelmo, Eastern Alps) to recent climatic changes.Geomorphological and geophysical study, Geogr. Fis. Din. Quat., 24, 43–55, 2001. a, b
Deline, P.: Recent Brenva Rock Avalanches (Valley of Aosta): new chapter in an old history?, Geogr. Fis. Din. Quat., 5, 55–63, 2001. a
Fischer, M., Huss, M., Barboux, C., and Hoelzle, M.: The new Swiss Glacier Inventory SGI2010: relevance of using high-resolution source data in areas dominated by very small glaciers, Arct. Antarct. Alp. Res., 46, 933–945, https://doi.org/10.1657/1938-4246-46.4.933, 2014. a
Fischer, M., Huss, M., Kummert, M., and Hoelzle, M.: Application and validation of long-range terrestrial laser scanning to monitor the mass balance of very small glaciers in the Swiss Alps, The Cryosphere, 10, 1279–1295, https://doi.org/10.5194/tc-10-1279-2016, 2016. a
Forte, E., Santin, I., Colucci, R. R., Dossi, M., Guglielmin, M., Pipan, M., Roncoroni, G., and Žebre, M.: GPR data analysis for cold and warm ice detection and characterization in polythermal glaciers, 18th International Conference on Ground Penetrating Radar, Golden, Colorado, 14–19 June 2020, 69–72, https://doi.org/10.1190/gpr2020-019.1, 2020. a
Gachev, E., Stoyanov, K., and Gikov, A.: Small glaciers on the Balkan Peninsula: state and changes in the last several years, Quatern. Int., 415, 33–54, https://doi.org/10.1016/j.quaint.2015.10.042, 2016. a
Gobiet, A., Kotlarski, S., Beniston, M., Heinrich, G., Rajczak, J., and Stoffel, M.: 21st century climate change in the European Alps – a review, Sci. Total Environ., 493, 1138–1151, https://doi.org/10.1016/j.scitotenv.2013.07.050, 2014. a
Hagg, W., Scotti, R., Villa, F., Mayer, E., Heilig, A., Mayer, C., Tamm, W., and Hock, T.: Evolution of two cirque glaciers in lombardy and their relation to climatic factors (1962–2016), Geogr. Ann. A, 99, 371–386, https://doi.org/10.1080/04353676.2017.1368834, 2017. a
Harshit, H., Kushwaha, S. K. P., and Jain, K.: GEOMETRIC FEATURES INTERPRETATION OF PHOTOGRAMMETRIC POINT CLOUD FROM UNMANNED AERIAL VEHICLE, ISPRS Ann. Photogramm. Remote Sens. Spatial Inf. Sci., X-4/W2-2022, 83–88, https://doi.org/10.5194/isprs-annals-X-4-W2-2022-83-2022, 2022. a
Hock, R., Rasul, G., Adler, C., Cáceres, B., Gruber, S., Hirabayashi, Y., Jackson, M., Kääb, A., Kang, S., Kutuzov, S., Milner, A., Molau, U., Morin, S., Orlove, B., and Steltzer, H.: High mountain areas, IPCC special report on the ocean and cryosphere in a changing climate, 131–202, https://doi.org/10.1017/9781009157964.004, 2019. a, b
Hughes, P. D.: Recent behaviour of the Debeli Namet glacier, Durmitor, Montenegro, Earth Surf. Proc. Land., 32, 1593–1602, https://doi.org/10.1002/esp.1537, 2007. a
Hughes, P. D.: Little Ice Age glaciers in the Balkans: low altitude glaciation enabled by cooler temperatures and local topoclimatic controls, Earth Surf. Proc. Land., 35, 229–241, https://doi.org/10.1002/esp.1916, 2010. a
Hughes, P. D.: Little ice age glaciers and climate in the mediterranean mountains: a new analysis, Geographical Research Letters, 44, 15–45, https://doi.org/10.18172/cig.3362, 2018. a
Hughes, P. D. and Woodward, J. C.: Quaternary glaciation in the Mediterranean mountains: A new synthesis, Geol. Soc. Spec. Publ., 433, 1–23, https://doi.org/10.1144/SP433.14, 2016. a
Hugonnet, R., McNabb, R., Berthier, E., Menounos, B., Nuth, C., Girod, L., Farinotti, D., Huss, M., Dussaillant, I., Brun, F., and Kæb, A.: Accelerated global glacier mass loss in the early twenty-first century, Nature, 592, 726–731, https://doi.org/10.1038/s41586-021-03436-z, 2021. a, b, c
Huss, M.: Density assumptions for converting geodetic glacier volume change to mass change, The Cryosphere, 7, 877–887, https://doi.org/10.5194/tc-7-877-2013, 2013. a, b
Huss, M., Dhulst, L., and Bauder, A.: New long-term mass-balance series for the Swiss Alps, J. Glaciol., 61, 551–562, https://doi.org/10.3189/2015JoG15J015, 2015. a
Huss, M., Bookhagen, B., Huggel, C., Jacobsen, D., Bradley, R., Clague, J., Vuille, M., Buytaert, W., Cayan, D., Greenwood, G., Mark, B., Milner, A., Weingartner, R., and Winder, M.: Toward mountains without permanent snow and ice, Earths Future, 5, 418–435, https://doi.org/10.1002/2016EF000514, 2017. a
ICCI: State of the Cryosphere 2022 Growing Losses, Global Impacts We cannot negotiate with the melting point of ice, International Cryosphere Climate Initiative, http://www.iccinet.org/statecryo22 (last access: 15 September 2023), 2022. a
Katz, R. and Glantz, M.: Anatomy of a rainfall index, Mon. Weather Rev., 114, 764–761, 1986. a
Knoll, C. and Kerschner, H.: A glacier inventory for South Tyrol, Italy, based on airborne laser-scanner data, Ann. Glaciol., 50, 46–52, https://doi.org/10.3189/172756410790595903, 2009. a
Knuth, F., Shean, D., Bhushan, S., Schwat, E., Alexandrov, O., Mcneil, C., Dehecq, A., Florentine, C., and Neel, S. O.: Remote sensing of environment Historical Structure from Motion (HSfM): automated processing of historical aerial photographs for long-term topographic change analysis, Remote Sens. Environ., 285, 113379, https://doi.org/10.1016/j.rse.2022.113379, 2023. a, b
Krainer, K., Lang, K., and Hausmann, H.: Active rock glaciers at Croda Rossa/Hohe Gaisl, Eastern Dolomites (Alto Adige/South Tyrol, Northern Italy), Geogr. Fis. Din. Quat., 33, 25–36, 2010. a
Krainer, K., Mussner, L., Behm, M., and Hausmann, H.: Multi-disciplinary investigation of an active rock glacier in the Sella Group (Dolomites; Northern Italy), Aust. J. Earth Sci., 105, 48–62, 2012. a
Lague, D., Brodu, N., and Leroux, J.: Accurate 3D comparison of complex topography with terrestrial laser scanner: application to the Rangitikei canyon (N-Z), ISPRS J. Photogramm., 82, 10–26, https://doi.org/10.1016/j.isprsjprs.2013.04.009, 2013. a
Linsbauer, A., Huss, M., Hodel, E., Bauder, A., Fischer, M., Weidmann, Y., Bärtschi, H., and Schmassmann, E.: The new Swiss Glacier Inventory SGI2016: from a topographical to a glaciological dataset, Front. Earth Sci., 9, 704189, https://doi.org/10.3389/feart.2021.704189, 2021. a
Marcer, M., Stentoft, P. A., Bjerre, E., Cimoli, E., Bjørk, A., Stenseng, L., and Machguth, H.: Three decades of volume change of a small Greenlandic Glacier using ground penetrating radar, structure from motion, and aerial photogrammetry, Arct. Antarct. Alp. Res., 49, 411–425, https://doi.org/10.1657/AAAR0016-049, 2017. a
Marinelli, O.: I Ghiacciai delle Alpi Venete, Mem. Geografiche. Suppl. Riv. Geogr. Ita., 4, 3–289, 1910. a
Matiu, M., Crespi, A., Bertoldi, G., Carmagnola, C. M., Marty, C., Morin, S., Schöner, W., Cat Berro, D., Chiogna, G., De Gregorio, L., Kotlarski, S., Majone, B., Resch, G., Terzago, S., Valt, M., Beozzo, W., Cianfarra, P., Gouttevin, I., Marcolini, G., Notarnicola, C., Petitta, M., Scherrer, S. C., Strasser, U., Winkler, M., Zebisch, M., Cicogna, A., Cremonini, R., Debernardi, A., Faletto, M., Gaddo, M., Giovannini, L., Mercalli, L., Soubeyroux, J.-M., Sušnik, A., Trenti, A., Urbani, S., and Weilguni, V.: Observed snow depth trends in the European Alps: 1971 to 2019, The Cryosphere, 15, 1343–1382, https://doi.org/10.5194/tc-15-1343-2021, 2021. a
Mertes, J. R., Gulley, J. D., Benn, D. I., Thompson, S. S., and Nicholson, L. I.: Using structure-from-motion to create glacier DEMs and orthoimagery from historical terrestrial and oblique aerial imagery, Earth Surf. Proc. Land., 42, 2350–2364, https://doi.org/10.1002/esp.4188, 2017. a
Midgley, N. G. and Tonkin, T. N.: Reconstruction of former glacier surface topography from archive oblique aerial images, Geomorphology, 282, 18–26, https://doi.org/10.1016/j.geomorph.2017.01.008, 2017. a
Mishra, N. B., Miles, E. S., Chaudhuri, G., Mainali, K. P., Mal, S., Singh, P. B., and Tiruwa, B.: Quantifying heterogeneous monsoonal melt on a debris-covered glacier in Nepal Himalaya using repeat uncrewed aerial system (UAS) photogrammetry, J. Glaciol., 68, 288–304, https://doi.org/10.1017/jog.2021.96, 2022. a
Nangeroni, G.: Fenomeni glaciali nel Gruppo di Sella (Dolomiti) – Glacial phenomena in the Sella Group (Dolomites), Bollettino CGI, 18, 105, 1938. a
Okyay, U., Telling, J., Glennie, C. L., and Dietrich, W. E.: Airborne lidar change detection: an overview of Earth sciences applications, Earth-Sci. Rev., 198, 102929, https://doi.org/10.1016/j.earscirev.2019.102929, 2019. a
Olivieri, L. and Bettanini, C.: Preliminary observation of Marmolada glacier collapse of July 2022 with space-based cameras, Remote Sens. Lett., 14, 21–29, https://doi.org/10.1080/2150704X.2022.2152754, 2023. a, b
Panizza, M.: The geomorphodiversity of the Dolomites (Italy): a key of geoheritage assessment, Geoheritage, 1, 33–42, https://doi.org/10.1007/s12371-009-0003-z, 2009. a, b
Paul, F., Barry, R. G., Cogley, J. G., Frey, H., Haeberli, W., Ohmura, A., Ommanney, C. S., Raup, B., Rivera, A., and Zemp, M.: Recommendations for the compilation of glacier inventory data from digital sources, Ann. Glaciol., 50, 119–126, https://doi.org/10.3189/172756410790595778, 2009. a
Paul, F., Rastner, P., Azzoni, R. S., Diolaiuti, G., Fugazza, D., Le Bris, R., Nemec, J., Rabatel, A., Ramusovic, M., Schwaizer, G., and Smiraglia, C.: Glacier shrinkage in the Alps continues unabated as revealed by a new glacier inventory from Sentinel-2, Earth Syst. Sci. Data, 12, 1805–1821, https://doi.org/10.5194/essd-12-1805-2020, 2020. a
Piermattei, L., Carturan, L., and Guarnieri, A.: Use of terrestrial photogrammetry based on structure-from-motion for mass balance estimation of a small glacier in the Italian alps, Earth Surf. Proc. Land., 40, 1791–1802, https://doi.org/10.1002/esp.3756, 2015. a
Pignatti, E. and Pignatti, S.: Plant Life of the Dolomites, Springer, https://doi.org/10.1007/978-3-642-31043-0, 2014. a
Porro, C.: Elenco dei ghiacciai italiani – Monografia statistica del generale, Ministero dei lavori pubblici – Servizio idrografico – Ufficio Idrografico del Po, 1925. a
Rantanen, M., Karpechko, A. Y., Lipponen, A., Nordling, K., Hyvärinen, O., Ruosteenoja, K., Vihma, T., and Laaksonen, A.: The Arctic has warmed nearly four times faster than the globe since 1979, Communications Earth and Environment, 3, 168, https://doi.org/10.1038/s43247-022-00498-3, 2022. a
Richter, E.: Die Gletscher der Ostalpen, Handbücher zur Deutscher Landes und Volkskunde Stuttgart, 1888. a
Rumpf, S. B., Gravey, M., Brönnimann, O., Luoto, M., Cianfrani, C., Mariethoz, G., and Guisan, A.: From white to green: snow cover loss and increased vegetation productivity in the European Alps, Science, 376, 1119–1122, https://doi.org/10.1126/science.abn6697, 2022. a
Regione Del Veneto: ARPAV, https://idt2.regione.veneto.it/portfolio/aereofototeca/, last access: 28 February 2024. a
Santin, I., Colucci, R. R., Žebre, M., Pavan, M., Cagnati, A., and Forte, E.: Recent evolution of Marmolada glacier (Dolomites, Italy) by means of ground and airborne GPR surveys, Remote Sens. Environ., 235, 111442, https://doi.org/10.1016/j.rse.2019.111442, 2019. a
Santin, I., Forte, E., Nicora, M., Ponti, S., and Guglielmin, M.: Where does a glacier end? Integrated geophysical, geomorphological and photogrammetric measurements to image geometry and ice facies distribution, Catena, 225, 107016, https://doi.org/10.1016/j.catena.2023.107016, 2023. a
Scotti, R., Brardinoni, F., and Crosta, G. B.: Post-LIA glacier changes along a latitudinal transect in the Central Italian Alps, The Cryosphere, 8, 2235–2252, https://doi.org/10.5194/tc-8-2235-2014, 2014. a
Securo, A., Gobbo, C. D., and Colucci, R. R.: Multi-year evolution of 75 snow and ice deposits in schachtdolines and shafts of recently deglaciated karst terrain: observations from Mount Canin-Kanin, Julian Alps, Europe, Geomorphology, 417, 108434, https://doi.org/10.1016/j.geomorph.2022.108434, 2022. a
Securo, A., Del Gobbo, C., Rettig, L., Pillon, S., Luca, A. D., Fontana, D., Fasil, E. B., and Colucci, R. R.: A glacier in transition: surface elevation change, ELA and geomorphic evolution of a very small glacier in the Dolomites (S-E Alps), Geomorphology, 444, 108956, https://doi.org/10.1016/j.geomorph.2023.108956, 2024a. a
Securo, A., Gobbo, C. D., Baccolo, G., Barbante, C., Citterio, M., Blasi, F. D., Marcer, M., Valt, M., and Colucci, R. R.: The Glaciers of the Dolomites: last 40 years of melting, Zenodo [data set], https://doi.org/10.5281/zenodo.11109783, 2024b. a
Seppi, R., Zanoner, T., Carton, A., Bondesan, A., Francese, R., Carturan, L., Zumiani, M., Giorgi, M., and Ninfo, A.: Current transition from glacial to periglacial processes in the Dolomites (South-Eastern Alps), Geomorphology, 228, 71–86, https://doi.org/10.1016/j.geomorph.2014.08.025, 2014. a
Serrano, E., González Trueba, J. J., Sanjosé, J. J., and Del Río, L. M.: Ice patch origin, evolution and dynamics in a temperate high mountain environment: the jou negro, picos de europa (nw spain), Geogr. Ann. A, 93, 57–70, https://doi.org/10.1111/j.1468-0459.2011.00006.x, 2011. a
Smiraglia, C., Diolaiuti, G., and Azzoni, R.: Il nuovo catasto dei ghiacciai italiani = The new italian glacier inventory, EvK2CNR, ISBN 9788894090802, 2015. a, b, c, d, e, f
Smith, M. W., Carrivick, J. L., and Quincey, D. J.: Structure from motion photogrammetry in physical geography, Prog. Phys. Geog., 40, 247–275, https://doi.org/10.1177/0309133315615805, 2016. a
Sommer, C., Malz, P., Seehaus, T. C., Lippl, S., Zemp, M., and Braun, M. H.: Rapid glacier retreat and downwasting throughout the European Alps in the early 21st century, Nat. Commun., 11, 3209, https://doi.org/10.1038/s41467-020-16818-0, 2020. a
Tarini, M., Cignoni, P., and Scopigno, R.: Visibility based methods and assessment for detail-recovery, VIS '03: Proceedings of the 14th IEEE Visualization 2003 (VIS'03), IEEE Visualization 2003, Seattle, Washington, USA, 19–24 October 2003, p. 60, https://doi.org/10.1109/VISUAL.2003.1250407, 2003. a
Taylor, J. R.: An Introduction to Error Analysis, University Science Books, ISBN 0935702423, 1997. a
Voordendag, A., Prinz, R., Schuster, L., and Kaser, G.: Brief communication: The Glacier Loss Day as an indicator of a record-breaking negative glacier mass balance in 2022, The Cryosphere, 17, 3661–3665, https://doi.org/10.5194/tc-17-3661-2023, 2023. a
WGMS: Global Glacier Change Bulletin No. 4 (2018–2019), World Glacier Monitoring Service, Zurich, Switzerland, 278 pp., https://doi.org/10.5904/wgms-fog-2021-05, 2021. a, b, c, d, e
Zanoner, T., Carton, A., Seppi, R., Carturan, L., Baroni, C., Salvatore, M. C., and Zumiani, M.: Little Ice Age mapping as a tool for identifying hazard in the paraglacial environment: the case study of Trentino (Eastern Italian Alps), Geomorphology, 295, 551–562, https://doi.org/10.1016/j.geomorph.2017.08.014, 2017. a
Žebre, M., Colucci, R. R., Giorgi, F., Glasser, N. F., Racoviteanu, A. E., and Gobbo, C. D.: 200 years of equilibrium-line altitude variability across the European Alps (1901–2100), Clim. Dynam., 56, 1183–1201, https://doi.org/10.1007/s00382-020-05525-7, 2021. a, b, c
Zemp, M., Hoelzle, M., and Haeberli, W.: Six decades of glacier mass-balance observations: a review of the worldwide monitoring network, Ann. Glaciol., 50, 101–111, https://doi.org/10.3189/172756409787769591, 2009. a
Zemp, M., Huss, M., Thibert, E., Eckert, N., McNabb, R., Huber, J., Barandun, M., Machguth, H., Nussbaumer, S. U., Gärtner-Roer, I., Thomson, L., Paul, F., Maussion, F., Kutuzov, S., and Cogley, J. G.: Global glacier mass changes and their contributions to sea-level rise from 1961 to 2016, Nature, 568, 382–386, https://doi.org/10.1038/s41586-019-1071-0, 2019. a