the Creative Commons Attribution 4.0 License.
the Creative Commons Attribution 4.0 License.
Seasonal snow cover indicators in coastal Greenland from in situ observations, a climate model, and reanalysis
Jorrit van der Schot
Jakob Abermann
Tiago Silva
Kerstin Rasmussen
Michael Winkler
Kirsty Langley
Wolfgang Schöner
Seasonal snow cover has important climatic and ecological implications for the ice-free regions of coastal Greenland. Here we present, for the first time, a dataset of quality-controlled snow depth measurements from nine locations in coastal Greenland with varying periods between 1997 and 2021. Using a simple modelling approach (Δsnow), we estimate snow water equivalent values solely based on the daily time series of snow depth. Snow pit measurements from two locations enable us to evaluate the Δsnow model. As there are very little in situ data available for Greenland, we then test the performance of the regional atmospheric climate model (RACMO2.3p2, 5.5 km spatial resolution) and reanalysis product (CARRA, 2.5 km spatial resolution) at the nine locations with snow observations. Using the combined information from all three data sources, we study spatio-temporal characteristics of the seasonal snow cover in coastal Greenland using the example of six ecologically relevant snow indicators (maximum snow water equivalent, melt onset, melt duration, snow cover duration, snow cover onset, and snow cover end date). In particular, we evaluate the ability of RACMO2.3p2 and CARRA to simulate these snow indicators at the nine different locations, perform a time series analysis of the indicators, and assess their spatial variability. The different locations have considerable spatial and temporal variability in snow cover characteristics, and seasonal maximum snow water equivalent (amount of liquid water stored in the snowpack) values range from less than 50 kg m−2 to greater than 600 kg m−2. The correlation coefficients between maximum snow water equivalent output from Δsnow and CARRA and RACMO are 0.73 and 0.48, respectively. Correlation coefficients are highest for maximum snow water equivalent and snow cover duration, and model and reanalysis output underestimate snow cover onset. We find little evidence of statistically significant (p<0.05) trends at varied periods between 1997 and 2021 except for the earlier onset of snowmelt in Zackenberg (−8 d per decade, p=0.02, based upon RACMO output). While we stress the need for context-specific validation, this study suggests that in most cases snow depth or snow water equivalent output from CARRA can describe spatial and temporal characteristics of seasonal snow cover, particularly changes in melt onset and snow cover end date.
- Article
(6357 KB) - Full-text XML
- BibTeX
- EndNote
Seasonal snow cover has important climatic and ecological implications for the ice-free regions of coastal Greenland. Snow cover shows large spatial and temporal variability (Cohen, 1994; Gutzler and Rosen, 1992), thereby influencing local to regional climate variability by controlling the energy exchange between the surface and the atmosphere at different timescales from sub-seasonal to multi-decadal. The key mechanisms for this snow–atmosphere coupling are insulation of the ground (Cohen, 1994), the snow hydrological effect (Preece et al., 2023), high surface albedo (Diro et al., 2018), and thermal emissivity (Warren, 1982). In addition, the snowpack needs significant amounts of energy for the melting process at the end of the snow season in spring (Henderson et al., 2018). Because of this role of snow cover in the climate system, it is an important factor in determining community and ecosystem structure in Arctic regions (Bokhorst et al., 2016; Bonsoms et al., 2024; Callaghan et al., 2012; Niittynen and Luoto, 2018; Walker et al., 1993). Interannual variability of snow cover characteristics and their long-term trends thus influence many relevant ecological processes (AMAP, 2011). It is well documented that seasonal snow cover is rapidly changing in the Northern Hemisphere (e.g. Brown and Robinson, 2011; Pulliainen et al., 2020) and especially throughout the Arctic. Examples of reported changes include a −4 % per decade change in May snow cover extent (Derksen and Mudryk, 2023), significantly earlier Northern Hemisphere snowmelt (Foster et al., 2013), snow-free date in the Arctic that is 3.4 d earlier per decade (excluding Greenland) (Callaghan et al., 2012), and snow cover duration this is decreasing by 3–5 d per decade (Derksen et al., 2015). While snow cover onset trends in the Northern Hemisphere are generally negative (earlier), positive (later) trends exist as well, particularly in coastal regions (Allchin and Déry, 2020). Further changes in these variables are projected by climate models; for example, several studies estimate a 10 %–40 % decrease in snow cover duration by 2050 (Bokhorst et al., 2016; Niittynen and Luoto, 2018). It is important to mention here that most remote sensing studies on changes in snow parameters exclude coastal Greenland given the difficulty of accurately sensing these mountainous regions.
Due to well-known challenges in snow monitoring (snow drift, high maintenance costs, lack of power supply, data gaps due to sensor failure), directly observed seasonal snow cover data from the ice-free coastal regions of Greenland is limited; however, it does exist. Here, we present a little-used, quality-controlled dataset of seasonal snow, collected by Asiaq – Greenland Survey. We use these data to assess spatio-temporal characteristics of seasonal snow cover at each observation location in the ice-free regions of coastal Greenland and assess whether state-of-the-art climate models can simulate these spatio-temporal characteristics.
The aim of this study is to present, for the first time, a quality-controlled dataset of daily snow depth (HS) for the coastal regions of Greenland for the period 1997–2021. Using a simple modelling approach (Δsnow), we estimate snow water equivalent (SWE), which is the amount of liquid water stored in the snowpack, solely based on the daily time series of HS. To overcome the shortcomings of the low temporal and spatial coverage of the daily HS observations, we then use the Δsnow output to evaluate the ability of a regional climate model (RACMOv2.3) and an Arctic reanalysis product (CARRA) to simulate observed spatio-temporal patterns of HS and SWE. Based on this validation, which is new for Greenland, we can then use the simulated HS and SWE to obtain spatio-temporal characteristics for several climatologically and ecologically relevant snow indicators (Callaghan et al., 2012; Lund et al., 2017; Wu et al., 2023): maximum SWE (SWEmax), start of melting (Monset), duration of melting (Mduration), duration of snow cover (SCduration), start of snow cover (SConset), and end of snow cover (SCend date) for Greenland. In this way, ecologically and climatologically relevant differences in snow cover accumulation and depletion can be substantiated with data. In particular, we investigate whether there are systematic differences in snow cover characteristics between Greenland's east and west coasts and what factors explain these differences. We use different statistical measures to provide a first insight into the spatio-temporal differences and trends in seasonal snow cover, taking statistical significance into account.
2.1 Snow depth observations (HSOBS)
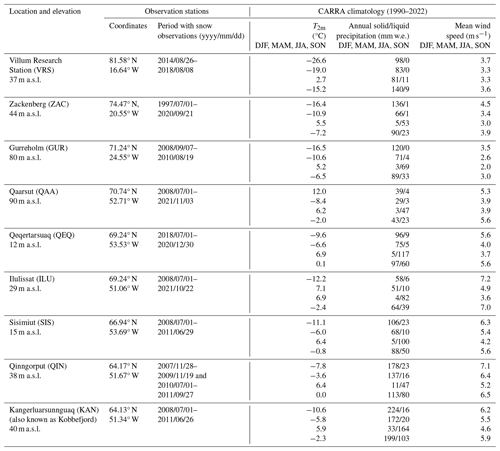
The HS data presented in this study were collected by Asiaq – Greenland Survey at their automatic weather stations located along the west and east coasts of Greenland. From a total of 23 weather stations, 9 are presented here. The remaining 14 are excluded due to data gaps, insufficient duration of the measuring period, or the fact that the resulting data did not accurately represent general local snow conditions (e.g. due to wind-related factors) (see rejected stations in Fig. 1). The datasets span different periods within the period 1997 until 2021 (Table 1). All stations are located in the ice-free part of coastal Greenland. Six are located on the west coast, and three are located on the east coast. HS has been measured using sonic ranging sensors (most commonly Campbell Scientific SR50a), which are known to have an accuracy of ca. ±1.0 cm (Campbell Scientific, 2021). These sensors are installed as part of the weather station, which is set up to measure representative weather conditions in the towns and villages. Site selection for these weather stations was based on WMO recommendations, balanced with infrastructure and logistic requirements. The dataset of nine time series of HS used in this study will hereafter be referred to as HSOBS.
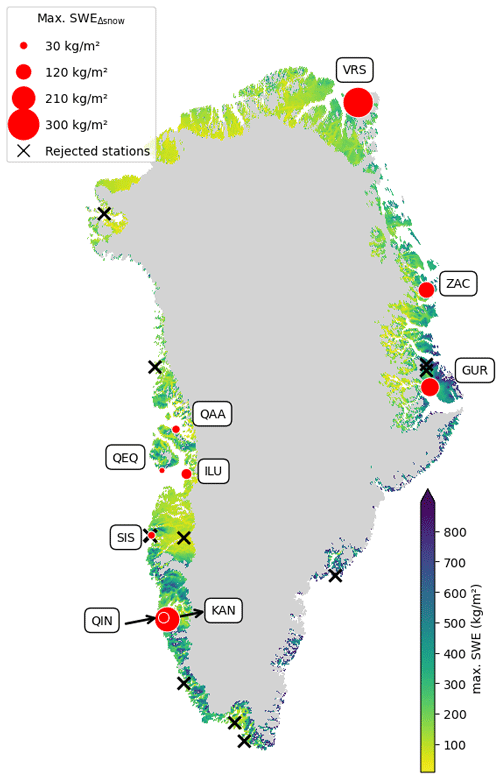
Figure 1Asiaq weather station locations with snow observations in coastal Greenland. The background map shows CARRA maximum SWE averaged over the period 1990–2022. The size of the red dots indicates the average maximum SWEΔsnow (Sect. 3.1) during the period with measurements.
To help interpretation of the measured values, we provide a basic climatology based on CARRA output for all locations that are part of the presented datasets (Table 1). The seasonal variables T2m (°C), modelled accumulated solid precipitation (mm w.e.), and wind speed (m s−1) have been calculated from CARRA output for the period 1990–2022. The fractional seasons (winter 1990 and 2020) at the beginning and end of the 1990–2022 period have not been considered in the calculation.
The 2 m air temperature from reanalysis is considerably lower at the three weather stations on the east coast compared to those on the west coast. Specifically, the climatology of VRS (the most northerly station) stands out with respect to temperature when compared to the other locations. VRS shows the lowest temperature in each season and the annual temperature amplitude is largest at this location (29.3 °C). Furthermore, VRS is the only location where the CARRA solid precipitation output in summer is still relatively high (81 mm w.e.). QIN and KAN, located at a much lower latitude, are the only other locations where the summer solid precipitation output is above 10 mm w.e. (11 and 33 mm w.e, respectively). Wind speed has a clear influence on the spatial variability of seasonal snow cover on a local scale. Greater small-scale spatial variability of HS is expected at locations with higher wind speeds (especially in winter when snow is easier to erode and drift). The CARRA average winter wind speeds at the selected nine locations range from 3.5 (at GUR) to 7.2 m s−1 (at ILU). Of all nine locations, the ZAC region is the most well-studied area in terms of spatio-temporal characteristics of snow cover (e.g. Kankaanpää et al., 2018; Pedersen et al., 2016).
2.2 Manual snow water equivalent observations (SWEOBS)
The manual snow water equivalent observations are used for the evaluation of Δsnow (see Sect. 3.1). These measurements were collected as part of the Greenland Ecosystem Monitoring programme (GEM) by Asiaq – Greenland Survey at KAN and Aarhus University at ZAC. Snow pit data have been collected from 2004. These snow pit measurements are known to generally have an uncertainty of lower than 10 % (López-Moreno et al., 2020). The dataset of snow pit measurements will hereafter be referred to as SWEOBS.
2.3 CARRA reanalysis dataset (SWECARRA and HSCARRA)
The Copernicus Arctic Regional Reanalysis (CARRA) (Schyberg et al., 2021) dataset uses HARMONIE as a surface scheme including a snow model. The atmospheric assimilation uses a three-dimensional variational data approach. Surface variables are assimilated using an optimal interpolation approach. In this study, we use the CARRA-West domain, which includes Greenland. CARRA is laterally forced with ERA5 and produces a 3-hourly output on a 2.5 km horizontal grid space. Snow output, as opposed to other variables like temperature, is not constrained by the assimilation of snow measurements from Asiaq and is purely a model product. Atmospheric variables observed at weather stations from Asiaq are assimilated. From the Greenland Ice Sheet, weather stations from GC-Net (Steffen et al., 1996; Steffen and Box, 2001) and PROMICE (Van As, 2011) are also part of the assimilation. Here we use two variables from the CARRA reanalysis datasets: the SWE variable, which will hereafter be referred to as SWECARRA, and the snow density variable. The snow density variable is used in combination with SWECARRA to calculate HS (which gives HSCARRA; see Sect. 3) for the period 1990–2023.
2.4 RACMO2.3p2
The Regional Atmospheric Climate Model (RACMO2) was developed by the Royal Netherlands Meteorological Institute (KNMI) (van Meijgaard et al., 2008). The polar version of this model, RACMO2.3p2, was developed to adequately simulate the evolution of surface mass balance over the ice sheets of Greenland, Antarctica, and other glaciated regions. In this study, we use the statistically downscaled product at 5.5 km resolution (Noël et al., 2019). RACMO2.3p2 is forced on a 3-hourly basis by ERA-40 (1958–1978), ERA-Interim (1979–1989), and ERA-5 (1990–2021). The topography in RACMO2.3p2 at 5.5 km spatial resolution is derived from the GIMP digital elevation model at 90 m downsampled to 5.5 km (Howat et al., 2014). As this atmospheric model does not include a snow simulation module, we estimate SWE values based on atmospheric output, as detailed in Sect. 3.2.
3.1 The Δsnow algorithm
The algorithm Δsnow (Winkler et al., 2021) is designed to estimate SWE using solely daily values of HS as input. Despite its simple input requirements, the basic layer model incorporates complex snow processes, such as compaction, melting, and drenching, based on the daily changes in HS. This approach enables the derivation of the hydrologically and climatologically more relevant SWE variable from the more widely available HS records. In our case, it facilitates the comparison of the climate model output from RACMO2.3p2 and HS observations at weather stations. Compaction is treated following the principles of Newtonian viscosity, and melting snow is distributed stepwise from top to bottom throughout the simulated layers of the snowpack. A detailed description of the physics of Δsnow can be found in Winkler et al. (2021). Previous evaluation attempts for Δsnow in Arctic and mountain regions in the Northern Hemisphere have shown promising results. The range of biases for Δsnow has been reported to be −15 % to +17.2 % (SWEmax) and −7.3 to 3.0 d (Monset), using eight datasets from different regions (Fontrodona-Bach et al., 2023). Winkler et al. (2021) have reported a bias of 0.3 kg m−2 and root-mean-square error (RMSE) of 36.3 kg m−2 for SWEmax. The output from Δsnow will hereafter be referred to as SWEΔsnow. We evaluate the performance of Δsnow with SWEOBS, giving the Pearson correlation coefficient (r), a measure of absolute error (RMSE), and the mean absolute percentage error (MAPE) as a measure of relative error.
3.2 Evaluation of climate models used in this study (CARRA/RACMO)
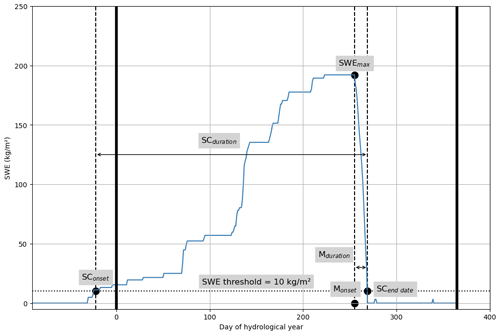
Both CARRA and RACMO2.3p2 output are evaluated using the SWEΔsnow dataset. We evaluate several snow indicators that we define in the following section (Fig. 2). For these snow indicators, we determine the Pearson correlation coefficient (r), p values (p) related to the statistical significance of the correlation coefficient, and RMSE for the correlation between SWECARRA/SWERACMO and SWEΔsnow. The model values are obtained using the nearest grid cells based on the coordinates of the nine selected locations with snow observations. The CARRA data were resampled from 3 h to daily time steps using mean values to match the observational data's temporal resolution. The data were also restructured per hydrological year (1 October–30 September), whereafter snow indicators (Fig. 2) for each hydrological year were calculated. Selected and processed SWE values based on RACMO output will, hereafter, be referred to as SWERACMO. To directly compare CARRA output with HSobs, we calculated HS from CARRA based on the SWE and snow density variables.
SWERACMO is estimated based on the variables available from the model.
This value is then corrected by adding the minimum value in the first hydrological year because the snow depth at the beginning of the first hydrological year is unknown. In the following years, the value of the last day of the previous hydrological year is the starting snow depth.
3.3 Analysis of spatio-temporal characteristics of seasonal snow cover
Since our objective is to analyse whether state-of-the-art regional climate models can be used to assess changes in seasonal snow cover that have relevance to the local ecosystems, we define six ecologically relevant snow indicators (Fig. 2).
To ensure we capture the beginning of the snow buildup, which sometimes starts before 1 October (e.g. at ZAC in 1998), we include the last 90 d of the previous hydrological year when calculating snow indicators. Below we give a summary of the indicators used.
-
Max. SWE (SWEmax). This is the largest SWE of a particular hydrological year, calculated with a rolling mean of 5 d. This rolling mean is used to reduce the impact of daily fluctuations and allows us to more accurately determine the peak SWE value within a season. We choose a window length of 5 d to remove misrepresentation of the snow cover end date due to daily variability, while at the same time not introducing unnecessary smoothing of the seasonal snow evolution (which would be the case with a longer window length) (the unit is kg m−2).
-
Melt onset (Monset). This is the corresponding day of the hydrological year with SWEmax. In the case of multiple days with the same SWEmax values, the last day with that value is chosen as Monset (the unit is the day of hydrological year).
-
Snow cover duration (SCduration). This is here defined as the longest continuous period of SWE above the threshold of 10 kg m−2 within a specific hydrological year, including 90 d before that hydrological year. SCduration is normally defined using a snow depth threshold (e.g. Notarnicola, 2022). Here we use a SWE threshold because it is a variable that can be calculated from all three datasets (the unit is the number of days).
-
Snow cover end date (SCend date). This is the last day of the longest continuous period of SWE above the threshold of 10 kg m−2 within a specific hydrological year, including 90 d before that hydrological year (the unit is the day of the hydrological year).
-
Snow cover onset (SConset). This is the first day of the longest continuous period of SWE above the threshold of 10 kg m−2 within a specific hydrological year, including 90 d before that hydrological year (the unit is the day of the hydrological year).
-
Melt-phase duration (Mduration). This is the length of the period between the melt onset and the snow cover end date (the unit is the number of days).
3.4 Trend analysis
In addition to using the calculated snow indicators to evaluate the climate model output, we also assess trends in the annual values of these indicators for locations with 5 or more years of measurements with the Mann–Kendall trend test. Trends will be indicated with Theil–Sen estimators and slopes and the intercept of the Kendall–Theil robust line. For further details, see Hussain and Mahmud (2019).
4.1 Evaluation of Δsnow
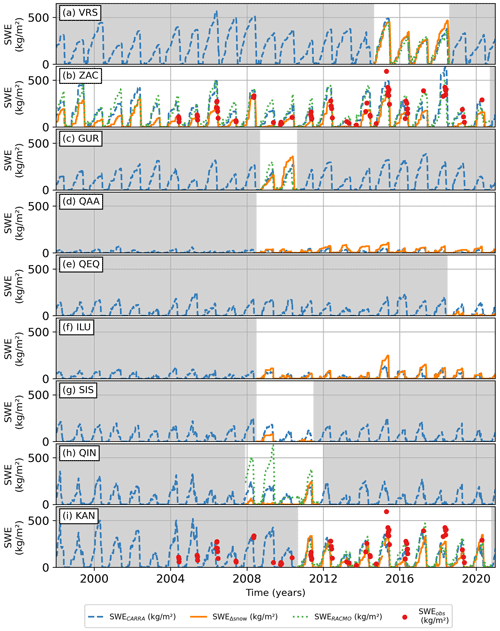
The output of the Δsnow model is evaluated with snow pit measurements at ZAC and KAN (Fig. 3). These measurements took place annually, with several measurements in each year, starting from 2000 at ZAC (see Fig. 4) and starting from 2013 at KAN. They provide us with a detailed understanding of the performance of Δsnow, which derives SWE values at these two locations relatively well (r=0.92 at ZAC and r=0.82 at KAN). This comparison is most robust at ZAC, where it is based on more data points (n=55) than at KAN (n=9). The discrepancies between Δsnow and snow pit measurements (RMSE = 43.10 kg m−2 at ZAC and RMSE = 115.51 kg m−2 at KAN) are particularly evident for higher SWE values (above 300 kg m−2) at both locations. Without more validation measurements, especially in these conditions with high SWE values, it is difficult to interpret the exceptionally large difference between Δsnow and the snow pit measurement at KAN in 2015 (where the measured SWE was 596 kg m−2). Most probably it can be explained by the tendency of Δsnow to underestimate SWE for higher values. However, considering the much higher relative bias compared to all other data points, measuring error can also not be excluded. The overall high correlation coefficients support our usage of Δsnow model values as a reference dataset for comparison with RACMO2.3p2 and CARRA.
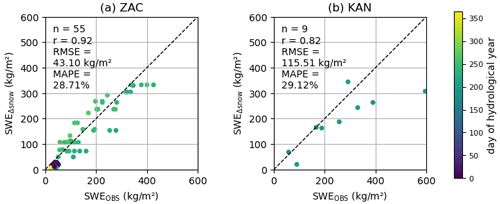
Figure 3Evaluation of SWEΔsnow with measured SWEOBS at locations ZAC (a) and KAN (b). The day of the hydrological year for each data point is indicated by the colour of the dot.
4.2 Evaluation of CARRA and RACMO2.3p2
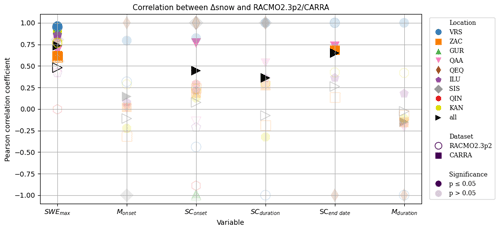
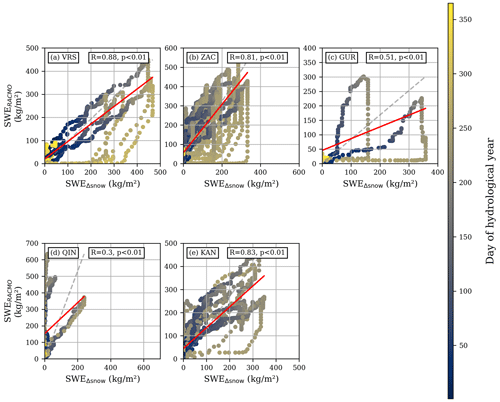
CARRA reanalysis and RACMO2.3p2 output are evaluated against Δsnow output using a daily correlation between these datasets (Fig. 5) and the calculated snow indicators (see Sect. 3.3) (Fig. 6). The length of the period with HSobs (and therefore Δsnow output) available for this evaluation ranges from only 2 years (at QEQ and GUR) to 24 years (at ZAC). The correlation between SWEΔsnow and SWECARRA is dependent on the location and varies between 0.44 and 0.90 (Fig. 5). We find the highest Pearson correlation coefficient (r) at VRS, GUR, and ZAC (r=0.87, 0.90, and 0.90, respectively, and p<0.01) and the lowest Pearson correlation coefficient at QEQ (r=0.44, p<0.01). In general, the Pearson correlation coefficients between SWECARRA and Δsnow are higher than the correlation coefficients between SWERACMO and Δsnow (Figs. 5 and 6). Correlation coefficients for SWEmax are 0.73 and 0.48 for CARRA and RACMO, respectively. SWERACMO shows a similar or worse match with SWEΔsnow when compared to SWECARRA. When looking at all locations together, there is no clear overestimation or underestimation from either CARRA or RACMO2.3p2 when compared with Δsnow. Instead, at some locations, the models show a clear overestimation of SWE values (at ZAC, KAN, QIN, SIS, and QEQ), while at other locations, the SWE values are underestimated (at ILU and QAA). In general, the bias of RACMO and CARRA has the same sign (positive or negative) at each location. We notice a seasonal pattern in the data (e.g. at ZAC and KOB): SWE values are underestimated at the beginning of the year by both CARRA and RACMO2.3p2, while later on in the season they are overestimated (Fig. 5).
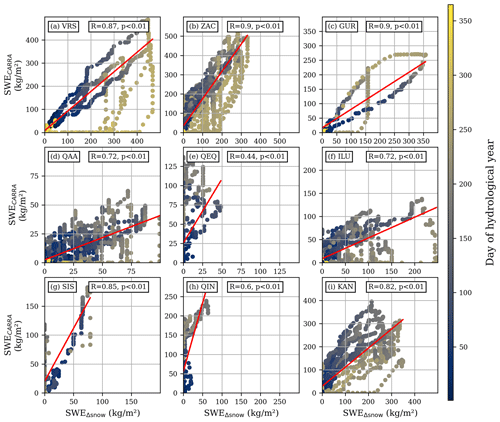
Figure 5Daily SWEΔsnow values against daily SWECARRA values for each location. The colour of the dots indicates the day of the hydrological year, and the red line indicates the slope and intercept of the correlation. HSΔsnow/HSCARRA and SWEΔsnow/SWERACMO plots can be found in Appendix A.
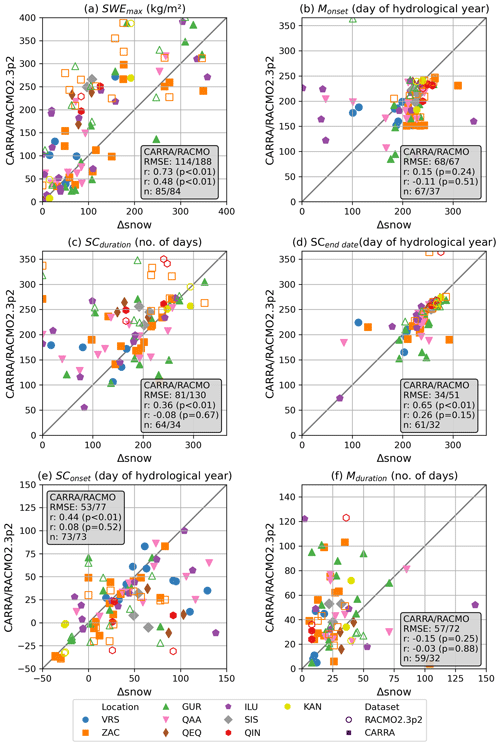
Figure 6Evaluation of the ability of CARRA and RACMO to simulate several snow indicators. Locations are identified with different colours and symbols. Open markers show values for RACMO calculated SWE output, while closed markers show values for CARRA reanalysis. Negative snow cover onset means snow cover onset before the start of the hydrological year (starting 1 October).
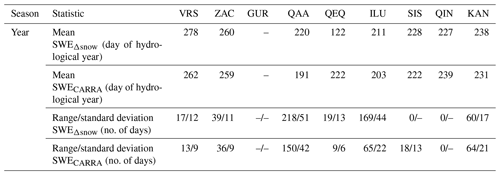
The three locations with the highest latitudes (at VRS, ZAC, and GUR) generally have more seasonal snow than those with lower latitudes (Figs. 4, 5). While some locations show a negative correlation for some snow indicators, these values are never statistically significant at the 95 % confidence level. For each snow indicator, there is a significant and positive correlation between Δsnow and CARRA, except for Monset and Mduration (Fig. 6). The range of different correlation coefficients per location is relatively narrow for SWEmax, while it is much wider for the other indicators (Fig. 7). RMSE values are highly dependent on the particular location. For example, a clear positive bias of SWE is present in both SWERACMO and SWECARRA for location ZAC (Fig. 4), and this bias is stronger in SWERACMO. This particular location contributes the most to the overall RMSE of 114 and 188 kg m−2 for CARRA and RACMO2.3p2, respectively, due to the clear overestimation in combination with the relatively large contribution to the overall number of data points. CARRA output matches particularly well with SWEΔsnow values for the indicators SWEmax and SCend date. SConset is underestimated by the climate models and reanalysis output, and the spread is generally higher. There is a clustering of SWEΔsnow SConset values around 0, indicating that snow cover often starts around the start of the hydrological year.
4.3 Analysis of spatiotemporal characteristics of seasonal snow cover
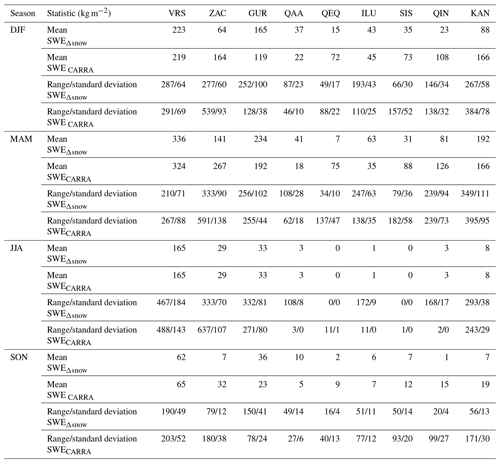
There is considerable spatial and temporal variability between the different locations (Fig. 4). Seasonal SWEmax values range from less than 50 kg m−2 to greater than 600 kg m−2. In general, the interannual variability from SWEΔsnow is also visible in the SWECARRA and SWERACMO datasets. However, the agreement between the datasets varies strongly from year to year and between the different locations. While most locations show realistic patterns related to the build-up and melt of seasonal snow cover, some exceptions are present in the dataset. The largest SWEmax values are observed in VRS (averaged 354 kg m−2 from SWEΔsnow), located in the northeast of Greenland. Figure 4 also shows that the buildup of snow cover starts before the start of the hydrological year in the locations VRS and GUR. The average SWEmax for all nine stations in Greenland, giving equal weight to each location, is 129 kg m−2 (highly variable, with a standard deviation of 106 kg m−2), which gives a first number of average SWE for Greenland's coastal regions based on observations.
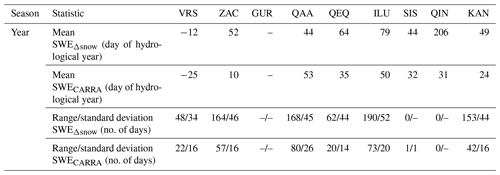
At the 95 % confidence level, the only statistically significant trends in our datasets are for Monset at location ZAC for SWERACMO (−8 d per decade, p=0.02) (Fig. 8). In the SWEOBS and SWECARRA datasets, these trends have a similar direction and magnitude (−8 d per decade, p=0.32 and −8 d per decade, p=0.18, respectively) but are not statistically significant at the 95 % confidence level. SWEmax is the snow indicator with the highest interannual variability (e.g. at ZAC there is a standard deviation of 99 kg m−2) in the period 1998–2020). This interannual variability increases in the last years of the period (2013–2020). In this period, the consistency between the different datasets decreases, which means that the model and reanalysis products have difficulty accurately representing this increased interannual variability in these years.
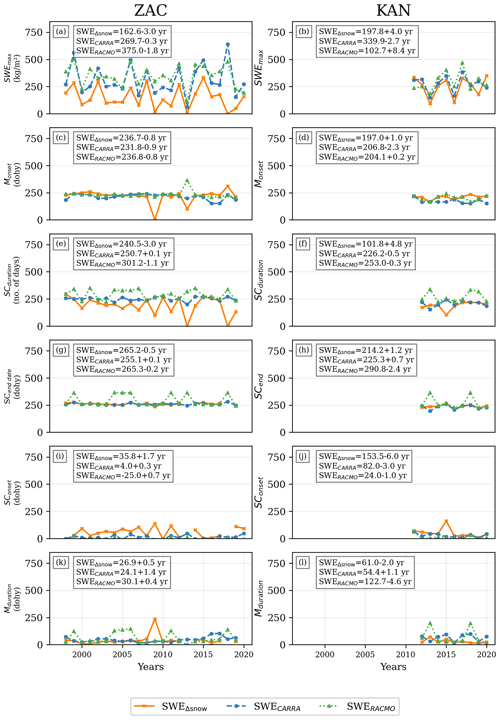
Figure 8Time series of snow indicators for the locations ZAC and KAN. Trend statistics from the Mann–Kendall non-parametric test, Theil–Sen's slope estimator, and the intercept of the Kendall–Theil robust line are displayed in the text box for each dataset. The year is abbreviated as “yr” and day of the hydrological year is abbreviated as “dohy”.
5.1 Model performance
One of the objectives of this study was to assess the performance of state-of-the-art climate models in simulating ecologically and climatologically relevant spatio-temporal characteristics of snow indicators. Our results have shown that CARRA reanalysis output is generally better suited for this purpose than RACMO2.3p2. As shown in Fig. 6, the performance of both products is dependent on the specific snow indicator and study site. Our results suggest that CARRA reanalysis can especially be a useful tool for studying spatio-temporal trends in SWEmax and SCend date, which have the highest correlation coefficients in our comparison with the SWEΔsnow values (0.73 and 0.65, respectively).
The comparison of HSCARRA or SWECARRA with snow observations as in our study is a rather novel approach, and a limited amount of other studies can be found with similar methodologies. Maniktala (2022) has compared CARRA reanalysis output with snow observations for three low-precipitation sites in Svalbard and found correlation coefficients of 0.74, 0.58, and 0.46; RMSE values (m) of 0.07, 0.14, and 0.08; and biases (m) of −0.06, −0.15, and −0.02 at the Hornsund, Ny-Ålesund, and Svalbard airport sites, respectively. The average of the nine correlation coefficients for the locations in coastal Greenland is 0.76 (with a minimum of 0.44 at QEQ and a maximum of 0.90 at ZAC and GUR) (Fig. 5) and is thus higher than for the Svalbard locations. Similar to what was reported for Svalbard, we notice generally higher correlation coefficients for areas with higher amounts of winter precipitation, which are mostly located on the east coast of Greenland. We suggest this is likely the main reason for the lower correlation between SWEΔsnow and RACMO2.3p2 and CARRA in some locations (e.g. at QEQ and QIN) as these mentioned locations have low average SWEmax values (38 and 20 kg m−2, respectively). The snow cover in areas with higher average SWEmax values is less sensitive to variability in solid precipitation and wind because the relative changes resulting from variability in these parameters are small at these sites. The higher correlation values in high-precipitation locations show potential for using CARRA reanalysis output in water balance studies.
While not directly comparing reanalysis output to measured snow data, Krampe et al. (2023) used ERA5 reanalysis to force the snow model Crocus (Vionnet et al., 2012) for the location VRS and concluded that Crocus has the potential to adequately represent snow depth evolution at this site. We have shown here that both RACMOv2.3 and CARRA reanalysis can simulate snow conditions in this region relatively well in the period 2014–2018 and seem to perform better than Crocus simulations forced with ERA5, as shown in Krampe et al. (2023). While we stress the need for context-specific validation, we suggest that using HSCARRA or SWECARRA directly can in some situations be a suitable alternative for snow model simulations forced with reanalysis data.
5.2 Drivers of spatial variability in seasonal snow cover
The seasonal snow cover datasets presented in this study are characterized by significant spatial and interannual variability of snow indicators, which have been quantitatively reported with descriptive statistics (see Appendix B). While the number of locations with snow observations in ice-free Greenland is limited, the locations used in this study cover a wide range of geographical and climatological conditions (see Table 1). These differences likely contribute to the spatial variability of the snow indicators, given the known influence of winter solid precipitation (Buus-Hinkler et al., 2006; Farinotti et al., 2010; Ide and Oguma, 2013; Kepski et al., 2017; Pedersen et al., 2018), winter temperature (McCabe and Wolock, 2010), wind variables, and radiation and heat fluxes on snow conditions (Mott et al., 2018). Temperature trends in the ice-free regions of Greenland are characterized by strong seasonal and regional variability (Hanna et al., 2012; Zhang et al., 2022). The differences in local climate are, apart from local influences like topography, largely governed by large-scale circulation patterns. For example, large-scale atmospheric circulation patterns most commonly advect moisture from the North Atlantic Ocean to the east coast of Greenland. In particular, eastern Greenland is located near the North Atlantic storm track. This is an important factor explaining higher rates of snowfall and thus enhanced seasonal snow cover along the east coast compared to the west coast (Hinkler et al., 2008). This effect can also be seen in our SWEOBS dataset, where each of the east coast locations has higher average SWEmax values than the west coast locations (except for KAN).
KAN is characterized by relatively high SWEmax values compared to other west coast locations. This highlights the large interregional variability in Greenlandic fjord systems. For example, QIN (located in proximity to KAN) is characterized by much smaller SWEmax values. However, this is based on a short period of snow measurements at QIN and a low correlation between the three datasets at this location. It should be noted that the QIN data should not be overinterpreted, as the weather station is not located ideally and the time series is only 4 years long with a gap of 1 year. The QIN location is more exposed to southerly weather, and it is located below a steep rock wall. We still decided to include this location in our selection of weather stations as it highlights smaller-scale spatial variability.
One advantage that any model (and in particular the CARRA reanalysis product) has over point-based measurements is the smoothed representation of reality. Given the fact that we know that snow depth and SWE have high spatial variability on small spatial scales, the 2.5 km by 2.5 km resolution from CARRA is for some applications more useful than a point-based measurement. For example, there might be considerable variation in SCend date within a 2.5 by 2.5 km area due to topographical differences. The relatively high correlation between SCend date based on SWEΔsnow and SWECARRA (0.65, p<0.01, Fig. 6) might indicate that the measured SCend date is an accurate representation of the SCend date in the immediate surroundings of the weather station, which is in line with what is reported by the Greenland Ecosystem Monitoring Project (Christensen and Arndal, 2023). Even though the interannual variability of Monset at ZAC is high (standard deviation = 35 d in SWEOBS), spatial patterns are consistent from year to year (Pedersen et al., 2016). Similarly, at KAN the wind directions and the topography cause highly heterogeneous patterns of snow accumulation every year (Myreng et al., 2020). In general, variability in local-scale snow conditions is mainly driven by topographical variability (Dobrowski, 2011).
While increased poleward moisture transport from lower latitudes certainly plays a role, reductions in sea ice that allow greater evaporation from the ocean surface have been identified as the key driver for increased Arctic precipitation (Bintanja and Selten, 2014; Kopec et al., 2016). Due to its proximity to areas characterized by relatively high fractional sea ice cover, it is expected that decreasing sea ice will enhance snow accumulation in northeastern Greenland (Bintanja and Selten, 2014). Considering the locations of the weather stations used in this study, it is likely that the east coast stations are more susceptible to sea ice variability and trends. A smaller sea ice fraction over the Greenland Sea allows cyclones to move northwards, which causes more precipitation at higher latitudes (Sellevold et al., 2022).
On a local scale, sea ice has recently been indicated as an important driver of the climate at ZAC (Shahi et al., 2023). Specifically, a low sea ice fraction in the Greenland Sea has been directly linked with more solid precipitation in the region in all seasons except summer. This confirms that sea ice variability influences seasonal snow cover variability at ZAC. We further hypothesize that sea ice variability in Hudson Bay could influence seasonal snow cover in northwestern Greenland as it is known to influence the coastal climate in that region (Ballinger et al., 2020). Similarly, variability in the occurrence and size of polynyas in the Arctic Ocean could explain part of the relatively high seasonal snow depth values we observe at location VRS. Especially when compared to seasonal snow cover at other places in northern Greenland (cf. Pedersen et al., 2016), this east coast location has a relatively high HS and SWE output. While it is known that enhanced evaporation over polynyas can lead to increased snowfall over adjacent coastlines (Schneider and Budeus 1997; Maqueda et al., 2004), the exact strength of the mechanism has never been quantified. Here, we hypothesize that spatio-temporal characteristics of the Northeast Water Polynya could be an important factor that influences the enhanced seasonal snow cover at VRS.
One of the key spatial characteristics we reported is enhanced seasonal snow cover at higher latitudes in coastal Greenland, which implies more snowfall at higher latitudes. This can mostly be explained by the fact that the east coast locations in our dataset have a higher latitude than the west coast locations. Therefore, the reported latitudinal trend in seasonal snow cover could also be related to the fact that the east coast receives more snowfall than the west coast.
5.3 Temporal variability, trends, and ecosystem implications
Generally, in the Northern Hemisphere, snow cover duration and snow cover extent have been decreasing over the last 40 years (Box et al., 2019; Brown and Robinson, 2011; Meredith et al., 2019), but changes on a local scale do not indicate clear trends (Buchelt et al., 2022). In the future, climate models generally predict a further decrease in SWEmax and SCduration for southern Greenland. For northern Greenland, models predict a slightly higher SWEmax, later Monset, and longer Mduration (Hinkler et al., 2008). In global mountain regions, a negative trend of −3.6 % snow cover extent and −15.1 d ± 11.6 d SCduration has been reported over 38 years based on a combination of satellite data and model output (Notarnicola, 2022). This study, similar to others (e.g. Pedersen et al., 2016), does also not indicate clear past trends in any of the snow indicators (Fig. 8). The only exception to this statement is earlier snowmelt occurring at ZAC; however, this trend is only significant for the SWERACMO dataset (−8 d per decade, p=0.02). Earlier snowmelt at ZAC could significantly alter tundra vegetation, as snowmelt is an important driver of tundra spring phenology (Assmann et al., 2019). Earlier snowmelt occurring at ZAC has been reported by Kankaanpää et al. (2018), who also reported earlier snowmelt in the period 1998–2014. They also stated a less clear pattern during the second part of their study period (2006–2014), which fits with our results. In the same study, it was reported that locations with an earlier snow cover end date show stronger trends in melt onset, whereas locations with a later snow cover end date show more variable trends in melt onset (Kankaanpää et al., 2018). The variability of seasonal snow cover is generally adequately explained by changes in the climate system (Thackeray et al., 2019). Long-term changes in snow cover characteristics can significantly influence permafrost (Callaghan et al., 2012). Snow–permafrost interaction is important for several of the locations in our study, as many are characterized by permafrost occurrence. SIS and ILU have discontinuous permafrost, whereas the others (except QIN and KAN) have continuous permafrost (Christiansen and Humlum, 2000). The snow indicators SConset, SCend date, and SCduration are all particularly relevant for permafrost-related processes as they influence the ground thermal regime (Callaghan et al., 2012). For example, a decreasing SCduration could increase permafrost thaw, as in snow-free conditions the sensible heat flux becomes an energy sink during most of the season (Lund et al., 2017). Shorter SCduration can in some areas with enough soil moisture increase plant productivity and carbon capture in areas with enough soil moisture (Callaghan et al., 2012); however, air temperature has also been shown to be an important driver for the length of the growing season (Kelsey et al., 2021). These vegetation–snow interactions remain complex and species-dependent and are still not fully understood.
5.4 Limitations
While CARRA reanalysis has SWE values available as a model output, this output is not available from RACMO2.3p2. Future versions of RACMO will directly have output available from an integrated snow model. We have chosen to include RACMO2.3p2 in this comparing exercise to quantify the added value of a high-resolution reanalysis product such as CARRA, as opposed to using atmospheric models without an integrated snow scheme.
We have presented a first insight into spatio-temporal characteristics of seasonal snow cover in Greenland's coastal regions for the period 1997–2021. The conversion of the newly presented quality-controlled HSobs dataset to SWEΔsnow has shown promising results when tested against SWEobs from ZAC and KAN (r=0.92 and r=0.82, respectively).
We have shown that the high-resolution reanalysis dataset CARRA performed better than the atmospheric climate model RACMOv2.3 when it comes to simulating spatio-temporal characteristics of ecologically and climatologically relevant snow indicators in the ice-free regions of coastal Greenland. CARRA is particularly successful in simulating the snow indicators SWEmax and SCend date (correlation coefficients are 0.73 and 0.65, respectively).
Our results underscore the potential of directly using HS and SWE output from reanalysis products for detailed snow studies, especially in regions with high precipitation amounts where the correlation between HSCARRA and HSΔsnow was highest. High-resolution reanalysis products like CARRA have the additional benefit that they can capture local-scale snow variability. In contrast, point-based measurements do not provide information about this local-scale variability, which can be significant in the complex topographical settings of the coastal regions of Greenland. While the observations presented in this study are a much-needed addition to the available snow cover data in the remote Arctic region, we also emphasize the need for extending upon current monitoring activities, particularly given the broad scale of climatic and geographical conditions present along Greenland's coasts.
Significant spatial and interannual variability has been found in all three datasets. These findings highlight the wide range of geographical and climatological conditions present along the ice-free regions of the Greenlandic coast. The spatial variability in snow conditions also exists on a smaller spatial scale, as highlighted by the differences in values of snow indicators between QIN and KAN. In SWEΔsnow, as well as in SWECARRA and SWERACMO, higher SWEmax values were found on the east coast of Greenland. Given our chosen station locations, this coincides with the fact that higher SWEmax values are found at higher latitudes because the locations on the east coast have higher latitudes compared to those on the west coast. We hypothesized that the higher SWEmax values on the east coast of Greenland compared to the west coast can be attributed to its proximity to the North Atlantic storm track and large-scale atmospheric circulation patterns.
Even though large-scale studies have indicated changing snow conditions in the Arctic, we did not find many significant trends in our time series analysis of the snow indicators for Greenland's coastal regions. The only statistically significant trend (at the 95 % confidence level) was an earlier occurrence of melt onset at ZAC based on the SWERACMO dataset. The earlier melt onset at ZAC is in agreement with previous studies in that region.
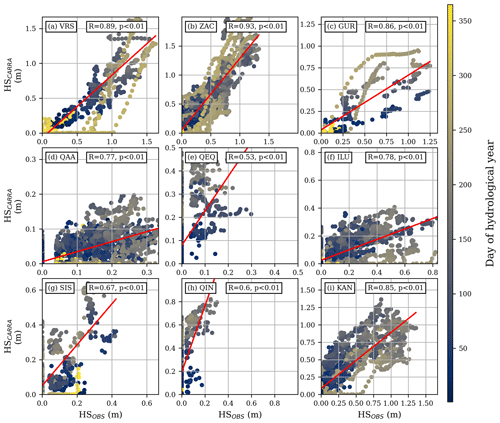
Figure A1Daily HSΔsnow values against daily HSCARRA values for each location. The colour of the dots indicates the day of the hydrological year, and the red line indicates the slope and intercept of the correlation.
The Python code used for producing the figures is available upon request from the first author.
Output from CARRA can be downloaded from the Copernicus Climate Data Store (https://cds.climate.copernicus.eu/datasets/reanalysis-carra-single-levels, Schyberg et al., 2024). Output from RACMO2.3p2 is available upon request from the Institute of Marine and Atmospheric Research (IMAU). Currently, the snow data from Asiaq – Greenland Survey cannot be made publicly available. The data have been shared with the reviewers of this paper.
JvdS, JA, and WS were involved in the study design, which was carried out by JvdS. JvdS performed the data analysis and was sometimes supported by TS. Data curation was done by KL. JvdS prepared the manuscript with contributions from all co-authors.
The contact author has declared that none of the authors has any competing interests.
Publisher's note: Copernicus Publications remains neutral with regard to jurisdictional claims made in the text, published maps, institutional affiliations, or any other geographical representation in this paper. While Copernicus Publications makes every effort to include appropriate place names, the final responsibility lies with the authors.
This article has been written as part of the research projects Snow2Rain and Snow2School. AI tools were sporadically used as an assisting tool during the data analysis conducted for this paper.
This research has been supported by the University of Graz; the Österreichische Agentur für Internationale Mobilität und Kooperation in Bildung, Wissenschaft und Forschung (Sparkling Science 2.0); and the Austrian Academy of Sciences, ÖAW-ESS Call 2018.
This paper was edited by Masashi Niwano and reviewed by two anonymous referees.
Allchin, M. I. and Déry, S. J.: The Climatological Context of Trends in the Onset of Northern Hemisphere Seasonal Snow Cover, 1972–2017, J. Geophys. Res.-Atmos., 125, e2019JD032367, https://doi.org/10.1029/2019JD032367, 2020.
AMAP: Snow, Water, Ice and Permafrost in the Arctic (SWIPA): Climate Change and the Cryosphere, xii + 538 pp., https://www.amap.no/documents/doc/snow-water-ice-and-permafrost-in-the-arctic-swipa-climate-change-and-the-cryosphere/743 (last access: 9 December 2024), 2011.
Assmann, J. J., Myers‐Smith, I. H., Phillimore, A. B., Bjorkman, A. D., Ennos, R. E., Prevéy, J. S., Henry, G. H. R., Schmidt, N. M., and Hollister, R. D.: Local snow melt and temperature—but not regional sea ice—explain variation in spring phenology in coastal Arctic tundra, Glob. Change Biol., 25, 2258–2274, https://doi.org/10.1111/gcb.14639, 2019.
Ballinger, T. J., Hanna, E., Hall, R. J., Carr, J. R., Brasher, S., Osterberg, E. C., Cappelen, J., Tedesco, M., Ding, Q., and Mernild, S. H.: The role of blocking circulation and emerging open water feedbacks on Greenland cold-season air temperature variability over the last century, Int. J. Climatol., 41, E2778–E2800, https://doi.org/10.1002/joc.6879, 2020.
Bintanja, R. and Selten, F. M.: Future increases in Arctic precipitation linked to local evaporation and sea-ice retreat, Nature, 509, 479–482, https://doi.org/10.1038/nature13259, 2014.
Bokhorst, S., Pedersen, S. H., Brucker, L., Anisimov, O., Bjerke, J. W., Brown, R. D., Ehrich, D., Essery, R. L. H., Heilig, A., Ingvander, S., Johansson, C., Johansson, M., Jónsdóttir, I. S., Inga, N., Luojus, K., Macelloni, G., Mariash, H., McLennan, D., Rosqvist, G. N., Sato, A., Savela, H., Schneebeli, M., Sokolov, A., Sokratov, S. A., Terzago, S., Vikhamar-Schuler, D., Williamson, S., Qiu, Y., and Callaghan, T. V.: Changing Arctic snow cover: A review of recent developments and assessment of future needs for observations, modelling, and impacts, Ambio, 45, 516–537, https://doi.org/10.1007/s13280-016-0770-0, 2016.
Bonsoms, J., Oliva, M., Alonso-González, E., Revuelto, J., and López-Moreno, J. I.: Impact of climate change on snowpack dynamics in coastal Central-Western Greenland, Sci. Total Environ., 913, 169616, https://doi.org/10.1016/j.scitotenv.2023.169616, 2024.
Box, J. E., Colgan, W. T., Christensen, T. R., Schmidt, N. M., Lund, M., Parmentier, F.-J. W., Brown, R., Bhatt, U. S., Euskirchen, E. S., Romanovsky, V. E., Walsh, J. E., Overland, J. E., Wang, M., Corell, R. W., Meier, W. N., Wouters, B., Mernild, S., Mård, J., Pawlak, J., and Olsen, M. S.: Key indicators of Arctic climate change: 1971–2017, Environ. Res. Lett., 14, 045010, https://doi.org/10.1088/1748-9326/aafc1b, 2019.
Brown, R. D. and Robinson, D. A.: Northern Hemisphere spring snow cover variability and change over 1922–2010 including an assessment of uncertainty, The Cryosphere, 5, 219–229, https://doi.org/10.5194/tc-5-219-2011, 2011.
Buchelt, S., Skov, K., Rasmussen, K. K., and Ullmann, T.: Sentinel-1 time series for mapping snow cover depletion and timing of snowmelt in Arctic periglacial environments: case study from Zackenberg and Kobbefjord, Greenland, The Cryosphere, 16, 625–646, https://doi.org/10.5194/tc-16-625-2022, 2022.
Buus-Hinkler, J., Hansen, B. U., Tamstorf, M. P., and Pedersen, S. B.: Snow-vegetation relations in a High Arctic ecosystem: Inter-annual variability inferred from new monitoring and modeling concepts, Remote Sens. Environ., 105, 237–247, https://doi.org/10.1016/j.rse.2006.06.016, 2006.
Callaghan, T. V., Johansson, M., Brown, R. D., Groisman, P. Y., Labba, N., Radionov, V., Bradley, R. S., Blangy, S., Bulygina, O. N., Christensen, T. R., Colman, J. E., Essery, R. L. H., Forbes, B. C., Forchhammer, M. C., Golubev, V. N., Honrath, R. E., Juday, G. P., Meshcherskaya, A. V., Phoenix, G. K., Pomeroy, J., Rautio, A., Robinson, D. A., Schmidt, N. M., Serreze, M. C., Shevchenko, V. P., Shiklomanov, A. I., Shmakin, A. B., Sturm, M., Woo, M., and Wood, E. F.: Multiple Effects of Changes in Arctic Snow Cover, Ambio, 40, 32–45, https://doi.org/10.1007/s13280-011-0213-x, 2012.
Campbell Scientific: Product Manual: SR50A-Series Sonic Ranging Sensors, https://s.campbellsci.com/documents/cr/manuals/sr50a.pdf (last access: 9 December 2024), 2021.
Christensen, T. R. and Arndal, M. F.: Greenland Ecosystem Monitoring program Report Cards 2022, Zenodo, https://doi.org/10.5281/zenodo.8141553, 2023.
Christiansen, H. H. and Humlum, O.: “Permafrost”, Topografisk Atlas Grønland, Det Kongelige Danske Geografiske Selskab og Kort & Matrikelstyrelsen, 2000.
Cohen, J.: Snow cover and climate, Weather, 49, 150–156, https://doi.org/10.1002/j.1477-8696.1994.tb05997.x, 1994.
Derksen, C. and Mudryk, L.: Assessment of Arctic seasonal snow cover rates of change, The Cryosphere, 17, 1431–1443, https://doi.org/10.5194/tc-17-1431-2023, 2023.
Derksen, C., Richter-Menge, J., Overland, J. E., Brown, R., Mudryk, L., Luojus, K., and Jeffries, M.: Snow [in Arctic Report Card 2015], NOAA, https://arctic.noaa.gov/report-card/report-card-2015/ (last access: 9 December 2024), 2015.
Diro, G. T., Sushama, L., and Huziy, O.: Snow-atmosphere coupling and its impact on temperature variability and extremes over North America, Clim. Dynam., 50, 2993–3007, https://doi.org/10.1007/s00382-017-3788-5, 2018.
Dobrowski, S. Z.: A climatic basis for microrefugia: the influence of terrain on climate, Glob. Change Biol., 17, 1022–1035, https://doi.org/10.1111/j.1365-2486.2010.02263.x, 2011.
Farinotti, D., Magnusson, J., Huss, M., and Bauder, A.: Snow accumulation distribution inferred from time‐lapse photography and simple modelling, Hydrol. Process., 24, 2087–2097, https://doi.org/10.1002/hyp.7629, 2010.
Fontrodona-Bach, A., Schaefli, B., Woods, R., Teuling, A. J., and Larsen, J. R.: NH-SWE: Northern Hemisphere Snow Water Equivalent dataset based on in situ snow depth time series, Earth Syst. Sci. Data, 15, 2577–2599, https://doi.org/10.5194/essd-15-2577-2023, 2023.
Foster, J. L., Cohen, J., Robinson, D. A., and Estilow, T. W.: A look at the date of snowmelt and correlations with the Arctic Oscillation, Ann. Glaciol., 54, 196–204, https://doi.org/10.3189/2013AoG62A090, 2013.
Gutzler, D. S. and Rosen, R. D.: Interannual Variability of Wintertime Snow Cover across the Northern Hemisphere, J. Climate, 5, 1441–1447, https://doi.org/10.1175/1520-0442(1992)005<1441:IVOWSC>2.0.CO;2, 1992.
Hanna, E., Mernild, S. H., Cappelen, J., and Steffen, K.: Recent warming in Greenland in a long-term instrumental (1881–2012) climatic context: I. Evaluation of surface air temperature records, Environ. Res. Lett., 7, 045404, https://doi.org/10.1088/1748-9326/7/4/045404, 2012.
Henderson, G. R., Peings, Y., Furtado, J. C., and Kushner, P. J.: Snow–atmosphere coupling in the Northern Hemisphere, Nat. Clim. Change, 8, 954–963, https://doi.org/10.1038/s41558-018-0295-6, 2018.
Hinkler, J., Hansen, B. U., Tamstorf, M. P., Sigsgaard, C., and Petersen, D.: Snow and Snow-Cover in Central Northeast Greenland, in: Advances in Ecological Research, vol. 40, Elsevier, 175–195, https://doi.org/10.1016/S0065-2504(07)00008-6, 2008.
Howat, I. M., Negrete, A., and Smith, B. E.: The Greenland Ice Mapping Project (GIMP) land classification and surface elevation data sets, The Cryosphere, 8, 1509–1518, https://doi.org/10.5194/tc-8-1509-2014, 2014.
Hussain, M. M. and Mahmud, I.: pyMannKendall: a python package for non parametric Mann Kendall family of trend tests, Journal of Open Source Software, 3, 1556, https://doi.org/10.21105/joss.01556, 2019.
Ide, R. and Oguma, H.: A cost-effective monitoring method using digital time-lapse cameras for detecting temporal and spatial variations of snowmelt and vegetation phenology in alpine ecosystems, Ecol. Inform., 16, 25–34, https://doi.org/10.1016/j.ecoinf.2013.04.003, 2013.
Kankaanpää, T., Skov, K., Abrego, N., Lund, M., Schmidt, N. M., and Roslin, T.: Spatiotemporal snowmelt patterns within a high Arctic landscape, with implications for flora and fauna, Arct. Antarct. Alp. Res., 50, 1–17, https://doi.org/10.1080/15230430.2017.1415624, 2018.
Kelsey, K. C., Pedersen, S. H., Leffler, A. J., Sexton, J. O., Feng, M., and Welker, J. M.: Winter snow and spring temperature have differential effects on vegetation phenology and productivity across Arctic plant communities, Glob. Change Biol., 27, 1572–1586, https://doi.org/10.1111/gcb.15505, 2021.
Kępski, D., Luks, B., Migała, K., Wawrzyniak, T., Westermann, S., and Wojtuń, B.: Terrestrial Remote Sensing of Snowmelt in a Diverse High-Arctic Tundra Environment Using Time-Lapse Imagery, Remote Sensing, 9, 733, https://doi.org/10.3390/rs9070733, 2017.
Kopec, B. G., Feng, X., Michel, F. A., and Posmentier, E. S.: Influence of sea ice on Arctic precipitation, P. Natl. Acad. Sci. USA, 113, 46–51, https://doi.org/10.1073/pnas.1504633113, 2016.
Krampe, D., Kauker, F., Dumont, M., and Herber, A.: Snow and meteorological conditions at Villum Research Station, Northeast Greenland: on the adequacy of using atmospheric reanalysis for detailed snow simulations, Front. Earth Sci., 11, 1053918, https://doi.org/10.3389/feart.2023.1053918, 2023.
López‐Moreno, J., Leppänen, L., Luks, B., Holko, L., Picard, G., Sanmiguel-Vallelado, A., Alonso-González, E., Finger, D., Arslan, A., Gillemot, K., Sensoy, A., Sorman, A., Cansaran Ertaş, M., Fassnacht, S., Fierz, C., and Marty, C.: Intercomparison of measurements of bulk snow density and water equivalent of snow cover with snow core samples: Instrumental bias and variability induced by observers, Hydrol. Process., 34, 3120–3133, https://doi.org/10.1002/hyp.13785, 2020.
Lund, M., Stiegler, C., Abermann, J., Citterio, M., Hansen, B. U., and van As, D.: Spatiotemporal variability in surface energy balance across tundra, snow and ice in Greenland, Ambio, 46, 81–93, https://doi.org/10.1007/s13280-016-0867-5, 2017.
Maniktala, D.: Analysing Seasonal Snow Cover Trends and Patterns on Svalbard, Master Thesis, Department of Earth Sciences, Uppsala University, Uppsala, https://www.diva-portal.org/smash/record.jsf?pid=diva2%3A1689663&dswid=-1666 (last access: 9 December 2024), 2022.
McCabe, G. J. and Wolock, D. M.: Long-term variability in Northern Hemisphere snow cover and associations with warmer winters, Climatic Change, 99, 141–153, https://doi.org/10.1007/s10584-009-9675-2, 2010.
Meredith, M., Sommerkorn, M., Cassotta, S., Derksen, C., Ekaykin, A. , Hollowed, A., Kofinas, G., Mackintosh, A., Melbourne-Thomas, J., Muelbert, M. M. C., Ottersen, G., Pritchard, H., and Schuur, E. A. G.: Polar Regions, in: IPCC Special Report on the Ocean and Cryosphere in a Changing Climate, edited by: Pörtner, H.-O., Roberts, D. C., Masson-Delmotte, V., Zhai, P., Tignor, M., Poloczanska, E., Mintenbeck, K., Alegría, A., Nicolai, M., Okem, A., Petzold, J., Rama B., and Weyer, N. M., in press, https://www.ipcc.ch/site/assets/uploads/sites/3/2019/11/07_SROCC_Ch03_FINAL.pdf (last access: 9 December 2024), 2019.
Mott, R., Vionnet, V., and Grünewald, T.: The Seasonal Snow Cover Dynamics: Review on Wind-Driven Coupling Processes, Front. Earth Sci., 6, 197, https://doi.org/10.3389/feart.2018.00197, 2018.
Morales Maqueda, M. A., Willmott, A. J., and Biggs, N. R. T.: Polynya Dynamics: a Review of Observations and Modeling, Rev. Geophys., 42, 2002RG000116, https://doi.org/10.1029/2002RG000116, 2004
Myreng, S. M., Rasmussen, K. K., and Hass., A. E.: NuukBasic Snow Survey 2020, Data collection, post processing and results, Technical Report, Asiaq-Greenland Survey, Nuuk, Greenland, 2020.
Niittynen, P. and Luoto, M.: The importance of snow in species distribution models of arctic vegetation, Ecography, 41, 1024–1037, https://doi.org/10.1111/ecog.03348, 2018.
Noël, B., van de Berg, W. J., Lhermitte, S., and van den Broeke, M. R.: Rapid ablation zone expansion amplifies north Greenland mass loss, Science Advances, 5, 2–11, https://doi.org/10.1126/sciadv.aaw0123, 2019.
Notarnicola, C.: Overall negative trends for snow cover extent and duration in global mountain regions over 1982–2020, Sci. Rep., 12, 13731, https://doi.org/10.1038/s41598-022-16743-w, 2022.
Pedersen, S. H., Tamstorf, M. P., Abermann, J., Westergaard-Nielsen, A., Lund, M., Skov, K., Sigsgaard, C., Mylius, M. R., Hansen, B. U., Liston, G. E., and Schmidt, N. M.: Spatiotemporal characteristics of seasonal snow cover in Northeast Greenland from in situ observations, Arct. Antarct. Alpine Res., 48, 653–671, https://doi.org/10.1657/AAAR0016-028, 2016.
Pedersen, S. H., Liston, G. E., Tamstorf, M. P., Abermann, J., Lund, M., and Schmidt, N. M.: Quantifying snow controls on vegetation greenness, Ecosphere, 9, 1–21, https://doi.org/10.1002/ecs2.2309, 2018.
Preece, J. R., Mote, T. L., Cohen, J., Wachowicz, L. J., Knox, J. A., Tedesco, M., and Kooperman, G. J.: Summer atmospheric circulation over Greenland in response to Arctic amplification and diminished spring snow cover, Nat. Commun., 14, 3759, https://doi.org/10.1038/s41467-023-39466-6, 2023.
Pulliainen, J., Luojus, K., Derksen, C., Mudryk, L., Lemmetyinen, J., Salminen, M., Ikonen, J., Takala, M., Cohen, J., Smolander, T., and Norberg, J.: Patterns and trends of Northern Hemisphere snow mass from 1980 to 2018, Nature, 581, 294–298, https://doi.org/10.1038/s41586-020-2258-0, 2020.
Schneider, W. and Budeus, G.: Summary of the Northeast Water Polynya formation and development (Greenland Sea), J. Marine Syst., 10, 107–122, 1997.
Schyberg, H., Yang, X., Køltzow, M. A. Ø., Amstrup, B., Bakketun, Å., Bazile, E., Bojarova, J., Box, J. E., Dahlgren, P., Hagelin, S., Homleid, M., Horányi, A., Høyer, J., Johansson, Å., Killie, M. A., Körnich, H., Le Moigne, P., Lindskog, M., Manninen, T., Nielsen Englyst, P., Nielsen, K. P., Olsson, E., Palmason, B., Peralta Aros, C., Randriamampianina, R., Samuelsson, P., Stappers, R., Støylen, E., Thorsteinsson, S., Valkonen, T., and Wang, Z. Q.: Arctic regional reanalysis on single levels from 1991 to present, Copernicus Climate Change Service (C3S) Climate Data Store (CDS) [data set], https://doi.org/10.24381/cds.713858f6, 2021.
Schyberg, H., Yang, X., Køltzow, M. A. Ø., Amstrup, B., Bakketun, Å., Bazile, E., Bojarova, J., Box, J. E., Dahlgren, P., Hagelin, S., Homleid, M., Horányi, A., Høyer, J., Johansson, Å., Killie, M. A., Körnich, H., Le Moigne, P., Lindskog, M., Manninen, T., Nielsen Englyst, P., Nielsen, K. P., Olsson, E., Palmason, B., Peralta Aros, C., Randriamampianina, R., Samuelsson, P., Stappers, R., Støylen, E., Thorsteinsson, S., Valkonen, T., and Wang, Z. Q.: Arctic regional reanalysis on single levels from 1991 to present, Copernicus Climate Change Service (C3S) Climate Data Store (CDS) [data set], https://cds.climate.copernicus.eu/datasets/reanalysis-carra-single-levels, last access: 2 December 2024.
Sellevold, R., Lenaerts, J. T. M., and Vizcaino, M.: Influence of Arctic sea-ice loss on the Greenland ice sheet climate, Clim. Dynam., 58, 179–193, https://doi.org/10.1007/s00382-021-05897-4, 2022.
Shahi, S., Abermann, J., Silva, T., Langley, K., Larsen, S. H., Mastepanov, M., and Schöner, W.: The importance of regional sea-ice variability for the coastal climate and near-surface temperature gradients in Northeast Greenland, Weather Clim. Dynam., 4, 747–771, https://doi.org/10.5194/wcd-4-747-2023, 2023.
Steffen, K. and Box, J.: Surface climatology of the Greenland Ice Sheet: Greenland Climate Network 1995–1999, J. Geophys. Res., 106, 33951–33964, https://doi.org/10.1029/2001JD900161, 2001.
Steffen, K. and Box, J.: Surface climatology of the Greenland Ice Sheet: Greenland Climate Network 1995–1999, J. Geophys. Res., 106, 33951–33964, https://doi.org/10.1029/2001JD900161, 2001.
Thackeray, C. W., Derksen, C., Fletcher, C. G., and Hall, A.: Snow and Climate: Feedbacks, Drivers, and Indices of Change, Current Climate Change Reports, 5, 322–333, https://doi.org/10.1007/s40641-019-00143-w, 2019.
Van As, D.: Warming, glacier melt and surface energy budget from weather station observations in the melville bay region of northwest greenland, J. Glaciol., 57, 208–220, https://doi.org/10.3189/002214311796405898, 2011.
van Meijgaard, E., van Ulft, B., van de Berg, W. J., Bosveld, F. C., van den Hurk, B., Lenderink, G., and Pier Siebesma, A.: The KNMI regional atmospheric climate model RACMO version 2.1, Technical report; TR – 302, 43 pp., https://cdn.knmi.nl/knmi/pdf/bibliotheek/knmipubTR/TR302.pdf (last access: 9 December 2024), 2008.
Vionnet, V., Brun, E., Morin, S., Boone, A., Faroux, S., Le Moigne, P., Martin, E., and Willemet, J.-M.: The detailed snowpack scheme Crocus and its implementation in SURFEX v7.2, Geosci. Model Dev., 5, 773–791, https://doi.org/10.5194/gmd-5-773-2012, 2012.
Walker, A. D. A., Halfpenny, J. C., Walker, M. D., Wessman, C. A., Walker, D. A., Halfpenny, J. C., Walker, M. D., and Wessman, C. A.: Long-term Studies of Snow- Vegetation Interactions A hierarchic geographic information system helps examine lin, BioScience, 43, 287–301, 1993.
Warren, S. G.: Optical properties of snow, Rev. Geophys., 20, 67–89, https://doi.org/10.1029/RG020i001p00067, 1982.
Winkler, M., Schellander, H., and Gruber, S.: Snow water equivalents exclusively from snow depths and their temporal changes: the Δsnow model, Hydrol. Earth Syst. Sci., 25, 1165–1187, https://doi.org/10.5194/hess-25-1165-2021, 2021.
Wu, Y., Xiao, P., Zhang, X., Liu, H., Dong, Y., and Feng, L.: Effects of Snow Cover on Spring Vegetation Phenology Vary With Temperature Gradient Across the Pan‐Arctic, J. Geophys. Res.-Biogeo., 128, e2022JG007183, https://doi.org/10.1029/2022JG007183, 2023.
Zhang, Q., Huai, B., Van Den Broeke, M. R., Cappelen, J., Ding, M., Wang, Y., and Sun, W.: Temporal and Spatial Variability in Contemporary Greenland Warming (1958–2020), J. Climate, 35, 2755–2767, https://doi.org/10.1175/JCLI-D-21-0313.1, 2022.


