the Creative Commons Attribution 4.0 License.
the Creative Commons Attribution 4.0 License.
Dual-frequency radar observations of snowmelt processes on Antarctic perennial sea ice by CFOSCAT and ASCAT
Rui Xu
Chaofang Zhao
Stefanie Arndt
Christian Haas
Since 2017, Antarctic sea ice coverage has shown significant reductions, and therefore observations of its surface melting behavior are of utmost importance. Here we study the capability of the Ku-band Chinese-French Oceanography Satellite Scatterometer (CFOSCAT) launched in 2018 to detect surface melting and compare it with more established observations of the C-band Advanced Scatterometer (ASCAT) in orbit since 2007. Both CFOSCAT and ASCAT observations show increases in radar backscatter of more than 2 dB over perennial ice once the ice surface warms and destructive snow metamorphism commences, defined as pre-melt onset (PMO). Backscatter increases by more than 3 dB once prominent thaw–freeze cycles commence, defined as snowmelt onset (SMO). Scatterometer data are compared with drifting buoy and ERA5 reanalysis air temperature data to support the interpretation of melt-related snow processes. Between 2019 and 2022, the average CFOSCAT pre-melt and snowmelt onset dates for 12 perennial ice study regions are 9 November (±23 d) and 1 December (±22 d), earlier than those of ASCAT on 21 November (±22 d) and 11 December (±25 d), respectively. Sensitivity tests show that results depend slightly on chosen backscatter thresholds but little on sea ice concentration. The derived SMOs are in good agreement with previous studies, but the SMO difference between dual-frequency radar observations is smaller than that reported by previous studies due to the sensor differences and different spatiotemporal resolutions. SMO differences between dual-frequency radar observations were also found to be potentially related to regional differences in snow metamorphism. With regard to the long-term changes in SMO, there are strong interannual and regional variabilities in SMO changes, and no consistent changes could be detected among different sub-regions with the beginning of Antarctic sea ice decline after 2015. Dual-frequency CFOSCAT and ASCAT observations hold strong promise for a better understanding of snowmelt processes on Antarctic sea ice, and it is necessary to extend the observation of Antarctic snowmelt based on dual-frequency scatterometers.
- Article
(8782 KB) - Full-text XML
-
Supplement
(409 KB) - BibTeX
- EndNote
After many decades of slight increases, Antarctic sea ice extent (SIE) has suddenly begun to plummet since 2016 and, after some years of slight recovery, reached record-low values in 2022, particularly in summer (Turner et al., 2022). However, the causes of these sudden changes and the future fate of Antarctic sea ice are unclear, and different underlying thermodynamic and dynamic processes in the atmosphere and oceans should be considered (Yu et al., 2022; Purich and Doddridge, 2023). In the Arctic, the ongoing reductions in sea ice extent and thickness are accompanied by earlier melt onset and a longer melt season, as can be well observed with passive and active satellite microwave data, due to the presence and persistence of wet snow and melt ponds in summer, leading to sustained reductions in radar backscatter (Mortin et al., 2014; Forster et al., 2001). However, Antarctic sea ice does not show strong surface melt due to small atmospheric energy fluxes (Andreas and Ackley, 1982; Vihma et al., 2009). Most of the melt takes place at the bottom due to generally large ocean heat fluxes in most parts of the Southern Ocean and Antarctic marginal seas (Schroeter and Sandery, 2022; Purich and Doddridge, 2023). Instead, the snow cover is subjected to diurnal or multi-day thaw–freeze cycles with strong snow metamorphism and the formation of ice layers or superimposed ice (Haas et al., 2001, 2008; Arndt et al., 2021). On perennial ice, i.e., the ice surviving spring and summer, this leads to sustained decreases in microwave emissivity (Willmes et al., 2009; Arndt et al., 2016) and increases in radar backscatter, which can be used to observe the timing of snowmelt onset and subsequent refreezing (Haas, 2001; Willmes et al., 2006; Arndt and Haas, 2019).
Radar scatterometers play an important role in investigating melt processes on Antarctic sea ice due to their frequent revisits of the entire sea ice region. Strong snow metamorphism results in coarse-grained and salt-free summer snow, increasing radar volume and surface scattering during the spring–summer transition defined as the period from 1 October to 31 January of the following year (Haas, 2001). When the ice melts before strong snow metamorphism due to the commencement of thaw–freeze cycles, e.g., in the seasonal sea ice zone, backscatter varies strongly once surface flooding with seawater of the thinning ice begins (e.g., Massom et al., 2001), and clear melt events cannot be detected easily (Drinkwater and Lytle, 1997; Drinkwater and Liu, 2000; Arndt and Haas, 2019). Therefore, this study focuses on the snowmelt onset in the perennial sea ice region only.
Using the increasing backscatter behavior when sporadic snowmelt begins, Arndt and Haas (2019) retrieved the pre-melt and snowmelt onsets from Ku-band and C-band scatterometer observations of the Antarctic perennial ice from 1992 to 2014. They showed the backscatter seasonal amplitudes had latitudinal variations, with Ku-band backscatter responding more strongly to snowmelt than C-band backscatter. Comparison of snowmelt onset between Ku-band and C-band sensors showed Ku-band QuikSCAT observations yielded earlier pre-melt and snowmelt onsets than C-band European Space Agency (ESA) European Remote Sensing (ERS) scatterometer and ASCAT observations. Arndt and Haas (2019) also proposed a conceptual model, which suggested that the Ku-band signal first detected the initial snow property changes in the inner snow column. The C-band signal can only sense the snowmelt when the warming and refreezing of snow reach the deeper layers. This demonstrates that dual-frequency microwave satellite observations can help resolve the vertical snow column melting process of thick snow on the Antarctic perennial sea ice from space and opens new ways to study the energy and mass budget of snow on sea ice in the Southern Ocean.
The Ku-band QuikSCAT has contributed significantly to snowmelt studies in the polar region (Arndt and Haas, 2019; Sturdivant et al., 2018; Wang et al., 2018). However, the end of its lifespan in 2009 meant that observations were not possible anymore. Fortunately, in October 2018 the Chinese-French Oceanography Satellite Scatterometer (CFOSCAT) was successfully launched, providing valid Ku-band measurements with 12.5 km spatial resolution at a frequency of 13.4 GHz that coincided with observations of the C-band ASCAT from 2019 to 2022.
In this study, we analyze the capability of CFOSCAT to detect melt onset timing and compare its performance to observations from ASCAT, closely following, extending, and updating the work and methods of Arndt and Haas (2019). However, in addition, we carry out sensitivity analyses to justify thresholds chosen for required backscatter increases and for the minimum ice concentration for which our results are still valid. We significantly extend the work of Arndt and Haas (2019) by studying the relationship between melt detection and snowmelt processes more carefully through comparison of results with air temperature time series from the ERA5 reanalysis. Finally, we use data from a drifting snow buoy to compare changes in backscatter along the drift trajectory with changes in air temperature and snow depth observed by the buoy. Our regional analysis is based on 12 study sites on perennial ice (Fig. 1) that are identical to those of Arndt and Haas (2019).
2.1 Data set
Scatterometer data used here include Ku-band CFOSCAT data and C-band ASCAT data. The CFOSCAT is carried on the Chinese-French Oceanography Satellite, operating at a frequency in Ku-band (13.4 GHz) with medium incidence angles (28–51°; see Liu et al., 2020). It applies two fan-shaped beams to scan the Earth: one is a vertically polarized (v-pol) fan beam, and the other is horizontally polarized (h-pol). However, since December 2022, the antenna of CFOSCAT has stopped spinning and has remained stalled in a fixed azimuth angle, unable to provide valid data (Mou et al., 2023). Therefore, we used CFOSCAT data from October 2019 to June 2022 in this study to obtain the snowmelt timing from 2019/2020 to 2021/2022.
The ASCAT on MetOp operates at a frequency in C-band (5.255 GHz) and provides vertical polarization data. Here we used gridded enhanced ASCAT data from the NASA Scatterometer Climate Record Pathfinder (SCP) project provided by Brigham Young University (BYU) that are 2 d averages with a resolution of 4.45 km × 4.45 km (Long et al., 1993; Lindsley and Long, 2016). The SCP ASCAT data have been available since 2007 and are currently updated to 19 November 2022, with the entire duration used to complete this study.
As fan-beam scatterometers, ASCAT and CFOSCAT obtain backscatter coefficients with various incidence angles. This requires incidence angle corrections to eliminate the effect of incidence angles on backscatter coefficients. BYU uses a scatterometer image reconstruction with a filter algorithm (SIRF; Long et al., 1993) to correct the ASCAT data by bringing backscattering coefficients to a reference incidence angle of 40°. In order to achieve the incidence angle correction of the CFOSCAT measurements, we used a robust least squares fitting method (Xu et al., 2022) based on CFOSCAT Level-2A data. This method is based on the linear relationship between the backscatter coefficient (in dB) and the incidence angle (Remund and Long, 1999) as follows:
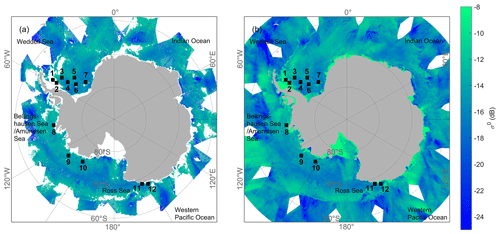
where A is the observed backscatter value () at 40° incidence, i.e., the backscatter after incidence angle correction, and B describes the dependence of on θ. First, we projected the 12.5 km resolution CFOSCAT L2A data onto the polar stereographic grid in the same manner as the SCP ASCAT data. The least squares fitting was then performed for polar grid cells with more than five observations. To ensure the same spatial and temporal resolution between ASCAT and CFOSCAT, we downsampled the ASCAT backscatter data from 4.45 to 12.5 km resolution by averaging the data within each 12.5 km grid cell, and we averaged the CFOSCAT data over 2 d. In this study, we did not use ASCAT data at 12.5 km spatial resolution from the French Research Institute for Exploitation of the Sea (IFREMER), even though employing data at the same resolution could have facilitated a more direct comparison between ASCAT and CFOSCAT. Our decision was primarily based on the following considerations. First, this work is an extension of the study of Arndt and Haas (2019). To maintain consistency and allow for better comparison with the study of Arndt and Haas (2019), we used the same ASCAT backscatter coefficient product, i.e., the SCP ASCAT product. In addition, there are frequent spatial data gaps in the IFREMER ASCAT data (e.g., Fig. 2), which may result in the failure to retrieve the melt onset in some regions when utilizing this data set. We therefore used the SCP ASCAT data instead of IFREMER data in this study. Note that we used v-pol CFOSCAT backscatter to be consistent with the polarization of the ASCAT data, as also done by Arndt and Haas (2019).
To avoid the contamination of our results by wind-roughened water and regions with a low ice concentration, we used the sea ice concentration (SIC) data derived from the Advanced Microwave Scanning Radiometer (AMSR) series to filter out scatterometer data at low sea ice concentrations. We only considered scatterometer data if the ice concentration was more than 70 %, a threshold chosen as a robust value from our sensitivity study below. We used the daily AMSR SIC data product developed by Spreen et al. (2008), which has a spatial resolution of 6.25 km.
In order to help interpret our melt detection results, we used hourly air temperature data from ERA5 reanalysis (Hersbach et al., 2023). These data are derived from observations and data assimilation in weather models and have been widely utilized and evaluated for the Antarctic region (Bozkurt et al., 2020; King et al., 2022; Zheng et al., 2022). Here we used the ERA5 2 m air temperature with a spatial resolution of 0.25° × 0.25°.
Finally, we evaluated our results with air temperature and snow depth data from a snow buoy. Snow buoys are autonomous drifting platforms deployed on individual ice floes (Nicolaus et al., 2021). Unfortunately, during the CFOSCAT observation period from 2019 to 2022, only data from one buoy were available, namely 2021S114 (hereafter S114). It was deployed in the Weddell Sea on 19 February 2021 and provided continuous measurements throughout the 2021/2022 melt season. Its drift track between 1 October 2021 and 31 January 2022 is shown in Fig. 1.
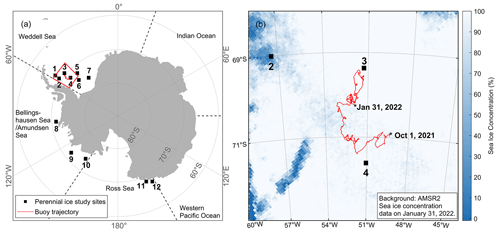
Figure 1(a) Locations of 12 study sites (black squares) in the Antarctic perennial sea ice zone and the drift trajectory of buoy S114 (red line). We define abbreviations for different sectors for subsequent use: WS is the Weddell Sea, BS/AS is the Bellingshausen Sea and Amundsen Sea, RS is the Ross Sea, WPO is the western Pacific Ocean, and IO is the Indian Ocean. (b) Drift trajectory of buoy S114 between 1 October 2021 and 31 January 2022 (red line). The background shows the sea ice concentration on 31 January 2022. Locations 2, 3, and 4 are the same on both maps.
2.2 Snowmelt retrieval
In the Antarctic, snowmelt is not strong enough to form widespread melt pond coverage due to relatively low net surface heat gain (Vihma et al., 2009). Therefore, the use of methods in the Arctic that take advantage of strong backscatter decreases due to wet snow and ice not being applicable in the Antarctic. In contrast, on Antarctic sea ice, most snow survives the summer but undergoes strong diurnal thaw–freeze cycles, leading to highly metamorphous snow with high backscatter (Massom et al., 2001; Haas, 2001; Willmes et al., 2009; Arndt and Haas, 2019).
This is illustrated in Fig. 3 with an example of the annual time series of CFOSCAT and ASCAT radar backscatter. It can be seen that backscatter generally decreases during winter, with shorter-term variations of less than 2 dB. However, during November, larger backscatter increases of more than 2 dB can be seen. We define this phase as pre-melt onset (PMO). It coincides with the spring warming, when the snow and upper layers of ice begin to warm due to higher air temperatures and increasing solar radiation. If snow temperatures get closer to the melting point, liquid water appears between grains in the snow, initially in the pendular regime, i.e., without percolating (Colbeck, 1997). Under the influence of diurnal temperature and radiation cycles, it leads to the formation of increasingly large, round crystal clusters, which enhance the volume scattering of snow and thus result in radar backscatter rise (Nandan et al., 2017; Arndt and Haas, 2019). In addition, the upper ice also warms during this period and becomes more porous depending on its salinity, contributing to increased backscatter as well (Yackel et al., 2007).
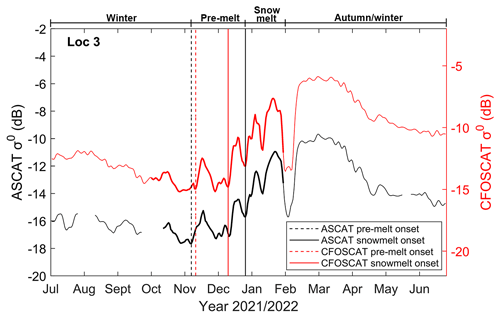
Figure 3Annual time series of CFOSCAT (, red) and ASCAT radar backscatter (, black) in 2020/2021 for 1 pixel at Location 3 in the perennial sea ice zone (see Fig. 1). The vertical lines illustrate snow pre-melt onset (stippled) and snowmelt onset (solid) derived from the backscatter time series. The bolded section denotes the period of the spring–summer transition (1 October to 31 January).
In December and January, larger variations in backscatter can be seen, with more persistent increases of over 3 dB alternating with short intermittent decreases. We define the first rise of more than 3 dB as snowmelt onset (SMO). It coincides with the onset of more extensive liquid water within the snow and strong diurnal thaw–freeze cycles. These lead to strong snow metamorphism and the occasional transformation of the snow to the funicular regime (Colbeck, 1997), when meltwater percolates downwards and refreezes within the snow or at the colder snow–ice interface, depending on the temperature profile within the snow. When the melt is intense so that meltwater percolates to the snow–ice interface and refreezes there, it forms fresh superimposed ice on top of the original sea ice (Jeffries et al., 1994; Haas et al., 2001; Kawamura et al., 2017). Metamorphic snow, ice layers, and superimposed ice all contribute to significant backscatter rises. Short periods of several days of wetter snow with little refreezing cause the observed intermittent backscatter drops.
This characteristic temporal snow and backscatter behavior can be seen in most regions of perennial ice and was used by Arndt and Haas (2019) to derive pre-melt and snowmelt onset from ERS, QuikSCAT, and ASCAT data. Here we follow the same approach by first extracting the annual backscatter time series of ASCAT and CFOSCAT for each study grid cell from the beginning of July to the end of June of the following year, as shown in Fig. 3. In contrast to Arndt and Haas (2019), who resampled ASCAT and QuikSCAT backscatter time series to time intervals of 6 d to be consistent with the temporal resolution of the ERS data, in this study we did not resample the ASCAT data but used their original 2 d resolution. We averaged the daily CFOSCAT data over 2 d to align with the temporal resolution of ASCAT (Sect. 2.1). Therefore, our study can potentially capture shorter periods of snow property changes. As done by Arndt and Haas (2019), we smoothed each time series by a moving three-point averaging window to reduce noise, such as from wind or spurious warm intrusions.
Based on the backscatter time series, we calculated the differences between the local backscatter maxima and preceding local backscatter minima during the spring–summer transition. The first instance after 1 October, when the difference is larger than a pre-melt onset threshold, is regarded as the pre-melt onset date (vertical stippled lines in Fig. 3). The first instance after the pre-melt onset date when the difference is larger than a snowmelt onset threshold is regarded as the snowmelt onset date (vertical solid lines in Fig. 3). The snowmelt timing criteria of 2 dB (PMO) and 3 dB (SMO) were first proposed by Arndt and Haas (2019). These two thresholds were derived from a long-term backscatter compilation including different scatterometers and climatic conditions. We adopted the same threshold for ASCAT and CFOSCAT data in this study. However, note that we carried out an additional sensitivity study, which justifies these choices (Sect. 3.1).
For better comparison with previous studies, we focused on the same 12 perennial ice study sites containing 3×3 pixels selected by Arndt and Haas (2019) and Haas (2001) from different Antarctic sectors (Black squares in Fig. 1a). We retrieved the pre-melt and snowmelt onsets for each of these 9 pixels and then averaged these values to reduce noise and to increase the spatial representativity.
The increase in backscatter coefficient during thaw–refreeze cycles indicates the intensity of melting and refreezing, i.e., how much liquid water there has been within the snow and how much metamorphism, grain coarsening, and ice layering it has caused. Additionally, the time intervals between the local minima and the subsequent local maxima when PMO or SMO occurs could be studied as potential indicators of the temporal snowmelt progression or rate. The time interval can provide additional context for understanding the snowmelt mechanisms on Antarctic sea ice. Although this parameter was not directly examined within the scope of this research, it bears potential significance for future inquiries.
3.1 Sensitivity of PMO and SMO dates to different backscatter thresholds
Before using thresholds of 2 dB for PMO and 3 dB for SMO, it is necessary to test their effectiveness. Therefore, we carried out a sensitivity study by successively increasing and decreasing the thresholds by 0.1 dB up to a difference of ±1 dB and retrieving the PMO and SMO over the 12 study sites with these backscatter thresholds. Figure 4 shows the changes in PMO and SMO in different perennial ice regions during the period when CFOSCAT and ASCAT data overlap, i.e., from 2019/2020 to 2021/2022. It can be seen clearly that both PMO and SMO become progressively later as the threshold increases. The larger the threshold, the smaller the change, especially when the threshold is greater than 2 dB for PMO and 3 dB for SMO. The blue line in Fig. 4 indicates the retrieval rate, defined as the ratio of the number of pixels that can retrieve PMO or SMO within the 12 study sites, each consisting of 9 pixels, to the total of 108 pixels. Generally, the retrieval rate decreases as the threshold increases. When the threshold is greater than 2 dB, the PMO retrieval rate of ASCAT drops below 0.99, while the PMO retrieval rate of CFOSCAT stays above 0.99. The SMO retrieval rate of ASCAT is also lower than that of CFOSCAT, and when the threshold is greater than 3 dB in particular, the SMO retrieval rate of ASCAT drops below 0.88.
Based on the threshold sensitivity test, we conclude that 2 and 3 dB thresholds are appropriate in order to avoid underestimating the PMO and SMO, while a variation of 0.1 dB in the thresholds may still affect results by up to approximately a week. On the other hand, thresholds larger than 2 and 3 dB might be more difficult to be satisfied frequently, which would reduce the retrieval rate. We also found that CFOSCAT had a higher retrieval rate than ASCAT.
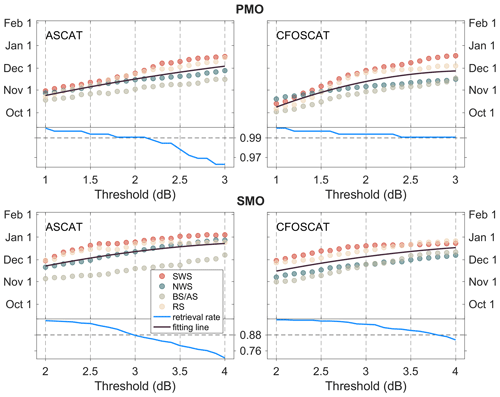
Figure 4Variations in retrieved PMO and SMO dates with the change in retrieval thresholds for different regions. The black line represents the fitted curves for PMO and SMO, and the blue line indicates the retrieval rate defined as the fraction of pixels within the 12 study sites where PMO or SMO can be retrieved. SWS – southeastern Weddell Sea. NWS – northwestern Weddell Sea. The boundary between SWS and NWS is defined as the longitude of Location 4, i.e., 50.1° W (see Fig. 1). For other full names, see the title of Fig. 1.
3.2 Pre-melt and snowmelt onsets retrieved by CFOSCAT and ASCAT
With the thresholds of 2 dB for PMO and 3 dB for SMO now justified, we continue to compare the PMO and SMO obtained from CFOSCAT and ASCAT. Figure 5 shows the daily backscatter time series and the retrieved pre-melt and snowmelt onsets of CFOSCAT and ASCAT for our 12 study regions. We observe that the timing of melt onsets varies with latitude and region, with both ASCAT and CFOSCAT showing later snowmelt onset in the southeastern Weddell Sea than in the northwestern Weddell Sea. It should be noted that in a few cases, Fig. 5 shows an earlier SMO than PMO, e.g., at Location 3 in 2012. This is because of the spatial variability within our 9-pixel study locations, where PMO can be detected at more pixels than SMO, which may lead to the PMO value being larger than the SMO value after averaging. An example is shown in the Supplement.
In Fig. 5, the Ku-band backscatter shows higher values than the C-band backscatter during winter, in agreement with the results of Mortin et al. (2014), who compared QuikSCAT and ASCAT in the Arctic. This points to the importance of snow properties and the different penetration depths of Ku- and C-band radar in radar backscatter (e.g., Onstott and Shuchman, 2004). During winter, both CFOSCAT backscatter and ASCAT backscatter decrease, probably due to increasing new snow accumulation and the opening of leads with the young first-year ice formation within the divergent ice pack. In the melt season, the backscatter coefficients increased significantly during the spring–summer transition and more strongly with CFOSCAT. This can be seen in Fig. 6, which summarizes the mean amplitudes between the seasonal maxima and minima during the spring–summer transition for CFOSCAT and ASCAT over the period of 2019/2020 to 2021/2022. The average increase in CFOSCAT was 8.0 dB, larger than that of ASCAT with 5.9 dB. It is consistent with the findings of Arndt and Haas (2019), in which the seasonal backscatter amplitude of QuikSCAT is 8.03 dB and that of ASCAT is 5.1 dB. It suggests that Ku-band scatterometers are more sensitive to the snowmelt process on Antarctic perennial ice than C-band scatterometers. This also results in the higher retrieval rates of CFOSCAT compared to ASCAT shown in Fig. 4.
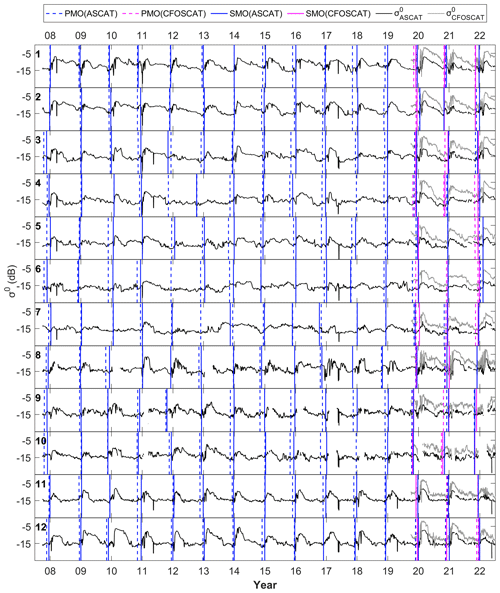
Figure 5Time series of ASCAT (black lines) and CFOSCAT backscatter (gray lines) averaged over the respective 9 pixels at the 12 study locations with the retrieved pre-melt onset (PMO; stippled lines) and snowmelt onset (SMO) dates (solid lines) shown by the vertical lines.
The latitudinal distribution of the seasonal amplitudes in the 12 study regions can also be observed in Fig. 6. In the Weddell Sea region, ASCAT and CFOSCAT seasonal amplitudes are relatively low at high latitudes (Locations 5, 6, and 7) but higher at low latitudes (Locations 1 to 4). In the Bellingshausen Sea–Amundsen Sea region and Ross Sea region, it is also quite evident that the backscatter amplitude decreases with increasing latitude; however sites are also separated much more zonally. This phenomenon suggests that changes in backscatter amplitudes relate to latitude variations owing to cooler climate conditions farther south.
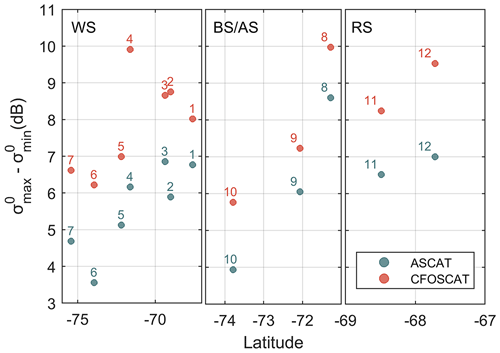
Figure 6Differences between seasonal maxima and minima of backscatter during the spring–summer transition period over 2019/2020 to 2021/2022 for our 12 study sites shown by latitude. See Fig. 1 for locations and region abbreviations.
Figure 7 summarizes the mean pre-melt and snowmelt onset dates derived from CFOSCAT and ASCAT. For the period from 2019/2020 to 2021/2022, the average SMO of CFOSCAT is significantly earlier than that of ASCAT for almost all sub-regions, with the exception of the BS–AS region, where their snowmelt onsets are comparable. This could be due to the fact that the snow in the BS–AS region melts very rapidly when it is already close to the melting temperature and warms quickly throughout the entire snow column. All wavelengths would then respond at approximately the same time (Arndt and Haas, 2019). On average, CFOSCAT detects snowmelt onset on 1 December, i.e., 10 d earlier than ASCAT (11 December). This is in agreement with the observations and conceptual scattering model of Arndt and Haas (2019), although they found a larger average difference of 18 d between Ku-band- and C-band-detected snowmelt onset. As for the pre-melt onset, CFOSCAT detected an average of 9 November, 12 d earlier than ASCAT (21 November), with the difference between the C- and Ku-band sensors being much smaller than the 20 d reported by Arndt and Haas (2019). The largest difference (19 d) between the CFOSCAT and ASCAT results occurs in the NWS region, where the backscatter amplitude varies significantly during the melt (Fig. 5). We also find that both the mean PMO and the mean SMO of ASCAT from the 2019/2020 to 2021/2022 period over the entire Antarctic region are earlier than those from the 2007/2008 to 2021/2022 period, which may be important for studying the large Antarctic sea ice variability in recent years.
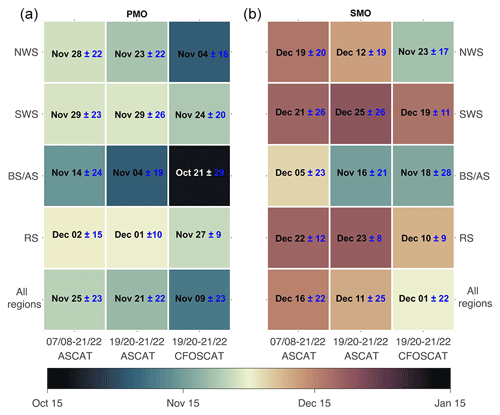
Figure 7Mean values of pre-melt and snowmelt onset dates of ASCAT and CFOSCAT for 12 study regions (mean ±1 standard deviation) and different time periods. Panel (a) shows PMO derived from ASCAT for the period 2007/2008 to 2021/2022 and from ASCAT and CFOSCAT for the period 2019/2020 to 2021/2022. Panel (b) shows the statistics of SMO for the same time periods. Colors indicate dates.
3.3 Relationship between scatterometer-derived snowmelt timing and air temperatures
Figure 8 shows the time series of 2 d running mean daily maximum ERA5 2 m air temperatures from July 2007 to June 2022 for the 12 study regions, along with scatterometer-derived pre-melt and snowmelt onset dates. When October comes, air temperatures begin to rise noticeably. When pre-melt onset is detected, air temperatures have generally risen above −5 °C.
Looking for single days with high air temperatures may not be sufficient for the interpretation of melt signals because snow may not thaw or melt when high air temperatures are not sustained. Therefore, in order to find more robust relationships between scatterometer-derived PMO and SMO dates and air temperatures, we also compare PMO and SMO dates with the date when air temperatures are equal to or higher than 0 °C for at least 3 consecutive days (DATE0−3 d; Fig. 9). Figure 9 also compares PMO with DATE−5 (the date when air temperatures first rise above −5 °C) and DATE0 (the date when air temperatures first rise above 0 °C) and SMO with DATE0. In order to better compare the results between the C- and Ku-band sensors, only the results from 2019/2020 to 2021/2022 are shown here.
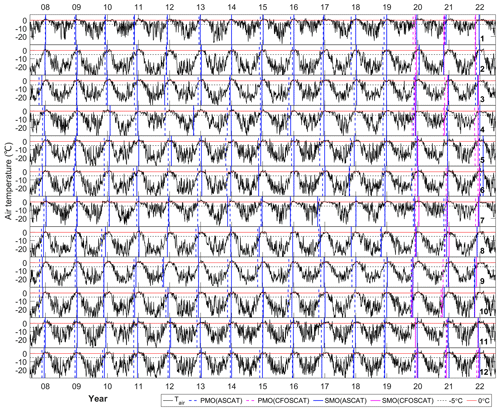
Figure 8Time series of 2 d average maximum ERA5 2 m air temperatures at the 12 study locations with pre-melt and snowmelt onset dates marked by colored vertical lines.
There are 27 cases of CFOSCAT and 28 cases of ASCAT (Fig. 9a) where the pre-melt onset occurs after air temperatures first rise above −5° C, indicating that pre-melt rarely occurs when the air temperature is still below −5 °C. The PMOs of both sensors are closer to the date when temperatures first rise above 0 °C, with 13 and 16 cases falling within ±10 d of DATE0 for CFOSCAT and ASCAT, respectively (Fig. 9b). This finding confirms a well-known fact that snow properties undergo minimal changes when temperatures rise above −5 °C but exhibit significant changes in their internal characteristics as temperatures exceed 0 °C (e.g., Takei and Maeno, 2001; Nicolaus et al., 2009). The changes in the physical properties of the snow layer are then sensed by the scatterometer. Compared with DATE0−3 d, PMO dates are mostly earlier (Fig. 9c). This suggests that pre-melt onset derived in this study is sensitive to initial warming and occurs before sustained warming sets in.
Figure 9d–e show that SMO cases are usually later than DATE0, and most fall within ±20 d of DATE0−3 d. This indicates that the SMOs retrieved here are more likely to represent a sustained warming processes. Overall, although the PMO is closer to DATE0 and the SMO is closer to DATE0−3 d, the difference between PMO and DATE0 or the difference between SMO and DATE0−3 d is sometimes very large and can exceed 1 month. On the one hand, it may be because DATE0 and DATE0−3 d in some cases correspond to the air temperature rise caused by a short-lived warm intrusion event and cannot represent the beginning of a real seasonal pre-melt or snowmelt process. On the other hand, in regions where melting is also affected by ocean circulation or sea ice drift in addition to air temperature (i.e., the Amundsen Sea region), the PMO or SMO retrieved by scatterometers may have a weakened connection with air temperature, resulting in large differences between PMO and DATE0 or between SMO and DATE0−3 d.
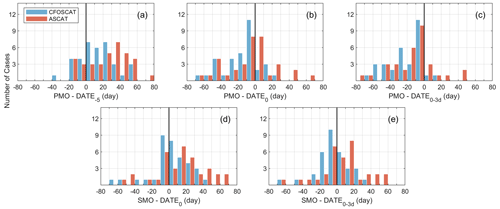
Figure 9Histograms of differences between scatterometer-derived PMO and SMO and the date when air temperatures first rise above −5 °C (DATE−5), the date when air temperatures first rise above 0 °C (DATE0), and the date when air temperatures are equal to or higher than 0 °C for at least 3 consecutive days (DATE0−3 d). (a) PMO-DATE−5, (b) PMO-DATE0, (c) PMO-DATE0−3 d, (d) SMO-DATE0, and (e) SMO-DATE0−3 d. Blue represents the results of CFOSCAT, and red represents the results of ASCAT.
3.4 Comparison with snow buoy data in 2021/2022
Figure 10 shows the seasonal evolution of snow depth and air temperature from buoy S114, ERA5 air temperature, AMSR SIC, and backscatter during the spring–summer transition in 2021/2022 along the buoy drift track. It also shows the pre-melt and snowmelt onset dates retrieved from the backscatter time series along the buoy track using the method described in Sect. 2.2.
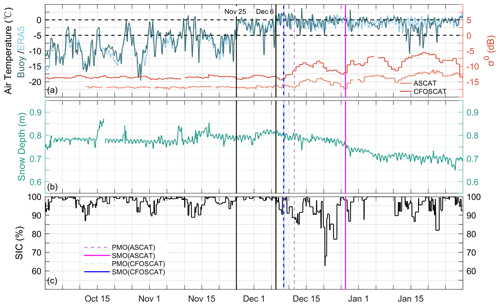
Figure 10Time series of (a) air temperatures measured by snow buoy S114 and ERA5, backscatter of CFOSCAT and ASCAT, (b) snow depth measured by S114, and (c) sea ice concentration along the drift trajectory of S114 during the spring–summer transition in 2021/2022. Snow buoy data and ERA5 air temperatures shown here are hourly data. The PMO and SMO of CFOSCAT occurred on the same day; therefore the two lines cannot be distinguished well.
From 1 October to CFOSCAT pre-melt onset, CFOSCAT backscatter remains around −13 dB, while ASCAT maintains a lower backscatter coefficient (−17 dB) than CFOSCAT, in agreement with results shown in Fig. 5. The air temperature gradually increased starting from 1 November, remaining mostly above −5 °C after 25 November. On 6 December, the air temperature reached and exceeded 0 °C. After keeping the temperature above −1.8 °C for 3 d, CFOSCAT PMO and SMO were detected (9 December) due to the significant backscatter change caused by snowmelt. This was followed by a gradual decrease in temperature, in which case the resulting refreezing kept the backscatter of CFOSCAT and ASCAT at high values of −8 and −14 dB, respectively. On 11 December, ASCAT detected the pre-melt onset. On 17 December, the air temperature began to rise, increasing the liquid water content in the snow. As the increase in liquid water content causes the microwave signal to attenuate, the backscatter of both sensors decreased. On 25 December, air temperatures dropped again with further refreezing that might have led to the formation of ice lenses in the deeper snow layers or superimposed ice on the ice surface. This resulted in an increase of more than 3 dB in backscatter for ASCAT (26 December), which allowed ASCAT to detect the onset of snowmelt. It should also be noted that before 26 December, backscatter first decreased due to thawing caused by the warmer air temperature and then increased due to refreezing caused by the cooler air temperature, characterizing the typical microwave backscatter changes during thaw–freeze cycles. Until 31 January, several other thaw–freeze cycles can also be observed through backscatter variations (e.g., from 8 to 21 January).
When the SMOs of CFOSCAT and ASCAT were detected, the buoy S114 was located at 70.2° S, 52.3° W and 69.6° S, 51.3° W, respectively, somewhere between both Location 3 and Location 4 but closer to Location 3 (Fig. 1b). However, the snowmelt onsets obtained along the buoy track were closer to the average of Location 4 (SMOs of 9 December and 26 December for CFOSCAT and ASCAT, respectively; Fig. 5) than to the average of Location 3 (SMOs of 16 November and 2 December of CFOSCAT and ASCAT, respectively; Fig. 5) for both sensors. This was due to the fact that when the buoy drifted near Location 4, the local temperature was still very low, making it difficult to cause snowmelt. The buoy then continued to drift past Location 4 until approaching Location 3, when the backscatter increased significantly and the SMO was detected. At this time, the snowmelt at Location 3 had already started, but at Location 4 it had just started. This phenomenon indicates that Lagrangian and Eulerian measurements may perform differently in retrieval of snowmelt.
Before the pre-melt period, snow depth remained nearly constant or increased slightly but began to decrease around 7 December, coinciding with CFOSCAT-detected pre-melt. Snow depth continued to decrease until around 6 January when it stabilized at around 0.7 m, even though air temperatures remained around 0 °C for some time afterwards. Figure 10 also shows that SIC remained larger than 80 %–90 % for the majority of the time. Larger drops throughout December coincide with periods of higher air temperatures around or above 0 °C with the detected pre-melt and snowmelt onset events. SIC tends to increase when air temperatures return to below 0 °C. While we cannot exclude the fact that ice concentrations may indeed have reduced and may have affected our melt retrieval results, the SIC behavior shown in Fig. 10 may also be due to the impact of snow properties on SIC retrievals (e.g., Spreen et al., 2008).
4.1 Limitations and uncertainties
The melt detection approach in this study is Eulerian; i.e., the influence of ice drift is not considered, and it is therefore difficult to strictly distinguish between spatial and temporal variability. The ice drift can redistribute the location of the perennial ice and the snow zone with different properties, affecting the backscatter characteristics of the snow surface, which may in turn increase the uncertainty of the snowmelt onset date detection under the Eulerian framework. In order to reduce the small-scale variability caused by small-scale ice drift and ensure stable results, the snowmelt onset date of each study site was computed by averaging the snowmelt onset dates of 9 pixels in this paper. The locations of the 9 pixels are identical to those used by Arndt and Haas (2019), who employed backscatter data with a spatial resolution of 25 km. Consequently, the snowmelt onset dates for each site in this study are averages derived from 9 pixels within a 62.5 km × 62.5 km area. With an average ice drift speed of 0.1 m s−1, this corresponds to a residence time of approximately 7 to 10 d in each study site. However, this still cannot completely eliminate the impact of ice drift. For example, we found in Sect. 3.4 that the snowmelt onset date along the buoy trajectory differs from that at the fixed location near the buoy. A more accurate and quantitative comparison of results based on Lagrangian and Eulerian frameworks requires knowledge of the physical characteristics of each ice field. However, given that no other snow buoy data or reliable satellite sea ice drift data are available within the temporal and spatial framework of our study and that this is beyond the scope of our study, no further relevant analysis is conducted in this paper.
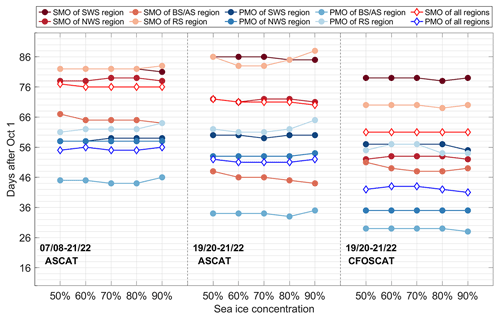
Our melt detection results may be affected by the presence of open water whose backscatter can vary widely depending on wind roughening and ice cover. When there is no wind or weak wind, open water may reduce the magnitude of the backscatter increase during the melting process, resulting in the defined pre-melt and snowmelt onset criteria being fulfilled slightly later. In this study, although we filtered out sea ice with a sea ice concentration below 70 %, the presence of open water may still have an impact on our retrieval results. Figure 11 shows the sea ice concentration distributions of different regions from 2007 to 2021. It shows that the SIC in the NWS and SWS regions is mostly higher than 70 % during the spring–summer transition (99 % in the NWS region and 98 % in the SWS region, Fig. 11), indicating that our SIC threshold of 70 % is justified. In the BS–AS region, SIC varies significantly during the spring–summer transition and can be as low as less than 50 % in about 5 % of cases. In the RS region, SICs may drop below 70 % during the spring–summer transition, but most remain above 70 % (95 %). Like Arndt et al. (2016), we further analyzed the retrieved pre-melt and snowmelt onset dates over the 12 study regions under five sea ice concentration thresholds (50 %, 60 %, 70 %, 80 %, and 90 %) as summarized in Fig. 12. Average snowmelt onset dates over the entire Antarctic region of CFOSCAT do not change at different ice concentrations, while the average pre-melt onset changes by 2 d. For ASCAT, average pre-melt and snowmelt onsets over the entire Antarctic region changed by 1 and 2 d, respectively, from 2019/2020 to 2021/2022. Figure 12 shows that the BS–AS region is more susceptible to changes in SIC thresholds. In this region, the CFOSCAT SMO varied by 3 d, and the ASCAT SMO changed by 4 d from 2019 to 2022. This is due to the highly variable sea ice concentration in this region as shown in Fig. 11. In the RS region, when the SIC threshold is greater than 70 %, the melt onset dates vary significantly. Overall, both average pre-melt and average snowmelt onsets over the entire Antarctic region vary within 2 d under different sea ice concentrations, indicating that sea ice concentration has a weak impact on our results. Moreover, 70 % is a suitable SIC threshold that will not filter out too many valid data in the WS and RS regions, nor will it cause the retrieval in the BS–AS region to be affected by the presence of too much water.
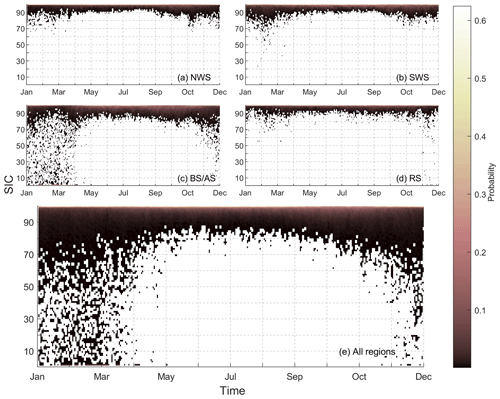
Figure 11Distribution of SIC in different seasons and regions from 2007 to 2021. Colors represent distribution probabilities.
4.2 Comparison with the previous study
We used the same thresholds as in Arndt and Haas (2019) to determine pre-melt and snowmelt onset dates, although Arndt and Haas (2019) derived the results from 6 d average backscatter data time series, whereas we used 2 d average backscatter time series. Moreover, Arndt and Haas (2019) resampled the ASCAT data to a 25 km × 25 km polar stereographic grid, while we resampled the ASCAT data to a 12.5 km × 12.5 km polar stereographic grid. Despite differences in temporal and spatial resolutions, both studies revealed that Ku-band scatterometers detected earlier snowmelt onsets than C-band scatterometers (Fig. 7 in this study; Fig. 6 in Arndt and Haas, 2019). The reason for this has been demonstrated in the conceptual model developed by Arndt and Haas (2019), whereby Ku-band scatterometers with shorter penetration depths detect snow metamorphism inside the snowpack earlier than C-band scatterometers with larger penetration depths. Our new observations add more confidence to this conceptual model.
However, the average SMO and PMO differences between the C-band and Ku-band scatterometers in this study were 10 and 12 d, respectively, which are both smaller than the 18 and 20 d of Arndt and Haas (2019), respectively. This may be related to differences between sensors, i.e., between CFOSCAT and QuikSCAT. QuikSCAT obtains backscatter coefficients from two fixed beams (46° incidence and 56° incidence), whereas we normalized the incidence angle to 40° for CFOSCAT in this paper. Previous studies (e.g., Remund and Long, 1999; Gohin and Cavanié, 1994) have shown that the incidence angle is an important factor affecting scatterometer-based sea ice observations. The temporal resolution also affects the retrieval, possibly resulting in the smaller PMO and SMO difference between the Ku-band and C-band sensors in this study.
Our study also revealed two additional findings identical to those of Arndt and Haas (2019): (1) backscatter signals exhibit latitudinal variability (Fig. 6 in this study; Fig. 5 in Arndt and Haas, 2019), and (2) Ku-band scatterometers are more sensitive to snowmelt (Fig. 6 of this study; Fig. 2 in Arndt and Haas, 2019).
For further comparison, we show the PMO and SMO for the overlapping period of ASCAT data of these two studies that used different data-averaging methods (i.e., 2007/2008 to 2014/2015) in Fig. 13. For each panel of Fig. 13, the scatterplot shown on the top axis represents PMO, and the bottom axis represents SMO. The boxplot in each panel shows the difference in results between this study and Arndt and Haas (2019). In the NWS region, the PMO from the two studies shows great consistency, while in the other three regions, our study obtained earlier average PMO. This may be due to the fact that Arndt and Haas (2019) used a 6 d average and 25 km resampling, smoothing out some small increases in backscatter. However, the 6 d average and 25 km resampling did not affect the detection of PMO in the NWS region due to the significant increase in the backscatter coefficient amplitude in response to the snowmelt in this region (Figs. 5 and 6). As shown in the boxplot in Fig. 13e, the difference in Antarctic-wide SMO between the two studies is mostly within ±15 d, and the average value of this study is slightly later. The slightly later SMO detected in this study is mainly due to the particularly early SMO detected by Arndt and Haas (2019) in the SWS region. Overall, in the NWS region, both PMO and SMO from these two studies are very close. Differences between the two in other regions are mainly due to differences in spatial and temporal resolution. Despite some differences, the two studies show fairly good agreement in terms of averages across all the regions, demonstrating the robustness of both averaging methods.
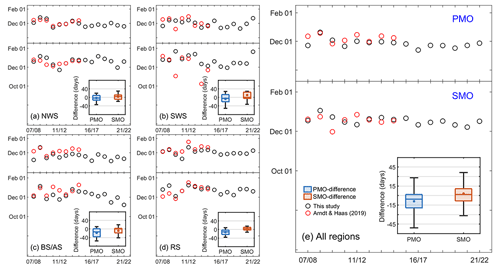
Figure 13PMO and SMO derived by this study and Arndt and Haas (2019). The upper scatterplot of each panel represents the PMO results, while the lower scatterplot is the SMO results. Boxplots in each panel represent PMO and SMO differences between the two studies. Boxes are the first and third quartiles. Whiskers display the 20th and 80th percentiles. Filled circles indicate the means, and horizontal lines indicate the median values.
4.3 Long-term variations in snowmelt onset dates
Having updated snowmelt onset retrievals until 2021/2022 compared to the study of Arndt and Haas (2019), which ended in 2014/2015, here we also present a complete overview of long-term variations in snowmelt onset dates in our study regions. Figure 14 shows the SMO of Arndt and Haas (2019) from 1992/1993 to 2014/2015, the ASCAT-derived SMO in this study from 2007/2008 to 2021/2022, and the CFOSCAT-derived SMO in this study from 2019/2020 to 2021/2022. The comparison of our results with those of Arndt and Haas (2019) during the overlapping period of both studies from 2007/2008 to 2014/2015 is the same as in Fig. 13. SMOs derived from ASCAT and CFOSCAT show consistent change patterns from 2019/2020 to 2021/2022 only in the NWS and BS–AS regions. In fact, the 3-year overlap period is not sufficient to compare the consistency of SMO change patterns between the two studies. Therefore, we only used the ASCAT-derived SMO and the SMO from Arndt and Haas (2019) to fit the long-term SMO change trend from 1992/1993 to 2021/2022. The SMO of their overlapping periods is obtained by averaging the two.
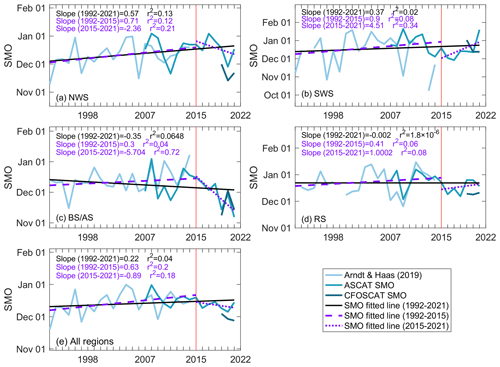
Figure 14SMO time series from 1992 to 2021. The solid dark blue, medium blue, and light blue lines represent the CFOSCAT-derived SMO, ASCAT-derived SMO, and SMO from Arndt and Haas (2019), respectively. The solid black line, dashed purple line, and dotted purple line are the fitted trend lines for 1992–2021, 1992–2015, and 2015–2021, respectively, based on the Arndt and Haas (2019) SMO and the ASCAT-derived SMO.
For the full observation period from 1992/1993 to 2021/2022, SMO dates across all regions show a positive trend; i.e., they occur increasingly late (Fig. 14). However, there are large regional differences, particularly in the BS–AS region where the trend is negative; i.e., SMO occurs earlier. In the RS region, there is no significant change in SMO.
Investigating the trends from 1991 to 2015 and from 2015 to 2021 separately, for the Antarctic as a whole, the mean date of the SMO was slightly delayed before 2015 (0.63 d yr−1) and slightly advanced after 2015 (−0.89 d yr−1) when the sea ice extent around the Antarctic began to decrease sharply (Fig. 14). For the four sub-regions, the mean SMO date exhibited a consistent delay trend from 1992 to 2015, with the delay being most pronounced in the SWS region at 0.9 d per year. From 1992 to 2015, the sea ice extent in the BS–AS region exhibited a decreasing trend, whereas the WS and RS regions experienced an increasing trend (Parkinson, 2019). After 2015, the sea ice extent in the four regions tended to decrease, with the largest ice loss being observed in the WS region (Jena et al., 2022). As illustrated in Fig. 14, the SMO change trend pattern after 2015 showed large regional differences. Specifically, the NWS and BS–AS regions experienced an earlier SMO trend, while the SWS and RS regions exhibited a later SMO trend. In the Arctic, studies have shown that melt onset is strongly correlated with changes in Arctic-wide sea ice extent (Stroeve et al., 2014). In the Antarctic, however, the mechanisms influencing changes in sea ice extent vary strongly regionally and are more complex (Parkinson, 2019). While we found some weak, relative relationships between decreasing SIE and earlier SMO for the Antarctic as a whole, relationships between SMO and SIE in each sub-region vary strongly. Such weak correlations between SMO and Antarctic sea ice extent have also been emphasized in previous studies (e.g., Stammerjohn et al., 2008; Arndt and Haas, 2019). Instead, regional differences in the SMO change patterns are more prominent. This also reminds us that deeper understanding of the relationship between SMO and sea ice extent changes requires comprehensive consideration of ocean and atmospheric factors influencing regional sea ice changes, such as the sea surface temperature and atmospheric circulation patterns (Yu et al., 2024).
4.4 Snowmelt onset differences between dual-frequency scatterometers
In this study, we applied two scatterometers with different frequencies to retrieve the snowmelt onset dates of 12 Antarctic perennial ice study sites. Averaged across all study sites, the Ku-band scatterometer detected the snowmelt onset 10 d earlier than the C-band scatterometer. However, the difference between the snowmelt onset dates retrieved by the two scatterometers varies in different study regions. In the NWS region and the RS region, the snowmelt onset of the Ku-band scatterometer is 19 and 13 d earlier than that of the C-band scatterometer, respectively, both of which are significant, emphasizing the idea that the Ku-band scatterometer can detect earlier snowmelt onset dates. In the BS–AS region, due to the rapid melting in this region, the SMOs retrieved by the two scatterometers are comparable, which has been illustrated in Sect. 3.2. In the SWS region, the snowmelt onset difference between the two scatterometers is not as significant as in the NWS region, which is only 6 d. Regions farther south experience less snowmelt, attributed to the prevalent atmospheric conditions of cold and dry air and the absence of warm-air advection events from the north, suggesting there are fewer melt–freeze clusters (preliminary melt stage) or less superimposed ice formation farther south. The weaker snow metamorphism and less superimposed ice formation make the increase in the Ku-band backscatter coefficient less dramatic, failing to lead to significant snowmelt onset differences between the two scatterometers in the SWS region. Therefore, to a certain extent, the snowmelt onset difference between dual-frequency scatterometers might be an indicator of the number of melt–freeze clusters or amount of superimposed ice; i.e., the fewer melt–freeze clusters or less superimposed ice is formed, the smaller the snowmelt onset difference between the two scatterometers.
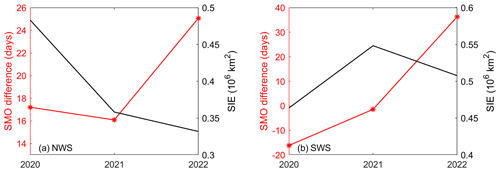
Additionally, we plotted the time series of SIE in February of the following year and the snowmelt onset difference between two scatterometers (hereafter referred to as SMO difference, Fig. 15) in the WS region. The SIE is defined here as areas that have a sea ice concentration of at least 15 %. In the NWS region, the SIE in 2022 is smaller than that in 2020, while the SMO difference has a larger value in 2022 than in 2020. When the SIE is large, it might imply that there is less superimposed ice formed (Arndt et al., 2021). This supports our speculation that the SMO difference can be an indicator of the amount of superimposed ice. A similar phenomenon was also observed from 2021 to 2022 in the SWS region. However, SIE is smaller in 2020 compared to 2021 in the SWS region. We expected a larger SMO difference in 2020 according to our speculation, but, instead, we observed a smaller or even negative difference. This is mainly due to the data gap in the Ku-band scatterometer data in December 2019, which resulted in the SMO being estimated late. In the NWS region, if SIE is considered an indicator of superimposed ice formation, based on our speculation, the SMO difference in 2021 should be higher than observed. Therefore, more studies of surface heat flux and in situ observations may need to be considered to further determine the intensity of snow metamorphism or the amount of superimposed ice to further explore the potential of SMO differences in characterizing snow cover property differences between NWS and SWS regions.
In this study, we retrieved the pre-melt and snowmelt onset dates from 2007/2008 to 2021/2022 for 12 study regions based on backscatter data from C-band ASCAT and Ku-band CFOSCAT. Between 2019/2020 and 2021/2022, CFOSCAT detected average pre-melt and snowmelt onsets on 9 November and 1 December, respectively, earlier than those of ASCAT (21 November and 11 December), which supports the conceptual model proposed by Arndt and Haas (2019) that the Ku-band scatterometer detects the snow metamorphism within the snowpack prior to the C-band scatterometer. However, both PMO and SMO differences between C- and Ku-band sensors from this study were smaller than those of Arndt and Haas (2019). It was mainly caused by sensor differences and different spatiotemporal resolutions. We also observed that the SMO difference between dual-frequency scatterometers is much larger in the NWS region than in the SWS region. We suggest that it is related to the difference in the intensity of snow metamorphism or the amount of superimposed ice in these two regions. In the SWS region with weak snow metamorphism and less superimposed ice, the SMO differences are smaller. However, field measurements are needed for further verification.
The reliability of the snowmelt detection results in this study is demonstrated by the good consistency between the SMO of this study and that of Arndt and Haas (2019). We have also justified the PMO and SMO identification criteria used and the chosen sea ice concentration threshold by conducting threshold and ice concentration sensitivity tests. Additionally, we utilized ERA5 reanalysis air temperature data and the snow buoy data to help interpret the response of the microwave scattering signal to the snowmelt process and to help distinguish temporal and spatial changes. Results showed that scatterometer-derived pre-melt onset was a good indicator of the initial warming, and snowmelt onset was typically the start of a continuous snowmelt process due to persistent thaw–freeze cycles.
In summary, this study builds on and extends the research of Arndt and Haas (2019). Based on the SMO from 1992/1993 to 2014/2015 provided by Arndt and Haas (2019) and ASCAT-derived SMO from 2007/2008 to 2021/2022 obtained in this study, it is found that the SMO change exhibited strong interannual and regional variabilities from 1992/1993 to 2021/2022. In the context of the sharp decline in Antarctic sea ice extent in recent years, SMO did not show clear, concurrent changes among different sub-regions, suggesting weak relationships between the snowmelt onset dates and SIE change.
We expect snowmelt observations from dual-frequency microwave sensors in this study will help improve the satellite-based retrieval of sea ice parameters such as sea ice thickness and sea ice type. Long-term SMO records obtained here can assist studies of polar climate change on decadal scales. Our work also provides a more comprehensive understanding of the interaction between backscattering and the snow layer, which may aid in developing snow models, e.g., the Microwave Emission Model of Layered Snowpacks 3&a (MEMLS3&a). However, CFOSCAT stopped providing valid data after December 2022. To provide in-depth information of long-term variability and trends in SMO and SMO differences between dual-frequency radar observations, Ku-band scatterometer observations have to be continued by alternative platforms, e.g., FY-3E/WindRAD, to extend the scatterometer-derived snowmelt onset detection.
The CFOSCAT backscatter data were kindly provided by the National Satellite Ocean Application Service (NSOAS; https://osdds.nsoas.org.cn/OceanDynamics, last access: 2 July 2024; NSOAS, 2024). The ASCAT backscatter data were obtained from the Scatterometer Climate Record Pathfinder (SCP) project, sponsored by NASA (http://www.scp.byu.edu/, last access: 2 July 2024; NASA SCP, 2024). Sea ice concentration data provided by the University of Bremen from 1 October 2007 to 31 June 2022 were obtained from https://www.meereisportal.de (grant REKLIM-2013-04; Meereisportal, 2024). The snow buoy measurements (sea ice depth, air temperature) from 1 July 2021 to 31 January 2022 were obtained from https://www.meereisportal.de (grant REKLIM-2013-04; Meereisportal, 2024). The ERA5 reanalysis air temperature data are available from the Copernicus Climate Change Service (C3S) Climate Data Store (CDS) (https://doi.org/10.24381/cds.adbb2d47, last access: 2 July 2024; Hersbach et al., 2023).
The supplement related to this article is available online at: https://doi.org/10.5194/tc-18-5769-2024-supplement.
RX, CH, and CZ formulated the overarching research goal. RX was responsible for code implementation and data analysis. StA provided programming assistance. RX completed the writing of the paper with invaluable writing guidance from CH. CH, StA, and CZ gave insightful comments.
At least one of the (co-)authors is a member of the editorial board of The Cryosphere. The peer-review process was guided by an independent editor, and the authors also have no other competing interests to declare.
Publisher's note: Copernicus Publications remains neutral with regard to jurisdictional claims made in the text, published maps, institutional affiliations, or any other geographical representation in this paper. While Copernicus Publications makes every effort to include appropriate place names, the final responsibility lies with the authors.
We acknowledge the support of the China Scholarship Council, who funded a 15-month research stay of Rui Xu at the Alfred Wegener Institute in Bremerhaven, Germany. Christian Haas and Stefanie Arndt received funding and support from the Alfred Wegener Institute. Additionally, Stefanie Arndt was supported by the German Research Foundation (DFG) through the Emmy Noether Programme, under the SNOWflAke project (project number 493362232). We also acknowledge the support from the National Natural Science Foundation of China (grant no. 42030406), the Shandong Joint Fund for Marine Science Research Centers (grant no. U1606405), the Marine S&T Fund of Shandong Province for the Pilot National Laboratory for Marine Science and Technology (Qingdao) (grant no. 2018SDKJ0102), and the Project of Southern Marine Science and Engineering Guangdong Laboratory (Zhuhai) (grant no. SML2023SP219). The numerical calculations in this paper have been done on the supercomputing system in the Marine Big Data Center of the Institute for Advanced Ocean Study of the Ocean University of China.
This work has been supported by the National Natural Science Foundation of China (grant no. 42030406), the Shandong Joint Fund for Marine Science Research Centers (grant no. U1606405), the Marine S&T Fund of Shandong Province for the Pilot National Laboratory for Marine Science and Technology (Qingdao) (grant no. 2018SDKJ0102), and the Project of Southern Marine Science and Engineering Guangdong Laboratory (Zhuhai) (grant no. SML2023SP219). Additional funding comes from the German Research Foundation (DFG) through the Emmy Noether Programme, under the SNOWflAke project (project no. 493362232) and the Alfred Wegener Institute.
This paper was edited by John Yackel and reviewed by two anonymous referees.
Andreas, E. L. and Ackley, S. F.: On the differences in ablation seasons of Arctic and Antarctic sea ice, J. Atmos. Sci., 39, 440–447, https://doi.org/10.1175/1520-0469(1982)039<0440:OTDIAS>2.0.CO;2, 1982.
Arndt, S. and Haas, C.: Spatiotemporal variability and decadal trends of snowmelt processes on Antarctic sea ice observed by satellite scatterometers, The Cryosphere, 13, 1943–1958, https://doi.org/10.5194/tc-13-1943-2019, 2019.
Arndt, S., Willmes, S., Dierking, W., and Nicolaus, M.: Timing and regional patterns of snowmelt on Antarctic sea ice from passive microwave satellite observations. J. Geophys. Res.-Oceans, 121, 5916–5930, https://doi.org/10.1002/2015jc011504, 2016.
Arndt, S., Haas, C., Meyer, H., Peeken, I., and Krumpen, T.: Recent observations of superimposed ice and snow ice on sea ice in the northwestern Weddell Sea, The Cryosphere, 15, 4165–4178, https://doi.org/10.5194/tc-15-4165-2021, 2021.
Bozkurt, D., Bromwich, D. H., Carrasco, J., Hines, K. M., Maureira, J. C., and Rondanelli, R.: Recent Near-surface Temperature Trends in the Antarctic Peninsula from Observed, Reanalysis and Regional Climate Model Data, Adv. Atmos. Sci., 37, 477–493, https://doi.org/10.1007/s00376-020-9183-x, 2020.
Colbeck, S. C.: A Review of Sintering in Seasonal Snow, U.S. Army Cold Regions Research and Engineering Laboratory, ISSN 0501-5782, 1997.
Drinkwater, M. R. and Liu, X.: Seasonal to interannual variability in Antarctic sea-ice surface melt, IEEE T. Geosci. Remote, 38, 1827–1842, https://doi.org/10.1109/36.851767, 2000.
Drinkwater, M. R. and Lytle, V. I.: ERS 1 radar and field-observed characteristics of autumn freeze-up in the Weddell Sea, J. Geophys. Res.-Oceans, 102, 12593–12608, https://doi.org/10.1029/97JC00437, 1997.
Forster, R. R., Long, D. G., Jezek, K. C., Drobot, S. D., and Anderson, M. R.: The onset of Arctic sea-ice snowmelt as detected with passive- and active-microwave remote sensing, Ann. Glaciol., 33, 85–93, https://doi.org/10.3189/172756401781818428, 2001.
Gohin, F. and Cavanié, A.: A first try at identification of sea ice using the three beam scatterometer of ERS-1, Int. J. Remote Sens., 15, 1221–1228, https://doi.org/10.1080/01431169408954156, 1994.
Haas, C.: The seasonal cycle of ERS scatterometer signatures over perennial Antarctic sea ice and associated surface ice properties and processes, Ann. Glaciol., 33, 69–73, https://doi.org/10.3189/172756401781818301, 2001.
Haas, C., Nicolaus, M., Willmes, S., Worby, A., and Flinspach, D.: Sea ice and snow thickness and physical properties of an ice floe in the western Weddell Sea and their changes during spring warming, Deep-Sea Res. Pt. II, 55, 963–974, https://doi.org/10.1016/j.dsr2.2007.12.020, 2008.
Haas, C., Thomas, D. N., and Bareiss, J.: Surface properties and processes of perennial Antarctic sea ice in summer, J. Glaciol., 47, 613–625, https://doi.org/10.3189/172756501781831864, 2001.
Hersbach, H., Bell, B., Berrisford, P., Biavati, G., Horányi, A., Muñoz Sabater, J., Nicolas, J., Peubey, C., Radu, R., Rozum, I., Schepers, D., Simmons, A., Soci, C., Dee, D., and Thépaut, J.-N.: ERA5 hourly data on single levels from 1940 to present, Copernicus Climate Change Service (C3S) Climate Data Store (CDS) [data set], https://doi.org/10.24381/cds.adbb2d47, 2023.
Jeffries, M., Veazey, A., Morris, K., and Krouse, H. R.: Depositional environment of the snow cover on West Antarctic pack-ice floes, Ann. Glaciol., 20, 33–38, https://doi.org/10.3189/1994AoG20-1-33-38, 1994.
Jena, B., Bajish, C. C., Turner, J., Ravichandran, M., Anilkumar, N., and Kshitija, S.: Record low sea ice extent in the Weddell Sea, Antarctica in April/May 2019 driven by intense and explosive polar cyclones, Npj Climate Atmos. Sci., 5, 19, https://doi.org/10.1038/s41612-022-00243-9, 2022.
Kawamura, T., Jeffries, M. O., Tison, J.-L., and Krouse, H. R.: Superimposed-ice formation in summer on Ross Sea pack-ice floes, Ann. Glaciol., 39, 563–568, https://doi.org/10.3189/172756404781814168, 2017.
King, J. C., Marshall, G. J., Colwell, S., Arndt, S., Allen-Sader, C., and Phillips, T.: The Performance of the ERA-Interim and ERA5 Atmospheric Reanalyses Over Weddell Sea Pack Ice, J. Geophys. Res.-Oceans, 127, e2022JC018805, https://doi.org/10.1029/2022JC018805, 2022.
Lindsley, R. D. and Long, D. G.: Enhanced-resolution reconstruction of ASCAT backscatter measurements, IEEE T. Geosci. Remote, 54, 2589–2601, https://doi.org/10.1109/TGRS.2015.2503762, 2016.
Liu, J., Lin, W., Dong, X., Lang, S., Yun, R., Zhu, D., Zhang, K., Sun, C., Mu, B., Ma, J., He, Y., Wang, Z., Li, X., Zhao, X., and Jiang, X.: First Results from the Rotating Fan Beam Scatterometer Onboard CFOSAT, IEEE T. Geosci. Remote, 58, 8793–8806, https://doi.org/10.1109/tgrs.2020.2990708, 2020.
Long, D. G., Hardin, P. J., and Whiting, P. T.: Resolution enhancement of spaceborne scatterometer data, IEEE T. Geosci. Remote, 31, 700–715, https://doi.org/10.1109/36.225536, 1993.
Massom, R. A., Eicken, H., Hass, C., Jeffries, M. O., Drinkwater, M. R., Sturm, M., Worby, A. P., Wu, X., Lytle, V. I., Ushio, S., Morris, K., Reid, P. A., Warren, S. G., and Allison, I.: Snow on Antarctic sea ice, Rev. Geophys., 39, 413–445, https://doi.org/10.1029/2000rg000085, 2001.
Meereisportal: Das Meereisportal – Logbuch einer schwindenden Welt, Meereisportal [data set], https://www.meereisportal.de/ (last access: 2 July 2024), 2024.
Mortin, J., Howell, S. E. L., Wang, L., Derksen, C., Svensson, G., Graversen, R. G., and Schrøder, T. M.: Extending the QuikSCAT record of seasonal melt–freeze transitions over Arctic sea ice using ASCAT, Remote Sens. Environ., 141, 214–230, https://doi.org/10.1016/j.rse.2013.11.004, 2014.
Mou, X., Lin, W., and He, Y: Towards a consistent wind data record for the cfosat scatterometer, Remote Sens., 15, 2081, https://doi.org/10.3390/rs15082081, 2023.
Nandan, V., Geldsetzer, T., Mahmud, M., Yackel, J., and Ramjan, S.: Ku-, X- and C-Band Microwave Backscatter Indices from Saline Snow Covers on Arctic First-Year Sea Ice, Remote Sens., 9, 757, https://doi.org/10.3390/rs9070757, 2017.
Nicolaus, M., Haas, C., and Willmes, S.: Evolution of first-year and second-year snow properties on sea ice in the Weddell Sea during spring-summer transition, J. Geophys. Res.-Atmos., 114, D17109, https://doi.org/10.1029/2008JD011227, 2009.
Nicolaus, M., Hoppmann, M., Arndt, S., Hendricks, S., Katlein, C., Nicolaus, A., Rossmann, L., Schiller, M., and Schwegmann, S.: Snow Depth and Air Temperature Seasonality on Sea Ice Derived From Snow Buoy Measurements, Front. Marine Sci., 8, 655446, https://doi.org/10.3389/fmars.2021.655446, 2021.
NSOAS: The National Satellite Ocean Application Service [data set], https://osdds.nsoas.org.cn/, last access: 2 July 2024.
NASA SCP: NASA Scatterometer Climate Record Pathfinder [data set], https://www.scp.byu.edu/, last access: 2 July 2024.
Onstott, R. G. and Shuchman, R. A.: SAR Measurements of Sea Ice, in: Synthetic Aperture Radar Marine User's Manual, edited by: Jackson, C. R. and Apel J. R., 81–115, https://www.sarusersmanual.com/ (last access: 2 July 2024), 2004.
Parkinson, C. L.: A 40-y record reveals gradual Antarctic sea ice increases followed by decreases at rates far exceeding the rates seen in the Arctic, P. Natl. Acad. Sci. USA, 116, 14414–14423, https://doi.org/10.1073/pnas.1906556116, 2019.
Purich, A. and Doddridge, E. W.: Record low Antarctic sea ice coverage indicates a new sea ice state, Commun. Earth Environ., 4, 314, https://doi.org/10.1038/s43247-023-00961-9, 2023.
Remund, Q. P. and Long, D. G.: Sea ice extent mapping using Ku band scatterometer data, J. Geophys. Res., 104, 11515–11527, https://doi.org/10.1029/98JC02373, 1999.
Schroeter, S. and Sandery, P. A.: Large-ensemble analysis of Antarctic sea ice model sensitivity to parameter uncertainty, Ocean Model., 177, 102090, https://doi.org/10.1016/j.ocemod.2022.102090, 2022.
Spreen, G., Kaleschke, L., and Heygster, G.: Sea ice remote sensing using AMSR-E 89-GHz channels, J. Geophys. Res., 113, C02S03, https://doi.org/10.1029/2005JC003384, 2008.
Stammerjohn, S. E., Martinson, D. G., Smith, R. C., Yuan, X., and Rind, D.: Trends in Antarctic annual sea ice retreat and advance and their relation to ENSO and Southern Annular Mode variability, J. Geophys. Res., 113, C03S90, https://doi.org/10.1029/2007JC004269, 2008.
Stroeve, J. C., Markus, T., Boisvert, L., Miller, J., and Barrett, A.: Changes in Arctic melt season and implications for sea ice loss, Geophys. Res. Lett., 41, 1216–1225, https://doi.org/10.1002/2013GL058951, 2014.
Sturdivant, E. J., Frey, K. E., and Urban, F. E.: Snowmelt detection from QuikSCAT and ASCAT satellite radar scatterometer data across the Alaskan North Slope, GIScience & Remote Sensing, 56, 87–108, https://doi.org/10.1080/15481603.2018.1493045, 2018.
Takei, I. and Maeno, N.: The low-frequency conductivity of snow near the melting temperature, Ann. Glaciol., 32, 14–18, https://doi.org/10.3189/172756401781819193, 2001.
Turner, J., Holmes, C., Caton Harrison, T., Phillips, T., Jena, B., Reeves-Francois, T., Ryan F., Elizabeth R. T., and Bajish, C. C.: Record Low Antarctic Sea Ice Cover in February 2022, Geophys. Res. Lett., 49, e2022GL098904, https://doi.org/10.1029/2022GL098904, 2022.
Vihma, T., Johansson, M. M., and Launiainen, J.: Radiative and turbulent surface heat fluxes over sea ice in the western Weddell Sea in early summer, J. Geophys. Res.-Oceans, 114, C04019, https://doi.org/10.1029/2008JC004995, 2009.
Wang, X.-D., Li, X.-W., Wang, C., and Li, X.-G.: Antarctic ice-sheet near-surface snowmelt detection based on the synergy of SSM/I data and QuikSCAT data, Geosci. Front., 9, 955–963, https://doi.org/10.1016/j.gsf.2017.09.007, 2018.
Willmes, S., Bareiss, J., Haas, C., and Marcel N.: The importance of diurnal processes for the Seasonal cycle of Sea-ice microwave brightness temperatures during early Summer in the Weddell Sea, Antarctica, Ann. Glaciol., 44, 297–302, https://doi.org/10.3189/172756406781811817, 2006.
Willmes, S., Haas, C., Nicolaus, M., and Bareiss, J.: Satellite microwave observations of the interannual variability of snowmelt on sea ice in the Southern Ocean, J. Geophys. Res., 114, C03006, https://doi.org/10.1029/2008jc004919, 2009.
Xu, R., Zhao, C., Zhai, X., and Chen, G.: Arctic sea ice type classification by combining CFOSCAT and AMSR-2 data, Earth Space Sci., 9, e2021EA002052, https://doi.org/10.1029/2021EA002052, 2022.
Yackel, J., Barber, D., Papakyriakou, T., and Breneman, C.: First-year sea ice spring melt transitions in the Canadian Arctic Archipelago from time-series synthetic aperture radar data, 1992–2002, Hydrol. Process., 21, 253–265, https://doi.org/10.1002/hyp.6240, 2007.
Yu, L., Zhong, S., Vihma, T., Sui, C., and Sun, B.: Linking the Antarctic sea ice extent changes during 1979–2020 to seasonal modes of Antarctic sea ice variability, Environ. Res. Lett., 17, 114026, https://doi.org/10.1088/1748-9326/ac9c73, 2022.
Yu, L., Zhong, S., Sui, C., and Sun, B.: Sea surface temperature anomalies related to the Antarctic sea ice extent variability in the past four decades, Theor. Appl. Climatol., 155, 2415–2426, https://doi.org/10.1007/s00704-023-04820-7, 2024.
Zheng, L., Cheng, X., Chen, Z., Wang, S., Liang, Q., and Wang, K.: Global Snowmelt Onset Reflects Climate Variability: Insights from Spaceborne Radiometer Observations, J. Climate, 35, 2945–2959, https://doi.org/10.1175/jcli-d-21-0265.1, 2022.


