the Creative Commons Attribution 4.0 License.
the Creative Commons Attribution 4.0 License.
Multi-physics ensemble modelling of Arctic tundra snowpack properties
Georgina J. Woolley
Nick Rutter
Leanne Wake
Vincent Vionnet
Chris Derksen
Richard Essery
Philip Marsh
Rosamond Tutton
Branden Walker
Matthieu Lafaysse
David Pritchard
Sophisticated snowpack models such as Crocus and SNOWPACK struggle to properly simulate profiles of density and specific surface area (SSA) within Arctic snowpacks due to underestimation of wind-induced compaction, misrepresentation of basal vegetation influencing compaction and metamorphism, and omission of water vapour flux transport. To improve the simulation of profiles of density and SSA, parameterisations of snow physical processes that consider the effect of high wind speeds, the presence of basal vegetation, and alternate thermal conductivity formulations were implemented into an ensemble version of the Soil, Vegetation, and Snow version 2 (SVS2-Crocus) land surface model, creating Arctic SVS2-Crocus. The ensemble versions of the default and Arctic SVS2-Crocus were driven with in situ meteorological data and evaluated using measurements of snowpack properties (snow water equivalent, SWE; depth; density; and SSA) at Trail Valley Creek (TVC), Northwest Territories, Canada, over 32 years (1991–2023). Results show that both the default and Arctic SVS2-Crocus can simulate the correct magnitude of SWE (root-mean-square error, RMSE, for both ensembles – 55 kg m−2) and snow depth (default RMSE – 0.22 m; Arctic RMSE – 0.18 m) at TVC in comparison to measurements. Wind-induced compaction within Arctic SVS2-Crocus effectively compacts the surface layers of the snowpack, increasing the density, and reducing the RMSE by 41 % (176 kg m−3 to 103 kg m−3). Parameterisations of basal vegetation are less effective in reducing compaction of basal snow layers (default RMSE – 67 kg m−3; Arctic RMSE – 65 kg m−3), reaffirming the need to consider water vapour flux transport for simulation of low-density basal layers. The top 100 ensemble members of Arctic SVS2-Crocus produced lower continuous ranked probability scores (CRPS) than the default SVS2-Crocus when simulating snow density profiles. The top-performing members of the Arctic SVS2-Crocus ensemble featured modifications that raise wind speeds to increase compaction in snow surface layers and to prevent snowdrift and increase viscosity in basal layers. Selecting these process representations in Arctic SVS2-Crocus will improve simulation of snow density profiles, which is crucial for many applications.
- Article
(5083 KB) - Full-text XML
-
Supplement
(498 KB) - BibTeX
- EndNote
Seasonal snow cover in the Arctic is an important water reservoir and plays an integral role in the global surface energy balance and the ground thermal regime (Appel et al., 2019; Gouttevin et al., 2018; Barrere et al., 2017). Incorrect simulation of the seasonal evolution and vertical layering of Arctic snowpack properties e.g. depth, density, snow water equivalent (SWE), and specific surface area (SSA) can lead to errors in the simulation of snow thermal properties, influencing soil temperatures and respiration impacting Arctic winter carbon fluxes (Dutch et al., 2022). Furthermore, an understanding of Arctic snowpack conditions is crucial for wildlife welfare, as the physical properties of snow affect movement (Le Corre et al., 2017), access to food, and foraging ability (Berteaux et al., 2017; Ouellet et al., 2016); support reproduction and corresponding population dynamics (Domine et al., 2018b; Boelman et al., 2019); and provide a suitable space for subnivean life (Berteaux et al., 2017; Domine et al., 2018b). Changes to snow properties can also have a human impact, affecting transportation (Hovelsrud et al., 2012), cultural practices (Contosta et al., 2019) and infrastructure (Callaghan et al., 2012). The ability to accurately simulate Arctic snow properties depends on the complexity of snowpack models, which differ in their representation of layering and parameterisation of snow physical processes (Krinner et al., 2018). In the Arctic, where measurements are rare, multi-layered snowpack models are necessary to provide the detailed information on the seasonal evolution and layering of snowpack properties needed for an understanding of the surface energy balance (Flanner et al., 2011) and soil temperatures (Meredith et al., 2019).
Detailed multi-layered snowpack models primarily developed for avalanche forecasting, i.e. Crocus (Vionnet et al., 2012) and SNOWPACK (Bartelt and Lehning, 2002), do not perform well when applied within Arctic environments (Domine et al., 2019; Fourteau et al., 2021; Barrere et al., 2017). Despite showing reasonable agreement in their simulation of snow depth and SWE of Arctic snowpacks (Barrere et al., 2017; Gouttevin et al., 2018; Krinner et al., 2018; Domine et al., 2019; Royer et al., 2021; Krampe et al., 2021; Lackner et al., 2022) both models often simulate profiles of increasing density with snow depth because both Crocus and SNOWPACK were originally developed to simulate alpine snow. Further uncertainties arise in the simulation of snow density due to underestimation in wind-induced compaction (Barrere et al., 2017; Royer et al., 2021; Lackner et al., 2022), misrepresentation of the impact of basal vegetation on compaction and metamorphism (Gouttevin et al., 2018; Royer et al., 2021), thermal conductivity formulation (Royer et al., 2021; Dutch et al., 2022), and omission of water vapour flux transport (Brondex et al., 2023) within both models.
In the Arctic, high wind speeds compact the snowpack surface, creating wind slab snow layers (King et al., 2020; Derksen et al., 2014). The effect of wind on surface snow density has been found to be underestimated in Crocus, leading to underestimations in simulated surface snow density (Barrere et al., 2017). Attempts to account for an underestimation in wind speed have been proposed by Barrere et al. (2017) and Royer et al. (2021), where wind speed during snow precipitation events and the rate of snow compaction were increased. Based upon analysis of field measurements, Barrere et al. (2017) and Royer et al. (2021) also increased the maximum density constraint from 350 to 600 kg m−3 for Arctic applications.
Basal vegetation (shrubs and sedges) modifies temperature gradients within the snowpack by reducing compaction and enhancing snow metamorphism, which promotes the formation of depth hoar (Domine et al., 2016, 2022). The ability of basal vegetation to promote the development of depth hoar is currently not considered within Crocus or SNOWPACK, where compaction due to the weight of the overlying snow is the dominant process in shaping density profiles (Vionnet et al., 2012; Bartelt and Lehning, 2002). To consider the presence of basal vegetation, Gouttevin et al. (2018) and Royer et al. (2021) proposed deactivating wind compaction and increasing snow viscosity below a set vegetation height, which contributed towards density reduction and enhanced grain growth in basal layers.
Thermal conductivity of snow is often computed as a function of density within many snowpack models (Gouttevin et al., 2018), with a number of different relationships proposed (e.g. Yen, 1981; Calonne et al., 2011; Sturm et al., 1997). The parameterisation of Sturm et al. (1997) has been found to produce better results for Arctic snow than the default Crocus parameterisation of Yen (1981), due to its development on Arctic and sub-Arctic snow, and has recently been implemented into Crocus (Royer et al., 2021; Calonne et al., 2011). The thermal conductivity formulations of Calonne et al. (2011), who used 3D tomographic images of most snow types, and Fourteau et al. (2021), who proposed a formulation suitable for temperatures within Arctic snowpacks, have also been found to improve the simulation of snow thermal conductivity at an Arctic site (Dutch et al., 2022). The Calonne et al. (2011) formulation is available for use within the ensemble system version of Crocus (Ensemble System Crocus, ES-CROC; Lafaysse et al., 2017); however, the parameterisation of Fourteau et al. (2021) is yet to be implemented within Crocus.
Strong temperature gradients within an Arctic snowpack generate vertical water vapour fluxes that redistribute mass from the bottom to the top of the snowpack, leading to the formation of basal depth hoar layers (Bouvet et al., 2023; Weise, 2017). Attempts have been made to implement water vapour diffusion into Crocus (Touzeau et al., 2018), SNOWPACK (Jafari et al., 2020), and SNTHERM (Jordan, 1991). However, no approach was successful in accounting for all aspects of vapour diffusion or was able to be numerically stable at the typical time steps of snowpack models, and this aspect is therefore currently not simulated (Brondex et al., 2023).
An ensemble modelling approach allows evaluation of uncertainties in all the main snowpack process representations, both individually and in combination with each other, to better quantify overall modelling error (Lafaysse et al., 2017; Essery et al., 2013). Previous attempts to simulate Arctic snow density profiles focus on individual modifications to existing snow physical processes that account for high wind speeds, the presence of basal vegetation, and/or better simulations of snow thermal conductivity (Barrere et al., 2017; Lackner et al., 2022; Royer et al., 2021; Gouttevin et al., 2018). Uncertainties that arise from interaction between model components, site-specific calibration of parameter choices, and limited evaluation datasets (one site, few snow seasons; e.g. Gouttevin et al., 2018; Barrere et al., 2017) are hard to evaluate through this approach. Large-ensemble studies evaluating snowpack models of different complexities (SnowMIP, Etchevers et al., 2004; SnowMIP2, Rutter et al., 2009; ESM-SnowMIP, Krinner et al., 2018) have been effective in demonstrating how ensemble frameworks can aid analysis of specific parameterisations that lead to large model disagreement and how the combination of such parameterisations can yield significant divergences in model behaviour (Essery et al., 2013). The latter approach has been investigated through the development of the Jules Investigation Model (JIM; Essery et al., 2013), the Factorial Snow Model (FSM; Essery, 2015) and Ensemble System Crocus (ESCROC; Lafaysse et al., 2017), which aim to facilitate exploration of parameterisation choice and uncertainty through an ensemble framework. However, no ensemble study has yet evaluated the uncertainty associated with modelling error for simulation of snowpack properties in an Arctic tundra environment.
This study uses the multi-physics ensemble version of Crocus (Lafaysse et al., 2017; Vionnet et al., 2012) embedded within the Soil, Vegetation, and Snow version 2 (SVS2) land surface model (hereafter referred to as SVS2-Crocus; Garnaud et al., 2019; Vionnet et al., 2022) to evaluate the impact on simulated Arctic snowpack properties by modifying parameterisations of falling snow density, snowdrift, compaction, and thermal conductivity that have been proposed within the previous literature. Using an ensemble of simulations, the effects and interactions of Arctic parameterisations on the simulation of SWE, snow depth, and bulk density are evaluated over a 32-year period at Trail Valley Creek (TVC), Northwest Territories, Canada. We then evaluate the impact of Arctic parameterisations on the simulation of snowpack microstructure properties, density, and SSA with detailed measurements from six winter field campaigns to identify combinations of preferential parameters and process representations for the application of SVS2-Crocus within an Arctic environment.
The TVC (68°44′ N, 133°33′ W) research watershed lies within the Inuvialuit Settlement Region of the lower Mackenzie Valley, 50 km northeast of Inuvik, Northwest Territories, Canada, on the northern edge of the tundra–taiga ecotone. Vegetation primarily consists of low shrubs (0.2–0.7 m), lichens, grasses, and mosses (Marsh et al., 2010; Walker and Marsh, 2021; King et al., 2018) with some sparse patches of taller shrubs (1–2 m) and black spruce evergreen needleleaf forest (Walker and Marsh, 2021). The terrain consists of mineral earth hummocks that range in diameter between 0.4 to 1.0 m and inter-hummock areas of peat (Quinton and Marsh, 1999). TVC is a tundra environment with continuous permafrost that experiences approximately 8 months of snow cover annually, which varies spatially due to vegetation, wind speed, and topography, with snow depth ranging from 0.1 to 4 m (Pomeroy et al., 1993; Derksen et al., 2014).
3.1 Field methods
Half-hourly snow depth measurements were made using an SR50A sensor (Campbell Scientific) at the TVC Main Meteorological Station (TMM) for 32 winter seasons (from 1990–1991 to 2022–2023). Depths below 0 m and above instrument sensor height (1.63 m) and abrupt jumps or spikes (negative or positive) that lie outside the reasonable range of values within the SR50A snow depth data were removed. Peak winter SWE, density, and depth measurements were collected across a network of locations for the same winters using an ESC-30-style snow corer tube (Walker and Marsh, 2021). Detailed vertical profiles of density and SSA were measured in snow pits during six field campaigns across four winters (16 March 2018, 15–18 November 2018, 19–25 January 2019, 26 March 2019, see Dutch et al., 2022; 21 March 2022 and 27 March 2023, this paper). All measurement and pit locations differed from year to year but were selected based upon their proximity to TMM while sampling across vegetation characteristics (shrubs, mosses). In all snow pits (n=32), stratigraphic layer boundaries and snow types were identified through visual inspection following Fierz et al. (2009) and hand hardness tests. Density profiles were obtained by extracting a snow sample using a 100 cm3 density cutter at a 3 cm vertical resolution. SSA was measured at the same vertical resolution using an A2 Photonic Sensor IceCube (Zuanon, 2013), following principles outlined in Gallet et al. (2009).
3.2 Snowpack model
3.2.1 SVS2-Crocus
The multi-physics ensemble version of the snow model Crocus (ESCROC; Lafaysse et al., 2017) is embedded within the Soil, Vegetation, and Snow version 2 (SVS2) land surface model developed at Environment and Climate Change Canada (ECCC; Vionnet et al., 2022; Garnaud et al., 2019). The implementation of Crocus within SVS2 relies on the recently developed externalised version of Crocus that aims to facilitate the coupling of Crocus with other land surface models (e.g. Mazzotti et al., 2024). Crocus is a 1D multi-layer snowpack model that simulates vertical layering and the seasonal evolution of snowpack physical properties. For each snow layer, Crocus computes the mass, density, temperature, liquid water content, age, and snow microstructure properties (optical diameter, sphericity). A full description of Crocus can be found in Vionnet et al. (2012) and Lafaysse et al. (2017). To obtain detailed stratigraphic information, the maximum number of simulated snow layers was set to 20. Snowpack properties were simulated in 1D at an hourly resolution. In situ measurements of soil properties (Boike et al., 2020) and land cover type from the ESA CC1 LC global map (European Space Agency Climate Change Initiative Land Cover; http://esa-landcover-cci.org, last access: September 2023), were used to specify soil and vegetation characteristics in SVS2. Simulations were run from September 1991 to September 2023 with gap-filled meteorological data (see Sect. 3.2.2). SVS2-Crocus requires the atmospheric forcing of air temperature, specific humidity, wind speed at a known level above the surface, incoming longwave and shortwave radiation, and precipitation rate (separated into liquid and solid precipitation). Precipitation was partitioned into rain and snow using a 1 °C temperature threshold during processing. A sensitivity analysis of the correct temperature threshold at which to partition precipitation was carried out (testing values between 0 and 5 °C) by comparing observations of the precipitation type from TMM and the immediately adjacent (∼5 m) Meteorological Service of Canada (MSC) weather station, finding 1 °C as the most suitable option for TVC. Specific humidity was converted from relative humidity following Bolton (1980). The option to activate mass loss due to blowing snow sublimation through the parameterisation of Gordon et al. (2006) was selected for all simulations, as high wind speeds at TVC lead to frequent blowing snow events and associated mass loss due to sublimation (Pomeroy et al., 1997). The snow albedo parameterisation in SVS2-Crocus uses a snow ageing coefficient to indirectly represent the impact of the deposition of light absorbing impurities on the snow surface. This coefficient has a default value of 60 d, which has been calibrated at the Col de Porte experimental site, France (Table 4; Vionnet et al., 2012). As the light-absorbing impurities, associated fluxes, and radiative forcing are of a lower magnitude within Arctic snowpacks (Skiles et al., 2018), the snow surface ageing coefficient was increased to 900 d, as was done previously by Brun et al. (2011) to simulate snowpack evolution in Antarctica.
3.2.2 Meteorological driving data
Hourly fields of meteorological variables were obtained from TMM, where gaps of 3 h or shorter were filled by linear interpolation (Tutton et al., 2024). Longer gaps were first filled using the MSC weather station. If data from the MSC station were not available, meteorological measurements from the Inuvik Mike Zubko airport or the Inuvik Climate Station, situated 50 km south of TVC, were used to fill the gap. If data from all stations were unavailable, the remaining gaps were filled with ERA-5 reanalysis data. The percentage of measurements taken from TMM varied from 98.7 % to 50.2 %, data used to gap-fill from the Inuvik Climate Station varied from 1.3 % to 33.3 %, and ERA5 varied from 1.4 % to 49.8 % over the 32-year period (Tutton et al., 2024).
3.2.3 SVS2-Crocus ensemble
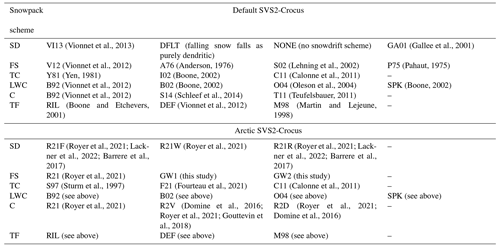
The multi-physics ensemble modelling framework (ESCROC) was designed by Lafaysse et al. (2017) to account for numerical snow modelling errors in ensemble forecasting and ensemble assimilation systems. It included additional parameterisations of snow processes in the snowpack model Crocus for the evolution of midlatitude snowpacks. The spread of the ESCROC ensemble represents model uncertainty due to parameterisation of snow processes within midlatitude environments. We develop an Arctic version of ESCROC that relies on existing parameterisations that have been developed for Arctic snowpacks but that have never been tested within a consistent model framework. The model experiment focuses on three key processes as displayed in the schematic of Fig. 1: increased compaction of surface snow due to high wind speeds (wind effect), reduced compaction and snowdrift due to the presence of basal vegetation (basal vegetation effect), and alternate thermal conductivity formulations better suited for Arctic snow types (thermal conductivity). The Arctic modifications implemented into the ESCROC framework are available in an official version of SVS2-Crocus (see the “Code availability” section below) and aim to represent model uncertainty within an Arctic environment.
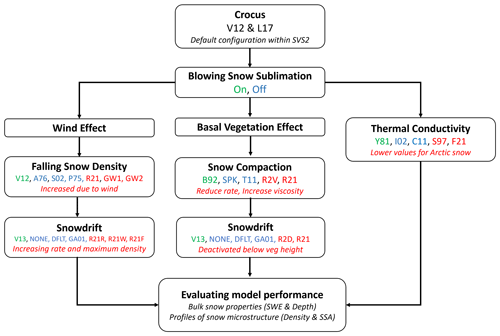
Figure 1Model ensemble schematic showing the modified SVS2-Crocus schemes for Arctic application. Green initials illustrate the default parameterisations, blue initials illustrate other existing parameterisations, and red illustrates the Arctic-focused parameterisations implemented. For a description of both green and blue options, see Lafaysse et al. (2017) and Vionnet et al. (2012). The options in red are described in the main text. A description of the acronyms can be found in Table A1.
Wind effect comprises three modifications within the falling snow density and snowdrift schemes. Following Royer et al. (2021) and Lackner et al. (2022), we modified the default parameterisation of Vionnet et al. (2012) (Eq. 1) that computes falling snow density as a function of wind speed, U, and air temperature, Ta, as
where Tfus is the temperature of the melting point for water, ap=109 kg m−3, bp=6 kg m−3 K−1, and cp=26 kg m s. Royer et al. (2021) increased the wind speed parameter cp by a factor of 2 and found a reduction in the root-mean-square error (RMSE) of surface layer density from 86.5 % to 63.4 % when applied at four Arctic reference sites (TVC, Cambridge Bay, Bylot Island, and Samoylov). Motivated by this work, Lackner et al. (2022) doubled the density parameter ap and multiplied cp by 5 at their reference site, Umiujaq, Canada. These modifications reduced the error in simulated surface density from 127 to 38 kg m−3. Attempts to apply the modification proposed by Lackner et al. (2022) to TVC within this study found that the increased parameters produced unrealistic densities throughout the entire snowpack (>800 kg m−3). We therefore chose to implement the parameters proposed by Royer et al. (2021) (R21) and two further parameter values of cp=39 kg m s and cp=32.5 kg m s (described as GW1 and GW2 in Fig. 1) to account for the uncertainties associated with the impact of wind speed on snowfall density (Walter et al., 2023).
Wind speed also acts to increase surface snow density (ρ) during drifting and blowing snow events with or without concurrent snowfall. This is incorporated within Crocus following the parameterisation of Vionnet et al. (2013):
where for a given snow layer iρmax is the maximum density of the snow surface layers, and windeffect is a parameter that modulates an increased rate in density for a given snow transport intensity. The parameterisation was developed for alpine snow and aims to represent the effect of surface snow fragmentation during wind-induced snow transport and the associated increase in surface snow density (Comola et al., 2017; Walter et al., 2023). Previous studies have shown that the windeffect parameter needs to be adjusted for Arctic snow to account for high wind speeds (Barrere et al., 2017; Royer et al., 2021). We first follow the approach of Royer et al. (2021) and increase the windeffect coefficient from 1 to 3 to account for an underestimation of the effect of wind on surface snow density, implemented into the Arctic ensemble as R21W. Royer et al. (2021) found that the increased rate reduced the RMSE from 73.9 % to 63.4 % and mean bias from 11.2 % to 9.6 % in density layers at their four reference sites.
As a second option for the snowdrift scheme, we raise the maximum density of snow impacted by wind from 350 to 600 kg m−3, following the work of Barrere et al. (2017), Royer et al. (2021), and Lackner et al. (2022) (R21R). Measured Arctic snow density profiles from TVC (Rutter et al., 2019; Derksen et al., 2014), Eureka (King et al., 2020), and Cambridge Bay (Meloche et al., 2022; Royer et al., 2021) all show densities exceeding current modelled density within surface snow layers (Domine et al., 2019). We create one final wind effect option by combining the increased windeffect coefficient and raised the maximum density of snow impacted by wind to investigate process interactions (R21F).
The basal vegetation effect comprises three modifications to snow compaction and snowdrift schemes. The default configuration for snow compaction within Crocus follows that of Vionnet et al. (2012) and is controlled by the weight of the overlying snow and viscosity of each snow layer, working to increase the density of the layer below according to
where D is the layer thickness, dt is the model time step, σ is the weight of the overlying snow, and η is snow viscosity. Following the approaches of Domine et al. (2016), Gouttevin et al. (2018), and Royer et al. (2021), we deactivated wind compaction and increased η under a set vegetation height that reduced the rate of densification through compaction processes. We implemented a vegetation height of 0.1 m after analysis of basal vegetation heights around TMM. Below the vegetation height, we deactivate the snowdrift scheme (R2D) (Royer et al., 2021) and increase snow viscosity by a factor of 10 (R2V) (Domine et al., 2016; Royer et al., 2021). Modifications R2D and R2V are also investigated together in combination as R21.
The default parameterisation for snow thermal conductivity within SVS2-Crocus (Y81; Yen, 1981) was interchangeable with two other parameterisations (I02, Boone, 2002; C11, Calonne et al., 2011) within ESCROC. Two additional parameterisations of Sturm et al. (1997) and Fourteau et al. (2021) were implemented into Arctic SVS2-Crocus, which have been found to improve the simulation of snow thermal conductivity at TVC (Dutch et al., 2022) due to their development specific to Arctic and sub-Arctic snow (Eq. 18, Fourteau et al., 2021). The formulation of Calonne et al. (2011) was included within the Arctic ensemble due to their use of 3D tomographic images of most snow types (including depth hoar grains). We therefore developed thermal conductivity to include these formulations as S97 (Sturm et al., 1997), F21 (Fourteau et al., 2021) and C11 (Calonne et al., 2011).
The default and Arctic SVS2-Crocus ensembles considered in this study are composed of a random selection of 120 members, where each member draws a random combination of parameterisations from only the default (default SVS2-Crocus) or Arctic (Arctic SVS2-Crocus) versions of SVS2-Crocus. A random selection of 120 members can be considered a suitable selection process and number to capture the uncertainty in a snow model ensemble (Cluzet et al., 2021). We then allow members to draw a random combination of parameterisations from both the default and Arctic versions of SVS2-Crocus to produce a mixed ensemble. If simulations produced by Arctic parameterisations can be statistically distinguished from those originating from the default parameterisations within the mixed ensemble (i.e. higher frequency of occurrence among the best-performing members), the Arctic parameterisations are deemed to be adding value to the simulation of snowpack properties.
3.3 Model evaluation metrics
Three evaluation metrics were considered to evaluate the simulation of snow depth, SWE, bulk density, and profiles of density and SSA (as per Table 1): the root-mean-square error (RMSE), spread skill (SS), and continuous ranked probability score (CRPS). We use RMSE as a measure of the accuracy between modelled and measured outcomes. The SS of an ensemble measures the ratio of the root-mean ensemble spread to the RMSE of the ensemble against a measured result (Lafaysse et al., 2017). An SS value of 1 indicates perfect dispersion (i.e. representative of typical error) and that the measurements lie within the ensemble spread (Fortin et al., 2014). The CRPS assesses the accuracy of a probabilistic forecast in comparison to a measured result, calculated by comparing the cumulative distribution function (CDF) for the simulated result against the measured dataset (Bröcker, 2012). The CRPS value has the same unit as the measured variable where a score of 0 is an accurate simulation (Lafaysse et al., 2017). The RMSE, SS, and CRPS scores are generated for the overall ensemble (error and spread of the ensemble as a whole). When computed for an individual ensemble member, the CRPS score corresponds to the mean absolute error (MAE) of the simulation. We refer to the MAE of an individual ensemble member as the CRPS score (Sect. 4.3). CRPS scores are ranked for the identification of best-performing ensemble members. For profiles of density and SSA, all statistics are calculated for the depth hoar fraction (DHF). The DHF of each measured profile was determined by identifying transitions in the density and/or SSA. The transition between the SSA for different layers is often more distinct than density (Rutter et al., 2009), providing a sharper transition between wind slab (WS) and depth hoar that can be visibly identified. Where the transition between the snow types occurs, the density and/or SSA value is noted and cross referenced with those presented in Fig. 9 of Rutter et al. (2009). DHF values varied from 42 % to 74 % across the investigated snow seasons and are applied to the normalised profiles of simulated density and SSA. Measured and simulated density and SSA profiles report different vertical resolutions; therefore, we rescale each individual profile to a 0.005 m grid interpolated using layer thickness, beginning at 0 m and ending at 1 m. All snow layers above the DHF are classified as high-density surface snow (Wind Slab). Vegetation in the base layer of an Arctic snowpack makes density and IceCube measurements difficult, meaning measurements do not always reach the base of the snowpack, which may impact the evaluation of simulated basal layer density and SSA.
4.1 SWE, snow depth, and bulk density
A large fraction of total annual snow accumulation at TVC typically occurs from September through mid-January (50–150 kg m−2 of SWE), followed by smaller snowfall events that lead to peak SWE around mid-April in most years (Figs. 2, B1). Snow melt-out occurs around late May–early June (Figs. 2, B1, and B2). As snow begins to accumulate, simulated bulk density reaches 200–400 kg m−3 and remains consistent until late April, when the snowpack begins to melt (May–June) and there is a sharp increase in bulk density, reaching values above 550 kg m−3 (Figs. 2, B3).
Differences in seasonal evolution of simulated and measured snow depth, SWE, and bulk density were found over the 1991–2023 period. Model overestimation, good model agreement, and model under-estimation in simulated snow depth and SWE are observed when compared to measurements, depending on the year considered (Fig. 2). These biases can be explained in some part by the meteorological forcing data. Figure 2 (2004–2005) highlights that prior to an increase in snow depth, both the default and Arctic SVS2-Crocus show good agreement with SR50 measurements until an extra input of snowfall is added to the model, which is not reflected in the time series of SR50 snow depth measurements. This simulated overestimation is then maintained for the entire winter. Uncertainties in the reference measurements, including small-scale spatial variability, can also contribute to apparent model biases: during 2018–2019 (Fig. 2), the SR50 snow depth measurements indicated much deeper snow depth than manual snow course measurements. In this case, a snow drift observed in the SR50 footprint during field campaigns, caused by surrounding topography and prevailing wind direction, led to exaggerated differences between simulated and measured snow depth. SVS2-Crocus simulations in 1D are unable to account for these point measurement uncertainties.
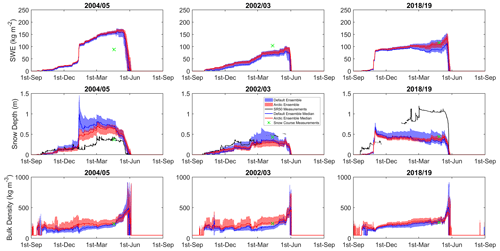
Figure 2Evolution of simulated SWE (kg m−2), snow depth (m), and bulk density (kg m−3) during selected snow seasons: overestimation of model SWE and snow depth (2004–2005), good model agreement (2002–2003), and model underestimation (2018–2019) for the default (blue ensemble with blue median) and Arctic SVS2-Crocus (red ensemble with red median). Green crosses represent the average of manual snow course measurements around peak SWE accumulation. Hourly averaged SR50 measurements are represented by the black lines.
Statistical analysis of simulated and observed peak SWE for 1991–2003 demonstrates that both the default and Arctic SVS2-Crocus show good agreement with measured results for the simulation of SWE (default RMSE – 55 kg m−2; Arctic RMSE – 55 kg m−2) and snow depth (default RMSE – 0.20 m; Arctic RMSE – 0.17 m) at TVC (Fig. 3, Table 1). Similar magnitudes of SWE are simulated by both ensembles (default mean – 128 kg m−2; Arctic mean – 130 kg m−2). Wind effect modifications applied to Arctic SVS2-Crocus increase surface layer density, leading to a higher bulk density (default mean – 239 kg m−3; Arctic mean – 278 kg m−3; Table 1, Fig. B3) and shallower snow depths (default mean – 0.54 m; Arctic mean – 0.47 m) than the default SVS2-Crocus.
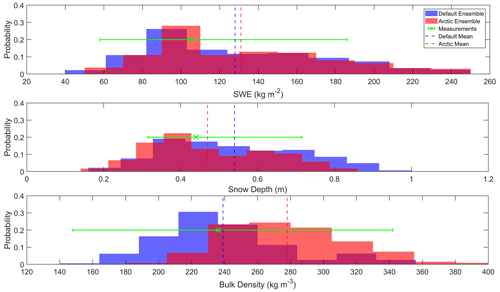
Figure 3Distribution of simulated SWE (kg m−2), snow depth (m), and bulk density (kg m−3) by the default and Arctic SVS2-Crocus, 1991–2023, calculated at the time of snow course measurements (around peak SWE accumulation). Dashed vertical lines represent mean values of each ensemble. Green crosses (mean) and error bars (range) represent the range of snow measurements taken around peak SWE.
Table 1Mean, RMSE, SS, and CRPS scores for measured and simulated SWE (kg m−2), snow depth (m), and bulk density (kg m−3) for the 1991–2023 snow seasons at the time of snow course measurements (around peak SWE accumulation), represented by green crosses in Figs. 2 and 3. Statistics in italics represent mean, RMSE, SS, and CRPS scores computed using SR50 measurements across all 32 winter seasons.
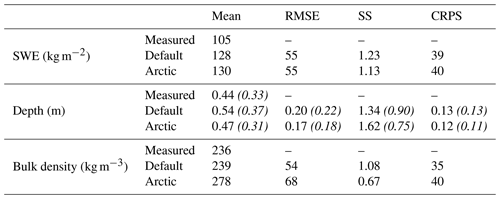
The results in Fig. 3 show that both the default and Arctic SVS2-Crocus simulate very similar bulk properties, with the spread of both ensembles overlapping across the 32 years investigated (Fig. 3, Appendix B). The spread of the Arctic SVS2-Crocus ensemble better captures the variability in SWE measurements (default SS – 1.23; Arctic SS – 1.13), whereas the default ensemble performs better for snow depth (default SS – 0.90; Arctic SS – 0.75) and bulk density (default SS – 1.08; Arctic SS – 0.67). CRPS scores for the simulation of SWE (default CRPS – 39 kg m−2; Arctic CRPS – 40 kg m−2), snow depth (default CRPS – 0.13 m; Arctic CRPS – 0.12 m), and bulk density (default CRPS – 35 kg m−3; Arctic CRPS – 40 kg m−3) are consistent between both ensembles. As the spread of both the default and Arctic SVS2-Crocus overlap across each year, for each snowpack property, the modifications applied to Arctic SVS2-Crocus are not significant in comparison to the known uncertainty in snow modelling (Lafaysse et al., 2017). However, as Arctic modifications have a notable impact on the density of the snowpack, increasing the bulk density by 39 kg m−3, it is necessary to look further into the impact of these modifications by analysing simulated profiles of density.
4.2 Profiles of density and SSA
We first analyse measured profiles of density at TVC across the 2018–2019 winter and the four winter seasons for a March snowpack. Measured profiles of density exhibit the typical structure of Arctic snowpacks: low-density basal layers ranging between 200 and 300 kg m−3 (mean measured density of DHF – 228 kg m−3; Table 2, Figs. 4 and 6) overlain with higher-density surface layers ranging between 200 and 400 kg m−3 (mean measured density of WS – 322 kg m−3; Table 2, Figs. 4 and 6). The vertical pattern of measured SSA follows density, with lower SSA values for basal layers (ranging between 7 and 20 m2 kg−1; Figs. 5 and 7) and higher SSA values for surface layers (ranging between 15 to 50 m2 kg−1; Figs. 5 and 7). The density profile from November 2018 was measured early in the snow season and shows less variability and range than other snow seasons (Fig. 4), as the snowpack was shallow, and metamorphism in basal layers and compaction in surface layers had little time to affect the density. A rain-on-snow event that occurred on 15 January 2018 led to the sharp increases in density (∼917 kg m−3) observed in March 2018 that were retained within the snowpack across the entire winter. Variability in the density of the top 20 % of the January 2019, March 2019, and March 2022 snowpacks was greater than in other winter seasons due to sampling during a fresh snowfall event (Figs. 4 and 6).
Table 2Mean, RMSE, SS, and CRPS scores for measured and simulated snow density (kg m−3) and SSA (m2 kg−1) for the March 2018, March 2019, March 2022, and March 2023 snow seasons. Scores are separated for depth hoar and wind slab.

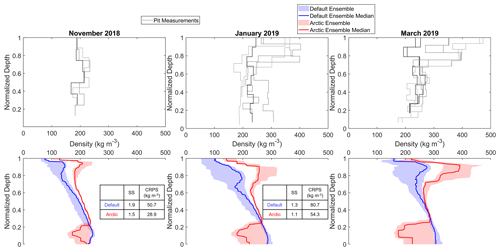
Figure 4Comparison of measured and simulated vertical profiles of density (kg m−3; median, interquartile range) by the default and Arctic SVS2-Crocus from the November 2018, January 2019, and March 2019 winter field campaigns. Black and grey lines indicate different pit profiles. Tables contain statistical scores of SS and CRPS for the full November 2018 and January 2019 profiles.
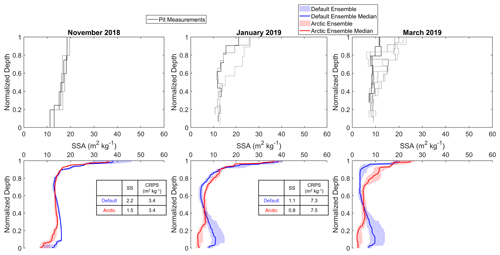
Figure 5Comparison of measured and simulated vertical profiles of SSA (m2 kg−1; median, interquartile range) by the default and Arctic SVS2-Crocus from the November 2018, January 2019, and March 2019 winter field campaigns. Black and grey lines indicate different pit profiles. Tables contain statistical scores of SS and CRPS for the full November 2018 and January 2019 profiles.
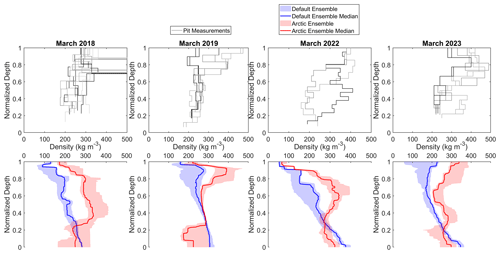
Figure 6Comparison of measured and simulated vertical profiles of density (kg m−3; median, interquartile range) by the default and Arctic SVS2-Crocus from the March 2018, March 2019, March 2022, and March 2023 winter field campaigns. Black and grey lines indicate different pit profiles.
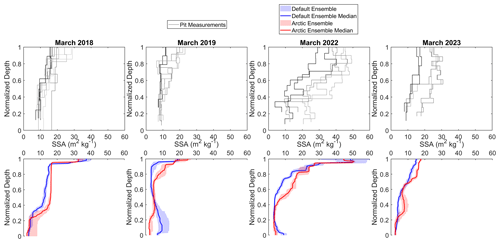
Figure 7Comparison of measured and simulated vertical profiles of SSA (m2 kg−1; median, interquartile range) by the default and Arctic SVS2-Crocus from the March 2018, March 2019, March 2022, and March 2023 winter field campaigns. Black and grey lines indicate different pit profiles.
Over the course of the 2018–2019 winter season, the default SVS2-Crocus simulated a snowpack subject to consistent compaction, with basal layers increasing in density from ∼200 kg m−3 in November 2018 to ∼300 kg m−3 in March 2019 (Fig. 4). Arctic modifications are effective in simulating lower-density basal layers <300 kg m−3, overlain by higher-density surface layers (200 to 400 kg m−3) that develop over the winter season. As the season progresses and snow depth increases, the basal vegetation effect modifications counteract the dominance of compaction found within the default SVS2-Crocus and lead to a sharp drop in simulated density (reduction of ∼50 kg m−3 in November 2018). This decrease in density is retained within the snowpack over the entire winter season, with a greater reduction of ∼150 kg m−3 simulated by March 2019. Wind effect modifications applied to Arctic SVS2-Crocus compact surface layers over the snow season, increasing densities from ∼200 to 400 kg m−3 by March 2019 (Fig. 4).
Across the four winter seasons for a March snowpack, the dominance of compaction is clear when using the default SVS2-Crocus where the ensemble simulated high-density basal layers (default mean DHF – 268 kg m−3) overlain with lower-density surface layers (default mean WS – 177 kg m−3; Table 2, Fig. 6) across each year. The application of wind effect modifications in Arctic SVS2-Crocus were effective in compacting the surface layers of the snowpack, increasing the mean density to 283 kg m−3 and reducing the RMSE by 41 % (default WS RMSE – 176 kg m−3; Arctic WS RMSE – 103 kg m−3; Table 2, Fig. 6), leading to ensemble divergence in all years. Basal vegetation effect modifications were less effective in reducing the error for simulated basal layer density (default DHF RMSE – 67 kg m−3; Arctic DHF RMSE – 65 kg m−3; Table 2, Fig. 6). As measurements were not always available for the base of the snowpack due to the impact of shrubs and vegetation, we compared the lowest 10 cm of each profile where measurements were available for fair statistical analysis of the basal vegetation effect modifications. Arctic SVS2-Crocus simulated a mean depth hoar snow density that better matched measurements (by 15 kg m−3; Table C1) than the default SVS2-Crocus, with a higher error (default RMSE – 69 kg m−3; Arctic RMSE – 79 kg m−3; Table C1) due to a larger ensemble spread leading to higher variance from the measurements. SSA exhibited less variability than density across each year. Both the default and Arctic SVS2-Crocus simulated low SSA values for the base of the snowpack (default mean DHF – 5.9 m2 kg−1; Arctic mean DHF – 6.3 m2 kg−1; Table 2, Fig. 7), with Arctic SVS2-Crocus slightly reducing the error (default RMSE DHF – 9.6 m2 kg−1; Arctic RMSE DHF – 7.9 m2 kg−1; Table 2, Fig. 7). SSA increased towards the surface in both simulations, reaching maximum values of 60 m2 kg−1 in March 2022 due to a recent snowfall event causing the simulation of low-density surface snow. SSA values for surface snow layers are underestimated in both ensembles (measured mean WS – 25.7 m2 kg−1; default mean WS – 12.9 m2 kg−1; Arctic mean WS – 16.0 m2 kg−1; Table 2, Fig. 7), with Arctic modifications reducing the error by 3.9 m2 kg−1 (default RMSE WS – 14.3 m2 kg−1; Arctic RMSE WS – 10.4 m2 kg−1; Table 2, Fig. 7).
The default and Arctic SVS2-Crocus ensembles diverge in surface layers of the snowpack for the simulation of snow density in all years (Figs. 4 and 6) and in some years for the simulation of SSA (March 2019, March 2023; Figs. 5 and 7). Wind effect modifications work to increase the density of the surface layers of the snowpack, allowing the spread of the Arctic SVS2-Crocus ensemble to better capture the variability in snow pit measurements and produce a more accurate simulation of measured density (Arctic WS SS – 0.92; Arctic WS CRPS – 93 kg m−3; Table 2). The spread of the default SVS2-Crocus ensemble exhibits a lower SS score (default WS SS – 0.31) and higher CRPS score (default WS CRPS – 134 kg m−3), suggesting that the ensemble spread was too narrow to capture measurement variability and was more inaccurate in simulating measured results. Variability between the two ensembles was lower for the simulation of SSA, with similar SS and CRPS for both the default and Arctic SVS2-Crocus (default WS SS – 1.7; Arctic WS SS – 1.6; default WS CRPS – 12.6 m2 kg −1; Arctic WS CRPS – 9.9 m2 kg−1; Table 2). Both ensembles exhibit a narrow spread for simulated SSA in comparison to the large observed differences between measured profiles, suggesting that the uncertainty in metamorphism is underestimated within SVS2-Crocus. Although visually (Figs. 4 and 6) the basal vegetation effect modifications appear effective at reducing basal layer density, the overall accuracy of the Arctic ensemble is similar to that of the default SVS2-Crocus (default DHF CRPS – 54 m2 kg−1; Arctic DHF CRPS – 62 m2 kg −1). Basal vegetation effect modifications are evaluated individually (as R2V and R2D) and then combined as R21 (described in Sect. 3.2.3), producing a large ensemble spread. Analysis of the impact of each individual modification for the lowest 10 cm of the snowpack highlights that modification R21 produces a mean value that is representative of measurements (measured mean – 234 kg m−3; R21 mean – 215 kg m−3; Table C2) with the lowest RMSE (60 kg m−3; Table C2) and CRPS (45 kg m−3; Table C2) out of all basal vegetation effect modifications. Modification R2D is not as effective at simulating basal layer densities (measured mean – 234 kg m−3; R2D mean – 300 kg m−3; RMSE – 74 kg m−3; Table C2), impacting the overall statistical analysis of the basal vegetation effect modifications. Given that the two ensembles produce clearly divergent estimates for snow density across all years, we suggest that the Arctic SVS2-Crocus modifications are worth implementing due to their ability to simulate an Arctic density profile of low-density basal layers overlain with higher-density surface layers, with an ensemble spread that better captures the variability in snow measurements.
4.3 Ranking of ensemble members
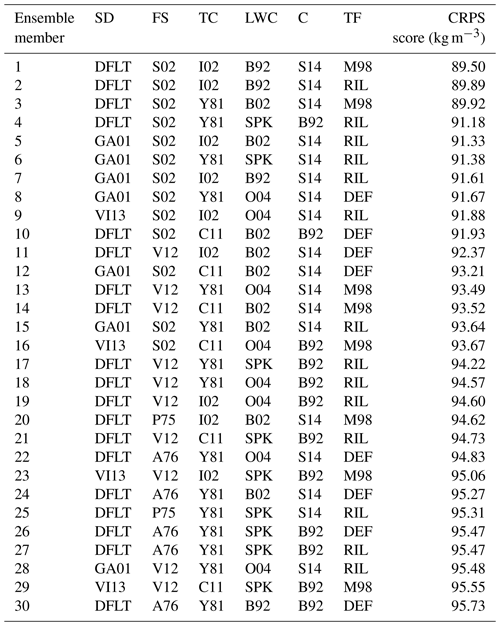
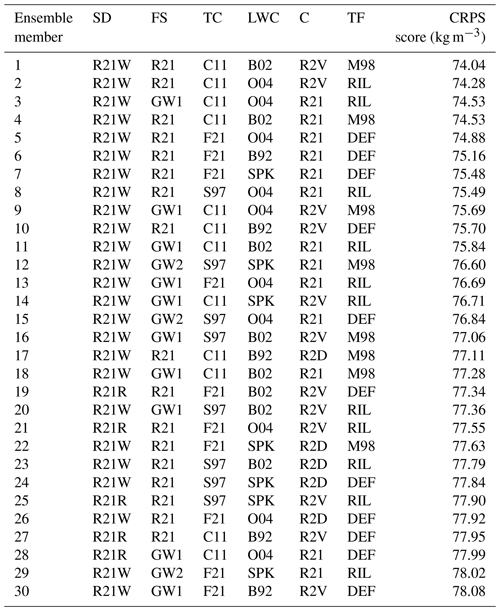
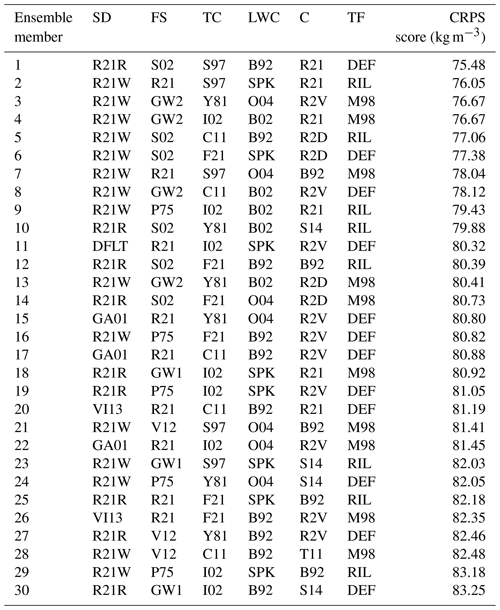
Arctic modifications are effective in reducing CRPS scores for the simulation of snow density in comparison to the default parameterisations. The top 100 members of Arctic SVS2-Crocus simulate lower CRPS scores than those of the default SVS2-Crocus and mixed SVS2-Crocus ensemble members for simulation of snow density (Fig. 8 and Tables D1–D3). Arctic ensemble members show minor variation in CRPS scores across all 120 members, varying from 74 to 94 kg m−3, in comparison to the default SVS2-Crocus that shows high variability (CRPS scores varying from 89 to 149 kg m−3). The use of the NONE parameterisation within the snowdrift scheme, i.e. snowdrift is not allowed to occur from ensemble member 80 onwards, causes a sharp increase in CRPS scores when using the default SVS2-Crocus. Mixed ensemble CRPS scores show a consistent increase in CRPS scores until ensemble member 104, where a rapid increase is observed, again due to the NONE parameterisation in the snowdrift scheme, suggesting that this is a critical parameter driving the accuracy of the ensemble.
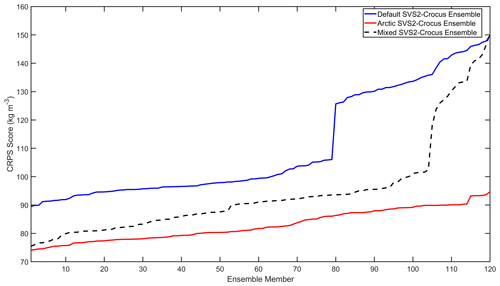
Figure 8Comparison of ranked CRPS scores for all 120 members of the default, Arctic, and mixed ensembles of SVS2-Crocus for the simulation of snow density (kg m−3) averaged over the whole snowpack in March 2018, March 2019, March 2022, and March 2023.
Figure 9 shows a count of the number of occurrences of parameterisations in the top 30 members (lowest CRPS scores for simulation of density) of the default, mixed, and Arctic SVS2-Crocus ensembles. The parameterisations are grouped by process: snowdrift, falling snow, thermal conductivity, and compaction (note that liquid water content and turbulent flux are also shown for completeness). For three of the four modified SVS2-Crocus snowpack schemes (falling snow density, compaction, and snowdrift), Arctic-specific modifications are the dominant parameterisations in producing lower CRPS scores for the simulation of snow density (R2V – compaction; R21W – snow drift; and R21 – falling snow density; Fig. 9). Arctic modifications R2V, R21, and R2D are present in 20 of the top 30 mixed ensemble members; snowdrift modifications R21W and R21R occur in 24 of the top 30; and falling snow modifications R21, GW1, and GW2 occur in 17 of the top 30 (Fig. 9; Table D3). As these same modifications also occur most frequently in the top 30 Arctic ensemble members that produce the lowest CRPS scores for the simulation of snow density, we deem these modifications to be best suited for the simulation of snowpack properties by SVS2-Crocus within Arctic environments. Although developed for Arctic application, snowdrift scheme modification R21F does not occur within the top 30 of the Arctic or mixed ensembles, as the parameterisation leads to an overestimation in surface snow density at TVC (Fig. 9). All members of the default and Arctic ensembles within the thermal conductivity, liquid water content, and turbulent flux schemes occur consistently within the top 30 ranked members. No member appears as a dominant option, suggesting that the choice of parameterisation within these schemes is not a key contributor to the simulation of snow density in comparison to other modified schemes.
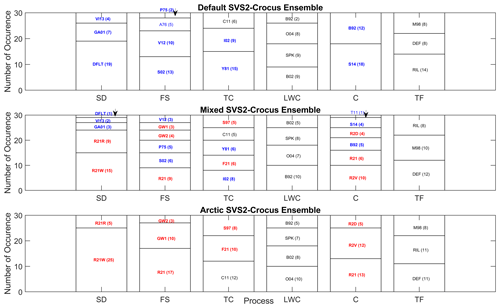
Figure 9Number of occurrences of each parameterisation in the top 30 members with the lowest CRPS scores for simulation of density by the default, mixed, and Arctic SVS2-Crocus. Blue indicates members of the default ensemble, red indicates members of the Arctic ensemble, and black indicates members of both. Numbers in brackets represent the number of occurrences. SD – snowdrift; FS – falling snow; TC – thermal conductivity; LWC – liquid water content; C – compaction; and TF – turbulent flux. For specific combinations of parameterisations within each ensemble member, see Appendix D.
For simulation of SSA, the top 90 members of the Arctic SVS2-Crocus ensemble produce lower CRPS scores than the default SVS2-Crocus (Fig. S1). Arctic modifications R21F, R21W, and R21R are the dominant parameterisations within the snowdrift scheme and contribute towards lower CRPS scores, occurring in 30 of the top 30 mixed ensemble members (Fig. S2). For all other schemes investigated (e.g. falling snow density, thermal conductivity, liquid water content, compaction, and turbulent flux) both the default and Arctic parameterisations occur consistently, suggesting that no new parameterisation of Arctic SVS2-Crocus is able to improve the simulation of SSA at TVC (Fig. S2). Figures highlighting the comparison of CRPS scores for the simulation of SSA and number of occurrences of each parameterisation in the top 30 of each ensemble are provided in the Supplement.
5.1 Simulating bulk Arctic snow properties
Implementation of Arctic modifications into SVS2-Crocus does not produce significant differences in modelled SWE but can affect the simulation of snow depth and bulk density. Wind effect modifications simulated new snow of a higher density (parameterisations R21, GW1, and GW2) and increased the rate of the wind compaction processes (parameterisations R21F, R21W, and R21R) working to increase surface layer density and reduce snow depth and consequential bulk density (Lackner et al., 2022; Royer et al., 2021; Krampe et al., 2021). Without the inclusion of Arctic modifications, the default SVS2-Crocus simulated deeper snow depths than Arctic SVS2-Crocus and also overestimated bulk density due to the dominance of compaction due to overburden weight (Vionnet et al., 2012). Overestimations in snow depth at Arctic sites are common (Umiujaq – Lackner et al., 2022; Bylot Island – Barrere et al., 2017; Cambridge Bay and Samoylov – Royer et al., 2021) as SVS2-Crocus does not account for lateral transport of snow (Vionnet et al., 2012). Parameterising the effect of snow distribution by wind could support reduction in overestimations in snow depth in future studies that simulate in areas where the occurrence of blowing snow events is high (Pomeroy et al., 1997). Evaluation of bulk density was carried out at peak SWE when the percentage of low-density snow in the base layer of the snowpack is highest, as metamorphism and water vapour transport were effective over the course of the winter (Domine et al., 2018a), which may have led to the observed overestimations simulated by both the default and Arctic SVS2-Crocus.
Neither the default nor Arctic SVS2-Crocus ensemble exhibits perfect dispersion (SS score of 1) for the simulation of snow depth, SWE, or bulk density at TVC. Both ensembles are overdispersive, which may be due to evaluation being carried out at peak SWE and not over the entire winter season as in Lafaysse et al. (2017), who found under-dispersion when simulating using ESCROC at Col de Porte. Where we can evaluate over the winter season for snow depth, we also find under-dispersion for both ensembles (Fig. B2). Arctic SVS2-Crocus exhibits a lower SS score than that of the default SVS2-Crocus for snow depth (across the winter season), as some wind effect (R21, GW1, GW2; falling snow scheme) parameterisations are highly correlated and only vary by parameter value (Lafaysse et al., 2017). Higher dispersion can indicate that the optimal skill of parameterisations within each ensemble is lower, which may explain the higher SS for the default SVS2-Crocus when simulating SWE and snow depth.
5.2 Capacity to simulate profiles of snowpack properties
Implementing wind effect modifications into Arctic SVS2-Crocus produces simulations of snow density profiles at TVC that agree with measurements better. Wind effect modifications are effective in reducing the RMSE in simulated surface layer density by 41 % with R21W (Table 2; increasing the influence of wind on snow compaction), identified as the most effective modification to increase surface density due to its high occurrence within the top 30 Arctic and mixed ensemble members that produce the lowest CRPS scores (Fig. 9). Barrere et al. (2017) implemented modification R21R (raising the maximum density impacted by wind) into Crocus and were unable to reproduce surface layer densities that matched measurements at Bylot Island. As we found an increase in surface densities using R21W, we suggested that just raising the maximum density alone is not enough to match surface densities in an Arctic environment and that considering wind-induced compaction is necessary. However, modification R21F proposed by Royer et al. (2021) (combining R21W and R21R) leads to over-compaction of snow surface layers when applied at TVC due to the occurrence of frequent high wind speeds at this Arctic site. R21F occurs in the bottom 28 of Arctic SVS2-Crocus ensemble members, with the default SVS2-Crocus parameterisations producing more accurate simulations (Fig. 9, Table D3), suggesting that the parameterisation should be revised, especially for application at other Arctic sites with high wind speeds. Furthermore, without the wind effect modifications, the default SVS2-Crocus is unable to simulate high-density surface layers, leading to a 45 % underestimation in wind slab density (Table 2).
R21 (snow compaction scheme) is the most effective modification at reducing basal layer density when using Arctic SVS2-Crocus, which combines modifications R2D and R2V, supporting the work of Royer et al. (2021) at Cambridge Bay. Although statistically the basal vegetation effect modifications are unable to reduce basal layer densities to match those of observations (Table 2), the high relative occurrence of R21 within both the Arctic and mixed ensembles (Fig. 9) and the statistical analysis of the lowest 10 cm of the snow density profile (Appendix C), suggests that the modification simulates snow densities that are more reflective of measured results, in comparison to the default SVS2-Crocus parameterisations. As vegetation is commonly present in the base layer of an Arctic snowpack, which makes density and SSA measurements difficult, most measured profiles do not reach the base of the snowpack. It is likely that the basal vegetation effect modifications appear less effective than the wind effect modifications due to the inability to calculate statistics for this area of the snowpack. For this same reason, statistical scores for the default SVS2-Crocus may be underestimated for the simulation of basal layer densities. Furthermore, the DHF varied from 42 % to 74 % across the investigated snow seasons, which in some years incorporates much of the simulated profile. As a result, surface densities impacted by the wind effect modifications may be included in the basal layer statistics, further contributing to overestimated densities. Calculating an explicit percentage for the DHF using pit measurements yields a value that is representative of snow profiles at TVC and builds on previous work that applies simple approaches of splitting the snowpack in half, with the top 50 % classified as surface layers and the bottom 50 % as the DHF (Royer et al., 2021). Water vapour transport is the biggest driver of low-density basal layers, and omission of the process is the main cause of the inaccurate simulation of basal layer density within this study and in many previous studies (Domine et al., 2019; Barrere et al., 2017; Lackner et al., 2022). Emerging efforts to build a microstructure-based model that will encompass water vapour transport are therefore important but may be too computationally expensive to implement into operational versions of current snowpack schemes (e.g. SVS2-Crocus) (Brondex et al., 2023). Using R21, basal layer compaction simulated by the default SVS2-Crocus can be reduced without parameterisation of water vapour transport and is a modification that can be easily implemented within operational models. Small improvements in snow density are crucial for permafrost modelling applications and will contribute to an overall improvement in calculations of metamorphism and snowpack temperature gradients for earth system modelling (Barrere et al., 2017; Domine et al., 2019; Krampe et al., 2021).
Basal Vegetation Effect modifications appear more effective in 2018–2019 than in 2021–2022 and 2022–2023 due to a sudden increase in snowfall in late October 2018 that sharply increased the snow depth from >0.1 to >0.5 m. In this case, the basal vegetation effect is activated immediately, causing compaction to occur at a very low rate, and low basal densities are then retained within the snowpack throughout the entire winter. Inputs of snowfall are consistent over the 2021–2022 and 2022–2023 winters when snow depth increases gradually, resulting in a gradual decrease in basal layer density over the winter.
Arctic SVS2-Crocus reduces the RMSE in the simulation of SSA over the whole snow profile. Arctic modifications R21F, R21W, and R21R are dominant parameterisations within the snowdrift scheme that lead to lower CRPS scores for the simulation of SSA as they work to modify the microstructure of snow grains during blowing snow events, which occur frequently at TVC. In years where Arctic SVS2-Crocus is effective in reducing basal-layer densities, lower SSA values are observed that better match measurements. However, both the default and Arctic SVS2-Crocus simulate basal SSA values that are too low in comparison to measurements, which could partly be due to IceCube overestimating SSA values for large-faceted-depth hoar grains (Martin and Schneebeli, 2023) and/or from uncertainties in the parameterisation of the optical diameter (Libois et al., 2014; Carmagnola et al., 2014). Reducing the uncertainty in the simulation of snow density and SSA using Arctic SVS2-Crocus is important for many applications, including the analysis of satellite microwave measurements, for which initial estimates of snow microstructure properties are necessary for accurate retrieval of SWE (Derksen et al., 2021; Larue et al., 2018).
Parameterising missing Arctic processes improved the simulation of snow density and SSA (2018–2023) at TVC in comparison to the default SVS2-Crocus. Accounting for wind-induced compaction and the presence of basal vegetation impacting compaction and metamorphism allowed Arctic SVS2-Crocus to simulate a more physically representative snowpack of high-density surface layers overlying lower-density basal layers. The unique opportunity to evaluate SVS2-Crocus over a winter season (November 2018–March 2019) found that Arctic modifications improved the simulation of snow density profiles throughout the whole winter. Measurements from this winter season provided an important contribution to model evaluation by allowing analysis of the development of simulated snow density and SSA, which differs from the typical methodology of evaluating using one measurement snapshot (March–April). As basal vegetation effect modifications do not statistically improve the simulation of low-density basal layers in comparison to the default SVS2-Crocus, in-part due to evaluation methodologies, future work should consider revisions to the snow compaction scheme. Changes should be applied to the snow viscosity to reduce the compaction rate in the presence of basal vegetation. The ability to evaluate the simulation of microstructure properties at the base of the snowpack and the performance of the basal vegetation effect parameterisations would benefit from the use of an in situ snow micro-penetrometer (SMP; Johnson and Schneebeli, 1999) that is not hindered by the presence of basal vegetation and can reach the base of the snowpack. Furthermore, the parameterisation of water vapour transport is well known to be a key driver of the formation of low-density basal layers, and findings from this study reiterate the need for the process to be better parameterised within SVS2-Crocus to allow simulation of basal densities that match measurements. The ability to improve the simulation of snow density and SSA using Arctic SVS2-Crocus will, however, provide a benchmark for development of future versions of the model that do aim to consider water vapour transport.
Developing an ensemble that considers Arctic processes allowed for the identification of optimal parameterisations and combination of parameterisations for the application of SVS2-Crocus at Arctic sites. Arctic SVS2-Crocus is expected to provide more robust conclusions than the previous literature that introduced new parameterisations but neglected the interactions between processes. As the 100 members of Arctic SVS2-Crocus consistently produce lower CRPS scores than those of the default SVS2-Crocus, we suggest that these combinations of parameterisations should be considered for simulation of snowpack properties within Arctic environments (Table D2). For simulation of high-density surface layers, the most effective Arctic SVS2-Crocus modifications are raising wind speeds to increase compaction in snow surface layers (Barrere et al., 2017; Royer et al., 2021) and doubling the impact of wind on fresh snow density (Royer et al., 2021). To reduce compaction in basal layers, both increasing snow viscosity (Royer et al., 2021; Domine et al., 2016; Gouttevin et al., 2018) and switching off snow drift below a set vegetation height (Royer et al., 2021) should be considered. A combination of wind effect and basal vegetation effect modifications, as illustrated by 100 members of the Arctic SVS2-Crocus ensemble, are most effective in simulating a snow density profile that matches measured results within an Arctic environment, in comparison to the default SVS2-Crocus.
The ability to generate realistic ensemble simulations of Arctic snowpack properties that match measurements using Arctic SVS2-Crocus provides the ability to support future model development in the Arctic, provides improved estimates for snow data assimilation applications, and supports accurate simulation of the ground thermal regime. As some Arctic parameterisations have improved skill in comparison to the default SVS2-Crocus, the parameterisations are expected to be implemented within the main Crocus code, becoming available in the future in externalised versions (e.g. SURFEX). The challenge now is to test the performance of Arctic SVS2-Crocus at other Arctic sites that differ in terms of vegetation, climatology, and topography to evaluate the spatial transferability of the Arctic parameterisations.
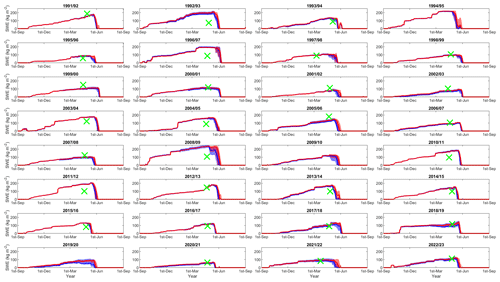
Figure B1Time series of hourly simulated snow water equivalent (SWE; kg m−2) at TVC for the 1991–2023 snow seasons. Maximum and minimum values of the default (blue) and Arctic (red) SVS2-Crocus ensembles are represented by the shaded regions. Median values of both ensembles are represented by solid lines. Measurements from SWE courses are represented by green crosses.
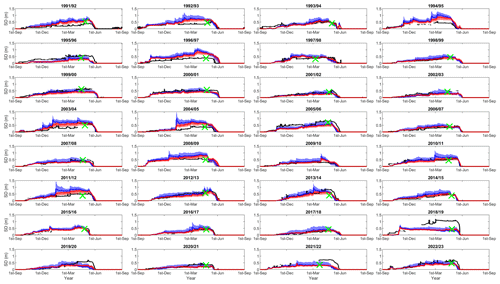
Figure B2Time series of hourly simulated snow depth (m) at TVC for the 1991–2023 snow seasons. Maximum and minimum values of the default (blue) and Arctic (red) SVS2-Crocus ensembles are represented by the shaded regions. Median values of both ensembles are represented by solid-coloured lines. SR50 measurements are displayed using solid black lines, and snow course measurements are green crosses.
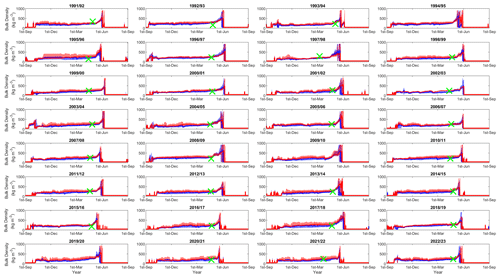
Figure B3Time series of hourly simulated bulk density (kg m−3) at TVC for the 1991–2023 snow seasons. Maximum and minimum values of the default (blue) and Arctic (red) SVS2-Crocus ensembles are represented by the shaded regions. Median values of both ensembles are represented by solid lines. Measurements from SWE courses are represented by green crosses.
Table C1Mean, RMSE, SS, and CRPS scores for measured and simulated snow density (kg m−3) for the lowest 10 cm (starting where measurement profiles begin) for the March 2018, March 2019, March 2022, and March 2023 snow seasons.

Code and data to produce the figures are available at https://doi.org/10.5281/zenodo.14259166 (Woolley, 2024a) and https://doi.org/10.6084/m9.figshare.25639215.v2 (Woolley, 2024b). Arctic SVS2-Crocus code is available at https://doi.org/10.5281/zenodo.14273138 (Woolley et al., 2024).
The supplement related to this article is available online at: https://doi.org/10.5194/tc-18-5685-2024-supplement.
GJW conducted the simulations and analysis and drafted the manuscript. NR, LW, VV, CD, and DP supervised the project. GJW, VV, LW, and ML set SVS2-Crocus up and designed the model ensemble framework. GJW, NR, VV, CD, RE, RT, and BW collected TVC snow measurements. PM, RE, RT, and BW provided meteorological data for TVC and produced the quality-controlled gap-filled dataset used. All authors participated in reviewing and editing the paper.
At least one of the (co-)authors is a member of the editorial board of The Cryosphere. The peer-review process was guided by an independent editor, and the authors also have no other competing interests to declare.
Publisher's note: Copernicus Publications remains neutral with regard to jurisdictional claims made in the text, published maps, institutional affiliations, or any other geographical representation in this paper. While Copernicus Publications makes every effort to include appropriate place names, the final responsibility lies with the authors.
The project was conducted with approval issued by the Aurora Research Institute, Aurora College (license nos. 16237, 16501, and 17232). The authors would like to acknowledge that this study occurred within the Inuvialuit Settlement Region located in western Canada.
This research has been supported by the Natural Environment Research Council (grant nos. NE/S007512/1 and NE/W003686/1).
This paper was edited by Jürg Schweizer and reviewed by Charles Amory and one anonymous referee.
Anderson, E. A.: A point energy and mass balance model of a snow cover, National Oceanic and Atmospheric Administration, NOAA technical report NWS, 19, Maryland, USA, https://repository.library.noaa.gov/view/noaa/6392 (last access: October 2023), 1976.
Appel, F., Koch, F., Rösel, A., Klug, P., Henkel, P., Lamm, M., Mauser, W., and Bach, H.: Advances in Snow Hydrology Using a Combined Approach of GNSS In Situ Stations, Hydrological Modelling and Earth Observation – A Case Study in Canada, Geosciences, 9, 44, https://doi.org/10.3390/geosciences9010044, 2019.
Barrere, M., Domine, F., Decharme, B., Morin, S., Vionnet, V., and Lafaysse, M.: Evaluating the performance of coupled snow–soil models in SURFEXv8 to simulate the permafrost thermal regime at a high Arctic site, Geosci. Model Dev., 10, 3461–3479, https://doi.org/10.5194/gmd-10-3461-2017, 2017.
Bartelt, P. and Lehning, M.: A physical SNOWPACK mdoel for the Swiss avalanche warning Part I: numerical model, Cold Reg. Sci. Technol., 35, 123–145, 2002.
Berteaux, D., Gauthier, G., Domine, F., Ims, R. A., Lamoureux, S. F., Lévesque, E., and Yoccoz, N.: Effects of changing permafrost and snow conditions on tundra wildlife: critical places and times, Arct. Sci., 3, 65–90, https://doi.org/10.1139/as-2016-0023, 2017.
Boelman, N. T., Liston, G. E., Gurarie, E., Meddens, A. J. H., Mahoney, P. J., Kirchner, P. B., Bohrer, G., Brinkman, T. J., Cosgrove, C. L., Eitel, J. U. H., Hebblewhite, M., Kimball, J. S., LaPoint, S., Nolin, A. W., Pedersen, S. H., Prugh, L. R., Reinking, A. K., and Vierling, L. A.: Integrating snow science and wildlife ecology in Arctic-boreal North America, Environ. Res. Lett., 14, 010401, https://doi.org/10.1088/1748-9326/aaeec1, 2019.
Boike, J., Cable, W. L., Bornemann, N., and Lange, S.: Trail Valley Creek, NWT, Canada Soil Moisture and Temperature 2016–2019, PANGAEA [data set], https://doi.org/10.1594/PANGAEA.923373, 2020.
Bolton, D.: The Computation of Equivalent Potential Temperature, Mon. Weather Rev., 108, 1046–1053, 1980.
Boone, A.: Description du schema de neige ISBA-ES (Explicit Snow), Tech. rep., Note de Centre, Meteo-France/CNRM, 70, 59 pp., 2002.
Boone, A. and Etchevers, P.: An Intercomparison of Three Snow Schemes of Varying Complexity Coupled to the Same Land Surface Model: Local-Scale Evaluation at an Alpine Site, J. Hydrometeorol., 2, 374–394, 2001.
Bouvet, L., Calonne, N., Flin, F., and Geindreau, C.: Heterogeneous grain growth and vertical mass transfer within a snow layer under a temperature gradient, The Cryosphere, 17, 3553–3573, https://doi.org/10.5194/tc-17-3553-2023, 2023.
Bröcker, J.: Evaluating raw ensembles with the continuous ranked probability score, Q. J. Roy. Meteor. Soc., 138, 1611–1617, https://doi.org/10.1002/qj.1891, 2012.
Brondex, J., Fourteau, K., Dumont, M., Hagenmuller, P., Calonne, N., Tuzet, F., and Löwe, H.: A finite-element framework to explore the numerical solution of the coupled problem of heat conduction, water vapor diffusion, and settlement in dry snow (IvoriFEM v0.1.0), Geosci. Model Dev., 16, 7075–7106, https://doi.org/10.5194/gmd-16-7075-2023, 2023.
Brun, E., Six, D., Picard, G., Vionnet, V., Arnaud, L., Bazile, E., Boone, A., Bouchard, A., Genthon, C., Guidard, V., Le Moigne, P., Rabier, F., and Seity, Y.: Snow/atmosphere coupled simulation at Dome C, Antartica, J. Glaciol., 52, 721–736, 2011.
Callaghan, T. V., Johansson, M., Brown, R. D., Groisman, P. Y., Labba, N., Radionov, V., Bradley, R. S., Blangy, S., Bulygina, O. N., Christensen, T. R., Colman, J. E., Essery, R. L. H., Forbes, B. C., Forchhammer, M. C., Golubev, V. N., Honrath, R. E., Juday, G. P., Meshcherskaya, A. V., Phoenix, G. K., Pomeroy, J., Rautio, A., Robinson, D. A., Schmidt, N. M., Serreze, M. C., Shevchenko, V. P., Shiklomanov, A. I., Shmakin, A. B., Sköld, P., Sturm, M., Woo, M.-k., and Wood, E. F.: Multiple Effects of Changes in Arctic Snow Cover, Ambio, 40, 32–45, https://doi.org/10.1007/s13280-011-0213-x, 2012.
Calonne, N., Flin, F., Morin, S., Lesaffre, B., du Roscoat, S. R., and Geindreau, C.: Numerical and experimental investigations of the effective thermal conductivity of snow, Geophys. Res. Lett., 38, L23501, https://doi.org/10.1029/2011gl049234, 2011.
Carmagnola, C. M., Morin, S., Lafaysse, M., Domine, F., Lesaffre, B., Lejeune, Y., Picard, G., and Arnaud, L.: Implementation and evaluation of prognostic representations of the optical diameter of snow in the SURFEX/ISBA-Crocus detailed snowpack model, The Cryosphere, 8, 417–437, https://doi.org/10.5194/tc-8-417-2014, 2014.
Cluzet, B., Lafaysse, M., Cosme, E., Albergel, C., Meunier, L.-F., and Dumont, M.: CrocO_v1.0: a particle filter to assimilate snowpack observations in a spatialised framework, Geosci. Model Dev., 14, 1595–1614, https://doi.org/10.5194/gmd-14-1595-2021, 2021.
Comola, F., Kok, J. F., Gaume, J., Paterna, E., and Lehning, M.: Fragmentation of wind-blown snow crystals, Geophys. Res. Lett., 44, 4195–4203, https://doi.org/10.1002/2017gl073039, 2017.
Contosta, A. R., Casson, N. J., Garlick, S., Nelson, S. J., Ayres, M. P., Burakowski, E. A., Campbell, J., Creed, I., Eimers, C., Evans, C., Fernandez, I., Fuss, C., Huntington, T., Patel, K., Sanders-DeMott, R., Son, K., Templer, P., and Thornbrugh, C.: Northern forest winters have lost cold, snowy conditions that are important for ecosystems and human communities, Ecol. Appl., 29, e01974, https://doi.org/10.1002/eap.1974, 2019.
Derksen, C., Lemmetyinen, J., Toose, P., Silis, A., Pulliainen, J., and Sturm, M.: Physical properties of Arctic versus subarctic snow: Implications for high latitude passive microwave snow water equivalent retrievals, J. Geophys. Res.-Atmos., 119, 7254–7270, https://doi.org/10.1002/2013jd021264, 2014.
Derksen, C., King, J., Belair, S., Garnaud, C., Vionnet, V., Fortin, V., Lemmetyinen, J., Crevier, Y., Plourde, P., Lawrence, B., van Mierlo, H., Burbidge, G., and Siqueira, P.: Development of the Terrestrial Snow Mass Mission, 2021 IEEE International Geoscience and Remote Sensing Symposium IGARSS, https://doi.org/10.1109/igarss47720.2021.9553496, 2021.
Domine, F., Barrere, M., and Morin, S.: The growth of shrubs on high Arctic tundra at Bylot Island: impact on snow physical properties and permafrost thermal regime, Biogeosciences, 13, 6471–6486, https://doi.org/10.5194/bg-13-6471-2016, 2016.
Domine, F., Belke-Brea, M., Sarrazin, D., Arnaud, L., Barrere, M., and Poirier, M.: Soil moisture, wind speed and depth hoar formation in the Arctic snowpack, J. Glaciol., 64, 990–1002, https://doi.org/10.1017/jog.2018.89, 2018a.
Domine, F., Gauthier, G., Vionnet, V., Fauteux, D., Dumont, M., and Barrere, M.: Snow physical properties may be a significant determinant of lemming population dynamics in the high Arctic, Arct. Sci., 4, 813–826, https://doi.org/10.1139/as-2018-0008, 2018b.
Domine, F., Picard, G., Morin, S., Barrere, M., Madore, J.-B., and Langlois, A.: Major Issues in Simulating Some Arctic Snowpack Properties Using Current Detailed Snow Physics Models: Consequences for the Thermal Regime and Water Budget of Permafrost, J. Adv. Model. Earth Sy., 11, 34–44, https://doi.org/10.1029/2018ms001445, 2019.
Domine, F., Fourteau, K., Picard, G., Lackner, G., Sarrazin, D., and Poirier, M.: Permafrost cooled in winter by thermal bridging through snow-covered shrub branches, Nat. Geosci., 15, 554–560, https://doi.org/10.1038/s41561-022-00979-2, 2022.
Dutch, V. R., Rutter, N., Wake, L., Sandells, M., Derksen, C., Walker, B., Hould Gosselin, G., Sonnentag, O., Essery, R., Kelly, R., Marsh, P., King, J., and Boike, J.: Impact of measured and simulated tundra snowpack properties on heat transfer, The Cryosphere, 16, 4201–4222, https://doi.org/10.5194/tc-16-4201-2022, 2022.
Essery, R.: A factorial snowpack model (FSM 1.0), Geosci. Model Dev., 8, 3867–3876, https://doi.org/10.5194/gmd-8-3867-2015, 2015.
Essery, R., Morin, S., Lejeune, Y., and B Ménard, C.: A comparison of 1701 snow models using observations from an alpine site, Adv. Water Resour., 55, 131–148, https://doi.org/10.1016/j.advwatres.2012.07.013, 2013.
Etchevers, P., Martin, E., Brown, R., Fierz, C., Lejeune, Y., Bazile, E., Boone, A., Dai, Y.-J., Essery, R., Fernandez, A., Gusev, Y., Jordan, R., Koren, V., Kowalczyk, E., Nasonova, N. O., Pyles, R. D., Schlosser, A., Shmakin, A. B., Smirnova, T. G., Strasser, U., Verseghy, D., Yamazaki, T., and Yang, Z.-L.: Validation of the energy budget of an alpine snowpack simulated by several snow models (Snow MIP project), Ann. Glaciol., 38, 150–158, https://doi.org/10.3189/172756404781814825, 2004.
Fierz, C., Armstrong, R. L., Durand, Y., Etchevers, P., Greene, E., McClung, D., Nishimura, K., Satyawali, P., and Sokratov, S. A.: The international classification for seasonal snow on the ground UNESCO, IHP-VII, Tech. Doc. Hydrol., 83, 2009.
Flanner, M. G., Shell, K. M., Barlage, M., Perovich, D. K., and Tschudi, M. A.: Radiative forcing and albedo feedback from the Northern Hemisphere cryosphere between 1979 and 2008, Nat. Geosci., 4, 151–155, https://doi.org/10.1038/ngeo1062, 2011.
Fortin, V., Abaza, M., Anctil, F., and Turcotte, R.: Why Should Ensemble Spread Match the RMSE of the Ensemble Mean?, J. Hydrometeorol., 15, 1708–1713, https://doi.org/10.1175/jhm-d-14-0008.1, 2014.
Fourteau, K., Domine, F., and Hagenmuller, P.: Impact of water vapor diffusion and latent heat on the effective thermal conductivity of snow, The Cryosphere, 15, 2739–2755, https://doi.org/10.5194/tc-15-2739-2021, 2021.
Gallee, H., Guyomarc'h, G., and Brun, E.: Impact of snowdrift on the Antarctic ice sheet surface mass balance: possible sensitivity to snow-surface properties., Bound.-Lay. Meteorol., 99, 1–19, https://doi.org/10.1023/A:1018776422809, 2001.
Gallet, J.-C., Domine, F., Zender, C. S., and Picard, G.: Measurement of the specific surface area of snow using infrared reflectance in an integrating sphere at 1310 and 1550 nm, The Cryosphere, 3, 167–182, https://doi.org/10.5194/tc-3-167-2009, 2009.
Garnaud, C., Bélair, S., Carrera, M. L., Derksen, C., Bilodeau, B., Abrahamowicz, M., Gauthier, N., and Vionnet, V.: Quantifying Snow Mass Mission Concept Trade-Offs Using an Observing System Simulation Experiment, J. Hydrometeorol., 20, 155–173, https://doi.org/10.1175/jhm-d-17-0241.1, 2019.
Gordon, M., Simon, K., and Taylor, P. A.: On snow depth predictions with the Canadian land surface scheme including a parametrization of blowing snow sublimation, Atmosphere-Ocean, 44, 239–255, https://doi.org/10.3137/ao.440303, 2006.
Gouttevin, I., Langer, M., Löwe, H., Boike, J., Proksch, M., and Schneebeli, M.: Observation and modelling of snow at a polygonal tundra permafrost site: spatial variability and thermal implications, The Cryosphere, 12, 3693–3717, https://doi.org/10.5194/tc-12-3693-2018, 2018.
Hovelsrud, G. K., Poppel, B., van Oort, B., and Reist, J. D.: Arctic Societies, Cultures, and Peoples in a Changing Cryosphere, Ambio, 40, 100–110, https://doi.org/10.1007/s13280-011-0219-4, 2012.
Jafari, M., Gouttevin, I., Couttet, M., Wever, N., Michel, A., Sharma, V., Rossmann, L., Maass, N., Nicolaus, M., and Lehning, M.: The Impact of Diffusive Water Vapor Transport on Snow Profiles in Deep and Shallow Snow Covers and on Sea Ice, Front. Earth Sci., 8, 249, https://doi.org/10.3389/feart.2020.00249, 2020.
Johnson, J. B. and Schneebeli, M.: Characterizing the microstructural and micromechanical properties of snow, Cold Reg. Sci. Technol., 30, 91–100, https://doi.org/10.1016/S0165-232X(99)00013-0, 1999.
Jordan, R.: A One-Dimensional Temperature Model for a Snow Cover - Technical Documentation for SNTHERM.89, Cold Regions Research and Engineering Laboratory, USA, 91-16, 1991.
King, J., Derksen, C., Toose, P., Langlois, A., Larsen, C., Lemmetyinen, J., Marsh, P., Montpetit, B., Roy, A., Rutter, N., and Sturm, M.: The influence of snow microstructure on dual-frequency radar measurements in a tundra environment, Remote Sens. Environ., 215, 242–254, https://doi.org/10.1016/j.rse.2018.05.028, 2018.
King, J., Howell, S., Brady, M., Toose, P., Derksen, C., Haas, C., and Beckers, J.: Local-scale variability of snow density on Arctic sea ice, The Cryosphere, 14, 4323–4339, https://doi.org/10.5194/tc-14-4323-2020, 2020.
Krampe, D., Kauker, F., Dumont, M., and Herber, A.: On the performance of the snow model Crocus driven by in situ and reanalysis data at Villum Research Station in northeast Greenland, The Cryosphere Discuss. [preprint], https://doi.org/10.5194/tc-2021-100, 2021.
Krinner, G., Derksen, C., Essery, R., Flanner, M., Hagemann, S., Clark, M., Hall, A., Rott, H., Brutel-Vuilmet, C., Kim, H., Ménard, C. B., Mudryk, L., Thackeray, C., Wang, L., Arduini, G., Balsamo, G., Bartlett, P., Boike, J., Boone, A., Chéruy, F., Colin, J., Cuntz, M., Dai, Y., Decharme, B., Derry, J., Ducharne, A., Dutra, E., Fang, X., Fierz, C., Ghattas, J., Gusev, Y., Haverd, V., Kontu, A., Lafaysse, M., Law, R., Lawrence, D., Li, W., Marke, T., Marks, D., Ménégoz, M., Nasonova, O., Nitta, T., Niwano, M., Pomeroy, J., Raleigh, M. S., Schaedler, G., Semenov, V., Smirnova, T. G., Stacke, T., Strasser, U., Svenson, S., Turkov, D., Wang, T., Wever, N., Yuan, H., Zhou, W., and Zhu, D.: ESM-SnowMIP: assessing snow models and quantifying snow-related climate feedbacks, Geosci. Model Dev., 11, 5027–5049, https://doi.org/10.5194/gmd-11-5027-2018, 2018.
Lackner, G., Domine, F., Nadeau, D. F., Lafaysse, M., and Dumont, M.: Snow properties at the forest–tundra ecotone: predominance of water vapor fluxes even in deep, moderately cold snowpacks, The Cryosphere, 16, 3357–3373, https://doi.org/10.5194/tc-16-3357-2022, 2022.
Lafaysse, M., Cluzet, B., Dumont, M., Lejeune, Y., Vionnet, V., and Morin, S.: A multiphysical ensemble system of numerical snow modelling, The Cryosphere, 11, 1173–1198, https://doi.org/10.5194/tc-11-1173-2017, 2017.
Larue, F., Royer, A., De Sève, D., Roy, A., Picard, G., Vionnet, V., and Cosme, E.: Simulation and Assimilation of Passive Microwave Data Using a Snowpack Model Coupled to a Calibrated Radiative Transfer Model Over Northeastern Canada, Water Resour. Res., 54, 4823–4848, https://doi.org/10.1029/2017wr022132, 2018.
Le Corre, M., Dussault, C., and Côté, S. D.: Weather conditions and variation in timing of spring and fall migrations of migratory caribou, J. Mammal., 98, 260–271, https://doi.org/10.1093/jmammal/gyw177, 2017.
Lehning, M., Bartelt, P., Brown, B., Fierz, C., and Satyawali, P.: A physical SNOWPACK model for the Swiss avalance warning Part II. Snow microstructure, Cold Reg. Sci. Technol., 35, 147–167, https://doi.org/10.1016/S0165-232X(02)00073-3, 2002.
Libois, Q., Picard, G., Arnaud, L., Morin, S., and Brun, E.: Modeling the impact of snow drift on the decameter-scale variability of snow properties on the Antarctic Plateau, J. Geophys. Res.-Atmos., 119, 11662–11681, https://doi.org/10.1002/2014jd022361, 2014.
Marsh, P., Bartlett, P., MacKay, M., Pohl, S., and Lantz, T.: Snowmelt energetics at a shrub tundra site in the western Canadian Arctic, Hydrol. Process., 24, 3603–3620, https://doi.org/10.1002/hyp.7786, 2010.
Martin, E. and Lejeune, Y.: Turbulent fluxes above the snow surface, Ann. Glaciol., 26, 179–183, 1998.
Martin, J. and Schneebeli, M.: Impact of the sampling procedure on the specific surface area of snow measurements with the IceCube, The Cryosphere, 17, 1723–1734, https://doi.org/10.5194/tc-17-1723-2023, 2023.
Mazzotti, G., Nousu, J.-P., Vionnet, V., Jonas, T., Nheili, R., and Lafaysse, M.: Exploring the potential of forest snow modeling at the tree and snowpack layer scale, The Cryosphere, 18, 4607–4632, https://doi.org/10.5194/tc-18-4607-2024, 2024.
Meloche, J., Langlois, A., Rutter, N., Royer, A., King, J., Walker, B., Marsh, P., and Wilcox, E. J.: Characterizing tundra snow sub-pixel variability to improve brightness temperature estimation in satellite SWE retrievals, The Cryosphere, 16, 87–101, https://doi.org/10.5194/tc-16-87-2022, 2022.
Meredith, M., Sommerkorn, M., Cassotta, S., Derksen, C., Ekaykin, A., and Hollowed, A.: Chapter 3 – Polar Regions, in: The Ocean and Cryosphere in a Changing Climate, Cambridge University Press, 203–320, https://doi.org/10.1017/9781009157964.005, 2019.
Oleson, K. W., Lawrence, D. D., Bonan, B., G., Flanner, M. G., Kluzek, E., Lawrence, P. J., Levis, S., Swenson, S. C., and Thornton, P.: Technical Description of version 4.0 of the Community Land Model (CLM), Technical Note NCAR/TN-478+STR, National Centre for Atmospheric Research, Boulder, Colorado, 2010.
Ouellet, F., Langlois, A., Blukacz-Richards, E. A., Johnson, C. A., Royer, A., Neave, E., and Larter, N. C.: Spatialization of the SNOWPACK snow model for the Canadian Arctic to assess Peary caribou winter grazing conditions, Phys. Geogr., 38, 143–158, https://doi.org/10.1080/02723646.2016.1274200, 2016.
Pahaut, E.: Snow crystal metamorphosis, Monographies de la Meteorologie Nationale, 96, Météo France, 1975.
Pomeroy, J., Marsh, P., and Lesack, L.: Relocation of Major Ions in Snow along the Tundra-Taiga Ecotone, Nord. Hydrol., 24, 151–168, 1993.
Pomeroy, J. W., Marsh, P., and Gray, D. M.: Application of a distributed blowing snow model to the Arctic, Hydrol. Process., 11, 1451–1464, https://doi.org/10.1002/(sici)1099-1085(199709)11:11<1451::Aid-hyp449>3.0.Co;2-q, 1997.
Quinton, W. L. and Marsh, P.: A conceptual framework for runoff generation in a permafrost environment, Hydrol. Process., 13, 2563–2581, https://doi.org/10.1002/(sici)1099-1085(199911)13:16<2563::Aid-hyp942>3.0.Co;2-d, 1999.
Royer, A., Picard, G., Vargel, C., Langlois, A., Gouttevin, I., and Dumont, M.: Improved Simulation of Arctic Circumpolar Land Area Snow Properties and Soil Temperatures, Front. Earth Sci., 9, 2296–6463, https://doi.org/10.3389/feart.2021.685140, 2021.
Rutter, N., Essery, R., Pomeroy, J., Altimir, N., and Andreadis, K.: Evaluation of forest snow processes models (SnowMIP2), J. Geophys. Res., 114, DO6111, https://doi.org/10.1029/2008JD011063, 2009.
Rutter, N., Sandells, M. J., Derksen, C., King, J., Toose, P., Wake, L., Watts, T., Essery, R., Roy, A., Royer, A., Marsh, P., Larsen, C., and Sturm, M.: Effect of snow microstructure variability on Ku-band radar snow water equivalent retrievals, The Cryosphere, 13, 3045–3059, https://doi.org/10.5194/tc-13-3045-2019, 2019.
Schleef, S., Löwe, H., and Schneebeli, M.: Influence of stress, temperature and crystal morphology on isothermal densification and specific surface area decrease of new snow, The Cryosphere, 8, 1825–1838, https://doi.org/10.5194/tc-8-1825-2014, 2014.
Skiles, S. M., Flanner, M., Cook, J. M., Dumont, M., and Painter, T. H.: Radiative forcing by light-absorbing particles in snow, Nat. Clim. Change, 8, 964–971, https://doi.org/10.1038/s41558-018-0296-5, 2018.
Sturm, M., Holmgren, J., König, M., and Morris, K.: The thermal conductivity of seasonal snow, J. Glaciol., 43, 26–41, https://doi.org/10.3189/s0022143000002781, 1997.
Teufelsbauer, H.: A two-dimensional snow creep model for alpine terrain, Nat. Hazards, 56, 481–497, https://doi.org/10.1007/s11069-010-9515-8, 2011.
Touzeau, A., Landais, A., Morin, S., Arnaud, L., and Picard, G.: Numerical experiments on vapor diffusion in polar snow and firn and its impact on isotopes using the multi-layer energy balance model Crocus in SURFEX v8.0, Geosci. Model Dev., 11, 2393–2418, https://doi.org/10.5194/gmd-11-2393-2018, 2018.
Tutton, R., Darkin, B., Essery, R., Griffith, J., Hould Gosselin, G., Marsh, P., Sonnentag, O., Thorne, R., and Walker, B.: A hydro-meterological dataset from the taiga-tundra ecotone in the western Canadian Arctic: Trail Valley Creek, Northwest Territories (1991–2023) (V1), Borealis [data set], https://doi.org/10.5683/SP3/BXV4DE, 2024.
Vionnet, V., Brun, E., Morin, S., Boone, A., Faroux, S., Le Moigne, P., Martin, E., and Willemet, J.-M.: The detailed snowpack scheme Crocus and its implementation in SURFEX v7.2, Geosci. Model Dev., 5, 773–791, https://doi.org/10.5194/gmd-5-773-2012, 2012.
Vionnet, V., Guyomarc'h, G., Naaim Bouvet, F., Martin, E., Durand, Y., Bellot, H., Bel, C., and Puglièse, P.: Occurrence of blowing snow events at an alpine site over a 10-year period: Observations and modelling, Adv. Water Resour., 55, 53–63, https://doi.org/10.1016/j.advwatres.2012.05.004, 2013.
Vionnet, V., Verville, M., Fortin, V., Brugman, M., Abrahamowicz, M., Lemay, F., Thériault, J. M., Lafaysse, M., and Milbrandt, J. A.: Snow Level From Post-Processing of Atmospheric Model Improves Snowfall Estimate and Snowpack Prediction in Mountains, Water Resour. Res., 58, e2021WR031778, https://doi.org/10.1029/2021wr031778, 2022.
Walker, B. and Marsh, P.: Snow depth, density, and snow water equivalent observations at Trail Valley Creek Research Station, Northwest Territories, 2015–2019 (V1), Borealis [data set], doi/10.5683/SP2/RUSEHA, 2021.
Walter, B., Weigel, H., Wahl, S., and Löwe, H.: Wind tunnel experiments to quantify the effect of aeolian snow transport on the surface snow microstructure, The Cryosphere, 18, 3633–3652, https://doi.org/10.5194/tc-18-3633-2024, 2024.
Weise, M.: Time-lapse tomography of mass fluxes and microstructural changes in snow, PhD thesis, ETH, Zurich, https://doi.org/10.3929/ethz-b-000213853, 2017.
Woolley, G.: georginawoolley/Arctic_SVS2-Crocus: Arctic_SVS2
_Crocus (v.1.1), Zenodo [data set], https://doi.org/10.5281/ zenodo.14259166, 2024a.
Woolley, G.: Arctic SVS2-Crocus Ensemble Output (v.2), figshare [data set], https://doi.org/10.6084/m9.figshare.25639215.v2, 2024b.
Woolley, G. J., Vionnet, V., Rutter, N., Wake, L., Derksen, C., Essery, R., Lafaysse, M., Tutton, R., Walker, B., Marsh, P., and Pritchard, D.: Code for the Soil, Vegetation and Snow version 2 (SVS2) land surface model with Arctic modifications. (v.1), Zenodo [code], https://doi.org/10.5281/zenodo.14273138, 2024.
Yen, Y.-C.: Review of the thermal properties of snow, ice and sea ice, Tech. Rep., Cold Regions Research and Engineering Laboratory, Havover, NH, 1981.
Zuanon, N.: IceCube, a portable and reliable instrument for snow specific surface area measurement in the field, in: International Snow Science Workshop Grenoble-Chamonix Mont-Blanc-2013 proceedings, 1020–1023, 2013.
- Abstract
- Introduction
- Study location
- Data and methods
- Results
- Discussion
- Conclusion
- Appendix A: The default and Arctic SVS2-Crocus ensemble options
- Appendix B: 32-year time series of SWE, snow depth, and bulk density (1991–2023)
- Appendix C: Analysis of the lowest 10 cm of simulated and measured snow density
- Appendix D: Top 30 default, Arctic, and mixed ensemble members for simulation of snow density
- Code and data availability
- Author contributions
- Competing interests
- Disclaimer
- Acknowledgements
- Financial support
- Review statement
- References
- Supplement


