the Creative Commons Attribution 4.0 License.
the Creative Commons Attribution 4.0 License.
Reanalysis of the longest mass balance series in Himalaya using a nonlinear model: Chhota Shigri Glacier (India)
Mohd Farooq Azam
Christian Vincent
Smriti Srivastava
Etienne Berthier
Patrick Wagnon
Himanshu Kaushik
Md. Arif Hussain
Manoj Kumar Munda
Arindan Mandal
Alagappan Ramanathan
The glacier-wide mass balance (MB) series on Chhota Shigri Glacier has been reanalysed by combining the traditional MB reanalysis framework and a nonlinear MB model. The nonlinear model is preferred over the traditional glaciological method to compute the glacier-wide MBs, as the former can capture the spatiotemporal variability in point MBs from a heterogeneous in situ point MB network. Further, the nonlinear model is also used to detect erroneous measurements from the point MB observations over 2002–2023. ASTER and Pléiades stereo imagery show limited areal changes but negative mass balances of −0.38 ± 0.05 during 2003–2014 and −0.51 ± 0.06 during 2014–2020. The nonlinear model outperforms the traditional glaciological method and agrees better with these geodetic estimates. The reanalysed mean glacier-wide MB over 2002–2023 is −0.47 ± 0.19 , equivalent to a cumulative loss of −9.81 ± 0.87 Our analysis suggests that the nonlinear model can also be used to complete the MB series if for some years the field observations are poor or unavailable. With this analysis, we revisit the glacier-wide MB series of Chhota Shigri Glacier and provide the most accurate and up-to-date version of this series, the longest continuous ever recorded in the Himalaya. We recommend applying the nonlinear model on all traditional glaciological mass balance series worldwide whenever data are sufficient, especially in the Himalaya, where in situ data are often missing due to access issues.
- Article
(8242 KB) - Full-text XML
-
Supplement
(978 KB) - BibTeX
- EndNote
Glaciers are excellent indicators of changing climate; therefore, long-term glacier mass changes are observed to understand the impacts of climate change (Oerlemans, 2001; Zemp et al., 2019). Glacier monitoring is also essential to understand possible glacial hazards (Harrison et al., 2018; Shukla et al., 2018; Shugar et al., 2021; Gantayat and Ramsankaran, 2023), regional hydrology (Azam et al., 2021; Yao et al., 2022; Nepal et al., 2023), and sea level rise (Gardner et al., 2013; Rounce et al., 2023). The glacier mass balance (MB) can be estimated from satellite data, through modelling approaches, or measured using the field-based traditional glaciological method (Cogley, 2009; Zemp et al., 2015; Kumar et al., 2018; Miles et al., 2021; Berthier et al., 2023).
Over the last decade, rapid development has been made through satellite geodetic MB estimates covering almost all glacierized areas in the Himalaya (Brun et al., 2017; Bolch et al., 2019; Shean et al., 2020; Hugonnet et al., 2021; Jackson et al., 2023). These geodetic estimates are primarily available at a multiannual scale and thus cannot be used to study the inter-annual variability in glacier MB. Conversely, field measurements using standard methods (Østrem and Stanley, 1969) yield data on the seasonal/annual response of glacier MB to local meteorological conditions (Zemp et al., 2015). Field MB observations remain scarce in the Himalaya compared to the other mountain ranges (Azam et al., 2018) and have been limited to only 35 glaciers (Vishwakarma et al., 2022). Most observations are available from easily accessible and small glaciers for short periods that are generally shorter than 10–15 years. The ongoing MB series include Chhota Shigri, Hōksar, Kolahoi, and Sutri Dhaka glaciers in the western Himalaya (Oulkar et al., 2022; Mandal et al., 2020; Romshoo et al., 2022; 2023); Mera, Pokalde, Rikha Samba, Trambau, West Changri Nup, and Yala glaciers in the central Himalaya (Sunako et al., 2019; Wagnon et al., 2021; Stumm et al., 2021); and Ganju La and Thana glaciers in the eastern Himalaya (Tshering and Fujita, 2016).
For annual glacier-wide MB estimation, the traditional glaciological method has been used in the Himalaya (Azam et al., 2018). This method involves interpolation/extrapolation of point MB measurements from fixed locations to the whole glacier area by applying different approaches, including contouring, profiling, and kriging (Østrem and Brugman, 1991; Zemp et al., 2013), or by the application of observed MB gradients to the glacier hypsometry (Funk et al., 1997; Wagnon et al., 2021). The selected point measurement sites may not be representative of the surrounding areas because (1) ablation stakes are often inserted away from the steep slopes towards the valley walls for safety reasons, and thus, snow avalanche inputs onto valley glaciers are not included; (2) crevassed areas are not sampled; (3) snow accumulation is site-specific and largely depends on local topography that controls snow drift and deposition; and (4) harsh weather sometimes restricts access to accumulation measurement sites. Almost all the MB series are victims of one issue or other such issues; therefore, the estimated glacier-wide MBs often carry systematic biases (Thibert et al., 2008). These biases can be corrected by calibrating the MB series using satellite-derived geodetic mass estimates generally over 5–10 years (Zemp et al., 2013; Wagnon et al., 2021).
Furthermore, it is practically difficult to keep the position fixed for point measurements due to accessibility issues, stake displacement due to glacier dynamics, use of different surveying equipment (GPS, dGPS, total station, theodolite, etc.), and different researchers' involvement for decades of monitoring. Hence, the measurement network differs in space and time. In this situation, heterogeneous in situ measurements do not always allow us to catch the large spatiotemporal variability in point MBs within the same elevation range (Funk et al., 1997; Vincent and Six, 2013); consequently, the point MB–elevation relationship is insufficient to investigate the changes in glacier-wide MBs (Kuhn, 1984; Huss and Bauder, 2009; Thibert et al., 2013).
To include the spatiotemporal variability in point MB measurements, Lliboutry (1974) proposed a linear statistical model and tested it over the small ablation area of Saint-Sorlin Glacier (France), assuming similar temporal changes in the MB over the whole area. Vincent et al. (2018) suggested that the linear model of Lliboutry (1974) was valid over a limited elevation range but ignored the decreasing spatiotemporal variability in point MBs with elevation (Oerlemans, 2001). To address this issue, they proposed a nonlinear model that considers the decreasing spatiotemporal changes in point MBs over the large elevation range and successfully tested their model on four different glaciers from different climate regimes, including Chhota Shigri Glacier (India).
The MBs on Chhota Shigri Glacier were estimated using the nonlinear model over 2002–2016 and then calibrated using geodetic MB over 2005–2014 (Vincent et al., 2018). In the present study, we extended the MB series on Chhota Shigri Glacier up to 2023 using the traditional method, estimated the areal changes and geodetic MBs over the 2003–2014 and 2014–2020 periods, estimated the debris cover as of September 2020, and reanalysed the annual MB series since 2002 using a novel reanalysis framework that combines the Vincent et al. (2018) nonlinear model and the reanalysis framework proposed by Zemp et al. (2013). Additionally, we assessed areal changes and geodetic MBs of neighbouring glaciers Hamtah and Sichum over the same periods based on available satellite stereo images.
Since 2002, the MB series of Chhota Shigri Glacier has been continuously monitored, making it the longest series in the Himalaya. Azam (2021) highlighted the importance of Chhota Shigri as a reference glacier for large-scale MB and hydrological studies; therefore, the main aim of the present study is to produce the most accurate glacier-wide MB series in this region. First, the nonlinear model of Vincent et al. (2018) was used to detect the erroneous point MB measurements in the data set. Second, the nonlinear model was applied using the observed point MBs to estimate the glacier-wide MB at an annual scale. Third, homogenization of the glacier-wide MB series accounting for glacier areal changes was performed, and fourth, the glacier-wide MB series was calibrated using geodetic MBs. Additionally, we compared the performance of the nonlinear model with the traditional method for estimating glacier-wide MB. We also assessed the nonlinear model's ability to estimate glacier-wide MB using end-of-season snow line data when field measurements were unavailable in a particular year.
Chhota Shigri Glacier (32.28° N, 77.58° E) is in the Chandra River basin, a tributary of Upper Indus Basin, Lahaul–Spiti valley of the western Himalaya (Fig. 1). Chhota Shigri flows from 5830 to 4100 , with a length of ∼ 9 km and an area of 15.47 km2 (in 2020). Based on the most updated map obtained in September 2020, 12 % of its total surface area is covered with debris between the snout and 4500 , including medial and lateral moraines from 4100 to ∼ 4900 and a debris-covered eastern tributary glacier (Fig. 1). Debris thickness ranges from less than a few centimetres of thin debris to a few metres of boulders. Valley walls bound its accumulation area with the highest Devachan peak (6250 ). The accumulation area has two east- and west-oriented tributaries that feed to the main ablation area (< 5070 ), having a north aspect and divided into two parallel flows by a medial moraine.
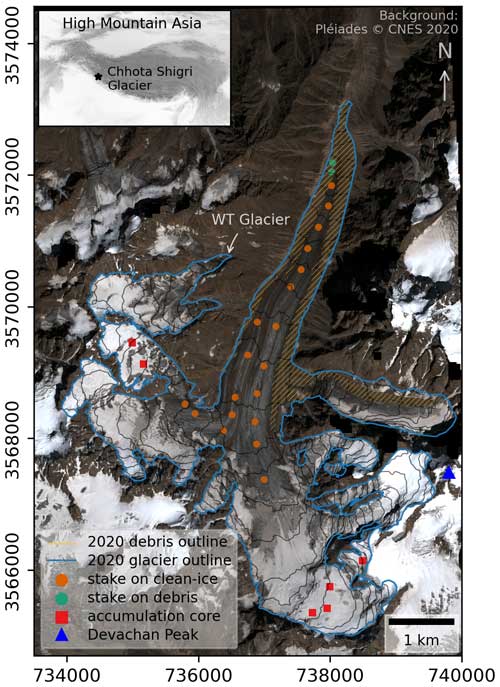
Figure 1Chhota Shigri Glacier, showing the location of ablation and accumulation point measurement sites. Orange strips show the debris-covered glacier area. The background image is a Pléiades satellite image taken on 12 September 2020 (© CNES 2020; Distribution Airbus Defence and Space). The glacier extent corresponds to 12 September 2020. The coordinates are in the Universal Transverse Mercator (UTM) north zone 43.
Chhota Shigri is a well-studied glacier for various aspects, including traditional MBs, energy balance, dynamics, ice thickness, and hydrology (Wagnon et al., 2007; Azam et al., 2012; Ramsankaran et al., 2018; Haq et al., 2021; Srivastava and Azam, 2022a; Mandal et al., 2020, 2022). Several studies have also observed its geodetic MBs (Berthier et al., 2007; Vincent et al., 2013; Brun et al., 2017; Mukherjee et al., 2018). Long-term annual MBs have been reconstructed over 1950–2020, applying a temperature index model (Srivastava et al., 2022), and over 1979–2020, using an energy balance model (Srivastava and Azam, 2022b). Due to recent glacier wastage on Chhota Shigri Glacier, the western tributary (WT) glacier got disconnected in the summer of 2012 (Srivastava et al., 2022). The fragmented tributary is now clearly visible in the high-resolution Pléiades image from 12 September 2020 (Fig. 1).
In this study, we focus on Chhota Shigri Glacier, but the available satellite stereo images also cover neighbouring Hamtah and Sichum glaciers; therefore, we also estimated the areal changes and geodetic MBs for these two glaciers (Sects. 3.4 and 3.5). Hamtah Glacier has been studied for its MBs and avalanche contribution (Vincent et al., 2013; Laha et al., 2017). Furthermore, for all three glaciers, we also delineated the debris cover corresponding to 2020 (Table 1).
3.1 Traditional mass balance method
Glacier-wide annual MBs (Ba) have been estimated using a network of 22–25 ablation bamboo stakes (inserted up to 10 m into the glacier) distributed over 4300–4900 along the main axis of the glacier (Fig. 1) and 4–6 accumulation pits/cores over 5160–5550 distributed over the eastern and western tributaries of the glacier (Wagnon et al., 2007). The traditional glaciological profile method was used to estimate the glacier-wide MB from the observed point MBs (Østrem and Stanley, 1969). First, using the observed point MBs, the mean altitudinal MBs were estimated for each 50 m elevation band from available point MBs within each elevation band (Fig. 1). In case no measurements were available (due to loss of stakes or missing accumulation measurements) the MBs were estimated using linear interpolation/extrapolation of neighbouring bands. Second, the Ba (in ) was estimated as follows:
where bz is the mean altitudinal MB (in ) of a given elevation band, z, for area sz (m2); and S is the total glacier area (m2). In the ablation area, emergence changes at each ablation stake were converted to the point MB using a fixed density of 900 kg m−3 for ice and 350 kg m−3 for snow (Wagnon et al., 2007; Cogley et al., 2011), while in the accumulation area, the varying snow, firn, or ice densities (350–900 kg m−3) were measured in the field. The hydrological year for MB calculations is defined from 1 October to 30 September of the following year; however, the exact measurement dates on site varied from a couple of days to a week. Following Thibert et al. (2008), an overall uncertainty of ± 0.40 for glacier-wide MB was estimated by incorporating the errors in point measurements and their distribution over the glacier (Azam et al., 2012).
Due to access difficulties, such as snowstorms on 22–24 September 2018, or logistical or budget issues, a limited number of point MB measurements could be carried out in some years. This was the case for October 2015, when only two accumulation measurements could be performed, or 2018, when measurements were done early in the season before the storm. For those 2 years, point MB data in the accumulation zone, where no measurements had been taken, were estimated using previous years with a similar ablation pattern (Mandal et al., 2020). In 2020, only two in situ point MB data were available, preventing the traditional method from being applied. Furthermore, no measurements could be performed in 2021; hence, no MB could be estimated. Table S1 in the Supplement provides all information about the point MBs and field expeditions since 2002.
3.2 Nonlinear mass balance model
The nonlinear MB model suggests that the observed point MB, bi,t, at any site i for year t can be decomposed into (1) a spatial effect term, αi, and (2) a temporal term, βt, combined with a spatial effect, γi, and can be written as (Vincent et al., 2018)
where αi, the spatial effect at location i, is the average point MB at the site over the whole study period; βt is the annual deviation from the average point MB (thus Σβt = 0); and is a scaling factor defined as the ratio of the standard deviation (SD) of annual MB at site i and the maximum standard deviation (σmax) observed from the point MB measurements over a long period. The εi,t term represents residuals resulting from measurement errors and inconsistencies between the model and observed data. The spatiotemporal decomposition proposed in Eq. (2) assumes that βt is the same at all point locations for any given year (t) and thus has a glacier-wide significance, while γi term accounts for nonlinear effects with elevation (Vincent et al., 2018).
To compute the scaling factor, γi, on Chhota Shigri Glacier, standard deviations were computed from the point MBs available for each 50 m elevation band as the point MBs are not available each year from the same fixed locations (Fig. 2). The standard deviations were computed only for 50 m elevation bands, where mean annual MBs were available from in situ measurements over a minimum of 10 years, and it was assumed that the computed standard deviations are representative of the whole period of investigation (2002–2023). This resulted in 16 standard deviation values over the whole glacier, with a maximum standard deviation of 1.17 at 4525 (4500–4550 band) and a minimum standard deviation of 0.40 at 5325 (5300–5350 band). The decreasing magnitude of the standard deviation with elevation indicates the decreasing sensitivity of the annual MB to temperature and precipitation (Fig. 2), as already suggested by several studies on glaciers worldwide (Kuhn, 1984; Soruco et al., 2009; Basantes-Serrano et al., 2016; Vincent et al., 2018; Wagnon et al., 2021). The measurements are poor in the accumulation area, and no measurement was available above 5325 ; therefore, after some trials, we adjusted the standard deviation at 6000 to be zero (Fig. 2). A decreasing trend in standard deviation values below 4525 (Fig. 2) is due to the presence of debris cover over the tongue of Chhota Shigri Glacier (Fig. 1) that undermines the glacier's sensitivity to climate (Vincent et al., 2013; Banerjee and Shankar, 2013). The scaling factor, γi, at each point MB location, was computed from the second-degree polynomial function fitted over the standard deviation vs. elevation scatter plot (Fig. 2).
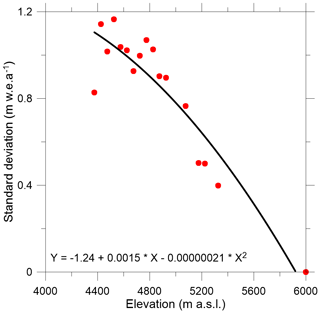
Figure 2Standard deviations of the annual MBs versus elevation. The black line corresponds to a polynomial fit (degree of freedom = 2). The standard deviations were estimated for those 50 m elevation bands, where a minimum of 10 years of point measurements were available at each site, and it is assumed to be zero at 6000 (above the glacier top at 5830 ).
The nonlinear model was run at 200 m × 200 m spatial resolution over 2002–2023 using all available point MBs (413 point measurements, excluding the erroneous measurements; Sect. 3.3) and polynomial equation (Fig. 2; details can be found in the supplement of Vincent et al., 2018). The MB is assumed to be spatially constant over each 200 m × 200 m grid for a given year. If there is more than one observation in a grid in a given year, then the mean MB of the available observations was used for MB computation. The grid size is a compromise between the spatial variability and the density of the available point measurements.
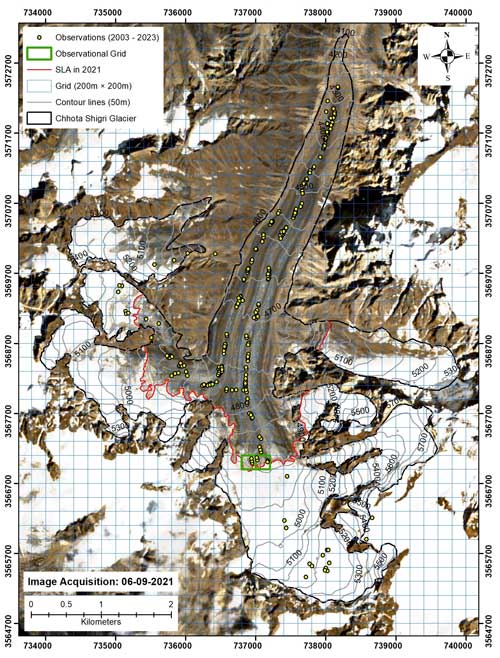
Figure 3Distribution of all 413 point MB measurements (yellow dots) available over 2002–2023 on Chhota Shigri Glacier. The grids (in light blue) show a spatial resolution of 200 m × 200 m of the nonlinear model. For 2020/2021, no field measurement was conducted; hence, two grids (shown with green colour outline) corresponding to zero MB were selected on the delineated SLA to run the model. The background is a Sentinel image from 6 September 2021, which is used to delineate the SLA.
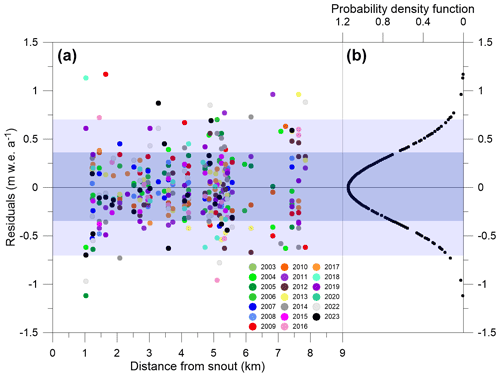
Figure 4(a) The residuals between measured and modelled point MBs from the nonlinear model using all available 423 point MBs as a function of distance from the glacier snout for each hydrological year between 2002 and 2023. The shaded dark blue and light blue envelopes represent the 1 and 2 SD values, respectively. (b) The probability density function (normal distribution curve) of all point MB residuals between 2002 and 2023.
Field measurements were unavailable in the 2020/2021 year (Sect. 3.1); hence, the nonlinear model cannot be run for this hydrological year. To run the model, at least one point MB measurement is required each year (Vincent et al., 2018). We assumed the snow line altitude (SLA) at the end of the ablation season to be equivalent to the equilibrium line altitude (ELA) (Rabatel et al., 2005; Brun et al., 2015; Davaze et al., 2020; Barandun et al., 2021). The SLA was delineated on a 6 September 2021 Sentinel image, and zero MBs (MB at ELA = 0 ) were assumed for two 200 m × 200 m grids for which MB observations were available from other years (Fig. 3). It should be noted that there was no other cloud-free image from September 2021. The MB estimation from SLA using the nonlinear model is discussed in detail in Sect. 5.3.
The model output provides the mean αi and mean γi for each point location over 2002–2023 and βt for each year (Eq. 2). A total of 54 values for αi and γi and 21 values for βt (corresponding to each hydrological year) were computed (Tables S2 and S3 in the Supplement). For the calculation of glacier-wide MB, a spatial distribution of αi over the whole surface area of the glacier is needed. First, for each 50 m elevation range (e), mean αe was estimated from all available αi, by taking a simple arithmetic mean, and γe from all available γi from respective elevation bands (Eq. 2). The modelled point MBs were available over the 4355–5512 elevation range, and beyond this range, the mean αe and γe from the lowest (4300–4350 ) and highest (5500–5550 ) ranges were used to cover the lowest (0.15 km2; 0.97 % of total area) and highest (0.68 km2; 4.40 % of total area) parts of the glacier. Second, applying αe, γe, and βt from all elevation bands in Eq. (1), along with corresponding elevation areas, the annual glacier-wide MBs over 2002–2023 were estimated.
3.3 Tracking the erroneous in situ point mass balances
The nonlinear model computes the residuals (difference between the measured and theoretical values) of each measured point MB and can detect errors in in situ point MB data (Vincent et al., 2018). The distribution of residuals over the glacier as a function of distance from the snout showed no spatiotemporal pattern (Fig. 4a), indicating that the nonlinear model does not provide any apparent bias for any specific year. As expected, the residuals followed a normal distribution with a standard deviation (SD) of 0.35 (Fig. 4b). To detect the measurement errors in the point MBs in the Chhota Shigri measurement network over 2002–2023, we assumed all the point MBs have residuals > 2 SD (0.70 ) to be suspicious. Of 423 point MB measurements, 15 such point MBs were found and investigated further. Five point MBs had been wrongly reported from the notebooks and thus have been corrected. We could not find any reason for the rest of the suspicious points. Therefore, they have been considered erroneous and discarded in the final model run. The erroneous data were collected in different years (five ablation point measurements from 2009, 2012, 2018, and 2022 and five accumulation point measurements from 2009, 2011, 2014, and 2022) (Fig. 4). The standard deviation of the residuals from the nonlinear model was reduced from 0.35 to 0.30 after correction/removal of suspicious point MB measurements.
3.4 Areal changes and debris cover estimation
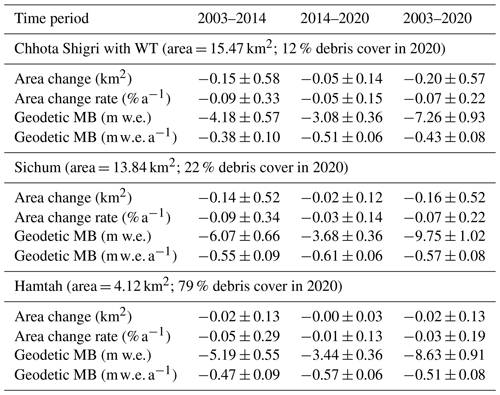
The areal changes and debris cover were estimated on Chhota Shigri, Sichum, and Hamtah glaciers by manual delineation following the Global Land Ice Measurements from Space (GLIMS) guidelines from the available ASTER (8 October 2003) and Pléiades images (26 September 2014 and 12 September 2020) (Raup et al., 2007). We have preferred manual delineation as it was considered the most accurate method for delineating glacier outlines (Stokes et al., 2007; Garg et al., 2017; Shukla and Qadir, 2016). The ice divides were interpreted using the Pléiades digital elevation model (DEM). The changes were estimated for the ablation area for 2014 and 2020 as the changes in the accumulation area were insignificant. The generated glacier outlines (2003, 2014, and 2020) were used to estimate the glacier area changes during 2003–2020. The uncertainties associated with the glacier area were calculated using the buffer method (Bolch et al., 2010; Chand and Sharma, 2015). The buffer size was half the pixel value (Bolch et al., 2010; Andreassen et al., 2022).
3.5 Geodetic mass balances
The geodetic MBs were estimated over two periods (2003–2014 and 2014–2020) for Chhota Shigri, Sichum, and Hamtah glaciers using satellite stereo images from ASTER (15 m resolution) acquired on 8 October 2003 and Pléiades (0.70 m resolution) acquired on 26 September 2014 and 12 September 2020, respectively. The ASTER October 2003 stereo pair was preferred to other ASTER or SPOT5 stereo pairs acquired in late summer 2002, 2004, and 2005 because it resulted in the smallest uncertainties. The stereo images were acquired close to the end of the hydrological year, reducing the impact of any seasonal offset. The DEM generation, co-registration, and MB calculation procedure is the same as in Falaschi et al. (2023). Uncertainties for the glacier-wide geodetic MB were estimated using the patch method (Wagnon et al., 2021). This method aims to empirically determine the uncertainty associated with the mean elevation change by sampling patches of stable terrain of various sizes to measure the decay of the error with the averaging area.
Geodetic MBs were estimated over 10.97 years (from 8 October 2003 to 26 September 2014) and 5.96 years (from 26 September 2014 to 12 September 2020) and linearly scaled to estimate the geodetic MBs over 11- and 6-year periods, respectively, to make a direct comparison with the in situ MBs (estimated from end of September to the end of September in the next year). Furthermore, the geodetic MBs included both the WT glacier, which fragmented around 2012 (Srivastava et al., 2022), and the main Chhota Shigri (area-weighted) (Table 1) for a direct comparison with the traditional and nonlinear MBs that include the WT glacier.
3.6 Homogenization of glacier-wide mass balances
In initial studies (Wagnon et al., 2007; Azam et al., 2012), a fixed hypsometry (glacier area and elevation) from SPOT5 2005 DEM was used, while in follow-up studies (Azam et al., 2014; Mandal et al., 2020) a fixed hypsometry from the Pléiades August 2014 DEM was used to estimate the traditional MBs on Chhota Shigri Glacier. These fixed hypsometries insert bias in the MB series (Cogley et al., 2011; Zemp et al., 2013). Here, the Chhota Shigri Glacier annual MBs (from the traditional method and nonlinear model) are homogenized with the linearly changing annual hypsometries from ASTER and Pléiades DEMs over 2003–2014 and Pléiades DEMs over 2014–2020 (Sect. 4.1). We adopted the approach suggested by Zemp et al. (2013) that assumes a linear area change over a record period (N years) and estimates the area (s) of an elevation band (e) for each year (t) as follows:
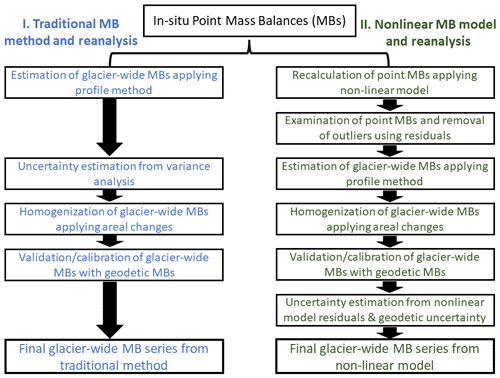
where se,0 and se,N are the elevation bin areas from the first and the second geodetic survey, respectively, and the time t is zero in the year of the first survey. The homogenization process of both traditional and nonlinear MB series changed the annual glacier-wide MBs at most by 0.02 , reflecting the negligible impact of areal changes over the 2003–2020 period on Chhota Shigri Glacier (Sect. 4.1). Post-2020, the hypsometry of the 2020 year was used to estimate the MBs until 2023. Figure 5 summarizes the overall methodology step by step, including homogenization, validation/calibration, and error estimation (Sect. 3.7 and 3.9).
3.7 Validation and calibration of glacier-wide mass balances
Previously, we validated the traditional MBs with geodetic MB available over 2005–2014 (Azam et al., 2016). The systematic biases were within the uncertainty ranges of traditional and geodetic MBs; hence, no calibration was done. In this study, we repeated this validation over two periods for which the geodetic MBs were calculated (Sect. 4.2).
The traditional, as well as nonlinear, MBs over 2003–2014 were not statistically different from the geodetic MB, and the null hypothesis H0 (the cumulative glaciological MB is not statistically different from the geodetic MB) was accepted at 95 % and 90 % levels (Zemp et al., 2013). However, over 2014–2020, both traditional and nonlinear MBs were statistically different from the geodetic MBs, and the null hypothesis H0 was rejected at 95 % and 90 % levels. This showed that the systematic biases were significant over 2014–2020 (Table 2). Even though we did not observe a significant bias over 2003–2014, we decided to calibrate the traditional and nonlinear MBs over both periods, as suggested in previous studies (Thibert et al., 2008; Huss et al., 2009; Andreassen et al., 2016; Wagnon et al., 2021).
In the calibration procedure, the annual relative variability in glacier-wide MBs is taken from the MB series and the series was fitted to the multi-annual geodetic MB, Bg, as follows:
where Ba,cal is the annual calibrated glacier-wide MB, and N is the number of years over which the geodetic MB has been estimated. It should be mentioned that the MBs obtained from traditional method or nonlinear model refer only to the surface MB, whereas the geodetic MBs also integrate the internal and basal MBs, assumed to be small compared to the surface MB (Cuffey and Paterson, 2010).
3.8 Calibration of mean altitudinal mass balances
The mean altitudinal MBs (be,t) for each 50 m elevation band (e) and each year (t) were computed using Eq. (1), exploiting the values of αi, βt, and γi obtained from the nonlinear model. These altitudinal mean MBs were adjusted to fit the calibrated annual glacier-wide MBs, following Zemp et al. (2013). The calibrated altitudinal mean MB () for each year is estimated as
where Ba is the uncalibrated annual nonlinear MBs, and Ba,cal is the calibrated annual nonlinear MBs. The equilibrium line altitude (ELAcal) and MB gradient for each year (t) are also estimated by plotting the linear regression over the calibrated annual mean altitudinal MBs () over an elevation range of 4375–5225 m. Finally, using the calibrated ELAs, the calibrated accumulation area ratios (AARs) were estimated each year (Table 3).
3.9 Random error estimation in nonlinear mass balances
The random error () in calibrated nonlinear glacier-wide MB is estimated following:
is the error in the geodetic MBs ( = 0.57 and 0.36 over 2003–2014 and 2014–2020, respectively), N is the number of years for geodetic MB estimation (Sect. 3.3), si terms represent the relative areas of each 50 m elevation band (except for the 5400–5850 range that has been treated as a single band) compared to the total glacier area (therefore, Σsi = 1), and σε = 0.30 is the standard deviation of the residual term of Eq. (2) obtained with the nonlinear model (Sect. 3.2). Equation (6) is valid for the hydrological years within calibration periods (2003–2014 and 2014–2020). The random errors in nonlinear glacier-wide MBs for 2002/2003 and 2020–2023 hydrological years were estimated following the procedure described in Wagnon et al. (2021). The mean annual random error, , of the calibrated nonlinear glacier-wide MB was estimated to be ± 0.19 over 2002–2023, with slightly higher random errors for the years outside the calibration period (Table 3).
4.1 Glacier area changes since 2003
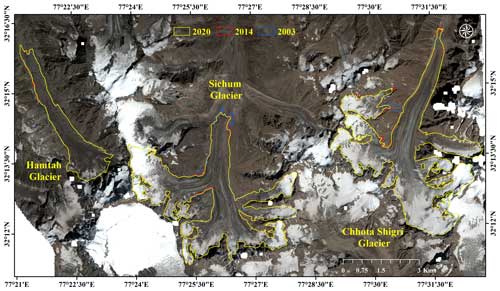
Chhota Shigri, Sichum, and Hamtah glaciers showed limited areal changes since 2003, mostly restricted to the snout area (Table 1; Fig. 6). The estimated debris cover, corresponding to September 2020, was 12 %, 22 %, and 79 % of the total area on Chhota Shigri, Sichum, and Hamtah glaciers, respectively (Table 1). During 2003–2020, the total area change for each glacier was very small, with a deglaciation rate of −0.07 ± 0.22 % a−1, −0.07 ± 0.22 % a−1, and −0.03 ± 0.19 % a−1 for Chhota, Sichum, and Hamtah, respectively (Table 1).
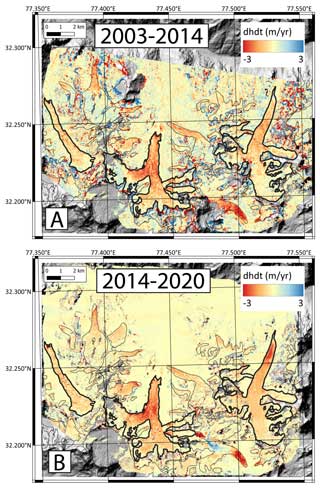
Figure 7The thickness changes for Chhota Shigri, Sichum, and Hamtah glaciers differencing the ASTER 2003 (8 October 2003) and Pléiades (26 September 2014) DEMs over 2003–2014 and Pléiades DEMs (26 September 2014 and 12 September 2020) over 2014–2020.
Table 2Cumulative MBs (in parenthesis; mean annual MBs) from the traditional method, nonlinear model, and geodetic estimates over available periods. The balance year 2002/2003 is not included here as it is not covered in the geodetic estimate available over 2003–2014. The cumulative traditional MB over the 2014–2020 period has been estimated by adding the modelled annual MB for 2019/2020 (Srivastava and Azam, 2022b). All units are in ().

∗ Estimated from traditional MBs (2014–2019) and modelled MB (2019/2020).
4.2 Geodetic mass balances
The maps of elevation changes for 2003–2014 and 2014–2020 periods indicate a general pattern of thinning for the glacier tongues and limited changes in the upper reaches of the glaciers (Fig. 7). The area-weighted geodetic MB of Chhota Shigri Glacier (including WT) was −0.43 ± 0.08 over 2003–2020 (Table 1), with a higher annual wastage of −0.51 ± 0.06 over 2014–2020 compared to −0.38 ± 0.10 over 2003–2014 (Table 2). Sichum and Hamtah glaciers showed slightly stronger annual mass wastage of −0.57 ± 0.08 and −0.51 ± 0.08 , respectively, over 2003–2020, with similarly an increased mass wastage over the recent period (2014–2020) (Table 1). The slightly more negative glacier-wide MBs on all these glaciers during 2014–2020 agree with a recent study, suggesting an increased wastage over the recent decade in the Himalaya (Hugonnet et al., 2021).
The mean annual geodetic mass wastage of −0.43 ± 0.08 on Chhota Shigri Glacier over 2003–2020 is in good agreement with the region-wide mean glacier mass wastage of −0.37 ± 0.15 over the whole Lahaul–Spiti region (glacierized area = 7960 km2) during a slightly different period (2000–2016) from multiple ASTER DEMs (Brun et al., 2017). Hence, Chhota Shigri is a reference glacier in the Himalaya (Azam, 2021) and a representative glacier for the whole Lahaul–Spiti region, as already suggested (Vincent et al., 2013).
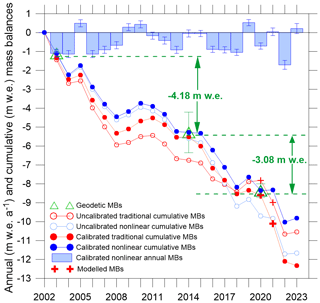
Figure 8Calibrated nonlinear annual glacier-wide MBs (with random errors) over 2002–2023, traditional cumulative MBs over 2002–2023, nonlinear cumulative MBs over 2002–2023, calibrated nonlinear cumulative MBs over 2002–2023, calibrated traditional cumulative MBs over 2002–2023, and geodetic MBs over 2003–2014 and 2014–2020 (with estimated uncertainties). The cumulative traditional MB series (2002–2019) is completed until 2023 by adding the modelled MB of 2019/2020 and 2020/2021 from Srivastava and Azam (2022b).
4.3 Annual and cumulative glacier-wide mass balances since 2002
Table 2 and Fig. 8 show the traditional and nonlinear MBs (before and after calibration) and geodetic MBs over available periods. The traditional MBs were not available for 2019/2020 and 2020/2021 (Sect. 3.1); therefore, to calibrate these MBs and to cover the geodetic observations, the modelled MBs (2019/2020 = 0.07 and 2020/2021 = −1.17 ) from surface energy balance approach (Srivastava and Azam, 2022b) were added to the series.
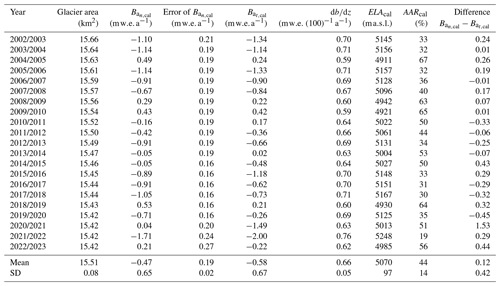
Table 3Calibrated nonlinear MBs (), calibrated traditional MBs (), MB gradients (), ELAcal, and AARcal on Chhota Shigri Glacier between 2002 and 2023.
∗ The calibrated traditional MBs for 2019/2020 and 2020/2021 years are originally from the model (Srivastava and Azam, 2022b).
Compared to uncalibrated traditional MB series, uncalibrated nonlinear MB series showed much smaller biases, with a slightly negative bias of −0.03 (against a bias of −0.10 in traditional MBs) over 2003–2014 and of −0.17 (against a bias of 0.33 in traditional MBs) over 2014–2020 (Table 2; Fig. 8). Therefore, following Eq. (4), the nonlinear annual MBs were systematically increased by 0.03 over 2003–2014 and by 0.17 over 2014–2020, while traditional MBs were systematically increased by 0.10 over 2003–2014 and decreased by 0.33 over 2014–2020 to match the geodetic estimates (Fig. 8). The hydrological years 2002/2003 and 2020–2023 are outside the calibration periods, but these years were also calibrated by the mean values of biases observed over 2003–2014 and 2014–2020, respectively. To avoid confusion, we discussed only the calibrated nonlinear glacier-wide MBs in the paper, although the calibrated traditional MBs are given in Table 2 and 3 for reference.
The annual calibrated glacier-wide MB from the nonlinear model varied from 0.53 ± 0.16 in 2018/2019 to −1.71 ± 0.24 in 2021/2022, with a standard deviation of 0.65 during 2002–2023 (Table 3). In the 21-year-long MB series, 6 hydrological years (2004/2005, 2008/2009, 2009/2010, 2018/2019, 2020/2021, and 2022/2023) showed positive/near-steady-state MBs. The mean annual glacier-wide MB was estimated to be −0.47 ± 0.19 , equivalent to a cumulative loss of −9.81 ± 0.87 over 2002–2023 (Table 3). The uncertainty in cumulative mass loss comes from error propagation law.
4.4 Equilibrium line altitude and accumulation area ratio
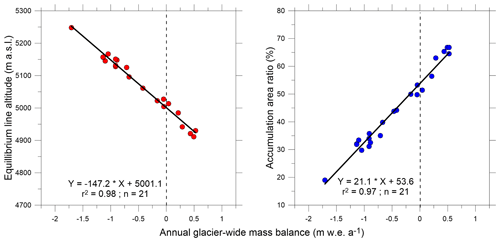
Using the calibrated mean altitudinal MBs (Sect. 3.8), the equilibrium line altitude ELAcal, accumulation area ratio AARcal and MB gradients () were also estimated. The maximum ELAcal was 5248 corresponding to the most negative MB of −1.71 ± 0.24 and minimum AARcal of 19 % in 2021/2022, while the minimum ELAcal was 4911 , corresponding to a positive MB of 0.49 ± 0.19 and a maximum AARcal of 67 % in 2004/2005. The mean ELAcal was 5070 , corresponding to a mean mass wastage of −0.47 ± 0.19 and mean AARcal of 44 % over 2002–2023.
The annual ELAcal and AARcal showed good correlations with annual glacier-wide MBs (r2 = 0.98 and 0.97, respectively) over 2002–2023 (Fig. 5). The ELAcal for a zero glacier-wide MB (ELA0) was also computed from the regression between glacier-wide MBs and ELAcal over 2002–2023 and calculated as ∼ 5001 (Fig. 9). Similarly, AAR0was computed as ∼ 54 % for steady-state glacier-wide MB.
5.1 Biases in glacier-wide mass balances and performance of nonlinear model
A total of 358 annual ablation and 65 annual accumulation point measurements were collected on Chhota Shigri Glacier over 2002–2023 to estimate the glacier-wide MBs (five ablation and five accumulation point MB measurements were removed before final model run; Sect. 3.3). Figure 10 shows the temporal evolution of the number of these point measurements, and Table S1 provides the details about these point MBs. In general, the point MB measurement network (especially the accumulation points) has been poor after 2014 (Sect. 3.1; Fig. 10). The eastern accumulation site at 5550 (Fig. 1) could only be accessed five times (2003, 2004, 2005, 2009, and 2011) over the 2002–2023 period, while no accumulation measurements were done in 2018, 2020, and 2021 (Sect. 3.1). Occasionally, the ablation measurements were also missing due to missing stakes (heavy ablation or destroyed stakes). In the traditional method, these missing measurements were filled with extrapolated values from nearby ablation/accumulation MB measurements or the previous years' point MB measurements to estimate the glacier-wide MBs (Azam et al., 2016; Mandal et al., 2020; Table S1).
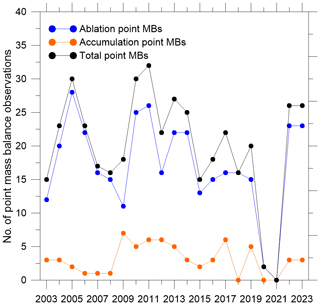
Figure 10Number of available ablation, accumulation, and total point MBs for each hydrological year between 2002 and 2023.
The systematic biases in glacier-wide annual MB series with the same monitoring network are expected to be of the same sign throughout the observation period, and the series is systematically adjusted to match the geodetic MBs available over one or more periods (Zemp et al., 2013; Wagnon et al., 2021). Nonlinear MB series on Chhota Shigri Glacier showed negative biases (−0.03 and −0.17 over the 2003–2014 and 2014–2020 periods, respectively), suggesting that the nonlinear model can reasonably estimate the glacier-wide MBs with the existing monitoring network. Conversely, the traditional MB series showed a negative bias (−0.10 ) over the 2003–2014 period and a large, positive bias (0.33 ) over the 2014–2020 (Fig. 8; Table 2). The major disagreement between the cumulative nonlinear and traditional MB curves after 2017 (Fig. 8) is likely due to a degradation of the quality of field observations due to harsh weather, field surveys that are too short, or observers not being sufficiently experienced (Fig. 10; Table S1; Sect. 3.1). Wagnon et al. (2021) performed a thorough analysis on Mera Glacier (Dush Koshi basin, Nepal) and identified the precise source of systematic bias in the glacier-wide MB by comparing the surface-specific mass balance calculated using the traditional glaciological method of a specific zone on the glacier with that derived from the ice flux method (based on the mass conservation equation). Unfortunately, we could not conduct such an analysis in the current study due to insufficient data availability. However, future research will include this comparative analysis to uncover any systematic biases in the glacier-wide MB data series for the Chhota Shigri Glacier.
To further investigate the performance of the nonlinear model compared to the traditional MB method, we calibrated both the MB series with the geodetic MB estimated using ASTER (8 October 2003) and Pléiades (12 September 2020) DEMs (details in SI) and used the geodetic MB over 2003–2014 (Sect. 4.2) to validate both the calibrated series. The calibrated nonlinear MB series showed a good agreement with the available geodetic MB (−3.88 against −4.18 ), while the traditional MB showed very strong deviation from the geodetic MB over 2003–2014 (−6.13 against −4.18 ) (Fig. S1 in the Supplement). This good agreement between nonlinear and geodetic MBs over 2003–2014 shows the robustness of the nonlinear model for the glacier-wide mass balance estimation. Furthermore, this comparison also highlights the importance of using short-duration geodetic MB estimates for the calibration process, as with two calibration periods, the calibrated traditional MB is in better agreement with the geodetic MB (Fig. S1).
The nonlinear model shows a much better agreement with geodetic MBs than the traditional method (Fig. 8; Table 2) mainly due to the (i) capability of the nonlinear model to better capture the spatial variability in surface MB from a heterogeneous, discontinuous, and limited point MB data series than the traditional method (Vincent et al., 2018); (ii) correction/exclusion of erroneous measurements (Sect. 3.3); and (iii) exclusion of the extrapolated ablation/accumulation points in the nonlinear model that might have introduced biases in traditional MB (Fig. S2 in the Supplement). The extrapolated point MBs in the accumulation area showed a difference ranging from −1.98 to 1.74 between modelled and extrapolated values, especially post-2014 (Figs. S2 and S3). The better performance of the nonlinear model suggests that the extrapolation of point accumulations (in case of missing point measurements) to estimate the glacier-wide MB using the traditional method is risky.
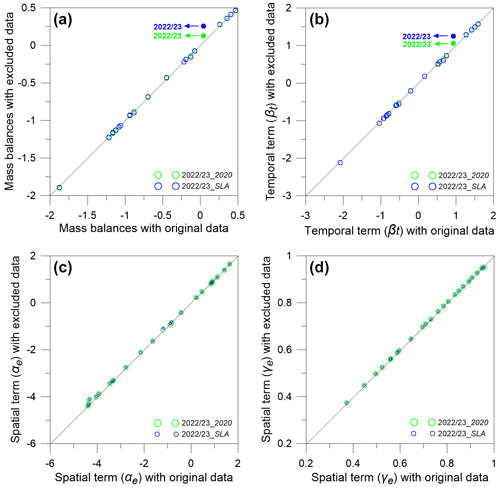
Figure 11Glacier-wide MBs (a), temporal (βt) (b) and spatial terms (αe and γe) (panels (c) and (d), respectively) obtained with the nonlinear model, following two different scenarios as a function of their original values obtained with the full data set. In the first scenario (2022/23_2020), we remove all the data from 2022/2023 (24 point MBs), except for 2 located at the observation points in 2019/2020 (see Sect. 5.2). In the second scenario (2022/23_SLA), we remove all the data from 2022/2023 and keep only two point MB data (= 0 ) obtained along the SLA (see Sect. 5.3). The filled dots highlight the test year of 2022/2023.
5.2 2019/2020 glacier-wide mass balance from two point mass balances
The spatial and temporal terms in Eq. (2) are computed from a data sample available from the whole series; therefore, MB computation is expected to be affected by missing data from any single year (or, in general, from all years whenever data are missing). The glacier-wide MB for 2019/2020 was estimated using only two point MB observations (Sect. 3.2; Table S1); therefore, it might have biases (Lliboutry, 1974; Vincent et al., 2018).
To investigate the additional error, we selected the year 2022/2023 to test the performance of the nonlinear model. The 2022/2023 year was selected because it is among the years with the maximum of point MB observations, and they were performed at their original locations. The nonlinear model was re-run over the 2002–2023 period, keeping only 2 point MB data (out of 26) for 2022/2023 year, corresponding to the locations of the 2 point MB measurements in 2019/2020. With only two point MBs, the glacier-wide MB for 2022/2023 was recomputed to be 0.13 against the original MB of 0.04 , with a difference of 0.09 , while all other years' glacier-wide MBs were changed by a maximum of ± 0.01 (Fig. 11a). As expected, the changes in the temporal term, βt, having a glacier-wide significance, showed significant deviation from 0.93 to 1.06 for 2022/2023 year, while for other years it changed by a maximum up to ± 0.04 (Fig. 11b). Conversely, the deviations in mean altitudinal spatial terms αe and γe were very small (maximum up to ± 0.06 and ± 0.005, respectively) (Fig. 11c and d). Therefore, the temporal term (βt) in Eq. (2) mainly controls the annual glacier-wide MB.
The deviation of 0.09 in glacier-wide MB estimated with only two point MBs is less than the estimated random error of 0.27 in the 2022/2023 glacier-wide MB in the original model run; therefore, it is assumed that the error in 2019/2020 glacier-wide MB due to restricted number of MB measurements is also less than the estimated random error of 0.16 (Table 3). Unlike the traditional MB method, the nonlinear model can fill the gaps in glacier-wide MB for which some point MB observations are missing and can provide a consistent series of temporal fluctuations.
5.3 2020/2021 glacier-wide mass balance from nonlinear model–SLA method
The glacier-wide MB for 2020/2021 year was estimated by inferring two point MB input from end-of-summer SLA, assuming it to be equivalent to ELA (i.e. MB = 0 ) (Sect. 3.2; Fig. 3). Due to only two point MB input data, the modelled glacier-wide MB for 2020/2021 may also have additional errors.
To quantify this error, we repeated the same exercise as in Sect. 5.2 for the year 2022/2023, this time again keeping two point MB data of 2022/2023 but at the two sites where point MB data have been assessed to be zero in 2020/2021. The resulting 2022/2023 glacier-wide MB is 0.26 , 0.22 higher than the original value (Fig. 11a), mainly explained by the βt term (Fig. 11b). This difference is still lower than the estimated random error of 0.27 in 2022/2023 (Table 3). However, there are still possible biases in glacier-wide MB of 2020/2021 year as the SLA was delineated from a Sentinel image from 6 September 2021 (Sect. 3.2; Fig. 3) that is not exactly from the end of ablation season (30 September) on Chhota Shigri Glacier. The surface energy balance model estimated a MB of −0.19 over the 6–30 September 2021 (Srivastava and Azam, 2022a). However, this seasonal offset correction in SLA-derived annual MB may be given, but it was avoided as the differences are within the estimated random error of 0.20 (Table 3). Our analysis shows that the glacier-wide MB can also be estimated from SLA using the nonlinear model if the field measurements cannot be carried out for some specific years.
However, the nonlinear model-SLA method has several limitations: (i) the delineated SLA must pass through a grid(s) having a previous point MB observation(s) (Fig. 3), as at least one previous measurement is required to run the model; (ii) the delineated SLA must be from the end of ablation season to consider it ELA; (iii) SLA delineation has its challenges, and often it is difficult to find the cloud-free image for delineation at the end of ablation season (Brun et al., 2015; Racoviteanu et al., 2019); and (iv) SLA is severely affected by recent snowfall and hence must be checked with in situ precipitation data before using SLA in nonlinear model. This latter point implies that the ELA can be inferred from the end-of-ablation-season SLA, which is not always possible over glaciers, especially in monsoon-dominated regions (Brun et al., 2015).
5.4 Recommendation: apply the nonlinear model on other glaciers
This study demonstrates that the nonlinear model outperforms the traditional method for estimating glacier-wide MB (Sect. 5.1). Apart from the present research, the nonlinear model has been applied only to the Mera Glacier in the Himalaya (Wagnon et al., 2021) and on Argentière, Saint-Sorlin, Mer de Glace, and Gébroulaz (France, Alps), Zongo (Bolivia, Andes), and Nigardsbreen (Norway, Scandinavia) glaciers (Vincent et al., 2018).
Equation (1) includes a spatial effect term (γi) that accounts for the standard deviations in point MBs across elevation. This term typically requires around 10 years of point MB observations to be accurately estimated (Vincent et al., 2018). Therefore, applying the nonlinear model wherever MB observations are available for around 10 years is advisable, especially in the Himalaya, where data accessibility issues often lead to gaps in observations (Azam et al., 2018). We recommend extending the application of the nonlinear model to other Himalayan glaciers that have consistent MB observations spanning approximately 10 years, such as Kolahoi, Hōksar, and Sutri Dhaka glaciers in the western Himalaya and Chorabari, Dokriani Bamak, Pokalde, Rikha Samba, Yala, and West Changri Nup glaciers in the central Himalaya. However, the estimated glacier-wide MBs may contain systematic biases due to the distribution of point measurements across the glacier. Therefore, they should be verified and, if necessary, reanalysed using geodetic estimates.
This work reanalyses glacier-wide MBs by combining the traditional reanalysis framework (Zemp et al., 2013) and the nonlinear MB model (Vincent et al., 2018). Previously, the annual glacier-wide MBs had been estimated on Chhota Shigri Glacier since 2002, when the traditional glaciological method was applied using heterogeneous in situ point MB measurements. The heterogeneous measurement network does not always catch the large spatiotemporal variability in point MBs; hence, the point MB–elevation relationship is insufficient to investigate the changes in glacier-wide MBs. Therefore, we applied the nonlinear model to compute the glacier-wide MBs of Chhota Shigri Glacier as it enables the computation of the glacier-wide MB from a heterogeneous in situ point MB network. The nonlinear model was used to detect the measurement errors. Of the 423 point measurements, 5 were corrected from field notebooks, and 10 were recognized as wrong observations and discarded before running the final model.
ASTER and Pléiades DEMs were used to estimate the geodetic MBs over 2003–2014 and 2014–2020, and they have been used to reanalyse the nonlinear MBs. Nonlinear MBs agreed well with the geodetic estimates available over 2003–2014 and 2014–2020, unlike traditional MBs that showed large differences, especially over the 2014–2020 period. The reanalysed nonlinear MBs showed a large annual variability ranging from 0.53 ± 0.16 in 2018/2019 to −1.71 ± 0.24 in 2021/2022. The Chhota Shigri Glacier is imbalanced, with a mean mass wastage of −0.47 ± 0.19 , equivalent to a cumulative loss of −9.81 ± 0.87 over 2002–2023.
With the 21-year-long MB observations, the Chhota Shigri Glacier MB series is the longest in the Himalaya. This work has enabled the data set to be extended, optimized, and corrected to provide the best possible mass balance series for this benchmark glacier. We plan to monitor this glacier over a long period, with repeated satellite image acquisitions by the Pléiades Glacier Observatory to regularly validate/calibrate the glacier-wide MB, typically every 5 years.
Our detailed analysis suggests that the nonlinear model performs better in calculating the glacier-wide MB than the traditional method as (i) the nonlinear MBs are in much better agreement with the geodetic MB estimates, (ii) it can detect erroneous measurements, (iii) it provides better glacier-wide MBs than those of the traditional method when the observational network is very limited, and (iv) glacier-wide MB can be computed using SLA if the ablation-end SLA passes through a grid cell that contains point MB observations from previous years. Therefore, the application of the nonlinear model is suggested on all monitored glaciers whenever data are sufficient. It becomes even more relevant in the Himalaya, where data are sometimes missing due to access issues. However, the estimated glacier-wide MBs may contain systematic bias (arises from the distribution of point measurements over the glacier) and, therefore, should be checked and, if necessary, reanalysed with geodetic estimates.
Detailed model documentation, tutorials, and model codes can be found on the website of the GLACIOCLIM programme (https://glacioclim.osug.fr, GLACIOCLIM Observation Service, 2024). The data used in this study can be requested from the corresponding author.
The supplement related to this article is available online at: https://doi.org/10.5194/tc-18-5653-2024-supplement.
MFA, CV, and PW conceptualized the study. MFA did the nonlinear model runs and analysed the data with the help of CV and PW. SS estimated the areal changes, the snow line altitudes, and MBs from the energy balance model. EB estimated the geodetic MBs. MFA wrote the paper with input from all co-authors.
At least one of the (co-)authors is a member of the editorial board of The Cryosphere. The peer-review process was guided by an independent editor, and the authors also have no other competing interests to declare.
Publisher's note: Copernicus Publications remains neutral with regard to jurisdictional claims made in the text, published maps, institutional affiliations, or any other geographical representation in this paper. While Copernicus Publications makes every effort to include appropriate place names, the final responsibility lies with the authors.
Mohd. Farooq Azam acknowledges the research grants from ISRO under the RESPOND scheme (grant no. ISRO/RES/4/690/21-22), SERB (grant no. CRG/2020/004877), and MoES (grant no. MOES/PAMC/H&C/131/2019-PC-II). Etienne Berthier acknowledges support from the French Space Agency (CNES). Pléiades stereo imagery from September 2020 was obtained through the Pléiades Glacier Observatory. The authors are grateful to DST-IFCPAR/CEFIPRA (project no. 3900-W1) and the French Service d'Observation GLACIOCLIM sponsored by IRD, who provided financial support to conduct field trips and obtain equipment. The authors thank all scientists, Adhikari Ji, and the porters involved in the research expeditions on Chhota Shigri Glacier since 2002.
This paper was edited by Tobias Sauter and reviewed by two anonymous referees.
Andreassen, L. M., Elvehøy, H., Kjøllmoen, B., and Engeset, R. V.: Reanalysis of long-term series of glaciological and geodetic mass balance for 10 Norwegian glaciers, The Cryosphere, 10, 535–552, https://doi.org/10.5194/tc-10-535-2016, 2016.
Andreassen, L. M., Nagy, T., Kjøllmoen, B., and Leigh, J. R.: An inventory of Norway's glaciers and ice-marginal lakes from 2018–19 Sentinel-2 data, J. Glaciol., 68, 1085–1106, https://doi.org/10.1017/jog.2022.20, 2022.
Azam, M. F.: Need of integrated monitoring on reference glacier catchments for future water security in Himalaya, Water Security, 14, 100098, https://doi.org/10.1016/j.wasec.2021.100098, 2021.
Azam, M. F., Wagnon, P., Ramanathan, A., Vincent, C., Sharma, P., Arnaud, Y., Linda, A., Pottakkal, J. G., Chevallier, P., Singh, V. B., and Berthier, E.: From balance to imbalance: a shift in the dynamic behaviour of Chhota Shigri glacier, western Himalaya, India, J. Glaciol., 58, 315–324, https://doi.org/10.3189/2012JoG11J123, 2012.
Azam, M. F., Wagnon, P., Vincent, C., Ramanathan, A., Linda, A., and Singh, V. B.: Reconstruction of the annual mass balance of Chhota Shigri glacier, Western Himalaya, India, since 1969, Ann. Glaciol., 55, 69–80, https://doi.org/10.3189/2014AoG66A104, 2014.
Azam, M. F., Ramanathan, A., Wagnon, P., Vincent, C., Linda, A., Berthier, E., Sharma, P., Mandal, A., Angchuk, T., Singh, V. B., and Pottakkal, J. G.: Meteorological conditions, seasonal and annual mass balances of Chhota Shigri Glacier, western Himalaya, India, Ann. Glaciol., 57, 328–338, https://doi.org/10.3189/2016AoG71A570, 2016.
Azam, M. F., Wagnon, P., Berthier, E., Vincent, C., Fujita, K., and Kargel, J. S.: Review of the status and mass changes of Himalayan-Karakoram glaciers, J. Glaciol., 64, 61–74, https://doi.org/10.1017/jog.2017.86, 2018.
Azam, M. F., Kargel, J. S., Shea, J. M., Nepal, S., Haritashya, U. K., Srivastava, S., Maussion, F., Qazi, N., Chevallier, P., Dimri, A. P., Kulkarni, A. V., Cogley, J. G., and Bahuguna, I.: Glaciohydrology of the Himalaya-Karakoram, Science, 373, eabf3668, https://doi.org/10.1126/science.abf3668, 2021.
Banerjee, A. and Shankar, R.: On the response of Himalayan glaciers to climate change, J. Glaciol., 59, 480–490, https://doi.org/10.3189/2013JoG12J130, 2013.
Barandun, M., Pohl, E., Naegeli, K., McNabb, R., Huss, M., Berthier, E., Saks, T., and Hoelzle, M.: Hot Spots of Glacier Mass Balance Variability in Central Asia, Geophys. Res. Lett., 48, e2020GL092084, https://doi.org/10.1029/2020GL092084, 2021.
Basantes-Serrano, R., Rabatel, A., Francou, B., Vincent, C., Maisincho, L., Cáceres, B., Galarraga, R., and Alvarez, D.: Slight mass loss revealed by reanalyzing glacier mass-balance observations on Glacier Antisana 15α (inner tropics) during the 1995–2012 period, J. Glaciol., 62, 124–136, https://doi.org/10.1017/jog.2016.17, 2016.
Berthier, E., Arnaud, Y., Kumar, R., Ahmad, S., Wagnon, P., and Chevallier, P.: Remote sensing estimates of glacier mass balances in the Himachal Pradesh (Western Himalaya, India), Remote Sens. Environ., 108, 327–338, https://doi.org/10.1016/j.rse.2006.11.017, 2007.
Berthier, E., Floricioiu, D., Gardner, A. S., Gourmelen, N., Jakob, L., Paul, F., Treichler, D., Wouters, B., Belart, J. M. C., Dehecq, A., Dussaillant, I., Hugonnet, R., Kaab, A. M., Krieger, L., Pálsson, F., and Zemp, M.: Measuring Glacier Mass Changes from Space – A Review, Rep. Prog. Phys., 86, 036801, https://doi.org/10.1088/1361-6633/acaf8e, 2023.
Bolch, T., Yao, T., Kang, S., Buchroithner, M. F., Scherer, D., Maussion, F., Huintjes, E., and Schneider, C.: A glacier inventory for the western Nyainqentanglha Range and the Nam Co Basin, Tibet, and glacier changes 1976–2009, The Cryosphere, 4, 419–433, https://doi.org/10.5194/tc-4-419-2010, 2010.
Bolch, T., Shea, J. M., Liu, S., Azam, F. M., Gao, Y., Gruber, S., Immerzeel, W. W., Kulkarni, A., Li, H., Tahir, A. A., Zhang, G., and Zhang, Y.: Status and Change of the Cryosphere in the Extended Hindu Kush Himalaya Region, in: The Hindu Kush Himalaya Assessment: Mountains, Climate Change, Sustainability and People, edited by: Wester, P., Mishra, A., Mukherji, A., and Shrestha, A. B., Springer International Publishing, Cham, 209–255, https://doi.org/10.1007/978-3-319-92288-1_7, 2019.
Brun, F., Dumont, M., Wagnon, P., Berthier, E., Azam, M. F., Shea, J. M., Sirguey, P., Rabatel, A., and Ramanathan, Al.: Seasonal changes in surface albedo of Himalayan glaciers from MODIS data and links with the annual mass balance, The Cryosphere, 9, 341–355, https://doi.org/10.5194/tc-9-341-2015, 2015.
Brun, F., Berthier, E., Wagnon, P., Kääb, A., and Treichler, D.: A spatially resolved estimate of High Mountain Asia glacier mass balances from 2000 to 2016, Nat. Geosci., 10, 668–673, https://doi.org/10.1038/ngeo2999, 2017.
Chand, P. and Sharma, M. C.: Frontal changes in the Manimahesh and Tal Glaciers in the Ravi basin, Himachal Pradesh, northwestern Himalaya (India), between 1971 and 2013, Int. J. Remote Sens., 36, 4095–4113, https://doi.org/10.1080/01431161.2015.1074300, 2015.
Cogley, J. G.: Geodetic and direct mass-balance measurements: comparison and joint analysis, Ann. Glaciol., 50, 96–100, https://doi.org/10.3189/172756409787769744, 2009.
Cogley, J. G., Hock, R., Rasmussen, L. A., Arendt, A. A., Bauder, A., Braithwaite, R. J., Jansson, P., Kaser, G., Möller, M., Nicholson, L., and Zemp, M.: Glossary of Glacier Mass Balance and Related Terms, IHP-VII Technical Documents in Hydrology No. 86, IACS Contribution No. 2, UNESCO-IHP, Paris, https://doi.org/10.5167/uzh-53475, 2011.
Cuffey, K. M. and Paterson, W. S. B.: The Physics of Glaciers, Elsevier, 4th edn., 721 pp., ISBN 978-0-12-369461-4, 2010.
Davaze, L., Rabatel, A., Dufour, A., Hugonnet, R., and Arnaud, Y.: Region-wide annual glacier surface mass balance for the European Alps from 2000 to 2016, Front. Earth Sci., 8, 149, https://doi.org/10.3389/feart.2020.00149, 2020.
Falaschi, D., Bhattacharya, A., Guillet, G., Huang, L., King, O., Mukherjee, K., Rastner, P., Yao, T., and Bolch, T.: Annual to seasonal glacier mass balance in High Mountain Asia derived from Pléiades stereo images: examples from the Pamir and the Tibetan Plateau, The Cryosphere, 17, 5435–5458, https://doi.org/10.5194/tc-17-5435-2023, 2023.
Funk, M., Morelli, R., and Stahel, W.: Mass balance of Griesgletscher 1961-1994: Different methods of determination, Zeitschrift für Gletscherkunde und Glazialgeologie, Universitätsverlag Wagner, 33, 41–56, https://www.research-collection.ethz.ch/handle/20.500.11850/483464, 1997.
Gantayat, P. and Ramsankaran, R.: Modelling evolution of a large, glacier-fed lake in the Western Indian Himalaya, Sci. Rep., 13, 1840, https://doi.org/10.1038/s41598-023-28144-8, 2023.
Gardner, A., Moholdt, G., Cogley, J., Wouters, B., Arendt, A., Wahr, J., Berthier, E., Hock, R., Pfeffer, W., Kaser, G., Ligtenberg, S., Bolch, T., Sharp, M., Hagen, J., Van den Broeke, M., and Paul, F.: A Reconciled Estimate of Glacier Contributions to Sea Level Rise: 2003 to 2009, Science, 340, 852–857, https://doi.org/10.1126/science.1234532, 2013.
Garg, P. K., Shukla, A., and Jasrotia, A. S.: Influence of topography on glacier changes in the central Himalaya, India, Global Planet. Change, 155, 196–212, https://doi.org/10.1016/j.gloplacha.2017.07.007, 2017.
GLACIOCLIM Observation Service: GLACIOCLIM Observation Service [data set], https://glacioclim.osug.fr, last access: 27 November 2024.
Haq, M. A., Azam, M. F., and Vincent, C.: Efficiency of artificial neural networks for glacier ice-thickness estimation: a case study in western Himalaya, India, J. Glaciol., 67, 671–684, https://doi.org/10.1017/jog.2021.19, 2021.
Harrison, S., Kargel, J. S., Huggel, C., Reynolds, J., Shugar, D. H., Betts, R. A., Emmer, A., Glasser, N., Haritashya, U. K., Klimeš, J., Reinhardt, L., Schaub, Y., Wiltshire, A., Regmi, D., and Vilímek, V.: Climate change and the global pattern of moraine-dammed glacial lake outburst floods, The Cryosphere, 12, 1195–1209, https://doi.org/10.5194/tc-12-1195-2018, 2018.
Hugonnet, R., McNabb, R., Berthier, E., Menounos, B., Nuth, C., Girod, L., Farinotti, D., Huss, M., Dussaillant, I., Brun, F., and Kääb, A.: Accelerated global glacier mass loss in the early twenty-first century, Nature, 592, 726–731, https://doi.org/10.1038/s41586-021-03436-z, 2021.
Huss, M. and Bauder, A.: 20th-century climate change inferred from four long-term point observations of seasonal mass balance, Ann. Glaciol., 50, 207–214, https://doi.org/10.3189/172756409787769645, 2009.
Huss, M., Bauder, A., and Funk, M.: Homogenization of long-term mass-balance time series, Ann. Glaciol., 50, 198–206, https://doi.org/10.3189/172756409787769627, 2009.
Jackson, M., Azam, M. F., Baral, P., Benestad, R., Brun, F., Muhammad, S., Pradhananga, S., Shrestha, F., Steiner, J. F., and Thapa, A.: Chapter 2: Consequences of climate change for the cryosphere in the Hindu Kush Himalaya, in: Water, ice, society, and ecosystems in the Hindu Kush Himalaya : An outlook, edited by: Wester, P., Chaudhary, S., Chettri, N., Jackson, M., Maharjan, A., Nepal, S., and Steiner, J. F., International Centre for Integrated Mountain Development (ICIMOD) Nepal, https://doi.org/10.53055/ICIMOD.1030, 2023.
Kuhn, M.: Mass Budget Imbalances as Criterion for a Climatic Classification of Glaciers, Geogr. Ann. A, 66, 229–238, https://doi.org/10.2307/520696, 1984.
Kumar, A., Verma, A., Gokhale, A., Bhambri, R., Misra, A., Sundriyal, S., Dobhal, D., and Kishore, N.: Hydrometeorological assessments and suspended sediment delivery from a central Himalayan glacier in the upper Ganga basin, Int. J. Sediment Res., 33, 493–509, https://doi.org/10.1016/j.ijsrc.2018.03.004, 2018.
Laha, S., Kumari, R., Singh, S., Mishra, A., Sharma, T., Banerjee, A., Nainwal, H. C., and Shankar, R.: Evaluating the contribution of avalanching to the mass balance of Himalayan glaciers, Ann. Glaciol., 58, 110–118, https://doi.org/10.1017/aog.2017.27, 2017.
Lliboutry, L.: Multivariate Statistical Analysis of Glacier Annual Balances, J. Glaciol., 13, 371–392, https://doi.org/10.3189/S0022143000023169, 1974.
Mandal, A., Ramanathan, A., Azam, M. F., Angchuk, T., Soheb, M., Kumar, N., Pottakkal, J. G., Vatsal, S., Mishra, S., and Singh, V. B.: Understanding the interrelationships among mass balance, meteorology, discharge and surface velocity on Chhota Shigri Glacier over 2002–2019 using in situ measurements, J. Glaciol., 66, 727–741, https://doi.org/10.1017/jog.2020.42, 2020.
Mandal, A., Angchuk, T., Azam, M. F., Ramanathan, A., Wagnon, P., Soheb, M., and Singh, C.: An 11-year record of wintertime snow-surface energy balance and sublimation at 4863 on the Chhota Shigri Glacier moraine (western Himalaya, India), The Cryosphere, 16, 3775–3799, https://doi.org/10.5194/tc-16-3775-2022, 2022.
Miles, E., McCarthy, M., Dehecq, A., Kneib, M., Fugger, S., and Pellicciotti, F.: Health and sustainability of glaciers in High Mountain Asia, Nat. Commun., 12, 2868, https://doi.org/10.1038/s41467-021-23073-4, 2021.
Mukherjee, K., Bhattacharya, A., Pieczonka, T., Ghosh, S., and Bolch, T.: Glacier mass budget and climate reanalysis data indicate a climatic shift around 2000 in Lahaul-Spiti, western Himalaya, Climatic Change, 148, 219–233, https://doi.org/10.1007/s10584-018-2185-3, 2018.
Nepal, S., Steiner, J. F., Allen, S., Azam, M. F., Bhuchar, S., Biemans, H., Dhakal, M., Khanal, S., Li, D., Lutz, A., Pradhananga, S., Ritzema, R., Stoffel, M., and Stuart-Smith, R.: Chapter 3: Consequences of cryospheric change for water resources and hazards in the Hindu Kush Himalaya, in: Water, ice, society, and ecosystems in the Hindu Kush Himalaya: An outlook, edited by: Wester, P., Chaudhary, S., Chettri, N., Jackson, M., Maharjan, A., Nepal, S., and Steiner, J. F., International Centre for Integrated Mountain Development (ICIMOD) Nepal, https://doi.org/10.53055/ICIMOD.1031, 2023.
Oerlemans, J.: Glaciers and Climate Change, CRC Press, ISBN 9789026518133, 160 pp., 2001.
Østrem, G. and Brugman, M.: Glacier mass-balance measurements: a manual for field and office work, NHRI Science Report No. 4, Canada, ISBN 0-662-19000-9, 1991.
Østrem, G. and Stanley, A.: Glacier and mass balance measurements, a manual for field and office work: a guide for personnel with limited backgrounds in glaciology, prepared jointly by the Canadian Department of Energy, Mines and Resources, and the Norwegian Water Resources and Electricity Board, IWB Reprint Series No. 66, Inland Waters Branch, Department of the Environment, Ottawa, Ontario, 118 pp., Revision of 1966 edition, https://publikasjoner.nve.no/diverse/1969/glaciermassbalance1969.pdf (last access: 30 March 2024), 1969.
Oulkar, S. N., Thamban, M., Sharma, P., Pratap, B., Singh, A. T., Patel, L. K., Pramanik, A. and Ravichandran, M.: Energy fluxes, mass balance, and climate sensitivity of the Sutri Dhaka Glacier in the western Himalaya, Front. Earth Sci., 10, 949735, https://doi.org/10.3389/feart.2022.949735 , 2022.
Rabatel, A., Dedieu, J.-P., and Vincent, C.: Using remote-sensing data to determine equilibrium-line altitude and mass-balance time series: validation on three French glaciers, 1994–2002, J. Glaciol., 51, 539–546, https://doi.org/10.3189/172756505781829106, 2005.
Racoviteanu, A. E., Rittger, K., and Armstrong, R.: An automated approach for estimating snowline altitudes in the Karakoram and eastern Himalaya from remote sensing, Front. Earth Sci., 7, 220, https://doi.org/10.3389/feart.2019.00220, 2019.
Ramsankaran, R., Pandit, A., and Azam, M. F.: Spatially distributed ice-thickness modelling for Chhota Shigri Glacier in western Himalayas, India, Int. J. Remote Sens., 39, 3320–3343, https://doi.org/10.1080/01431161.2018.1441563, 2018.
Raup, B., Racoviteanu, A., Khalsa, S. J. S., Helm, C., Armstrong, R., and Arnaud, Y.: The GLIMS geospatial glacier database: A new tool for studying glacier change, Global Planet. Change, 56, 101–110, https://doi.org/10.1016/j.gloplacha.2006.07.018, 2007.
Romshoo, S. A., Murtaza, K. O., and Abdullah, T.: Towards understanding various influences on mass balance of the Hoksar Glacier in the Upper Indus Basin using observations, Sci. Rep., 12, 15669, https://doi.org/10.1038/s41598-022-20033-w, 2022.
Romshoo, S. A., Abdullah, T., Murtaza, K. O., and Bhat, M. H.: Direct, geodetic and simulated mass balance studies of the Kolahoi Glacier in the Kashmir Himalaya, India, J. Hydrol., 617, 129019. https://doi.org/10.1016/j.jhydrol.2022.129019, 2023.
Rounce, D. R., Hock, R., Maussion, F., Hugonnet, R., Kochtitzky, W., Huss, M., Berthier, E., Brinkerhoff, D., Compagno, L., Copland, L., Farinotti, D., Menounos, B., and McNabb, R. W.: Global glacier change in the 21st century: Every increase in temperature matters, Science, 379, 78–83, https://doi.org/10.1126/science.abo1324, 2023.
Shean, D. E., Bhushan, S., Montesano, P., Rounce, D. R., Arendt, A., and Osmanoglu, B.: A Systematic, Regional Assessment of High Mountain Asia Glacier Mass Balance, Front. Earth Sci., 7, 363, https://doi.org/10.3389/feart.2019.00363, 2020.
Shugar, D. H., Jacquemart, M., Shean, D., Bhushan, S., Upadhyay, K., Sattar, A., Schwanghart, W., McBride, S., De Vries, M. V. W., Mergili, M., Emmer, A., Deschamps-Berger, C., McDonnell, M., Bhambri, R., Allen, S., Berthier, E., Carrivick, J. L., Clague, J. J., Dokukin, M., Dunning, S. A., Frey, H., Gascoin, S., Haritashya, U. K., Huggel, C., Kääb, A., Kargel, J. S., Kavanaugh, J. L., Lacroix, P., Petley, D., Rupper, S., Azam, M. F., Cook, S. J., Dimri, A. P., Eriksson, M., Farinotti, D., Fiddes, J., Gnyawali, K. R., Harrison, S., Jha, M., Koppes, M., Kumar, A., Leinss, S., Majeed, U., Mal, S., Muhuri, A., Noetzli, J., Paul, F., Rashid, I., Sain, K., Steiner, J., Ugalde, F., Watson, C. S., and Westoby, M. J.: A massive rock and ice avalanche caused the 2021 disaster at Chamoli, Indian Himalaya, Science, 373, 300–306, https://doi.org/10.1126/science.abh4455, 2021.
Shukla, A. and Qadir, J.: Differential response of glaciers with varying debris cover extent: evidence from changing glacier parameters, Int. J. Remote Sens., 37, 2453–2479, https://doi.org/10.1080/01431161.2016.1176272, 2016.
Shukla, A., Garg, P. K., and Srivastava, S.: Evolution of Glacial and High-Altitude Lakes in the Sikkim, Eastern Himalaya Over the Past Four Decades (1975–2017), Front. Environ. Sci., 6, 81, https://doi.org/10.3389/fenvs.2018.00081, 2018.
Soruco, A., Vincent, C., Francou, B., Ribstein, P., Berger, T., Sicart, J. E., Wagnon, P., Arnaud, Y., Favier, V., and Lejeune, Y.: Mass Balance of Glaciar Zongo, Bolivia, between 1956 and 2006, using glaciological, hydrological and geodetic methods, Ann. Glaciol., 50, 1–8, https://doi.org/10.3189/172756409787769799, 2009.
Srivastava, S. and Azam, M. F.: Mass- and Energy-Balance Modeling and Sublimation Losses on Dokriani Bamak and Chhota Shigri Glaciers in Himalaya Since 1979, Frontiers in Water, 4, 874240, https://doi.org/10.3389/frwa.2022.874240, 2022a.
Srivastava, S. and Azam, M. F.: Functioning of glacierized catchments in Monsoon and Alpine regimes of Himalaya, J. Hydrol., 609, 127671, https://doi.org/10.1016/j.jhydrol.2022.127671, 2022b.
Srivastava, S., Garg, P. K., and Azam, M. F.: Seven Decades of Dimensional and Mass Balance Changes on Dokriani Bamak and Chhota Shigri Glaciers, Indian Himalaya, Using Satellite Data and Modelling, J. Indian Soc. Remote, 50, 37–54, https://doi.org/10.1007/s12524-021-01455-x, 2022.
Stokes, C. R., Clark, C. D., Lian, O. B., and Tulaczyk, S.: Ice stream sticky spots: A review of their identification and influence beneath contemporary and palaeo-ice streams, Earth-Sci. Rev., 81, 217–249, https://doi.org/10.1016/j.earscirev.2007.01.002, 2007.
Stumm, D., Joshi, S. P., Gurung, T. R., and Silwal, G.: Mass balances of Yala and Rikha Samba glaciers, Nepal, from 2000 to 2017, Earth Syst. Sci. Data, 13, 3791–3818, https://doi.org/10.5194/essd-13-3791-2021, 2021.
Sunako, S., Fujita, K., Sakai, A., and Kayastha, R.: Mass balance of Trambau Glacier, Rolwaling region, Nepal Himalaya: In-situ observations, long-term reconstruction and mass-balance sensitivity, J. Glaciol., 65, 605–616, https://doi.org/10.1017/jog.2019.37, 2019.
Thibert, E., Blanc, R., Vincent, C., and Eckert, N.: Glaciological and volumetric mass-balance measurements: error analysis over 51 years for Glacier de Sarennes, French Alps, J. Glaciol., 54, 522–532, https://doi.org/10.3189/002214308785837093, 2008.
Thibert, E., Eckert, N., and Vincent, C.: Climatic drivers of seasonal glacier mass balances: an analysis of 6 decades at Glacier de Sarennes (French Alps), The Cryosphere, 7, 47–66, https://doi.org/10.5194/tc-7-47-2013, 2013.
Tshering, P. and Fujita, K.: First in situ record of decadal glacier mass balance (2003–2014) from the Bhutan Himalaya, Ann. Glaciol., 57, 289–294, https://doi.org/10.3189/2016AoG71A036, 2016.
Vincent, C. and Six, D.: Relative contribution of solar radiation and temperature in enhanced temperature-index melt models from a case study at Glacier de Saint-Sorlin, France, Ann. Glaciol., 54, 11–17, https://doi.org/10.3189/2013AoG63A301, 2013.
Vincent, C., Ramanathan, Al., Wagnon, P., Dobhal, D. P., Linda, A., Berthier, E., Sharma, P., Arnaud, Y., Azam, M. F., Jose, P. G., and Gardelle, J.: Balanced conditions or slight mass gain of glaciers in the Lahaul and Spiti region (northern India, Himalaya) during the nineties preceded recent mass loss, The Cryosphere, 7, 569–582, https://doi.org/10.5194/tc-7-569-2013, 2013.
Vincent, C., Soruco, A., Azam, M. F., Basantes-Serrano, R., Jackson, M., Kjøllmoen, B., Thibert, E., Wagnon, P., Six, D., Rabatel, A., Ramanathan, A., Berthier, E., Cusicanqui, D., Vincent, P., and Mandal, A.: A Nonlinear Statistical Model for Extracting a Climatic Signal From Glacier Mass Balance Measurements, J. Geophys. Res.-Earth, 123, 2228–2242, https://doi.org/10.1029/2018JF004702, 2018.
Vishwakarma, B. D., Ramsankaran, R., Azam, M. F., Bolch, T., Mandal, A., Srivastava, S., Kumar, P., Sahu, R., Navinkumar, P. J., Tanniru, S. R., Javed, A., Soheb, M., Dimri, A. P., Yadav, M., Devaraju, B., Chinnasamy, P., Reddy, M. J., Murugesan, G. P., Arora, M., Jain, S. K., Ojha, C. S. P., Harrison, S., and Bamber, J.: Challenges in understanding the variability of the cryosphere in the Himalaya and its impact on regional water resources, Front. Water, 4, 909246, https://doi.org/10.3389/frwa.2022.909246, 2022.
Wagnon, P., Linda, A., Arnaud, Y., Kumar, R., Sharma, P., Vincent, C., Pottakkal, J. G., Berthier, E., Ramanathan, A., Hasnain, S. I., and Chevallier, P.: Four years of mass balance on Chhota Shigri Glacier, Himachal Pradesh, India, a new benchmark glacier in the western Himalaya, J. Glaciol., 53, 603–611, https://doi.org/10.3189/002214307784409306, 2007.
Wagnon, P., Brun, F., Khadka, A., Berthier, E., Shrestha, D., Vincent, C., Arnaud, Y., Six, D., Dehecq, A., Ménégoz, M., and Jomelli, V.: Reanalysing the 2007–19 glaciological mass-balance series of Mera Glacier, Nepal, Central Himalaya, using geodetic mass balance, J. Glaciol., 67, 117–125, https://doi.org/10.1017/jog.2020.88, 2021.
Yao, J., Chen, Y., Guan, X., Zhao, Y., Chen, J., and Mao, W.: Recent climate and hydrological changes in a mountain–basin system in Xinjiang, China, Earth-Sci. Rev., 226, 103957, https://doi.org/10.1016/j.earscirev.2022.103957, 2022.
Zemp, M., Thibert, E., Huss, M., Stumm, D., Rolstad Denby, C., Nuth, C., Nussbaumer, S. U., Moholdt, G., Mercer, A., Mayer, C., Joerg, P. C., Jansson, P., Hynek, B., Fischer, A., Escher-Vetter, H., Elvehøy, H., and Andreassen, L. M.: Reanalysing glacier mass balance measurement series, The Cryosphere, 7, 1227–1245, https://doi.org/10.5194/tc-7-1227-2013, 2013.
Zemp, M., Frey, H., Gärtner-Roer, I., Nussbaumer, S. U., Hoelzle, M., Paul, F., Haeberli, W., Denzinger, F., Ahlstrøm, A. P., Anderson, B., Bajracharya, S., Baroni, C., Braun, L. N., Cáceres, B. E., Casassa, G., Cobos, G., Dávila, L. R., Granados, H. D., Demuth, M. N., Espizua, L., Fischer, A., Fujita, K., Gadek, B., Ghazanfar, A., Hagen, J. O., Holmlund, P., Karimi, N., Li, Z., Pelto, M., Pitte, P., Popovnin, V. V., Portocarrero, C. A., Prinz, R., Sangewar, C. V., Severskiy, I., Sigurđsson, O., Soruco, A., Usubaliev, R., and Vincent, C.: Historically unprecedented global glacier decline in the early 21st century, J. Glaciol., 61, 745–762, https://doi.org/10.3189/2015JoG15J017, 2015.
Zemp, M., Huss, M., Thibert, E., Eckert, N., McNabb, R., Huber, J., Barandun, M., Machguth, H., Nussbaumer, S. U., Gärtner-Roer, I., Thomson, L., Paul, F., Maussion, F., Kutuzov, S., and Cogley, J. G.: Global glacier mass changes and their contributions to sea-level rise from 1961 to 2016, Nature, 568, 382–386, https://doi.org/10.1038/s41586-019-1071-0, 2019.


