the Creative Commons Attribution 4.0 License.
the Creative Commons Attribution 4.0 License.
Assessing supraglacial lake depth using ICESat-2, Sentinel-2, TanDEM-X, and in situ sonar measurements over Northeast and Southwest Greenland
Lily Bever
Christian Sommer
Thorsten Seehaus
Angelika Humbert
Mirko Scheinert
Matthias Braun
Supraglacial lake development in Greenland consists of intricate hydrological processes, contributing not only to surface mass loss but also to a lowering of the surface albedo and changes in ice dynamics. While the estimation of lake area has recently improved, the determination of the lake volume is essential to properly estimate the amount of water contained in and lost from supraglacial lakes throughout the melt seasons. In this study, four supraglacial lake depth estimation methods, including two new empirical approaches, are presented and compared. The empirical methods were developed to relate Sentinel-2 reflectance values to supraglacial lake depth obtained from (1) ICESat-2 (Ice, Cloud and land Elevation Satellite 2) crossings over 19 lakes in Northeast and Southwest Greenland and (2) in situ sonar tracks from four lakes on Zachariae Isstrom (Zachariæ Isstrøm) in Northeast Greenland. The depths from both equations were independently correlated to their corresponding Sentinel-2 reflectance values to create empirical relations. The third method is a standardly used radiative transfer model also based on Sentinel-2 data. Finally, the depths for five lakes in Northeast Greenland were derived from TanDEM-X (TerraSAR-X add-on for Digital Elevation Measurement) digital elevation models after lake drainage. All four methods were applied to the five lakes for which digital elevation models were procured, allowing for a direct comparison of the methods. In general, the sonar-based empirical equation aligned best with the estimates from the digital elevation model until its saturation point of 8.6 m. Through the evaluation of the ICESat-2-based equation, a strong influence of lake bed sediment on depth estimation could be seen. The ICESat-2 empirically derived depth equation produced slightly deeper depths than the sonar-based equation. The radiative transfer model more strongly overestimated nearly all depths below its saturation point of 16.3 m, when compared to the digital elevation model results. This large overestimation can be primarily attributed to the sensitivity of this method's parameters. Furthermore, all methods, with the exception of the digital elevation model, were applied to an area in Northeast Greenland on the peak melt dates for the years 2016–2022 to explore lake volume interannual variability. Finally, a closer examination of the uncertainties for each method provides insight into associated errors and limitations when considering which method to use for supraglacial lake depth estimation. Overall, empirically derived equations are shown to be capable of simplifying supraglacial lake depth calculations while also retaining sufficient accuracy under low-sediment, floating-ice-free, and atmospherically clear conditions.
- Article
(6708 KB) - Full-text XML
- BibTeX
- EndNote
Supraglacial lakes (SGLs) play an important role in glacial surface mass balance calculations, as they collect meltwater and act as conduits for surface and subglacial runoff. The dynamic nature of these lakes is influenced primarily by rainfall, surface temperatures, and snowpack thickness (Turton et al., 2021), leading to strong interannual variability in the size and timing of the lakes over the melt season. However, SGLs are found in topographical depressions, which remain in the same locations, due to the influence of bedrock topography on the glacier surface (Gudmundsson, 2003; Lampkin and Vanderberg, 2011), allowing for lake development to be easily tracked. The ability to accurately delineate SGLs in satellite imagery has improved significantly in recent years (Williamson et al., 2018; Arthur et al., 2020; Dirscherl et al., 2020; Schröder et al., 2020; Dell et al., 2021; Hochreuther et al., 2021; Hu et al., 2021; Corr et al., 2022; Lutz et al., 2023). Nevertheless, while this information provides insight into seasonal lake area trends, the volumes of the lakes are necessary in order to estimate the amount of water that is stored on the glacier and discharged into the subglacial system, in addition to understanding its subsequent impact on the subglacial hydrological system and ice dynamics through hydrofracture-induced drainages.
Previously, various methods to measure SGL volumes based on a radiative transfer model (RTM) have been explored. This method uses the reflectance value of a pixel in combination with estimates of lake bed albedo, optically deep water reflectance, and a two-way attenuation coefficient to determine the water depth of the pixel. Originally derived by Philpot (1987), the radiative transfer model has been commonly used to estimate SGL volume across Greenland and Antarctica (Sneed and Hamilton, 2007, 2011; Tedesco and Steiner, 2011; Williamson et al., 2017, 2018; Macdonald et al., 2018; Moussavi et al., 2020; Arthur et al., 2020; Glen et al., 2024; Melling et al., 2024). Additionally, empirical functions have been fit to in situ data acquired via sonar (Box and Ski, 2007; Fitzpatrick et al., 2014; Legleiter et al., 2014; Pope et al., 2016) or digital elevation model (DEM) (Moussavi et al., 2016) data to achieve better lake depth estimates. Many of these newly developed algorithms were also compared to the physical radiative transfer model in their analysis; however, the authors' conclusions on the better-performing method differ. These varying results could be attributed to the small and, thus, unrepresentative number of in situ data on which the algorithms were fitted in many of the studies, along with the lack of validation data against which the results can be compared for an objective evaluation. Furthermore, these optically based methods are limited by the presence of sediment in the water, causing depth overestimation (Box and Ski, 2007; Sneed and Hamilton, 2011; Arthur et al., 2020); the effect of wind (and thus waves) on the surface reflectance (Sneed and Hamilton, 2007; Pope et al., 2016; Arthur et al., 2020); and the difficulty involved with accurately estimating the lake bed albedo and optically deep water, which is roughly defined as water deeper than 40 m (Sneed and Hamilton, 2007, 2011; Tedesco and Steiner, 2011; Moussavi et al., 2016; Pope et al., 2016).
With the recent launch of the Ice, Cloud and land Elevation Satellite 2 (ICESat-2) mission, a new suite of SGL depth algorithms have been developed, two of which are the Lake Surface-Bed Separation (LSBS) algorithm (Fair et al., 2020) and the Watta algorithm (Datta and Wouters, 2021). Both of these algorithms use ICESat-2's ATL03 laser data product to identify SGL surfaces based on the flatness of the return signal and then automatically estimate the depth along the lake profile. Datta and Wouters (2021) further create an empirical equation that correlates these lake depths to reflectance values in multispectral satellite images in order to estimate depths independently of ICESat-2 tracks. These two algorithms were directly compared on a few test lakes in Fricker et al. (2021), along with several other algorithms created to extract lake profiles from ICESat-2 data, as well as the radiative transfer model. These results were compared against a manual delineation of the lake bed from the raw ATL03 data. The RTM method applied to both Sentinel-2 and Landsat 8 red bands consistently underestimated the manually delineated lake depths, whereas the ICESat-2 algorithms all generally estimated depths near the manually delineated depths but contained many large perturbations.
In this study, we compare four supraglacial lake depth estimation methods in order to directly evaluate the behavior and limitations of each method. These methods include (1) the previously mentioned radiative transfer model (RTM), (2) an empirical equation derived from ICESat-2 lake crossings, (3) an empirical equation derived from in situ sonar data gathered in Northeast Greenland, and (4) TerraSAR-X add-on for Digital Elevation Measurement (TanDEM-X) elevation data. To understand the pitfalls of each method, we discuss the associated errors and uncertainties of each. Finally, we apply the methods to the peak lake area extent in the 2016–2022 melt seasons in Northeast Greenland in order to evaluate interannual lake volume trends.
This study consists of four methods based on various data sources. For simplicity, these approaches will be called (1) the radiative transfer model (RTM), (2) the ICESat-2 equation, (3) the sonar equation, and (4) the DEM method.
2.1 Sentinel-2 data
As part of the European Space Agency's Copernicus program, two Sentinel-2 satellites capture multispectral data ranging from coastal aerosol (442.7 nm) to shortwave infrared (2202.4 nm) with a near-daily revisit time in northern Greenland. This high acquisition rate is advantageous for monitoring dynamic hydrological processes, especially considering the high frequency of cloud coverage over Greenland's coastal regions, which renders a significant portion of images unusable. Furthermore, Sentinel-2's red, green, and blue (RGB) bands are provided with a resolution of 10 m, which is valuable for a detailed analysis of the lakes. The Sentinel-2 images are provided as a top-of-atmosphere product (L1C) or an atmospherically corrected bottom-of-atmosphere product (L2A) (Drusch et al., 2012). As the atmosphere would distort the reflectance value of lake pixels, and thus the depth estimations, L2A images are used in this study. Furthermore, the cloud-masking algorithm developed by Nambiar et al. (2022) that was specifically created for polar regions is used here to eliminate cloudy images from the processing chain. All methods except for the DEM method rely on Sentinel-2 data for the estimation of lake depth. Ideally, suitable imagery is acquired from the same date as the ICESat-2, in situ sonar, or TanDEM-X data; however, due to poor atmospheric conditions or missing data, images from the same day may not be available. In these cases, images from the previous day were used with only one exception.
2.2 Radiative transfer model
Developed by Philpot (1987), the radiative transfer model uses a physically based understanding of how light attenuates through the water to provide an estimate of its depth. It is described by Eq. (1):
where z is depth, Ad is the lake bed albedo, R∞ is the reflectance of optically deep water (e.g., ocean), Rw is the reflectance value of the lake pixel, and g is a two-way attenuation coefficient. Here, along with the other equations presented in this research, depth below the surface is a positive value. As the lake bed albedo is unable to be measured directly, the assumption that the surrounding ice-free water can be used as an approximate estimate is utilized. Thus, Ad is calculated from averaging the reflectance values within a 30 m (i.e., three-pixel) radius around each lake, as in Moussavi et al. (2020). This radius is used in order to compensate for potential imperfections in the lake masks, which could allow for some water pixels to be included in the Ad calculation. Furthermore, although it is intended that R∞ be calculated for each image, optically deep water is not present in every scene due to various conditions, such as cloud cover or extensive sea ice presence. Thus, R∞ is empirically determined from averaging the reflectance of optically deep water (i.e., ocean) from many Sentinel-2 scenes in the region, similar to Melling et al. (2024). Additionally, g is estimated using various relationships of light attenuation in water, the values for which are tuned to the specific wavelength observed by different satellite missions. Here, the values determined in Williamson et al. (2018) for Sentinel-2 are used, specifically 0.1413 for the green band.
2.3 ICESat-2
2.3.1 Data location
In this study, ICESat-2 is used to define one of the four algorithms. Launched in 2018, ICESat-2 carries a set of six green lasers (532 nm) with a 10 kHz pulse repetition rate (Neumann et al., 2019). This high frequency makes it possible to identify lake profiles with the ATL03 product, which is a geolocated dataset where individual photons are reflected off both the lake surface and bed. Because ICESat-2 has a long revisit cycle of 91 d, it is not inherently suitable for the intraseasonal monitoring of SGL evolution, as lakes usually develop and sometimes drain within days to a few weeks. However, as Sentinel-2 has a high temporal and spatial resolution in Greenland, such a monitoring task is possible. Thus, the depths derived from the ICESat-2 lake crossings are correlated with temporally coinciding Sentinel-2 images to create a depth–reflectance relationship.
Figure 1a shows the locations used in this study for which an ICESat-2 path crossed a filled supraglacial lake, depicted by purple points. In order to allow a sufficient number of ICESat-2 lake crossing and Sentinel-2 imagery, we augmented our dataset from Northeast Greenland with datasets from Southwest Greenland. In total, we found 19 lake crossings over the 2019–2022 melt seasons for which the lake profiles contained enough points for the lake surface and bed to be distinguishable. These crossings are depicted in Fig. 1c for the lakes found in Northeast Greenland and in Fig. 1d for those found in Central-West Greenland and Southwest Greenland (as defined by Rignot et al., 2011). For each lake crossing, a corresponding Sentinel-2 image was acquired from the same day or the closest day to the ICESat-2 crossing as possible. In Table A1, detailed information for each lake crossing is listed, including the date of acquisition, the ICESat-2 beam ID, the number of lakes acquired from each track, and the corresponding Sentinel-2 image used for further processing.
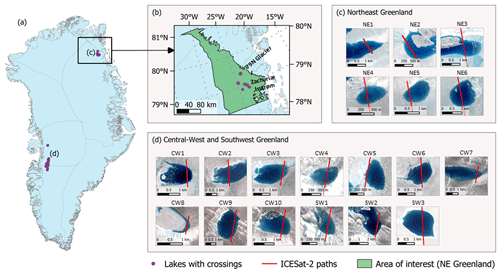
Figure 1(a) An overview of Greenland, showing the locations of the supraglacial lakes with ICESat-2 crossings used in this study (purple points), labeled “(c)” and “(d)”; these locations are shown in further detail in the respective panels (c) and (d). The gray lines represent Greenland's basin boundaries, produced by Rignot et al. (2011). (b) A closer view of Northeast Greenland, highlighting the region over which an interannual analysis was produced. Panels (c) and (d) show the ICESat-2 track paths (red) for the lakes marked in panel (a) for Central-West Greenland/Southwest Greenland and Northeast Greenland, respectively. Each lake is represented visually using the Sentinel-2 image closest to the acquisition (listed in Table A1).
2.3.2 ICESat-2 lake crossing track retrieval
Here, ATL03 tracks from ICESat-2 were used to gather a set of SGL depth profiles. Due to ICESat-2's long revisit time and narrow footprint, a lake crossing is a relatively rare event. Areas in Northeast Greenland and Central-West Greenland/Southwest Greenland (shown in Fig. 1) were manually investigated over the 2019–2022 summer melt seasons to identify potential lake crossings using NASA's OpenAltimetry tool (https://openaltimetry.earthdatacloud.nasa.gov/data/icesat2/, last access: 12 February 2023). The date, geolocation, and track ID of unfrozen and high-quality lake crossings were then entered into the Jupyter Notebook processing tool developed by Fricker et al. (2021) (https://github.com/fliphilipp/pondpicking, last access: 16 February 2023). In this tool, the ICESat-2 ATL03 data are shown in an editable window, where the lake surface and bed can then be manually drawn. An example using one of the lakes can be seen in Fig. 2a, where the manually drawn lake surface is depicted by the blue line, while the lake bed is shown using the red line. It should be noted that these lines are not determined in regard to the photon confidence level (Neumann et al., 2019), rather by the density of photon return signals. Based on best judgment and consistency with previous studies (Fricker et al., 2021), the surface and bed profiles were drawn along the areas of highest photon concentration, typically just below the first appearance of photon accumulation. However, the width of the area of high photon concentration spans an average range of 0.62 m for the lake surface and 1.06 m for the lake bed, resulting in a substantial difference in where the surface or bed could be delineated. The depths from the obtained track were then correlated to Sentinel-2 reflectance values. Figure 2b shows the corresponding track path over a Sentinel-2 image from the previous day. The Sentinel-2 L2A images were downloaded and then preprocessed by converting the digital numbers to reflectance values. In this study, all three RGB bands were investigated to determine which band produces the most reliable depth results. Thus, reflectance values were collected for each band along the profile of each lake.
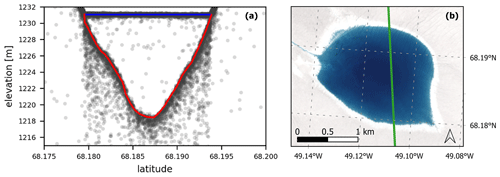
Figure 2An example SGL in Southwest Greenland captured on 18 August 2019. (a) ICESat-2 ATL03 data showing the lake surface (blue) and lake bed profile (red), created using the picking tool by Fricker et al. (2021). (b) The Sentinel-2 image from the previous day (17 August 2019), showing the ICESat-2 path crossing the lake (green).
2.3.3 Lake depth equation
Firstly, a refraction correction needed to be applied to the ICESat-2 depths to account for the change in the speed of light in water. As used in Parrish et al. (2019), it is defined as follows:
where R is the adjusted depth, S is the uncorrected depth, n1 is the refractive index of air (n1=1.00029), and n2 is the refractive index of green light (λ=560 nm) in water (n2=1.3343); the refractive indices are adapted from Mobley (1995). The corrected ICESat-2 depths were then compared with RGB reflectance values for all 19 lakes. An exponential function was fitted to each band, and the R2 values were used to determine which optical band best correlates with lake depth.
2.4 In situ sonar
The second empirically derived depth algorithm is based on sonar data gathered in situ in Northeast Greenland. For this, a self-built remote-controlled boat equipped with a sonar sensor was constructed. This boat consists of a floatation board, two propellers, a waterproof box containing electrical wiring and a battery, and a Lawrence Elite 7 FS sonar sensor and corresponding monitor (see Fig. 3a and b). During fieldwork in July 2022, four depth profiles were measured with this boat, the locations of which are depicted in Fig. 3d. These lakes are located upstream of the grounding line of the glacier Zachariae Isstrom (Zachariæ Isstrøm) (as shown in Fig. 3c). These lake profiles are then processed using the ReefMaster 2.0 software, where the lake bed is manually delineated from the sonar signal and then converted into vector data points. Some error could arise from the delineation of the lake bed from the sonar plot, as there is not only some noise in the backscatter but also limitations with respect to manually extracting the surface. We assume this error to be approximately 0.20 m based on experience delineating sonar signals. As a note, the naming convention of these lakes is based on the location of topographical depressions in the Northeast Greenland region highlighted in Fig. 1b, over which there are roughly 860 depressions that have recently filled with meltwater. Within some depressions, multiple untouching lakes regularly form, requiring the use of the descriptors a, b, c, and d.
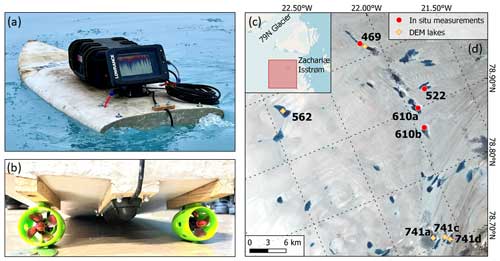
Figure 3(a) The remote-controlled sonar-equipped boat used in this fieldwork to gather lake depth profiles. (b) The underside of the boat, showing the sonar sensor (in the middle) and the two propellers. (c) A zoomed-out view of the scene in panel (d), showing the relation of the measurements to the two major glaciers in Northeast Greenland. (d) A Sentinel-2 image from 19 July 2021 with the sites on which the sonar measurements of four supraglacial lakes were taken (marked with red points) and the lakes for which DEMs were created (marked with yellow diamonds). Each lake is labeled with its ID number.
The four sonar tracks acquired in situ via a remote-controlled boat are displayed in Fig. 4, where the tracks are overlaid onto a Sentinel-2 image captured 1 d before the sonar acquisition. Each track contains data up to around 100 m offshore. The tracks for lakes 522, 610a, and 610b in Fig. 4b, c, and d, respectively, show depths of up to roughly 7 m, while the track for lake 469 in Fig. 4a shows depths above 10 m with a small area that is around 14 m deep.
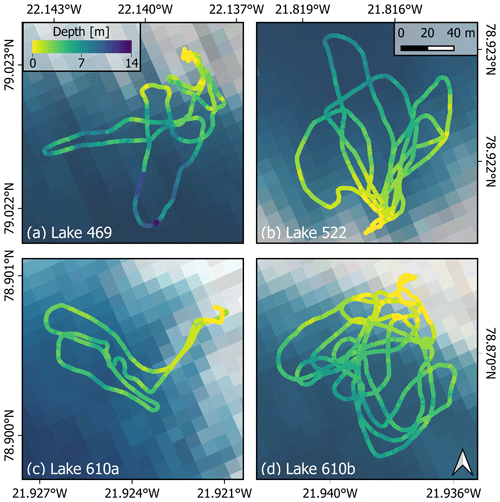
Figure 4The sonar tracks captured over the four SGLs acquired in situ with a remote-controlled boat. The sonar data for Lake 610a were acquired on 4 July 2022, whereas those for the other three lakes were obtained on 9 July 2022. The backgrounds are Sentinel-2 L2A RGB images from 1 d before the sonar acquisition date, i.e., 3 July 2022 and 8 July 2022.
The depths from these sonar tracks were correlated to the Sentinel-2 imagery to create a depth–reflectance relationship, similarly to the ICESat-2 method. The sonar acquisition dates and Sentinel-2 tile IDs can be found in Table A2. The sonar depth data were acquired at a much higher resolution than the resolution of Sentinel-2 images, so an average of the sonar depth data was taken over every Sentinel-2 pixel. This discrepancy in resolution results in an average standard deviation of 0.32 m among all of the pixels used to create the equation. The sonar tracks, however, did not always pass perfectly through the center of the pixel, so the measured depths may only be representative of a portion of the pixel. An exponential function was then fit to the depth–reflectance data of the most suitable band, determined in Sect. 2.3.3.
2.5 TanDEM-X
In 2010, the TanDEM-X mission was launched, creating a configurable, high-resolution spaceborne radar interferometer in the X band. Synthetic aperture radar (SAR) DEMs of Northeast Greenland are created from Co-registered Single look Slant range Complex (CoSSC) data based on differential interferometry (Sommer et al., 2022). Initially, interferograms were calculated from concatenated SAR acquisitions in the along-track direction. Thereafter, the differential phase of each interferogram was unwrapped using a minimum-cost flow algorithm and converted to elevation values above a reference surface. As the reference DEM, we use the global Copernicus DEM GLO-30 with a spatial resolution of 30 m (European Space Agency, 2022). Eventually, each newly created TanDEM-X DEM was iteratively co-registered to the Copernicus DEM in the horizontal and vertical plane to remove remaining systematic offsets or geometric distortions. The co-registered DEMs, captured after the complete drainage of a supraglacial lake, were used to determine the bathymetry of the lake. From this, the lake depths can be determined for a previous date when the lake was filled.
As TanDEM-X coverage is sporadic due to the campaign-based DEM acquisition (Bachmann et al., 2021) and complete lake drainages are relatively infrequent, the acquisition of a post-drainage lake DEM is difficult. Nonetheless, post-drainage DEMs were created for five lakes in Northeast Greenland over the 2021 melt season, the locations for which are shown in Fig. 3d. In order to determine the lake depth, a lake surface elevation was determined from the boundary of the segmented lake mask from a date before drainage (Lutz et al., 2023). The elevations around the boundary were averaged to produce one surface value, from which the elevations of the lake bed were subtracted, resulting in the lake depth at each pixel. As the resolution of the DEM is 10 m, some variation in the average elevation found within lake edge pixels is to be expected, especially around strongly sloped or rugged areas. When determining the inclusion of a lake in this study, any lake with a surface elevation standard deviation of more than 1.5 m was excluded. Of the five lakes evaluated in this research, the average standard deviation for the surface elevation was 0.93 m.
2.6 Method comparison
To evaluate these lake depth estimation techniques, all four methods were applied to the five lakes for which DEMs were procured. Sentinel-2 imagery was chosen as close to the drainage date of each lake as possible. The lakes in each image were delineated using the deep learning method developed in Lutz et al. (2023). The data pertaining to the lake drainage dates, the DEM acquisition dates, and the Sentinel-2 imagery used are detailed in Table A3.
Additionally, the sonar equation, the ICESat-2 equation, and the RTM method were applied to peak melt dates in the 2016–2022 melt seasons over an area in Northeast Greenland encompassing the 79° N Glacier (Nioghalvfjerdsbræ) and Zachariæ Isstrøm glaciers. This region can be seen in Fig. 1b. The dates for maximum lake area extent were determined from the results found in Lutz et al. (2023). These three methods were then applied to the lake area extent derived from their method. This allows for a comparison of the methods on a large scale while also showing the interannual variability in the meltwater development in the region.
3.1 ICESat-2 depth equation
Figure 5 displays three plots (panels a–c), one for each RGB band, in which the depth values gathered from 19 ICESat-2 lake profiles are plotted against their corresponding Sentinel-2 reflectance values. For each band, the data show two distinct trends, correlating to the region from which the ICESat-2 data were acquired, i.e., whether the lakes were located in Northeast or Southwest Greenland. Due to such distinct behavior between the regions, two curves were fit to the data for each band: the orange data points and curves represent data from Northeast Greenland, whereas the green data points and curves represent data from Southwest Greenland. The ice in Southwest Greenland is generally more heavily covered by sediment than that in Northeast Greenland, leading to a lower surface albedo, which can be seen by the darker color of the ice surrounding lakes in Fig. 1d. This difference presumably explains the shift in depth measurements towards lower reflectance values in data from Southwest Greenland. The distinction between the regional curves becomes stronger with larger wavelengths, i.e., the curves are the most distinctly separated for the blue band and the least separated for the red band, implying a stronger influence of the sediment for wavelengths that penetrate deeper into the water. Furthermore, the red band, shown in Fig. 5b, shows clear limitations due to attenuation. Here, reflectance values are only able to estimate depths up to around 3 m; depths above 3 m are represented by similar reflectance values. Due to this behavior, curves for the red band were only fit on data up to 3.5 m. In contrast, the data points for the green band only start stacking at the same reflectance values once they reach around 10 m deep, while the rest are distributed fairly evenly across the higher reflectance values.
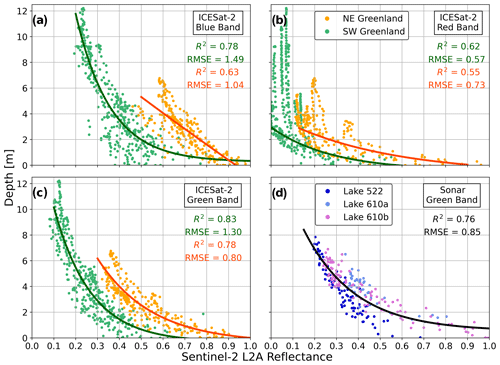
Figure 5SGL depth vs. reflectance plots for ICESat-2 depths (a–c) and sonar depths (d) against their corresponding Sentinel-2 L2A reflectance values. For panels (a)–(c), data gathered from ICESat-2 tracks in Southwest Greenland are represented by green points, whereas data from Northeast Greenland are represented by orange points. For panel (d), each color represents a different lake from which the sonar data were gathered. For panels (a)–(d), the respective curves represent exponential equations fit to the data from the specified band and region, the RMSE and R2 values for which are listed in each panel.
As the green band has the best coefficient of determination (R2) values and has a fairly consistent depth–reflectance ratio across nearly the full spectrum, it has been selected as the basis for this depth algorithm. The best fit to the data was found using an exponential function, defined by Eqs. (3) and (4) for the Southwest and Northeast regions, respectively:
where z is the lake depth and x is the Sentinel-2 L2A reflectance value. These functions are plotted over the ICESat-2 data in Fig. 5c. The root-mean-square error (RMSE) of the exponential fit and the R2 value for the southwest function are 1.30 m and 0.83, respectively, while they are 0.80 m and 0.78 for the northeast function, respectively. To better assess the uncertainty variation along the curve, the RMSE was calculated for bins of 0.05 increments over the reflectance values, as how well the curve fits to the data varies with reflectance. Here, the RMSE values ranged from 0.54 to 1.75 m for the northeast function. Whereas the data points in the southwest function include depths up to 12 m, only depths up to around 7 m were gathered in the northeast. This additional depth range allows the southwest equation to be reasonably valid up to roughly 10 m of depth, where the number of samples declines and the depth values start to saturate at similar reflectance values. The northeast equation, however, can only be reasonably used to depths up to around 6 m.
3.2 Sonar depth algorithm
While post-processing the sonar data, depths were compared at points over which the boat passed more than once, where the difference should in theory be zero. While lakes 522, 610a, and 610b had an average crossover difference of 0.11 m, the average difference of the crossover points for Lake 469, was 0.68 m, with differences found up to 2.11 m. The large discrepancies can be attributed to the rough water conditions rocking the boat during data acquisition. Thus, this lake was removed from the analysis. The relatively small discrepancies found for the other lakes could be attributed not only to minor fluctuations in the lake's surface but also to the precision of the sonar sensor and the geospatial sensor. The depths from these three sonar tracks were plotted together against their corresponding Sentinel-2 reflectance values for the green band, as seen in Fig. 5d. As all three lakes were located in Northeast Greenland, the data follow one trend. An exponential equation was fit to the data, which is described by Eq. (5):
where z is the lake depth and x is the Sentinel-2 L2A reflectance value. The data points corresponding to the Sentinel-2 green band are plotted in Fig. 5d, where the tracks along each lake are a different color. Here, the RMSE for the fit equation is 0.85 m and the R2 is 0.76. Furthermore, the quantification of the uncertainty was handled similarly to the ICESat-2 equation by calculating the RMSE for 0.05 increments over the reflectance values. Among these bins, the RMSE ranges from 0.27 to 0.94 m.
3.3 Comparison of SGL depth estimation methods
The five lakes for which DEMs were procured are shown in Fig. 6. Here, all four depth estimation methods are shown. Some areas of the DEMs are marked as invalid because Sentinel-2 imagery showed some water remaining on the lake bed after drainage. These areas, although shown in the other methods, were not used in the calculation of volumes, maximum depths, or errors to allow for a consistent comparison. Using the DEM results as a reference, the limitations of the other three methods can be seen. While the sonar equation tends to produce the shallowest results, they are the results most in agreement with the DEM estimates, up to its saturation depth of around 8.6 m, which can be seen in Fig. B1c. While this method slightly overestimates shallow areas (<3 m), it produces results similar to the DEM for depths between 3 and 7 m deep, which can be seen in Fig. B2. The ICESat-2 method, however, overestimates depths across the entire depth range, until its saturation point of around 12.7 m (see Fig. B1b). The lowest volume errors in comparison with the DEM estimates are found for Lake 469, where the ICESat-2 method only overestimates the total volume by 6.0 %. While this error is low, it is unrepresentative of the comparison of individual depths. The majority of the lake is overestimated, whereas the deeper areas (13–27 m deep) are underestimated (see Fig. B2). As the data used to fit both the sonar and ICESat-2 methods are limited to shallower depths, the behavior of both methods over 6 m is unconstrained by actual data and, thus, most likely deviates from optimal estimates.
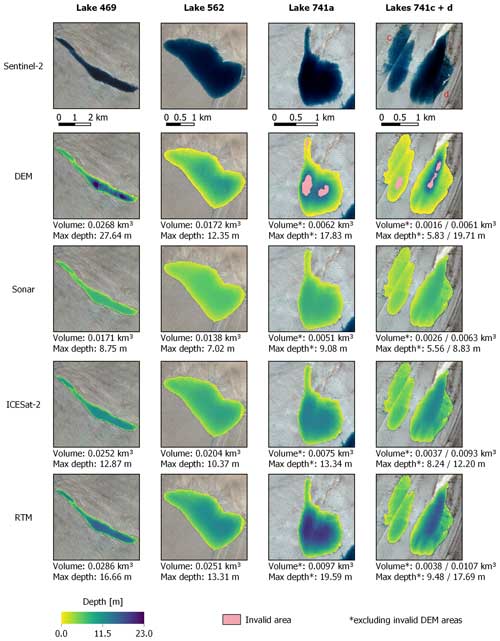
Figure 6The four lake depth estimation methods (DEM, sonar equation, ICESat-2 equation, and RTM) are applied to five different lakes (469, 562, 741a, 741c, and 741d). The total volume estimated from each method is shown for each lake, along with the maximum estimated depth. Areas where the DEM could not be calculated due to residual water are marked in pink. These areas, while shown, were excluded from the calculation of the volume and maximum depths for the other methods. The background images are Sentinel-2 scenes, the corresponding acquisition information for which can be found in Table A3.
The RTM method even more strongly overestimates the lake volume for all five lakes, when compared to the DEM results. For shallower lakes, e.g., lakes 741c and 741d, the RTM method overestimates the volume by 137.5 % and 75.4 %, respectively. This method has its lowest error for the largest lake (Lake 469), with an overestimation error of only 6.7 %. Similar to the ICESat-2 estimates, however, this is unrepresentative of the accuracy of individual depth estimation. The RTM method overestimates depths the most of all methods, until it reaches a saturation level at around 16.3 m (see Fig. B1a). For Lake 469, the majority of the lake is significantly overestimated, but the deeper areas (18–27 m deep) are underestimated (see Fig. B2).
3.4 Interannual comparison of peak melt extent
Figure 7 shows the volume estimates for the ICESat-2 equation, sonar equation, and RTM method for the dates of maximum spatial extent over the 2016–2022 melt seasons over the area in Northeast Greenland shown in Fig. 1b. The uncertainties associated with each method are shown via error bars. These uncertainties were calculated based on various method-dependent factors. For the sonar and ICESat-2 methods, we estimated uncertainties based on geolocation error, on the fit of the data to the curve, and in the delineation of the lake bed and surface in the sonar data. Additionally, an uncertainty based on the cross points of the boat tracks was included for the sonar method. Finally, the uncertainty for the RTM method was based on the sensitivity of the Ad, R∞, and g parameters.
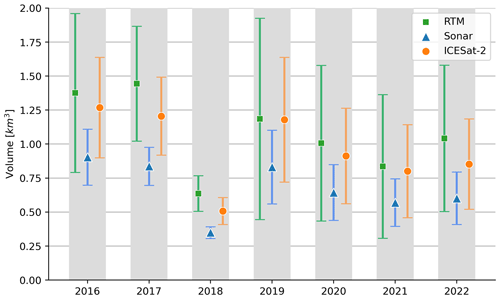
Figure 7The total lake volume over Northeast Greenland (area defined in Fig. 1b) for the date of peak melt area determined in Lutz et al. (2023) over the 2016–2022 melt seasons. The estimates from the sonar equation, ICESat-2 equation, and the RTM method are shown for each melt season, along with their estimated uncertainties.
The 2018 melt season in Northeast Greenland has been shown to be comparably dry and cold (Turton et al., 2021), which is reasonably reflected by the significantly lower volume estimates from all three methods. An example of this large difference is seen when comparing the largest volume for the sonar method in 2016 (0.903 km3 of total water) with the much lower (less than half of the 2016 value) estimates for 2018 (0.349 km3). Besides this large deviation, the interannual variability in the total amount of meltwater gathered in SGLs is rather low, considering the large span of the error bars. The RTM estimates have the largest interannual variability: a standard deviation of 0.287 km3 compared with 0.194 and 0.167 km3 for the respective sonar and ICESat-2 equations. This variability can be explained by the larger saturation depth inherent to the RTM method. With a larger range of potential depths, the amount by which estimates can vary increases.
When comparing to the variability in lake area in Lutz et al. (2023), the interannual lake area variability is much larger than the interannual lake volume variability. For example, the 2016 lake area extent was 346.5 % larger than the 2018 extent, whereas the 2016 total lake volume is only 158.7 % larger than the 2018 total lake volume, based on estimations from the sonar equation. This suggests that more lake area is rather easily gained but that it is composed of relatively shallow water, resulting in less volume change. A closer look at the distribution of average lake depths per year can be seen in Fig. B3.
4.1 Usefulness of the different visible bands for depth analysis
Throughout the literature, both the red and green bands have been used for single-channel depth estimation in multispectral imagery. In our study, the saturation of the red band with depths of around 3 m is clearly seen (see Fig. 5b). This has also been noted by several other research groups (Datta and Wouters, 2021; Melling et al., 2024; Moussavi et al., 2016; Pope et al., 2016; Williamson et al., 2018); however, the red band is often used despite this limitation. Some studies used the red band without justification (Box and Ski, 2007; Fitzpatrick et al., 2014), whereas others concluded that the use of the red band resulted in better performance based on a comparison of the depth estimations from two different satellites (Williamson et al., 2017, 2018). While there is a clear depth–reflectance trend up to around 3 m deep, this low saturation depth limits the scope of such a method. From our sonar, ICESat-2, and DEM data sources, it can be seen that lake depths are often over 5 m deep, with four of the five lakes showing maximum DEM-derived depths of between 10 and 25 m. Moreover, in the interannual comparison, between 8.1 % (in 2020) and 32.1 % (in 2018) of lakes had an average depth larger than 4 m over the melt seasons according to the sonar equation (see Fig. B3). While the majority of lakes were quite shallow, a significant portion of the water volume is present in lakes with deeper average depths. Based on this, the use of the green band seems to be a more suitable choice for estimating deeper lake depths, which was similarly determined by Sneed and Hamilton (2007, 2011) and Tedesco and Steiner (2011). However, an analysis by Pope et al. (2016) that was conducted to compare red and green estimates to DEM-derived depths found that the green band overestimated the lake depths when the radiative transfer model was used. A similar conclusion was reached by Melling et al. (2024), who found that the RTM method applied to five test lakes overestimated depths by up to 153 % with the green band and underestimated depths by up to 63 % with the red band. As seen through our study though, estimates can vary quite strongly depending on the method used, and the radiative transfer model is particularly prone to overestimating lake depth. Moussavi et al. (2016) used DEMs to define several lake depth equations in comparison with the radiative transfer model. In their study, the green band performed best for both single-channel equations; however, they concluded that the use of the red band was preferential due to the lower sensitivity of the red band to variations in the radiative transfer model parameters. While the red band may be better suited to shallow depths, the advantages of using the green band in single-channel depth estimation methodologies seem to outweigh the disadvantages.
4.2 Differences and potential errors in the methodological approaches
As each method is derived from different data sources and is dependent on various variables, the uncertainties present in each method can contribute to the discrepancies seen among the depth estimations. Firstly, there are a couple of effects inherent to regression equations. Neither the ICESat-2 equation nor the sonar equation contain many very shallow (<0.5 m) depths, only 9.8 % and 3.3 % of the data, respectively. Furthermore, the sonar equation only contains four data points above 7 m (1.64 % of the data) and there are no data above 7 m for the ICESat-2 equation. Due to this limited spread, the regressions are not properly bound at the extremes. This effect can be seen in the sonar equation's inability to estimate depths above 8.6 m as well as in the overestimation of depths in the ICESat-2 equation. Furthermore, the addition of deeper data points for both the sonar and ICESat-2 equations could affect the curvature of the entire regression, which would affect the estimation of the rest of the depths as well. Moreover, the inability of both equations to accurately estimate very shallow areas is apparent in Fig. 6, where the lake depth at the lake edge is overestimated compared with the DEM method. This effect can be attributed to the sonar equation regression never reaching a value below 0.5 m in a physically meaningful range, rendering this method incapable of estimating depths below this value. In the ICESat-2 equation, however, the regression reaches zero, although only at a very high reflectance, which is less likely to be seen in shallow lake edge waters. This difference seen in Fig. 6 could also be due to an inaccurate estimation of the DEM's surface level, which would be more apparent in shallower areas, as the average standard deviation among all five lakes for the surface elevation is 0.93 m. Additionally, several studies have reported that local ice uplift has been observed after a rapid drainage (Chudley et al., 2019; Das et al., 2008; Doyle et al., 2013; Hoffman et al., 2011). While the maximum observed uplift was 1.2 m (Das et al., 2008), most groups reported that the ice slowly settled back to a lower elevation of up to 0.2 m above the pre-drainage elevation. Thus, DEMs created after a rapid drainage could potentially still contain a vertical offset, which could affect the comparison to other methods.
Furthermore, the geolocation of ICESat-2's photons could introduce inaccuracies due to horizontal accuracy and footprint size, resulting in a mismatch between depth and reflectance information. A geolocation error of between 2.5 and 4.4 m was reported through validation with ArcticDEM (Luthcke et al., 2021), which is below the specified ATLAS photon horizontal geolocation of 6.5 m (1σ) (Neumann et al., 2019). However, each beam has a nominal footprint diameter of 17 m, which is larger than the spatial resolution of Sentinel-2 (10 m) and might result in an inaccurate comparison of ICESat-2 depths and Sentinel-2 reflectance.
Next, the depth overestimation in the RTM method seen throughout the lakes in Fig. 6 can be attributed to the difficulties involved in the calculation of the Ad, R∞, and g parameters. Firstly, the reliance on an estimation of R∞ by averaging ocean pixels from other scenes can introduce errors due to a potential difference in atmospheric conditions and Sun elevation, among others. The ocean itself also inherently has a relatively wide spread of reflectance values, in general ranging from 0.06 to 0.11. Secondly, using the lake edge reflectance, Ad, as a proxy for lake bed albedo can introduce errors into depth estimation. Tedesco and Steiner (2011) found this approximation to lead to average depth errors of 15.9 % when estimating Ad with the green band. Similarly, it was found by Moussavi et al. (2016) that Ad estimates based on lake edge reflectances were 5 %–10 % higher than optimized lake bed albedos. This then translates to around a 20 % depth underestimation in green bands. Additionally, the calculation of Ad can be skewed by imperfect lake masks. If the drawn lake boundary does not actually follow the edge of the lake, the Ad value would be calculated from lake pixels instead of just the surrounding ice. If Ad was calculated from water pixels, this would lead to a shallower depth estimation. This could also be problematic for situations in which an SGL is located near a non-ice feature, such as a nunatak. Finally, the theoretical estimation of the variable g may not be realistic. Pope et al. (2016) state that g for green bands is more sensitive to errors than the red band, as green light attenuates through water more slowly. This fact, along with the differences in lab-based and theoretically calculated g values, implies a strong influence of variations in this value on the estimated lake depth. Having specifically tuned the parameter g to a higher value, Melling et al. (2024) found that g was still responsible for a significant overestimation of depth in the green band, even though the depths were more in line with DEM methods than the standardly used theoretical g values.
Thus, for all three parameters discussed here, a sensitivity study was conducted on Lake 562, more details of which can be found in Fig. B4. It was found that a change of 0.01 m−1 in the variable g resulted in a 7.4 % change in estimated volume or a 0.60 m change in average depth of the lake. Furthermore, the variable R∞ was evaluated over the span of reflectance values found in the nearby ocean. Over this reflectance span of 0.05, there was a difference of 14.7 % in the resulting volume estimations. Additionally, as the values for Ad are calculated on the pixels surrounding each lake, the width of the area around the lake is considered here. In this instance, lowering the distance to 10 m or raising it to 60 m had some effect, but it was smaller than the effect seen with the other two variables. This, however, could potentially vary significantly for other lakes around which the ice surface is more variable, e.g., with sediment dispersion. Overall, the sensitivity of these three variables, as well as the rough estimation of some, contribute to the tendency of the RTM to produce erroneous results, without the variables having been tuned to specific scenarios.
4.3 Limitations of lake depth estimation from multispectral images
While methodologies employing multispectral images for the purpose of estimating SGL depths have been shown to work well for most situations, there are certain limitations of such methods which must be acknowledged. Firstly, sediment is deposited on the surface of the glacier, which can then enter the supraglacial lakes and settle to the lake bed, as seen in Fig. 8a, appearing as dark regions. This is further exemplified in Fig. 8b, which shows the amount of sediment left behind after a lake drainage. When estimating lake depth from reflectance values, these areas would be measured with a very low reflectance, which would then lead to depth overestimation. Even though the ice in Northeast Greenland is relatively clean, sediment is still prone to gather in some lakes in the region. Due to the insights gained from the ICESat-2 analysis (see Fig. 5), it can be assumed that the effect of sediment in Southwest Greenland is even more pronounced. Furthermore, if there are any shadows (e.g., from clouds, surrounding topography, or internal topography), this will influence the reflectance value, causing the depth to be overestimated. A third situation inducing errors in depth estimation is frozen lake surfaces. Figure 8c shows an image of a lake with a frozen, although not snow-covered, surface layer. When the surface is frozen but still transparent, it increases the reflectance value in the satellite image. The difference in color between a frozen and unfrozen surface can be seen in Fig. 8d, where a small portion of the surface is unfrozen. From satellite images and even at a high helicopter flying height, it is not obvious that these lakes are frozen. The consequence of this is that there is little to no indication in satellite images that the surface is frozen; thus, the lake will be estimated as shallower than in actuality. This effect also can be problematic in time series analysis, as the floating ice tends to shift around the lake. What could be perceived as a large increase in lake volume could, in actuality, be floating ice shifting from covering up a deep part of the lake to a shallower part. Similarly, if there are thin clouds or fog present over a lake, this could make the lake color appear lighter, causing depth underestimation. This also highlights the importance of using bottom-of-atmosphere products (e.g., Sentinel-2 L2A) to minimize atmospheric effects.

Figure 8Aerial images of sediment-filled, drained, and frozen SGLs in Greenland: (a) a sediment-filled SGL in Northeast Greenland, photo taken in July 2022 by Matthias Braun; (b) the sediment left behind after SGL drainage in Northeast Greenland, photo taken in July 2022 by Angelika Humbert; (c) an SGL in Scoresby Sound with a frozen surface with the exception of the small portion highlighted in inset (d), photo taken in August 2022 by Katrina Lutz.
Throughout the development and implementation of these four supraglacial lake depth estimation methods, it can be seen that each method has certain areas of suitable applicability. The reliability of DEM differencing is advantageous for understanding the full bathymetry of a lake, which cannot be dependably obtained through the other methods, especially for deeper lakes. As long as an accurate surface elevation can be estimated, this method is useful for a closer evaluation of individual lakes, but it is not suitable for long-term or widespread monitoring due to limited acquisitions of TanDEM-X and the irregularity of complete lake drainages.
The other three methods presented here, however, would be more suitable for lake volume estimation on a larger scale. The radiative transfer model is standardly used due to its sole reliance on optical data and the incorporation of the properties of surrounding features. This allows it to be more useful for widespread monitoring; however, the sensitivity of its parameters can easily cause an overestimation of depths. Due to the difficulty involved with properly estimating these parameters, the use of a more simplistic equation could be preferential. Even though the data directly obtained from ICESat-2 or in situ sonar devices are impractical for the continuous monitoring of lakes, the correlation of their depth data to optical missions with a high revisit rate, such as Sentinel-2, allow for a simple and direct estimate of lake depth in optical imagery. The sonar-based equation, while limited in use to depths below 8 m, seems to fit the DEM estimates best. Through the evaluation of the ICESat-2 depths on different Sentinel-2 bands, the influence of the lake location (Northeast vs. Southwest Greenland) is quite apparent. This distinction in the data is most presumably due to the higher percentage of sediment on the ice in many parts of Southwest Greenland, causing a shift to lower reflectance values. Through the band analysis, the green band appears to be most suitable for general applications due to its good depth-to-reflectance ratio and higher saturation limit. However, to improve the methodology overall, combining estimations from red, green, and blue bands into a single algorithm could potentially overcome the attenuation limitations of each band, allowing for more accurate estimations in shallow water with the red band and deeper water with the blue band. The limitations of a method based purely on multispectral images, however, will still be present.
In order to improve both the ICESat-2 and sonar equations, the acquisition of more depth data would be required. Not only would more data reduce the uncertainty attributed to the regression fit, but the acquisition of data with deeper depths would also allow the equations to be properly extended to depths above their current limitations. Additionally, the acquisition of in situ data during a simultaneous ICESat-2 passing would allow for a direct comparison of the raw data on which both respective methods are based. To acquire data from larger portions of a lake than is feasible with a remote-controlled boat, the use of airborne lidar could be advantageous. Overall, this study shows the benefits and disadvantages of different supraglacial lake depth estimation techniques, while demonstrating that relatively reliable estimations can be obtained through more simplistic methods when there are clear atmospheric conditions, low lake bed sedimentation, and minimal floating ice.
Table A1ICESat-2 and Sentinel-2 data used for the development of the ICESat-2-based lake depth algorithm in this study. The lake IDs are designated based on the region within which they are located, i.e., Northeast (NE), Central-West (CW), or Southwest (SW) Greenland.
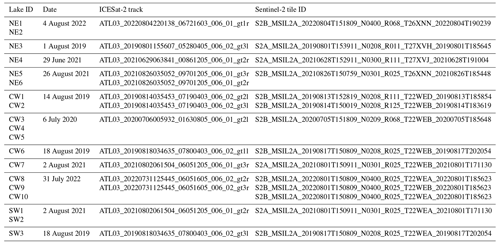
Table A2The acquisition date of the in situ sonar measurements along with the Sentinel-2 image against which the depth data were correlated.

Table A3Data used in the formation of the DEM method comparison analysis. For each lake, the date on which it is first seen drained is listed, along with the date on which the TanDEM-X data were acquired. The Sentinel-2 tile IDs that were used as the basis for the sonar equation, the ICESat-2 equation, and the RTM method are also listed.

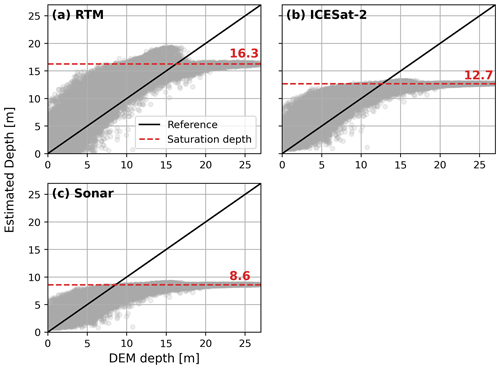
Figure B1The depths (m) derived from the DEMs of all five lakes (469, 562, 741a, 741c, and 741d) against the estimated depths (m) from (a) the RTM method, (b) the ICESat-2 equation, and (c) the sonar equation. A reference line (black) is given to represent where the DEM and estimated depths would be equal. A dashed line (red) shows the depth at which each method is saturated (stays stagnant) even though the DEM depth increases.
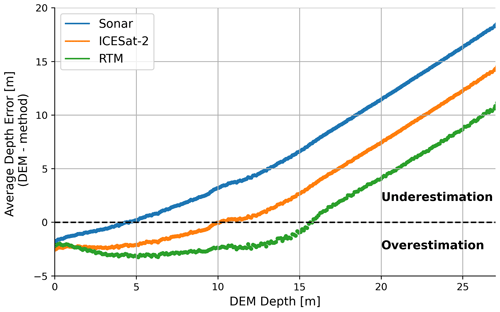
Figure B2The average error in depth for the sonar, ICESat-2, and RTM methods in comparison with the reference depths of the DEM for all five lakes (469, 562, 741a, 741c, and 741d) over 10 cm depth increments. The average depth derived from each method is subtracted from the DEM depth, implying that all negative errors are an overestimation and all positive errors are an underestimation of the specific method when compared with the DEM.
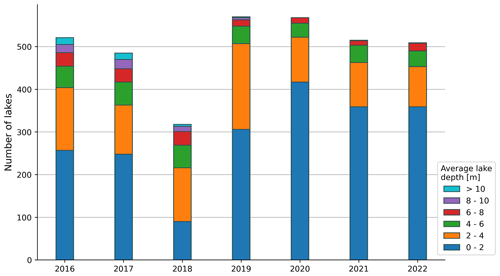
Figure B3Number of lakes on the yearly peak melt dates, categorized by the average depth (m) of each lake calculated using the sonar method.
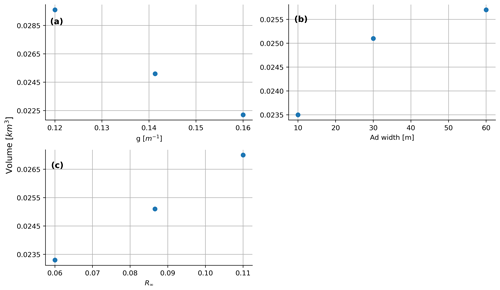
Figure B4The sensitivity of (a) the two-way attenuation coefficient, g; (b) the width of ice around the lake considered in calculating the lake bed albedo, Ad, width; and (c) the reflectance of optically deep water, R∞. The estimated lake volume for Lake 562 is given for the different variable inputs. The central value for each parameter was used in the method comparison in Sect. 3.3.
The in situ sonar data used in this study are freely available from PANGAEA: https://doi.org/10.1594/PANGAEA.971782 (Lutz et al., 2024).
KL and MB were responsible for conceptualization. KL was responsible for data curation. KL and LB developed the methodology and conducted the formal analysis. TS, MB, and KL were responsible for the construction of the remote-controlled boat. The investigation, specifically the collection of field data, was conducted by KL, MB, AH, and MS. Resources were procured by KL and MB. KL and CS were responsible for the development and implantation of necessary software. MB was responsible for funding acquisition, project administration, and supervision. KL was responsible for data visualization and the preparation of the original draft of the manuscript. All co-authors contributed to reviewing and editing the manuscript.
The contact author has declared that none of the authors has any competing interests.
Publisher's note: Copernicus Publications remains neutral with regard to jurisdictional claims made in the text, published maps, institutional affiliations, or any other geographical representation in this paper. While Copernicus Publications makes every effort to include appropriate place names, the final responsibility lies with the authors.
The authors would like to acknowledge the Alfred-Wegener-Institut for granting us space aboard the Polarstern PS131 expedition to conduct research. We would also like to thank ESA, DLR, and NASA for providing the respective Sentinel-2, TanDEM-X, and ICESat-2 data free of charge. Finally, we acknowledge financial support from the Deutsche Forschungsgemeinschaft and the Friedrich-Alexander-Universität Erlangen-Nürnberg within the “Open Access Publication Funding” funding program.
This research has been supported by the Bundesministerium für Bildung und Forschung (grant no. 03F0855) and the Bayerische Staatsministerium für Wirtschaft, Landesentwicklung und Energie (Measuring and Modelling Mountain Glaciers and Ice Caps in a Changing Climate).
This paper was edited by Nicholas Barrand and reviewed by Laura Melling and Devon Dunmire.
Arthur, J. F., Stokes, C. R., Jamieson, S. S. R., Carr, J. R., and Leeson, A. A.: Distribution and seasonal evolution of supraglacial lakes on Shackleton Ice Shelf, East Antarctica, The Cryosphere, 14, 4103–4120, https://doi.org/10.5194/tc-14-4103-2020, 2020.
Bachmann, M., Kraus, T., Bojarski, A., Schandri, M., Boer, J., Busche, T., Bueso Bello, J.-L., Grigorov, C., Steinbrecher, U., Buckreuss, S., Krieger, G., and Zink, M.: The TanDEM-X Mission Phases – Ten Years of Bistatic Acquisition and Formation Planning, IEEE J. Sel. Top. Appl., 14, 3504–3518, https://doi.org/10.1109/JSTARS.2021.3065446, 2021.
Box, J. E. and Ski, K.: Remote sounding of Greenland supraglacial melt lakes: Implications for subglacial hydraulics, J. Glaciol., 53, 257–265, https://doi.org/10.3189/172756507782202883, 2007.
Chudley, T. R., Christoffersen, P., Doyle, S. H., Bougamont, M., Schoonman, C. M., Hubbard, B., and James, M. R.: Supraglacial lake drainage at a fast-flowing Greenlandic outlet glacier, P. Natl. Acad. Sci. USA, 116, 25468–25477, https://doi.org/10.1073/pnas.1913685116, 2019.
Corr, D., Leeson, A., McMillan, M., Zhang, C., and Barnes, T.: An inventory of supraglacial lakes and channels across the West Antarctic Ice Sheet, Earth Syst. Sci. Data, 14, 209–228, https://doi.org/10.5194/essd-14-209-2022, 2022.
Das, S. B., Joughin, I., Behn, M. D., Howat, I. M., King, M. A., Lizarralde, D., and Bhatia, M. P.: Fracture Propagation to the Base of the Greenland Ice Sheet During Supraglacial Lake Drainage, Science, 320, 778–781, https://doi.org/10.1126/SCIENCE.1153360, 2008.
Datta, R. T. and Wouters, B.: Supraglacial lake bathymetry automatically derived from ICESat-2 constraining lake depth estimates from multi-source satellite imagery, The Cryosphere, 15, 5115–5132, https://doi.org/10.5194/tc-15-5115-2021, 2021.
Dell, R. L., Banwell, A. F., Willis, I. C., Arnold, N. S., Halberstadt, A. R. W., Chudley, T. R., and Pritchard, H. D.: Supervised classification of slush and ponded water on Antarctic ice shelves using Landsat 8 imagery, J. Glaciol., 68, 1–14, https://doi.org/10.1017/JOG.2021.114, 2021.
Dirscherl, M., Dietz, A. J., Kneisel, C., and Kuenzer, C.: Automated Mapping of Antarctic Supraglacial Lakes Using a Machine Learning Approach, Remote Sens.-Basel, 12, 1203, https://doi.org/10.3390/rs12071203, 2020.
Doyle, S. H., Hubbard, A. L., Dow, C. F., Jones, G. A., Fitzpatrick, A., Gusmeroli, A., Kulessa, B., Lindback, K., Pettersson, R., and Box, J. E.: Ice tectonic deformation during the rapid in situ drainage of a supraglacial lake on the Greenland Ice Sheet, The Cryosphere, 7, 129–140, https://doi.org/10.5194/tc-7-129-2013, 2013.
Drusch, M., Del Bello, U., Carlier, S., Colin, O., Fernandez, V., Gascon, F., Hoersch, B., Isola, C., Laberinti, P., Martimort, P., Meygret, A., Spoto, F., Sy, O., Marchese, F., and Bargellini, P.: Sentinel-2: ESA's Optical High-Resolution Mission for GMES Operational Services, Remote Sens. Environ., 120, 25–36, https://doi.org/10.1016/j.rse.2011.11.026, 2012.
European Space Agency: Copernicus DEM – Global and European Digital Elevation Model (COP-DEM), https://doi.org/10.5270/ESA-c5d3d65, 2022.
Fair, Z., Flanner, M., Brunt, K. M., Fricker, H. A., and Gardner, A.: Using ICESat-2 and Operation IceBridge altimetry for supraglacial lake depth retrievals, The Cryosphere, 14, 4253–4263, https://doi.org/10.5194/tc-14-4253-2020, 2020.
Fitzpatrick, A. A. W., Hubbard, A. L., Box, J. E., Quincey, D. J., van As, D., Mikkelsen, A. P. B., Doyle, S. H., Dow, C. F., Hasholt, B., and Jones, G. A.: A decade (2002–2012) of supraglacial lake volume estimates across Russell Glacier, West Greenland, The Cryosphere, 8, 107–121, https://doi.org/10.5194/tc-8-107-2014, 2014.
Fricker, H. A., Arndt, P., Brunt, K. M., Datta, R. T., Fair, Z., Jasinski, M. F., Kingslake, J., Magruder, L. A., Moussavi, M., Pope, A., Spergel, J. J., Stoll, J. D., and Wouters, B.: ICESat-2 Meltwater Depth Estimates: Application to Surface Melt on Amery Ice Shelf, East Antarctica, Geophys. Res. Lett., 48, e2020GL090550, https://doi.org/10.1029/2020gl090550, 2021.
Glen, E., Leeson, A. A., Banwell, A. F., Maddalena, J., Corr, D., Noël, B., and McMillan, M.: A comparison of supraglacial meltwater features throughout contrasting melt seasons: Southwest Greenland, EGUsphere [preprint], https://doi.org/10.5194/egusphere-2024-23, 2024.
Gudmundsson, G. H.: Transmission of basal variability to a glacier surface, J. Geophys. Res., 108, 2253, https://doi.org/10.1029/2002JB002107, 2003.
Hochreuther, P., Neckel, N., Reimann, N., Humbert, A., and Braun, M.: Fully automated detection of supraglacial lake area for northeast greenland using sentinel-2 time-series, Remote Sens.-Basel, 13, 1–24, https://doi.org/10.3390/rs13020205, 2021.
Hoffman, M. J., Catania, G. A., Neumann, T. A., Andrews, L. C., and Rumrill, J. A.: Links between acceleration, melting, and supraglacial lake drainage of the western Greenland Ice Sheet, J. Geophys. Res., 116, F04035, https://doi.org/10.1029/2010JF001934, 2011.
Hu, J., Huang, H., Chi, Z., Cheng, X., Wei, Z., Chen, P., Xu, X., Qi, S., Xu, Y., and Zheng, Y.: Distribution and Evolution of Supraglacial Lakes in Greenland during the 2016–2018 Melt Seasons, Remote Sens.-Basel, 14, 55, https://doi.org/10.3390/RS14010055, 2021.
Lampkin, D. J. and Vanderberg, J.: A preliminary investigation of the influence of basal and surface topography on supraglacial lake distribution near Jakobshavn Isbrae, western Greenland, Hydrol. Process., 25, 3347–3355, https://doi.org/10.1002/HYP.8170, 2011.
Legleiter, C. J., Tedesco, M., Smith, L. C., Behar, A. E., and Overstreet, B. T.: Mapping the bathymetry of supraglacial lakes and streams on the Greenland ice sheet using field measurements and high-resolution satellite images, The Cryosphere, 8, 215–228, https://doi.org/10.5194/tc-8-215-2014, 2014.
Luthcke, S. B., Thomas, T. C., Pennington, T. A., Rebold, T. W., Nicholas, J. B., Rowlands, D. D., Gardner, A. S., and Bae, S.: ICESat-2 Pointing Calibration and Geolocation Performance, Earth and Space Science, 8, e2020EA001494, https://doi.org/10.1029/2020EA001494, 2021.
Lutz, K., Bahrami, Z., and Braun, M.: Supraglacial Lake Evolution over Northeast Greenland Using Deep Learning Methods, Remote Sens.-Basel, 15, 4360, https://doi.org/10.3390/rs15174360, 2023.
Lutz, K., Bever, L., Sommer, C., Seehaus, T., Humbert, A., Scheinert, M., and Braun, M. H.: In situ supraglacial lake depth measurements using remote controlled sonar boat in Northeast Greenland, July 2022, PANGAEA [data set], https://doi.org/10.1594/PANGAEA.971782, 2024.
Macdonald, G. J., Banwell, A. F., and MacAyeal, D. R.: Seasonal evolution of supraglacial lakes on a floating ice tongue, Petermann Glacier, Greenland, Ann. Glaciol., 59, 56–65, https://doi.org/10.1017/aog.2018.9, 2018.
Melling, L., Leeson, A., McMillan, M., Maddalena, J., Bowling, J., Glen, E., Sandberg Sørensen, L., Winstrup, M., and Lørup Arildsen, R.: Evaluation of satellite methods for estimating supraglacial lake depth in southwest Greenland, The Cryosphere, 18, 543–558, https://doi.org/10.5194/tc-18-543-2024, 2024.
Mobley, C. D.: The optical properties of water, in: Handbook of Optics, vol. I, The Optical Society of America (OSA), McGraw-Hill, New York, NY, USA, 43.3–43.56, 1995.
Moussavi, M., Pope, A., Halberstadt, A., Trusel, L. D., Cioffi, L., and Abdalati, W.: Antarctic Supraglacial Lake Detection Using Landsat 8 and Sentinel-2 Imagery: Towards Continental Generation of Lake Volumes, Remote Sens.-Basel, 12, 134, https://doi.org/10.3390/rs12010134, 2020.
Moussavi, M. S., Abdalati, W., Pope, A., Scambos, T., Tedesco, M., MacFerrin, M., and Grigsby, S.: Derivation and validation of supraglacial lake volumes on the Greenland Ice Sheet from high-resolution satellite imagery, Remote Sens. Environ., 183, 294–303, https://doi.org/10.1016/j.rse.2016.05.024, 2016.
Nambiar, K. G., Morgenshtern, V. I., Hochreuther, P., Seehaus, T., and Braun, M. H.: A Self-Trained Model for Cloud, Shadow and Snow Detection in Sentinel-2 Images of Snow- and Ice-Covered Regions, Remote Sens.-Basel, 14, 1825, https://doi.org/10.3390/RS14081825, 2022.
Neumann, T. A., Martino, A. J., Markus, T., Bae, S., Bock, M. R., Brenner, A. C., Brunt, K. M., Cavanaugh, J., Fernandes, S. T., Hancock, D. W., Harbeck, K., Lee, J., Kurtz, N. T., Luers, P. J., Luthcke, S. B., Magruder, L., Pennington, T. A., Ramos-Izquierdo, L., Rebold, T., Skoog, J., and Thomas, T. C.: The Ice, Cloud, and Land Elevation Satellite – 2 Mission: A Global Geolocated Photon Product Derived From the Advanced Topographic Laser Altimeter System, Remote Sens. Environ., 233, 111325, https://doi.org/10.1016/j.rse.2019.111325, 2019.
Parrish, C. E., Magruder, L. A., Neuenschwander, A. L., Forfinski-Sarkozi, N., Alonzo, M., and Jasinski, M.: Validation of ICESat-2 ATLAS Bathymetry and Analysis of ATLAS's Bathymetric Mapping Performance, Remote Sens.-Basel, 11, 1634, https://doi.org/10.3390/rs11141634, 2019.
Philpot, W. D.: Radiative transfer in stratified waters: a single-scattering approximation for irradiance, Appl. Optics, 26, 4123–4132, https://doi.org/10.1364/AO.26.004123, 1987.
Pope, A., Scambos, T. A., Moussavi, M., Tedesco, M., Willis, M., Shean, D., and Grigsby, S.: Estimating supraglacial lake depth in West Greenland using Landsat 8 and comparison with other multispectral methods, The Cryosphere, 10, 15–27, https://doi.org/10.5194/tc-10-15-2016, 2016.
Rignot, E., Velicogna, I., van den Broeke, M. R., Monaghan, A., and Lenaerts, J. T. M.: Acceleration of the contribution of the Greenland and Antarctic ice sheets to sea level rise, Geophys. Res. Lett., 38, L05503, https://doi.org/10.1029/2011GL046583, 2011.
Schröder, L., Neckel, N., Zindler, R., and Humbert, A.: Perennial Supraglacial Lakes in Northeast Greenland Observed by Polarimetric SAR, Remote Sens.-Basel, 12, 2798, https://doi.org/10.3390/rs12172798, 2020.
Sneed, W. A. and Hamilton, G. S.: Evolution of melt pond volume on the surface of the Greenland Ice Sheet, Geophys. Res. Lett., 34, 3501, https://doi.org/10.1029/2006GL028697, 2007.
Sneed, W. A. and Hamilton, G. S.: Validation of a method for determining the depth of glacial melt ponds using satellite imagery, Ann. Glaciol., 52, 15–22, https://doi.org/10.3189/172756411799096240, 2011.
Sommer, C., Seehaus, T., Glazovsky, A., and Braun, M. H.: Brief communication: Increased glacier mass loss in the Russian High Arctic (2010–2017), The Cryosphere, 16, 35–42, https://doi.org/10.5194/tc-16-35-2022, 2022.
Tedesco, M. and Steiner, N.: In-situ multispectral and bathymetric measurements over a supraglacial lake in western Greenland using a remotely controlled watercraft, The Cryosphere, 5, 445–452, https://doi.org/10.5194/tc-5-445-2011, 2011.
Turton, J. V., Hochreuther, P., Reimann, N., and Blau, M. T.: The distribution and evolution of supraglacial lakes on 79° N Glacier (north-eastern Greenland) and interannual climatic controls, The Cryosphere, 15, 3877–3896, https://doi.org/10.5194/tc-15-3877-2021, 2021.
Williamson, A. G., Arnold, N. S., Banwell, A. F., and Willis, I. C.: A Fully Automated Supraglacial lake area and volume Tracking (“FAST”) algorithm: Development and application using MODIS imagery of West Greenland, Remote Sens. Environ., 196, 113–133, https://doi.org/10.1016/j.rse.2017.04.032, 2017.
Williamson, A. G., Banwell, A. F., Willis, I. C., and Arnold, N. S.: Dual-satellite (Sentinel-2 and Landsat 8) remote sensing of supraglacial lakes in Greenland, The Cryosphere, 12, 3045–3065, https://doi.org/10.5194/tc-12-3045-2018, 2018.
- Abstract
- Introduction
- Data and methods
- Results
- Discussion
- Conclusions and outlook
- Appendix A: Data acquisition information
- Appendix B: Additional data analysis
- Code and data availability
- Author contributions
- Competing interests
- Disclaimer
- Acknowledgements
- Financial support
- Review statement
- References


