the Creative Commons Attribution 4.0 License.
the Creative Commons Attribution 4.0 License.
Laser ablation inductively coupled plasma mass spectrometry measurements for high-resolution chemical ice core analyses with a first application to an ice core from Skytrain Ice Rise (Antarctica)
Helene Hoffmann
Jason Day
Rachael H. Rhodes
Mackenzie Grieman
Jack Humby
Isobel Rowell
Christoph Nehrbass-Ahles
Robert Mulvaney
Sally Gibson
Eric Wolff
Conventional methods of inorganic impurity analysis do not provide high enough depth resolution for many scientific questions in ice core science. In this study, we present a setup of laser ablation inductively coupled plasma mass spectrometry (LA-ICP-MS) for high-resolution glacier ice impurity analysis to the sub-millimetre scale. This setup enables ice core chemical impurity analysis to a depth resolution of ∼182 µm while consuming only very small amounts of ice. The system performs simultaneous analysis of sodium, magnesium and aluminium incorporated in the ice matrix. In this case study within the framework of the WACSWAIN (WArm Climate Stability of the West Antarctic Ice Sheet in the last INterglacial) project, our method is applied to a selection of samples from the Skytrain ice core (West Antarctica) over a total length of 6.7 m consisting of about 130 single samples. The main goal of this study is to use the new LA-ICP-MS method to extract meaningful climate signals on a depth resolution level beyond the limits of continuous-flow analysis (CFA). A comparison between low-resolution CFA data and the high-resolution LA-ICP-MS data reveals generally good agreement on the decimetre scale. Stacking of parallel laser measurements together with frequency analysis is used to analyse the high-resolution LA-ICP-MS data at millimetre resolution. Spectral analysis reveals that despite effects of impurity accumulation along ice crystal grain boundaries, periodic concentration changes in the Skytrain ice core on the millimetre scale can be identified in ice from 26.8 ka (kiloyears before present, i.e. 1950 CE). These findings open new possibilities for climate data interpretation with respect to fast changes in the last glacial period and beyond, for example within the Beyond EPICA oldest-ice project.
- Article
(10486 KB) - Full-text XML
- BibTeX
- EndNote
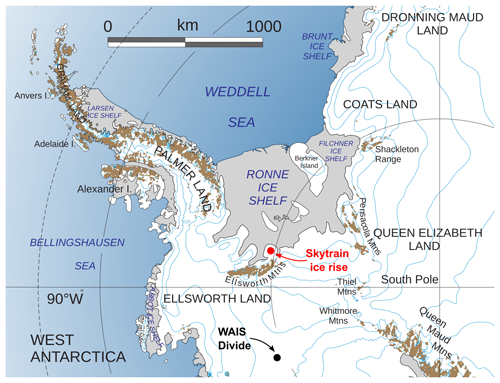
Ice cores from polar and non-polar regions are invaluable archives of past atmospheric composition and climatic conditions. Chemical and physical analyses of the internal ice core layers, formed by sequential compaction of snow to ice, are the key to deciphering this information. With increasing depth and hydrostatic pressure and due to glacial flow, (annual) layers of varying impurity concentration can become highly thinned down to the sub-millimetre scale (Faria et al., 2010). Techniques therefore need to be developed to investigate climatic changes exhibited in ice core records at high depth resolutions. The aim of this study is to present the new Cambridge laser ablation inductively coupled plasma mass spectrometry (LA-ICP-MS) ice measurement system and assess its capabilities to resolve millimetre-scale structures and layers in deep sections of the Skytrain ice core. This will ultimately enable interpretation of climate-related signals in deep and highly thinned ice from the core, which was drilled as part of the WArm Climate Stability of the West Antarctic Ice Sheet in the last INterglacial (WACSWAIN) ERC (2017) project. We identify layering as periodic changes in concentration of the respective impurities with depth, which is superimposed onto concentration changes caused by effects in the ice microstructure. These changes can manifest on timescales from seasonal and sub-annual to multi-millennial. The analysis is focused on the major elements associated with marine and terrestrial influences: sodium (Na), magnesium (Mg) and aluminium (Al). The aim of the WACSWAIN project is to decipher the fate of the Filchner–Ronne Ice Shelf during the last interglacial (LIG) ∼110–130 ka. This information is relevant to estimating future sea level changes under a warming climate. As part of this project, the Skytrain ice core was drilled at Skytrain Ice Rise (Mulvaney et al., 2021) on the edge of the Filchner–Ronne Ice Shelf (Fig. 1). If the ice sheet partly or entirely collapsed during the LIG while Skytrain Ice Rise remained covered by ice, it would be more a marine-influenced area than it would be with an intact ice sheet covering a major area of the Weddell Sea. This enhanced marine influence would subsequently appear as an increase in sea salt concentrations in the ice core record. Ice from the LIG was detected in the ice core at 605–631 m depth, encompassing a time range of about 108–126 ka. The estimated annual-layer thickness from the age model in this depth section is on the order of 1.5 mm (Mulvaney et al., 2023). Therefore, techniques that can detect sea salt and other impurity variability at very high depth resolution are needed to investigate fast changes in the ice dynamics near Skytrain Ice Rise during the LIG.
In past studies, chemical impurity analyses of ice cores were mainly carried out by discrete sampling of the core material followed by ion chromatography (Legrand and Mayewski, 1997; Littot et al., 2002). Although a depth resolution in the lower centimetre range can be achieved by these methods, these are time-consuming and labour-intensive processes that are not applicable for high-resolution analysis of long ice core records. The development of so-called continuous-flow analysis (CFA) techniques massively improved the capabilities of chemical ice core analysis, mainly in terms of analysis speed, sample handling and depth resolution (Röthlisberger et al., 2000; McConnell et al., 2002; Cole-Dai et al., 2006; Bigler et al., 2011). However, these continuous methods are still limited to depth resolutions of at best about 1 cm (Bigler et al., 2011). This is not high enough to address many scientific questions involving very old, highly thinned ice close to bedrock and ice microstructures. A project where this becomes highly relevant is the current search for 1–1.5-million-year-old ice in Antarctica in projects like COLDEX and Beyond EPICA (Parrenin et al., 2017; Brook et al., 2022). In recent years, the technique of LA-ICP-MS was adapted for glacier ice analysis (Reinhardt et al., 2003; Müller et al., 2011; Sneed et al., 2015; Bohleber et al., 2020). This technique enables virtually non-destructive impurity measurements of ice samples to a depth resolution on the order of ∼100 µm or even below. The main principle of analysis is the same for all LA-ICP-MS systems. A highly energetic laser beam (infrared or ultraviolet) slowly scans the ice sample surface and ablates small amounts of material, which are subsequently purged via a stream of carrier gas into an ICP-MS for elemental analysis. The laser ablation systems currently in operation differ mainly in the design of the ablation chamber that is used to accommodate the glacier ice samples during ablation. Two-volume chambers enable much faster sample transport to the ICP-MS and thus higher resolution than single-volume chambers. Most of the setups are designed to hold small strips of ice with lateral extensions up to ∼10 cm maximum (Bohleber et al., 2020) in a closed ablation chamber. To our knowledge, at present only the system at the University of Maine is built to analyse half core pieces of up to 1 m length (Sneed et al., 2015). This system involves an open cooling chamber with a small laser cell that is attached to the sample surface and incrementally moved along the depth axis of the sample.
The Cambridge LA-ICP-MS system is routinely used for geological investigations, e.g. Jackson and Gibson (2018). In this study, it was modified to enable glacier ice analysis. The Cambridge University setup differs from the University of Maine system in that it is a closed-cell design that is able to hold sample geometries in the shape of standard microscope slides (75 mm×26 mm). It is therefore designed for detailed impurity analysis rather than for large sample throughput. In this study, the capability of the new Cambridge LA-ICP-MS ice measurement system to resolve fine-scale structures and (annual) Na, Mg, Al and Ca concentration changes in deep sections of the Skytrain ice core is assessed.
WACSWAIN project and the Skytrain ice core
Within the framework of the WACSWAIN project, the Skytrain ice core was drilled to bedrock at Skytrain Ice Rise (see Fig. 1) in field season 2018/19 in a joint effort between the British Antarctic Survey and the University of Cambridge (Mulvaney et al., 2021). The drill reached bedrock at 651 m total depth and with a basal temperature of −15 °C; the basal ice showed no signs of melting (Mulvaney et al., 2021). The surface snow accumulation rate was determined to be about 13.5 cm water equivalent per year () (Hoffmann et al., 2022). The whole core length was analysed via CFA at the British Antarctic Survey (Grieman et al., 2021; Hoffmann et al., 2022). An overview of the previous analytical methods used and the respective depth resolutions of the chemical species relevant for this study is given in Table 1. Dating of the ice core was completed via a combined approach of annual-layer counting, identification of absolute age markers (e.g. volcanic eruptions), matching of features (e.g. in the methane profile) to dated cores and flow modelling (Hoffmann et al., 2022; Mulvaney et al., 2023).
Table 1Overview of selected analytes measured during the continuous-flow analysis of the Skytrain ice core (Hoffmann et al., 2022). FIC stands for fast ion chromatography. The term “depth resolution” refers to the moving average intervals for the respective method. For the FIC, this depth resolution is a binned average (Grieman et al., 2021). The most important parameters for this study are highlighted in bold.

2.1 Sample preparation and handling
In this study, a total length of 6.7 m of the Skytrain ice core consisting of about 130 single samples was analysed. All ice samples were prepared in the cold lab facilities at the British Antarctic Survey (Cambridge) at −25 °C. Each sample was initially cut with a band saw to a geometry of 5 cm in length (along the depth axis), about 2 cm in width and about 2 cm in thickness, depending on the ice core cut that was used. For Skytrain, the samples were taken from the cut for physical properties analyses, which is directly adjacent to the CFA piece (see cutting plan in Grieman et al., 2021). The physical properties and CFA pieces share a common surface, and the analysed ice core sections are horizontally separated by only about 2 cm. Thus, the same signals are expected in both the CFA and the LA-ICP-MS datasets. After the first cut, the largest surface of the sample is trimmed down by 2 mm and smoothed using a sledge microtome (Bright 8000) and ceramic-coated blades. This polished ice surface is subsequently mounted with a line of ultrapure water (ELGA Labwater, 18 MΩ cm, commonly referred to as MQ water) around the edges onto a pre-cleaned (using isopropyl alcohol) standard microscope slide. Quartz slides were used for liquid nitrogen (LN) storage to avoid splintering of the ice due to thermal expansion effects. Subsequently, the samples on the slides were cut a second time with the band saw to a thickness of about 5 mm. The samples were then microtomed and thus polished to a thickness of <3 mm including the slide (1 mm). Photos were taken of all samples before storing them (see Fig. 2) in slide mailers either at −25 °C for short-term storage or in LN dry shippers for long-term storage of more than 3 d to minimize sublimation. The microtome blade was thoroughly cleaned with a brush after every preparation step and changed on a daily basis. All materials in direct contact with the ice samples were metal free. After the final preparation step, the sample surfaces were not touched by any other material than air or nitrogen until the final laser ablation measurement. Even after 3 d of storage at −25 °C, we did not observe substantial sublimation of the sample surfaces that would have affected the laser ablation measurements. On the day of analysis, the samples inside the slide mailers were transferred in an insulated container to the University of Cambridge and stored at −18 °C until measurement.
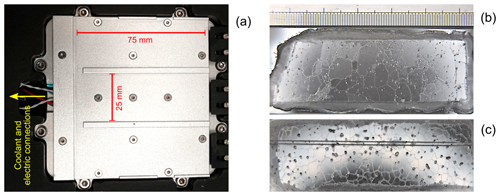
Figure 2(a) Top view of the cryostage. There are three slots available to insert standard microscope slides. The aluminium surface is cooled via Peltier elements. (b) Sample from the Skytrain ice core (depth: 615.22–615.27 m, LIG ice) on a microscope slide before lasering. The scale is in centimetres. The bubbles and crystal grain boundaries are clearly visible. The top of core piece is on the left. (c) Sample from the Skytrain ice core (83.20–83.25 m, ca. 550 a): two parallel laser paths spaced by 1 mm are visible, and the spot size was 150 µm. The top of core piece is on the left.
2.2 Setup and characteristics of the Cambridge LA-ICP-MS system
The Cambridge LA-ICP-MS system comprises an ESI UP193 ultra-compact laser, which operates at 193 nm (NWR193) and is coupled to a Perkin Elmer Nexion 350D quadrupole ICP-MS. During analysis, the ICP-MS was operated without use of the collision cell because operation of the collision cell caused a reduction in sensitivity that outweighed any benefit of background suppression for our glacier ice application.
Prior to analysis, the ICP-MS was cleaned with 1 % HNO3 and MQ water in solution mode to flush out any residual contamination in the instrument. The daily tuning routine included automated optimization of the QID (quadrupole ion deflector) and the nebulizer gas flow. At the beginning of each analysis campaign, which typically lasted 3–4 d comprising ∼20–30 samples, the torch position was also optimized. The ICP-MS calibration and tuning routines were performed using NIST 612 reference material (Jochum et al., 2011) in the standard laser cell rather than the cryocell. An overview of the typical parameters of the ICP-MS and the laser system can be found in Table 2. The laser ablation system is equipped with a 100 mm×100 mm two-volume sample chamber including an inner cup, which enables high precision and short purging and washout times (see Fig. 3).
Table 2Specifications and typical settings of the Cambridge LA-ICP-MS system for analysis of glacier ice samples.
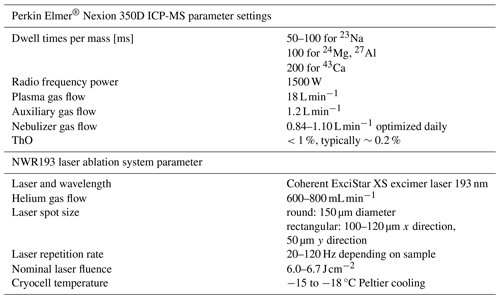
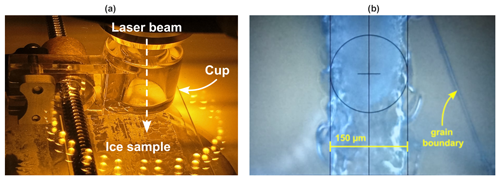
Figure 3(a) View into the laser chamber during glacier ice analysis. There are several lines visible on the ice surface. The laser beam is focused onto the ice in the centre of the small volume cup, which reduces mixing and enables fast washout and high measurement precision. (b) Close-up image of the pre-ablation and ablation path on the ice surface using a round spot (150 µm). An overview mosaic sample picture including the laser path can be found in Fig. A1.
After the tuning process of the ICP-MS, the standard sample stage was exchanged for the CryoCell. This sample stage is designed to accommodate three samples in the geometry of standard microscope slides (see Fig. 2). It was adapted to hold samples of a total thickness of 3 mm (including the 1 mm slide). The CryoCell is cooled by a two-stage system. The pre-cooling is conducted by circulation of a coolant through the stage at a temperature of 4 °C followed by cooling via Peltier elements. Operating temperatures on the stage surface for ice samples were typically −15 to −18 °C. Set temperatures are stable within ±0.5 °C over the course of the day. The sample cup inside the chamber is directly connected to the ICP-MS by Tygon® tubing, which is attached to a DCI (dual concentric injector). This injector enables fast washout times and minimizes turbulent mixing of sample material in the lines (Douglas et al., 2015). The whole body of the laser ablation chamber was wrapped into a glove bag, which was purged with dry nitrogen. This means the system was enclosed entirely in polyethylene (PE) foil and that samples were handled through gloves attached to the PE bag from the outside to prevent any contact of the open sample surface with the lab air. An open reservoir of LN was placed inside the bag to act as a moisture trap and thus minimize condensation of remaining air humidity on the sample and the CryoCell window surface. Immediately before analysis, the ice samples were repacked from a chest freezer at −18 °C into a styrofoam box. The glove bag, covering the laser chamber housing, was opened, and the sample box was quickly placed inside. It was sealed again, and the interior of the bag was purged with dry nitrogen. Then from the outside of the bag the laser chamber was opened, the sample stage was taken out and the glacier ice samples were quickly transferred into the holding slots by use of a PTFE coated pair of tweezers. The transfer time in which the ice samples were not actively cooled was therefore minimized to about 10–15 s. The stage was then pushed back into the ablation cell, which was then purged with dry helium to remove any residual ambient air and moisture. With this approach we were able to avoid condensation on the sample surface and melting of the ice. Even after 2 h in the cell, no condensation of humidity or significant sublimation of the ice samples (e.g. rounding of edges) could be observed.
2.3 Optimization of laser ablation parameters
2.3.1 Blank and standard samples
For reliable analysis and signal interpretation, it is essential to have a comprehensive understanding of the procedural blank. The procedural blank of the sample preparation and laser ablation process was assessed by analysis of artificial ice samples made from MQ water. This blank ice was produced by freezing of the water on a lab shaker at −20 °C in PE bags that were cleaned with nitric acid. The slow freezing leads to concentration of the contaminants (solutes and particles) in the section that freezes last, which can then be cut out and discarded (Shafique et al., 2012; Hoffmann et al., 2018). All blank samples were cut from the remaining clean ice, microtomed and handled in the exact same way as the real ice samples. Creating artificial ice samples with known impurity concentrations to serve as standard material of the same matrix to calibrate the laser ablation process was attempted. Because of separation effects during the freezing process (Halde, 1980), it is extremely difficult to create ice with a homogeneous impurity distribution. Repeated flash freezing of small amounts of standard solution, as described by, e.g. Della Lunga et al. (2017) and Bohleber et al. (2024), might be the most promising approach. However, in the course of this study it was not possible to produce sufficiently homogeneous ice samples to serve as reference materials using this procedure. It was therefore decided that the LA-ICP-MS data would not be calibrated in the quantitative sense. It is instead tuned exclusively with NIST 612 reference material (glass) to optimize the ablation parameters and the signal quality regarding signal intensity and background reduction. The aim of the present study is to investigate relative changes in the retrieved laser ablation signals and not to determine absolute impurity concentrations.
2.3.2 Washout time
A crucial parameter to achieve high spatial resolution of the retrieved impurity data is a fast washout time from the laser system to the ICP-MS. This minimizes the negative effects of turbulence and mixing in the connecting tubing and thus enables clear separation of highly variable signal peaks at the micrometre scale. The Cambridge LA-ICP-MS system is equipped with a Dual Concentric Injector (DCI, manufactured by ESL), which enables immediate introduction of the sample into the plasma stream while minimizing turbulent mixing in a nebulizer (Douglas et al., 2015). The washout time was determined by a series of 10 subsequent laser pulses on NIST 612, with a 30 µm round spot at a firing rate of 1 Hz, a He flow of 600 mL min−1 and a nominal fluence of 4 J cm−2. The dwell times were 0.1 ms for 23Na and 27Al, 0.5 ms for 24Mg and 43Ca, and 1 ms for 238U. An example of the resulting signal for 23Na and 238U is shown in Fig. 4.
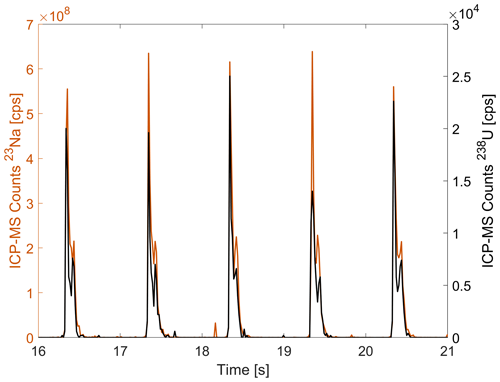
Figure 4Washout times for 23Na and 238U using the NIST 612 standard material. The washout time was calculated as 1 % full-width maximum.
The washout times were calculated using the 1 % full-width maximum criterion. This means that the width of the peak at 1 % of the maximum intensity is measured. An average washout time of 248 ± 35 ms for all elements was found. The results are reported in Table 3.
Table 3Washout times for NIST 612 glass calculated for 23Na and 238U with and without use of the DCI.
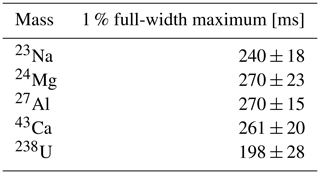
We recognize that the ablation parameters used for the NIST glass, especially the fluence and the spot size, differ from the settings used for ice. Changes in fluence and spot size may lead to changes in peak shape (Jerše et al., 2022). However, use of the ice settings would have ablated too much material to be quantitatively measured by the ICP-MS. We therefore consider the determined washout times as best estimates and probably lower limits. Considering these limitations, the results are likely better than washout times for older ice LA-ICP-MS systems (Della Lunga et al., 2014; Spaulding et al., 2017) and lower than the total acquisition time of the ICP-MS (see Sect. 2.3.3).
2.3.3 Ablation settings and resolution
Laser ablation settings were optimized at the beginning of each measurement session, which lasted 3–4 d, with several weeks to months in between to account for the different sample and resolution requirements. There were 10 sessions in total. During this time, the laser ablation system was used for both ice and geological samples. Normal wear and tear, particularly deterioration of the laser optics over time, led to the need for readjustment of the major settings (nominal laser fluence, repetition rate) for each measurement session, accounting for the relatively high laser power needed for ice ablation. This adjustment of settings was also dependent on the ice sample conditions like opacity and impurity content. Low-impurity content and low opacity were found to require higher nominal fluence and repetition rate settings to ablate enough material. Additionally, the spot size and scanning speed and thus the main parameters for spatial resolution were adjusted regarding the expected layer thickness. For very transparent clear ice with little impurity content, like MQ blank ice, a higher repetition rate of 120–150 Hz was required to achieve a reliable coupling of the laser beam with the ice surface. These parameters were determined during test runs at the beginning of every analysis session and then kept constant for all cohesive samples. The specific settings for depth resolution, laser fluence, and repetition rate for each ice core depth interval are reported in Table 4. The masses analysed were 23Na, 24Mg, 27Al and 43Ca in order to directly compare the results of the LA-ICP-MS method and the CFA ICP-MS method. Based on these results, 43Ca was chosen over 44Ca because it has fewer isobaric interferences. However, after a first assessment in Sect. 3.2 we will not further discuss the calcium because of its overall very low sensitivity. An extension of the monitored masses can be anticipated in the future, for example to 56Fe by use of the collision cell. ICP-MS dwell times were 50 or 100 ms for Na, 100 ms for Mg and Al, and 200 ms for Ca, amounting to a total acquisition time of 500 ms for one cycle. Therefore, the acquisition time is very likely the dominating factor regarding depth resolution compared to the much smaller washout time (240–270 ms), even accounting for the likely under-estimation of washout time (see Sect. 2.3.2). Paths along the depth axis of the ice core samples were scanned over the whole sample length (4–5 cm). To remove surface contamination, a fast pre-ablation scan at speeds of 100–220 µm s−1 and 20–100 Hz laser frequency was performed for each line (see Table 4). The wide range of frequencies and scanning speeds results from the varying sample conditions (transparent ice or bubbly or opaque ice) and the impurity concentrations, as explained above. The scanning speed for the following final ablation was 40 µm s−1 at repetition rates of 20 Hz for the 150 µm round spot and 120–150 Hz for the rectangular spot (see Table 4). This results in a total measurement time of ∼25 min for each line of 5 cm. The resulting nominal laser fluence was in the range of 6.0–6.7 J cm−2. The resulting depth resolution R, accounting for ICP-MS acquisition time tacq, scanning speed vscan and laser repetition rate f, was calculated using an approach similar to that used in Sneed et al. (2015) and Spaulding et al. (2017).
Table 4Depth and age ranges of the available LA-ICP-MS datasets for the Skytrain ice core. For each depth interval 23Na, 24Mg, 27Al and 43Ca were analysed together. The unit “a” refers to years before 1950 CE (present). The age ranges and annual-layer thickness (ALT) estimates were calculated using the ST22 chronology (Hoffmann et al., 2022; Mulvaney et al., 2023).

For the low-resolution setting (150 µm spot size, 20 Hz repetition rate, 40 µm s−1, 500 ms acquisition time), this results in a resolution along the core depth of 170 µm. Taking into account the 1 % washout time twash of ∼300 ms for Na, the laser travels 12 µm during that time, which needs to be added. The total depth resolution R for this setting is then 182 µm. For the high-resolution setting (50 µm spot size, 150 Hz repetition rate, 40 µm s−1) this is reduced to 81.5 µm. The achievable depth resolution with the Cambridge system is therefore at least an order of magnitude better than the expected annual-layer thickness in the LIG section of the Skytrain ice core (0.8–1 mm). Therefore, it should be possible to resolve layered structures on the order of the annual-layer thickness in the ice core if these structures are physically and chemically preserved.
3.1 Background determination
The procedural blank for each element was determined by analysis of artificial MQ ice (see Sect. 2.3.1). An exemplary result of these measurements for a 1.8 cm long line is shown in Fig. 5. The MQ samples were handled and pre-ablated like the ice core samples, and the laser settings for the lowest depth resolution (150 µm round spot, 20 Hz repetition rate, 40 µm s−1 scan speed) were used. For the first 20 and the last 10 s of the measurement (grey areas in Fig. 5), the ICP-MS recorded the gas blank of helium without any laser signal.
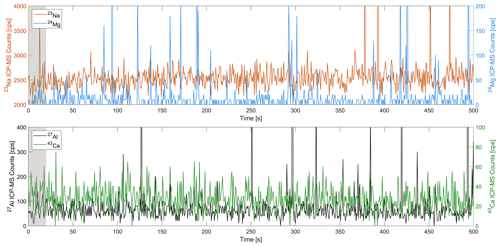
Figure 5Recorded LA-ICP-MS signals for all elements from a 1.8 cm long line measurement of blank ice made of MQ water. The grey shadings mark the recording of the system background with just the He flow and no laser.
All data underwent blank correction by subtracting the mean of the first 20 s of pure helium signal (the gas blank) from the total signal for each measured element. When measuring MQ blank ice the average signal intensity is barely distinguishable from the gas blank for all the elements except Na. The median of the Na signal from MQ ice is on average about 9 % higher than the gas blank. The real ice measurements were well above the gas blank background and are therefore not affected by significant global contamination. However, the MQ blank ice signal contains a larger amount of sharp, isolated peaks in all elements compared to the gas blank. The origin of the sharp, isolated and high peaks cannot be ultimately determined. They are most distinct in the Mg and Al signal and least distinct in the Ca. They are in almost every case caused by excursions of single data points. A potential source could be residual microscopic particles in the sampling lines and the ICP-MS system that are randomly mobilized. This could explain the difference in the quantity of the spikes for different elements. Following these observations, very high peak intensity values, at least 10 times above the median, and isolated point excursions were regarded as outliers and removed during the background correction procedure applied to all blanks and samples. Contrary to these findings, an insufficient decontamination of the ice surface would much more likely lead to sections of an overall enhanced signal than to such distinct, isolated spikes.
3.2 First results – comparison to CFA data
An overview of the chosen depth and age ranges of the analysed samples from the Skytrain Ice core relevant for this study and the expected annual-layer thicknesses based on Hoffmann et al. (2022) and Mulvaney et al. (2023) is given in Table 4.
In a first evaluation, the LA-ICP-MS data were qualitatively compared to CFA records on two different depth intervals, one shallow (∼560–570 a) and one deep (∼20.45–20.73 ka). This comparison aimed to identify common trends in both datasets and evaluate for which elements the LA-ICP-MS technique produces reliable and significant signals. Similar experiments were performed before (e.g. Sneed et al., 2015; Della Lunga et al., 2017) and proved to be a useful tool to evaluate the LA-ICP-MS data.
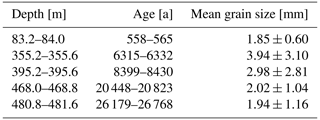
A shallow section of 80 cm length between 83.2 and 84 m core depth consisting of 16 samples (5 cm each) was analysed. Based on the age model, in this depth and age range an annual-layer thickness of about 11 cm is expected. A round laser spot of 150 µm diameter was used, which results in a depth resolution of about 185 µm. The results of these measurements are shown in Fig. 6. The annual layers identified in the CFA sodium and calcium signal (see Hoffmann et al., 2022) are marked in Fig. 6 by vertical black lines. The laser data are reported in counts per second and not converted into calibrated concentration, so only relative changes can be compared. They were corrected for the blank and outliers according to the procedure in Sect. 3.1. For better readability the laser ablation data were smoothed with a 4.5 mm running average.
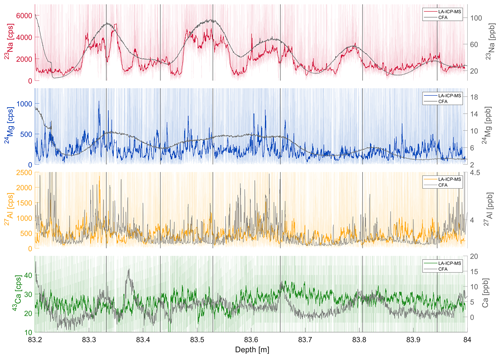
Figure 6LA-ICP-MS signals of Na, Mg, Al and Ca from a shallow section (ca. 560–570 yr BP) of the Skytrain ice core. The coloured signals show the LA-ICP-MS results (faint colours: unsmoothed signal), and the grey signal on top shows the CFA ICP-MS data (Grieman et al., 2021) for comparison. The vertical grey bars mark the identified annual layers from the CFA analysis.
The LA-ICP-MS sodium data clearly follow the course of the low-resolution CFA data, while even in the smoothed version they show much smaller-scale variation than the CFA signal. Sodium is well known to show seasonal variations in Antarctic ice cores, with peak concentrations in winter (Sigl et al., 2016). Comparing the annual-layer markers to the LA-ICP-MS sodium signal, it is obvious that the LA data show all five maxima that were identified in the CFA data plus an additional peak at ∼83.45 m. This indicates that the LA-ICP-MS technique is capable of identifying annual signals in this depth of the core, which would not be visible in the Na signal of the CFA alone. Furthermore, there are smaller-scale variations superimposed onto the annual variations (e.g. around 83.54 m). These small-scale variations are probably not dominated by grain boundary effects because the average grain size in this depth section is about 1.9 ± 0.5 mm and thus much smaller than the period of the observed variations. Instead, these variations may be interpreted as preserved sub-annual signals or even the imprint of extreme deposition events in this depth interval.
For magnesium, the correlation between CFA and LA-ICP-MS data is less obvious, but similarities are still detectable. In particular, the peak in concentration 83.3 m is well represented in the laser data. The large enhanced plateau between 83.4 and 83.65 m and the dip in concentration around 83.7 m can also be identified. For aluminium, the relation is less obvious. The CFA aluminium concentrations are close to the detection limit in this segment, and some of the variability may not be resolved. A direct comparison of these two datasets is therefore not reasonable. The LA-ICP-MS calcium data do not show obvious correlations to the CFA data. This must be mainly attributed to the overall very low level of the laser calcium signal and resulting background influences that could not be corrected sufficiently. These results demonstrate the capability of the LA-ICP-MS measurements to replicate larger trends and longer periods in concentration changes in Na, Mg and potentially Al as documented by the CFA and to reveal much smaller-scale variations that cannot be resolved by conventional methods. To what extent the small-scale variations in the laser ablation data can be diagnosed as periodic layers will be discussed in Sects. 3.3 and 3.4.
To evaluate if the overall good correlation between LA-ICP-MS and CFA data is preserved in the deeper and older parts of the Skytrain ice core, a section from the Last Glacial Maximum (LGM) at about 20 ka was analysed. The results for the LA-ICP-MS measurements compared to the CFA ICP-MS measurements for a 20 cm section are shown in Fig. 7. The theoretical expected annual-layer thickness at this depth is about 2.1 mm and therefore much smaller than the resolution of the CFA data.
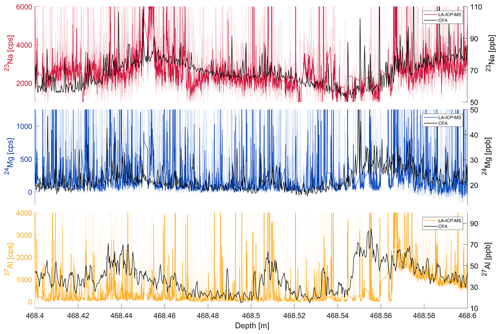
Figure 7LA-ICP-MS signals of Na, Mg and Al from a deep section (ca. 20 500–20 730 yr BP) of the Skytrain ice core. The high-resolution LA-ICP-MS data (coloured) is compared to the CFA ICP-MS data (grey). The faintly coloured data is the unsmoothed LA-IP-MS signal.
As in the shallow section, for Na an impressive coherence of the large-scale variations of the LA-ICP-MS and CFA signals is visible. The baseline of the magnesium signal generally shows little variation in both datasets, which makes a direct comparison challenging. The Mg LA-ICP-MS data are much more variable in amplitude and more affected by sharp peaks and noise than the Na data. However, four enhanced sections around ∼468.41, 468.43, 468.44 and 468.51 m can be identified in both datasets together with the common decrease in concentration from 468.57–468.6 m. The course of the aluminium CFA signal is well represented in the LA-ICP-MS data. The enhanced sections at ∼468.44, 468.51 and 468.53 m are mirrored in the LA-ICP-MS data together with the decline from 468.56–468.60 m. Compared to the CFA data the LA-ICP-MS Al signal shows a much greater variability in amplitude. The LA-ICP-MS calcium signal suffered from a high background in the ICP-MS at the time of these measurements caused by previous analyses of other materials. It is therefore not shown or discussed here. Overall, the CFA signals as well as the LA-ICP-MS signals show much more high-frequency variation in this section compared to the shallow one, which is likely due to higher dust concentrations in the LGM. In the CFA data this leads to a greater quantity of individual dust particles being partly ionized in the plasma, generating sharp concentration peaks in the data. Considering the average small grain size of ∼2 ± 1 mm, impurity concentration in grain boundaries is another potential origin of the sharp signal excursions. Superimposed on this increased high-amplitude variability, the LA-ICP-MS signal exhibits distinct small-scale features. The meaning of these features and the potential interpretation in terms of layers and climate signals is evaluated in Sects. 3.3 and 3.4. Overall, the findings from these comparisons between LA-ICP-MS and CFA-ICP-MS confirm the initial assumptions that (i) there is a common signal in the LA-ICP-MS and CFA ICP-MS data and (ii) the LA-ICP-MS data contain additional information on high-frequency impurity variations in the shallow and deep core sections of the Skytrain ice core.
3.3 Layer identification
3.3.1 Spectral analysis
Based on the data comparisons between CFA- and LA-ICP-MS, the main challenge is to separate the high-frequency component of the LA-ICP-MS signal from the meaningful information on periodic impurity concentration changes on different timescales and assess their interpretation as stratification or layering. In the following, we focus on the sodium signal because it has the highest level above background and variations in amplitude.
To extract the additional information that is contained in the LA-ICP-MS signal compared to the CFA signal, we performed spectral analysis of selected depth sections. This approach has been used before to identify periodicities in ice core (CFA) data (e.g. Bigler et al., 2011). We used a multitaper method (Percival and Walden, 1993) with a Gaussian kernel smoothing in the range of the respective measurement depth resolution. To test the performance of the method, we first applied it to the shallow core section with well-known stratigraphy to investigate if the results are in line with the expected layer thicknesses based on annual-layer counting and the age model. We focused on the Na data, which are expected to show the most prominent periodic variations in the present LA-ICP-MS dataset. As discussed in Sect. 3.2, there is a striking alignment between the sodium CFA data (depth resolution 3.8 ± 0.4 cm) and the large-scale trend of the sodium LA-ICP-MS signal (see Fig. 8 left). The retrieved power spectra for the LA-ICP-MS and the CFA data are shown in Fig. 8 in the right panel. There is a clear common maximum of both spectra around a period length of 16 cm. This is in line with the expectations, the Na data show five large maxima in the 80 cm core section. Thus, the spectral analysis is capable of detecting the dominating periodicity in this section despite the limited size of the depth interval. The CFA data shows another section of enhanced power around 2–3 cm, which is below the depth resolution of the CFA system and is therefore not meaningful. The LA-ICP-MS Na data show two more sections of enhanced power, one at about ∼5 cm and one around 0.8–0.9 cm period length. Compared to the sodium signal in Fig. 6, the peak at 5 cm might be related to the potential sub-seasonal variations, for example pronounced between 83.4 and 83.6 m. The origins of the shorter periods remain unclear. They are visible in the course of the Na signal in Fig. 6 (e.g. between 83.4 and 83.5 m depth). They are small but still much larger than the average crystal grain size in this section (1.9 ± 0.6 mm) and therefore probably not affected by grain boundary influences (see Sect. 3.3.2). The results of the spectral analysis of the LA-ICP-MS sodium data therefore show the potential to reveal small-scale variations that cannot be resolved by the CFA even in this shallow core section. These results provide the basis for the analysis of the deeper sections.
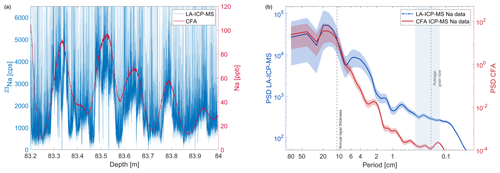
Figure 8(a) Sodium LA-ICP-MS signal of a shallow core section of the Skytrain ice core compared to the respective CFA sodium ICP-MS measurements from the same depth section. Note the striking alignment of both datasets. (b) Power spectrum of the LA-ICP-MS sodium data and the respective CFA data. The y axis is power spectral density (PSD). The average grain size and the annual-layer thickness are marked by dashed lines. The shaded grey area denotes 1 standard deviation of the grain size distribution.
3.3.2 Signal stacking
The main challenge in identifying small-scale features in the LA-ICP-MS data, which can be interpreted as layers, is to separate the signal of interest from the high-frequency components that still exist after background removal and might be influenced by, for example, grain boundary effects. This is additionally complicated by the fact that some impurity species, especially sodium, tend to concentrate in the crystal grain boundaries (e.g. Barnes and Wolff, 2004; Eichler et al., 2017; Stoll et al., 2023). When the laser ablation path crosses a grain boundary, the enhanced concentrations can cause steep excursions and peaks in the LA-ICP-MS data that could then lead to misinterpretation of grain boundaries as larger-scale features. To solve this problem and make the identification of periodic layering possible, we made the following assumption that is also discussed in Della Lunga et al. (2017): if layers are horizontally preserved in the ice core, parallel laser paths along the depth axis of a sample should exhibit common intensity features. To test this hypothesis, we performed detailed measurements on a 4.5 cm core section from 355.775–355.82 m depth (about 6.5 ka). From the age model, an annual-layer thickness of about 2.4 cm can be expected at this depth. This depth interval was chosen because the expected layer thickness is below the depth resolution of the CFA (see Fig. 9b) but still large enough to not be dominated by grain boundary effects. The average grain size in this ice core section is 3.9 ± 3.1 mm and thus large relative to the LGM (2.0 ± 1.0 mm) and the 500-year-old section (1.8 ± 0.6), but at the same time it is highly variable.
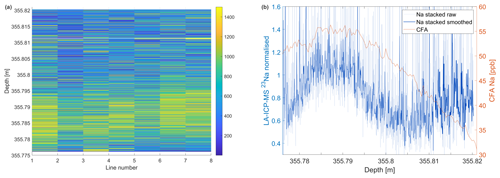
Figure 9(a) Sodium signal of eight parallel laser lines on the same sample (355.775–355.82 m) separated by 1 mm each. Common variations in signal intensity are clearly visible. (b) Stacked and normalized sodium signal of all eight lines. The dark blue line denotes the data smoothed to the calculated depth resolution.
We measured eight parallel lines with 1 mm distance between each on the same sample. Pictures of the sample before and after measurement can be found in Fig. A2. The results are shown in Fig. 9a. It is obvious that there is a common peak in intensity in all lines between about 355.78 and 355.795 m, which strongly hints towards a larger-scale layering feature. To better assess this visual identification, we normalized and stacked the signals of all eight lines (Fig. 9 right). We applied a smoothing in the range of the depth resolution of 185 µm (dark blue line). At 355.812 m there was a break in the sample, which might lead to some boundary effects in the smoothed version. A layer thickness of 2.4 cm that is assumed to be evenly spaced would mean that a 4.5 cm depth interval should encompass a little less than two cycles. The stacked signal does show one distinct peak and another rise in the average signal between 355.805 and 355.82 m. Therefore, there are indications that the observed variation of the stacked signal general trend is in the range of the expected layer thickness. We recognize that based on this short sample alone we cannot finally determine a periodicity. Nevertheless, there is a good agreement between the observed variation of the signal and the theoretical layer thickness. Superimposed on the long wavelength trend, the smoothed signal still shows high-frequency variability. These small-scale variations in the depth domain are hypothetically caused by either (i) particles that show up as sharp peaks in the ICP-MS signal or (ii) small length-scale variations related to microstructure (see discussion in Sect. 3.4.2). However, we can not provide conclusive evidence for both scenarios at this stage of the investigation. Based solely on the line data presented here, which of these possible sources is the most dominant cannot be determined. However, the strong alignment of the main LA-ICP-MS data trend with the theoretical layering shows that features of a similar wavelength to the estimated annual-layer thickness are still present at this depth of the core (about 6.5 ka) and that this layering can be revealed by the laser ablation technique.
3.4 Signal interpretation in deep ice
3.4.1 CFA comparison
In the deepest parts of the ice core, the modelled annual-layer thickness is in the millimetre range or even below. Despite the masking influences of impurities being concentrated in grain boundaries, there are studies showing that layering can still be preserved (e.g. Svensson et al., 2011). To investigate if it is still possible to identify such layered structures in the deep parts of the Skytrain ice core, provided they exist, we applied the spectral analysis method discussed in Sect. 3.3. Here we present one example. The selected section encompasses a depth of 481.1–481.56 m dating to about 26.8 ka. The resolution of the laser ablation measurements at this depth was 185 µm. Additionally, within this depth interval in a 3.5 cm section (481.101–481.136 m), three parallel lines at 1 mm distance were measured along the depth axis of one ice core sample (blue shading in Fig. 10). The stacked signals for Na, Mg and Al of these three lines are shown in Fig. 11.
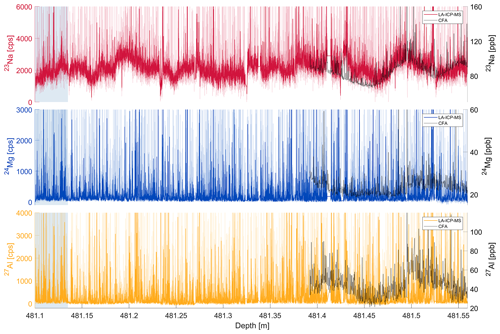
Figure 10LA-ICP-MS signals of Na, Mg and Al from a deep section (ca. 26.6 ka) of the Skytrain ice core. The high-resolution smoothed LA-ICP-MS data (coloured) is compared to the CFA ICP-MS data (black). The faintly coloured data are the unsmoothed LA-IP-MS signal. The blue shading marks the section in which three parallel lines were measured.
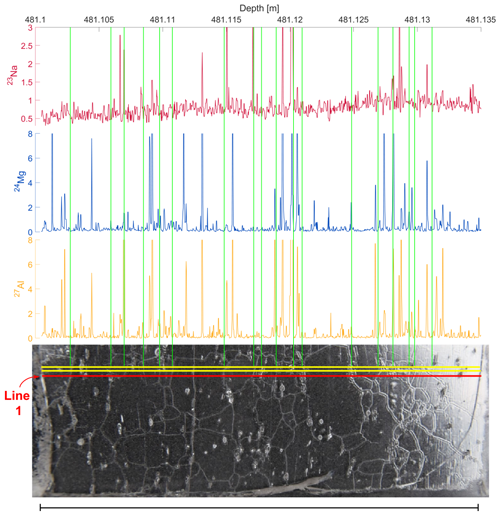
Figure 11Comparison of the optical features (grain boundaries) and one LA-ICP-MS line (red) for a 3.5 cm section from ∼26.6 ka from the Skytrain ice core. The vertical green lines mark the positions of the grain boundaries being crossed by the laser. The data were normalized to the mean, and the presentation was adjusted to fit the length of the laser traces.
The results for Na, Mg and Al of the long 46 cm profile together with the related CFA data are shown in Fig. 10. There was a gap in the CFA data at this core depth, which is the reason why it is only available for comparison from 481.4 m onwards. The annual-layer thickness from the age model in this depth is about 1.4 mm and among the smallest in the whole core but not affected by folding or disturbances like some the deeper depth intervals (Mulvaney et al., 2023).
This, together with the very small average grain size (1.9 ± 1.0 mm), was the main reason for the investigation of this particular core section. The visual comparison of the CFA data and the LA-ICP-MS data again shows agreements on the general course of the signal as expected from the discussion in Sect. 3.2. This is especially true for the Na and Al signals and much less obvious for Mg. For a close-up view of the section covered by CFA data, see Fig. B1. Similar to the section from ∼20.6 ka, the Mg and Al data show much more sharp high-frequency variations than the Na signal. Na is predominantly of marine origin and therefore mainly soluble. Aluminium is mainly of terrestrial origin, and the LA-ICP-MS signal is therefore likely to have a significant insoluble particle fraction. For the LGM we found that in the Skytrain ice core about half of the total magnesium is of non-sea-salt origin and thus terrestrial (Mulvaney et al., 2023). The soluble magnesium fraction can migrate into crystal grain boundaries (e.g. Bohleber et al., 2021). Hence, we expect the magnesium signal to show characteristics of the sodium as well as the aluminium.
3.4.2 Grain boundary influences
To investigate and constrain the influences of the grain boundaries on the measured laser signal we optically compared the picture of the core section featuring the three parallel lines to the respective LA-ICP-MS results. We identified the positions of the grain boundaries when crossed by the laser line in the picture and aligned these positions to the data. The grain boundary positions of line 1 (red) are compared to the respective data (Fig. 11). Three important observations were made in this comparison. (i) Many but not all crossings of the laser lines with visible grain boundaries produce a correlating sharp peak in the data. (ii) The signal intensity excursion (deviation from the mean) at the crossing seems to be more distinct in the Mg and Al signals than in the Na signal. (iii) There is only one case in which only the Na and not the Mg and Al signal relates to a grain boundary crossing (481.117 m). Examples for the first observation are the sections around 481.102, 481.11 and 481.118 m. In both of these parts of the sample, grain boundaries are clearly visible in the picture, but no related noticeable excursions can be observed in the data. Examples for the second observation are the grain boundaries at ∼481.106 and 481.127 m. While the Mg and Al data show distinctive sharp spikes at the exact position of the grain boundary, the Na data show no obvious signal. Together with observation (iii) this is unexpected. Many previous studies showed that Na is one of the elements most affected by migration into grain boundaries (e.g. Stoll et al., 2021; Bohleber et al., 2024). Similar observations have been made for the data–grain boundary comparison of the other two parallel lines (see Fig. B2). Nevertheless, some grain boundary crossings are represented in all three elements (e.g. at ∼481.120 m). We therefore conclude that in this particular depth section of the Skytrain ice core the impurity accumulation in grain boundaries seems to affect the Mg and Al signal more than the Na signal.
3.4.3 Spectral analysis
For a better quantification of the qualitative observations from the CFA and grain boundary comparisons, we applied the methods of spectral analysis discussed in Sect. 3.3 to the signals of all elements from the whole 45 cm section and the stacked sodium signal from the 3.5 cm subsection (Fig. 12). The sodium data of the long profile (Fig. 12a, red) show four sections of enhanced power: the first around 7–8 cm period length, the second around ∼3 cm, and two between about 0.5 and 1.5 cm period length. For smaller wavelengths, the spectral power first plateaus in the range of the average grain size and then shows a steep decline below 1 mm. The first 7–8 cm maximum agrees with the large-scale trend of the CFA data (Fig. 10). The second around 3 cm is quite distinct and also visible as variations in the data to the naked eye. The modelled annual-layer thickness in this depth section is about 1.4 mm which lies within the range of the average grain size. We do therefore not a priori expect to be able to reveal annual layering. However, the power spectral density (PSD) enhancements at ∼0.5, 1.0 and about 3 cm are well above the grain sizes and thus could hint to the preservation of decadal to centennial signals. The PSDs of the Mg and Al data show similar trends. Compared to the Na data, their spectra are generally flatter, which indicates a higher level of noise. This supports the qualitative observations (Fig. 10). Aluminium (soluble and insoluble) mainly originates from continental dust, and concentrations show large variability during the last glacial (e.g. Traversi et al., 2004) in general. The Al spectrum has a first maximum around 10 cm period length that connects to the larger variations visible in the CFA data. There are several smaller enhancements between 1 and 6 cm period length, and again a plateau in the range of the grain size is followed by a steep decline below 1 mm period length. The interpretation of the 1–6 cm variations is difficult. There are two maxima at about 1 and 3 cm that seem to coincide with the Na data, but they are not significant compared to the other peaks. However, the CFA data of Na and Al show a common variation in this depth section; therefore, this could be interpreted as common periodic variations in both Na and Al concentrations.
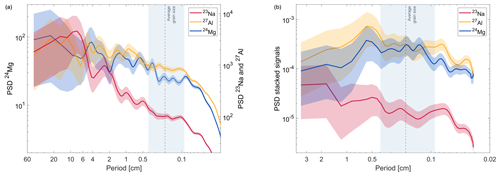
Figure 12Power spectra of the LA-ICP-MS data for a 45 cm long section of the Skytrain ice core from ∼26.8 ka (a) and three stacked lines from a 3.5 cm subsection (b). The average grain size is marked by a dashed line. The grey shaded area denotes 1 standard deviation of the grain size distribution.
The PSD of the Mg data would initially be expected to show common features with the Na data because a significant amount of Mg is of marine origin (Curran et al., 1998). However, the spectra show many differences and in some sections even opposed trends. The Mg PSD for example has an enhancement around 5 cm period length which correlates with a minimum in the Na PSD. Overall, the Mg spectrum shows more similarities to the Al spectrum. This could indicate that in this depth section, opposed to the mean of the Skytrain ice core (Grieman et al., 2021), the magnesium is dominated rather by a continental than a marine source. The similarities of the Mg to the Al spectrum also reflect the common features observed in the grain boundary analysis (see Sect. 3.4.2). We therefore conclude that the sodium in this particular section and based on a limited dataset is only mildly affected by grain boundary effects. Mg and Al are evidently influenced by dust. Based on these findings we argue that Na is the most promising to investigate periodic concentration changes.
To further investigate the significance of the variations in the sodium data, we compared the PSD of the long profile to the short 3.5 cm section in which the stacked signal of three parallel lines is available (Fig. 12b). We recognize that 3.5 cm is a small depth interval for spectral analysis, but the depth resolution of 185 µm is still high enough to enable detection of periodicities within this length. Some common features in all three spectra, which could not be revealed by the long profile, stand out. Around 0.5 cm period length all three spectra show a common maximum, which is a feature that is also present in the long-profile sodium record. This is a confirmation of the finding from the long-profile sodium record and therefore a hint that periodic signals at least on the decadal scale are preserved in this depth section of the core. There is another enhancement in the power of all three species around ∼0.8–0.9 mm, which is on the lower end of the grain size distribution. As opposed to the smaller variations within the range of the grain sizes that only show up in the Mg and Al PSDs and are thus probably caused by grain boundary effects, this feature is again shared by all three species. This could be an indication for another periodic variation, possibly in the range of the modelled layer thickness. However, this finding remains speculative because of the limited amount of data. In conclusion, this initial analysis looks promising and shows that the LA-ICP-MS measurements are capable of revealing periodic variations and thus layered structures at depths of the Skytrain ice core where conventional methods fail.
A method for LA-ICP-MS measurements of glacier ice samples was successfully developed at the Department of Earth Sciences of Cambridge University. The system can reliably operate with a spatial resolution as low as 80 µm on ice samples. In the current setup, 23Na, 24Mg, 27Al and 43Ca were analysed simultaneously. The signal strength of 23Na, 24Mg and 27Al proved to be well above the instrumental background for most samples. The calcium signal, however, was obscured by a high background caused by other geological analyses for most measurements. The LA-ICP-MS method was used to analyse the Skytrain ice core from West Antarctica. It was found that the longer trends on the 5–15 cm scale of the LA-ICP-MS signals correlate well with the lower-resolution CFA data at shallow depths and in deep ice. This proves that the method is capable of producing real, stable and reproducible signals. Spectral analysis of the high-resolution LA-ICP-MS sodium data was combined with optical grain size and boundary investigations to analyse to what extent periodic variations in the impurity concentrations are preserved beyond the resolution capabilities of the CFA. In an ice core section from about 26.8 ka we found significant wavelengths and periodicities around 5 mm that hint towards a preservation of layered structures on a potentially decadal scale. These wavelengths are longer than the range of the crystal grain sizes at this depth and are thus likely unaffected by impurity accumulation at grain boundaries. This is also an important finding for oldest-ice projects like “Beyond EPICA”, where a reliable analysis of the deep-ice structures is crucial for meaningful climate-related interpretation. Nevertheless, the frequency analysis cannot be used to identify horizontal layering without other information. The spectral data must be evaluated regarding the mean and width of the crystal grain size distribution in the respective core section. This needs to be complemented by at least exemplary investigations of the grain boundary effects on the impurity concentration in the respective core sections (see Sect. 3.4.2). Additional information about the expected layer thickness and the composition of the measured species regarding particulate and soluble fractions is helpful to analyse the retrieved power spectra. It was found that signal stacking of parallel laser lines on the same sample is a powerful tool to reduce noise and better extract meaningful variations in the frequency analysis. It is therefore highly recommended that at least two or more parallel measurements of each ice sample are performed in the future. However, because of the time-consuming laser scans, this will reduce the overall length of core sections that can be analysed in one measurement session. Extensive measurements of parallel lines on one 5 cm sample could hereby also help to interpret the signals of single lines from adjacent depth intervals. Overall, interpretation of the high-frequency LA-ICP-MS signal components remains challenging. However, we conclude that layered structures on at least a decadal scale in sodium are preserved in the Skytrain ice core to an age of at least 26.8 ka. These findings have the potential to open a new field of possibilities for climate data interpretation with respect to fast changes based on high-resolution LA-ICP-MS data in the future.
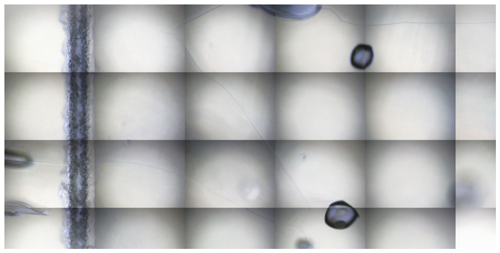
Figure A1A 2 mm×3.8 mm mosaic sample surface picture of the onboard camera of the Cambridge laser system. The 150 µm wide laser path is clearly visible on the left (vertical line) along with air bubbles and grain boundaries. The ablation settings were as follows: scanning speed of 50 µm s−1, laser fluence of 6.7 J cm−2, repetition rate of 120 Hz and spot size of 150 µm round.

Figure A2(a) Picture of a section of the Skytrain ice core from 355.775–355.82 depth prior to LA analysis. The scale is in centimetres. (b) The same section as on the left after LA analysis. The ablation paths of eight parallel lines are visible. The blurred lines are a result of sublimation during analysis and warming mostly after analysis.
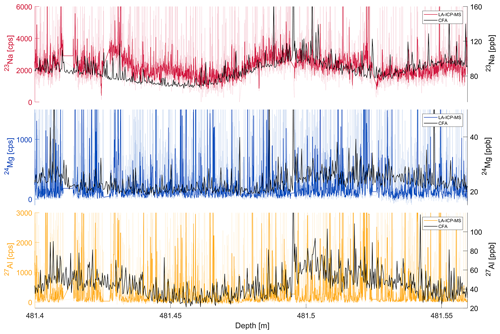
Figure B1LA-ICP-MS signals of Na, Mg and Al from a deep section (ca. 26.6 ka) of the Skytrain ice core. The high-resolution smoothed LA-ICP-MS data (coloured) are compared to the CFA ICP-MS data (black). The faintly coloured lines are the unsmoothed LA-IP-MS signal.
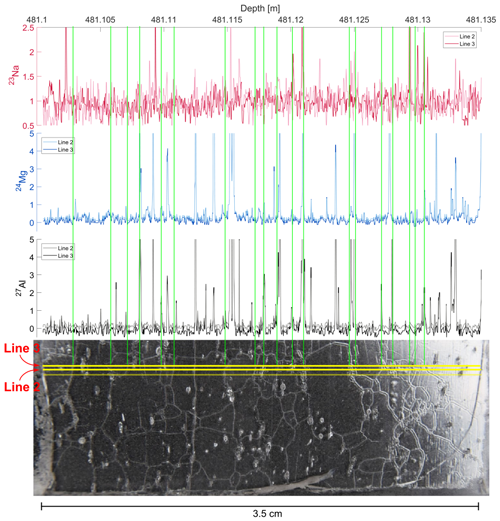
Figure B2Comparison of the optical features (grain boundaries) and two normalized LA-ICP-MS lines for a 3.5 cm section from ∼26.6 ka from the Skytrain ice core. The yellow lines in the sample picture (bottom) denote the analysed laser paths. The vertical green lines mark the positions of the grain boundaries being crossed by the laser. The data were normalized to the mean, and the presentation was adjusted to fit the length of the laser traces.
No extensive software to be used by others was produced within this study. The basic MATLAB scripts used for data analysis are available from the corresponding author upon request.
The datasets presented within this pilot study are incomplete and preliminary. A presentation of the whole Skytrain ice core LA-ICP-MS dataset is planned for the future, and a related publication at the PANGEA repository is anticipated.
The paper was written by HHo, with contributions from RHR, EW and MG. The ice core was drilled and sectioned by EW, RM, CNA, MG and IR. The CFA analysis was performed by HHo, MG, JH, RM, RHR and IR. The laser ablation measurements were performed by HHo and JD. SG provided expertise on the laser ablation measurement technique. All authors contributed to improving the final paper.
The contact author has declared that none of the authors has any competing interests.
Publisher's note: Copernicus Publications remains neutral with regard to jurisdictional claims made in the text, published maps, institutional affiliations, or any other geographical representation in this paper. While Copernicus Publications makes every effort to include appropriate place names, the final responsibility lies with the authors.
The authors thank Liz Thomas for providing access to the BAS ice lab facilities and general support of the project. The authors also thank Shaun Miller, Emily Ludlow and Victoria Alcock for help with cutting and processing the ice core and Charlie Durman for ice core preparation for the CFA analysis.
This research has been supported by the H2020 programme of the European Research Council (grant no. 742224). Eric Wolff and Helene Hoffmann have also been funded for part of this work through a Royal Society Professorship (grant no. RP/R/180003).
This open-access publication was funded by the Open Access Publication Fund of the University of Tübingen.
This paper was edited by Joel Savarino and reviewed by two anonymous referees.
Barnes, P. R. and Wolff, E. W.: Distribution of soluble impurities in cold glacial ice, J. Glaciol., 50, 311–324, https://doi.org/10.3189/172756504781829918, 2004. a
Bigler, M., Svensson, A., Kettner, E., Vallelonga, P., Nielsen, M. E., and Steffensen, J. P.: Optimization of high-resolution continuous flow analysis for transient climate signals in ice cores, Environ. Sci. Technol., 45, 4483–4489, https://doi.org/10.1021/es200118j, 2011. a, b, c
Bohleber, P., Roman, M., Šala, M., and Barbante, C.: Imaging the impurity distribution in glacier ice cores with LA-ICP-MS, J. Anal. Atom. Spectrom., 35, 2204–2212, https://doi.org/10.1039/D0JA00170H, 2020. a, b
Bohleber, P., Roman, M., Šala, M., Delmonte, B., Stenni, B., and Barbante, C.: Two-dimensional impurity imaging in deep Antarctic ice cores: snapshots of three climatic periods and implications for high-resolution signal interpretation, The Cryosphere, 15, 3523–3538, https://doi.org/10.5194/tc-15-3523-2021, 2021. a
Bohleber, P., Larkman, P., Stoll, N., Clases, D., Gonzalez de Vega, R., Šala, M., Roman, M., and Barbante, C.: Quantitative Insights on Impurities in Ice Cores at the Micro-Scale From Calibrated LA-ICP-MS Imaging, Geochem. Geophy. Geosy., 25, e2023GC011425, https://doi.org/10.1029/2023GC011425, 2024. a, b
Brook, E. J., Buizert, C., Higgins, J. A., Koutnik, M. R., Neff, P. D., Marks Peterson, J., Pettit, E. C., Rahilly, K. E., Roop, H. A., Whittaker, D., and Severinghaus, J. P.: The Center for Oldest Ice Exploration (COLDEX): Science plans and opportunities for community involvement, in: AGU Fall Meeting Abstracts, vol. 2022, 12–16 December 2022, Chicago, Illinois, USA, C36B–05, 2022AGUFM.C36B..05B, 2022. a
Cole-Dai, J., Budner, D. M., and Ferris, D. G.: High speed, high resolution, and continuous chemical analysis of ice cores using a melter and ion chromatography, Environ. Sci. Technol., 40, 6764–6769, https://doi.org/10.1021/es061188a, 2006. a
Curran, M. A., Van Ommen, T. D., and Morgan, V.: Seasonal characteristics of the major ions in the high-accumulation Dome Summit South ice core, Law Dome, Antarctica, Ann. Glaciol., 27, 385–390, https://doi.org/10.3189/1998AoG27-1-385-390, 1998. a
Della Lunga, D., Müller, W., Rasmussen, S., and Svensson, A.: Location of cation impurities in NGRIP deep ice revealed by cryo-cell UV-laser-ablation ICPMS, J. Glaciol., 60, 970–988, https://doi.org/10.3189/2014JoG13J199, 2014. a
Della Lunga, D., Müller, W., Rasmussen, S. O., Svensson, A., and Vallelonga, P.: Calibrated cryo-cell UV-LA-ICPMS elemental concentrations from the NGRIP ice core reveal abrupt, sub-annual variability in dust across the GI-21.2 interstadial period, The Cryosphere, 11, 1297–1309, https://doi.org/10.5194/tc-11-1297-2017, 2017. a, b, c
Douglas, D. N., Managh, A. J., Reid, H. J., and Sharp, B. L.: High-Speed, Integrated Ablation Cell and Dual Concentric Injector Plasma Torch for Laser Ablation-Inductively Coupled Plasma Mass Spectrometry, Anal. Chem., 87, 11285–11294, https://doi.org/10.1021/acs.analchem.5b02466, 2015. a, b
Eichler, J., Kleitz, I., Bayer-Giraldi, M., Jansen, D., Kipfstuhl, S., Shigeyama, W., Weikusat, C., and Weikusat, I.: Location and distribution of micro-inclusions in the EDML and NEEM ice cores using optical microscopy and in situ Raman spectroscopy, The Cryosphere, 11, 1075–1090, https://doi.org/10.5194/tc-11-1075-2017, 2017. a
ERC: WArm Climate Stability of the West Antarctic ice sheet in the last INterglacial (WACSWAIN), https://cordis.europa.eu/project/id/742224 (last access: July 2024), 2017. a
Faria, S. H., Freitag, J., and Kipfstuhl, S.: Polar ice structure and the integrity of ice-core paleoclimate records, Quaternary Sci. Rev., 29, 338–351, 2010. a
Grieman, M. M., Hoffmann, H. M., Humby, J. D., Mulvaney, R., Nehrbass-Ahles, C., Rix, J., Thomas, E. R., Tuckwell, R., and Wolff, E. W.: Continuous flow analysis methods for sodium, magnesium and calcium detection in the Skytrain ice core, J. Glaciol., 68, 90–100, https://doi.org/10.1017/jog.2021.75, 2021. a, b, c, d, e
Halde, R.: Concentration of impurities by progressive freezing, Water Res., 14, 575–580, https://doi.org/10.1016/0043-1354(80)90115-3, 1980. a
Hoffmann, H., Preunkert, S., Legrand, M., Leinfelder, D., Bohleber, P., Friedrich, R., and Wagenbach, D.: A New Sample Preparation System for Micro-14C Dating of Glacier Ice with a First Application to a High Alpine Ice Core from Colle Gnifetti (Switzerland), Radiocarbon, 60, 517–533, https://doi.org/10.1017/RDC.2017.99, 2018. a
Hoffmann, H. M., Grieman, M. M., King, A. C. F., Epifanio, J. A., Martin, K., Vladimirova, D., Pryer, H. V., Doyle, E., Schmidt, A., Humby, J. D., Rowell, I. F., Nehrbass-Ahles, C., Thomas, E. R., Mulvaney, R., and Wolff, E. W.: The ST22 chronology for the Skytrain Ice Rise ice core – Part 1: A stratigraphic chronology of the last 2000 years, Clim. Past, 18, 1831–1847, https://doi.org/10.5194/cp-18-1831-2022, 2022. a, b, c, d, e, f, g
Jackson, C. G. and Gibson, S. A.: Preservation of systematic Ni and Cr heterogeneity in otherwise homogeneous mantle olivine: Implications for timescales of post-metasomatism re-equilibration, Lithos, 318–319, 448–463, https://doi.org/10.1016/j.lithos.2018.08.026, 2018. a
Jerše, A., Mervič, K., van Elteren, J. T., Šelih, V. S., and Šala, M.: Quantification anomalies in single pulse LA-ICP-MS analysis associated with laser fluence and beam size, Analyst, 147, 5293–5299, https://doi.org/10.1039/D2AN01172G, 2022. a
Jochum, K. P., Weis, U., Stoll, B., Kuzmin, D., Yang, Q., Raczek, I., Jacob, D. E., Stracke, A., Birbaum, K., Frick, D. A., Günther, D., and Enzweiler, J.: Determination of Reference Values for NIST SRM 610–617 Glasses Following ISO Guidelines, Geostand. Geoanal. Res., 35, 397–429, https://doi.org/10.1111/j.1751-908X.2011.00120.x, 2011. a
Legrand, M. and Mayewski, P.: Glaciochemistry of polar ice cores: a review, Rev. Geophys., 35, 219–243, https://doi.org/10.1029/96RG03527, 1997. a
Littot, G. C., Mulvaney, R., Röthlisberger, R., Udisti, R., Wolff, E. W., Castellano, E., De Angelis, M., Hansson, M. E., Sommer, S., and Steffensen, J. P.: Comparison of analytical methods used for measuring major ions in the EPICA Dome C (Antarctica) ice core, Ann. Glaciol., 35, 299–305, https://doi.org/10.3189/172756402781817022, 2002. a
McConnell, J. R., Lamorey, G. W., Lambert, S. W., and Taylor, K. C.: Continuous ice-core chemical analyses using inductively coupled plasma mass spectrometry, Environ. Sci. Technol., 36, 7–11, https://doi.org/10.1021/es011088z, 2002. a
Müller, W., Shelley, J. M. G., and Rasmussen, S. O.: Direct chemical analysis of frozen ice cores by UV-laser ablation ICPMS, J. Anal. Atom. Spectrom., 26, 2391–2395, https://doi.org/10.1039/C1JA10242G, 2011. a
Mulvaney, R., Rix, J., Polfrey, S., Grieman, M., Martin, C., Nehrbass-Ahles, C., Rowell, I., Tuckwell, R., and Wolff, E.: Ice drilling on Skytrain Ice Rise and Sherman Island, Antarctica, Ann. Glaciol., 62, 311–323, https://doi.org/10.1017/aog.2021.7, 2021. a, b, c
Mulvaney, R., Wolff, E. W., Grieman, M. M., Hoffmann, H. H., Humby, J. D., Nehrbass-Ahles, C., Rhodes, R. H., Rowell, I. F., Parrenin, F., Schmidely, L., Fischer, H., Stocker, T. F., Christl, M., Muscheler, R., Landais, A., and Prié, F.: The ST22 chronology for the Skytrain Ice Rise ice core – Part 2: An age model to the last interglacial and disturbed deep stratigraphy, Clim. Past, 19, 851–864, https://doi.org/10.5194/cp-19-851-2023, 2023. a, b, c, d, e, f
Parrenin, F., Cavitte, M. G. P., Blankenship, D. D., Chappellaz, J., Fischer, H., Gagliardini, O., Masson-Delmotte, V., Passalacqua, O., Ritz, C., Roberts, J., Siegert, M. J., and Young, D. A.: Is there 1.5-million-year-old ice near Dome C, Antarctica?, The Cryosphere, 11, 2427–2437, https://doi.org/10.5194/tc-11-2427-2017, 2017. a
Percival, D. B. and Walden, A. T.: Spectral Analysis for Physical Applications, Cambridge University Press, ISBN 9780521435413, 1993. a
Reinhardt, H., Kriews, M., Miller, H., Lüdke, C., Hoffmann, E., and Skole, J.: Application of LA–ICP–MS in polar ice core studies, Anal. Bioanal. Chem., 375, 1265–1275, https://doi.org/10.1007/s00216-003-1793-5, 2003. a
Röthlisberger, R., Bigler, M., Hutterli, M., Sommer, S., Stauffer, B., Junghans, H. G., and Wagenbach, D.: Technique for Continuous High-Resolution Analysis of Trace Substances in Firn and Ice Cores, Environ. Sci. Technol., 34, 338–342, https://doi.org/10.1021/es9907055, 2000. a
Shafique, U., Anwar, J., Zaman, W., Rehman, R., Salman, M., Dar, A., and Jamil, N.: Forced migration of soluble and suspended materials by freezing front in aqueous systems, J. Hydro-Environ. Res., 6, 221–226, https://doi.org/10.1016/j.jher.2011.10.001, 2012. a
Sigl, M., Fudge, T. J., Winstrup, M., Cole-Dai, J., Ferris, D., McConnell, J. R., Taylor, K. C., Welten, K. C., Woodruff, T. E., Adolphi, F., Bisiaux, M., Brook, E. J., Buizert, C., Caffee, M. W., Dunbar, N. W., Edwards, R., Geng, L., Iverson, N., Koffman, B., Layman, L., Maselli, O. J., McGwire, K., Muscheler, R., Nishiizumi, K., Pasteris, D. R., Rhodes, R. H., and Sowers, T. A.: The WAIS Divide deep ice core WD2014 chronology – Part 2: Annual-layer counting (0–31 ka BP), Clim. Past, 12, 769–786, https://doi.org/10.5194/cp-12-769-2016, 2016. a
Sneed, S. B., Mayewski, P. A., Sayre, W., Handley, M. J., Kurbatov, A. V., Taylor, K. C., Bohleber, P., Wagenbach, D., Erhardt, T., and Spaulding, N. E.: New LA-ICP-MS cryocell and calibration technique for sub-millimeter analysis of ice cores, J. Glaciol., 61, 233–242, https://doi.org/10.3189/2015JoG14J139, 2015. a, b, c, d
Spaulding, N. E., Sneed, S. B., Handley, M. J., Bohleber, P., Kurbatov, A. V., Pearce, N. J., Erhardt, T., and Mayewski, P. A.: A New Multielement Method for LA-ICP-MS Data Acquisition from Glacier Ice Cores, Environ. Sci. Technol., 51, 13282–13287, https://doi.org/10.1021/acs.est.7b03950, 2017. a, b
Stoll, N., Eichler, J., Hörhold, M., Shigeyama, W., and Weikusat, I.: A Review of the Microstructural Location of Impurities in Polar Ice and Their Impacts on Deformation, Front. Earth Sci., 8, 615613, https://doi.org/10.3389/feart.2020.615613, 2021. a
Stoll, N., Bohleber, P., Dallmayr, R., Wilhelms, F., Barbante, C., and Weikusat, I.: The new frontier of microstructural impurity research in polar ice, Ann. Glaciol., 64, 63–66, https://doi.org/10.1017/aog.2023.61, 2023. a
Svensson, A., Bigler, M., Kettner, E., Dahl-Jensen, D., Johnsen, S., Kipfstuhl, S., Nielsen, M., and Steffensen, J. P.: Annual layering in the NGRIP ice core during the Eemian, Clim. Past, 7, 1427–1437, https://doi.org/10.5194/cp-7-1427-2011, 2011. a
Traversi, R., Barbante, C., Gaspari, V., Fattori, I., Largiuni, O., Magaldi, L., and Udisti, R.: Aluminium and iron record for the last 28 kyr derived from the Antarctic EDC96 ice core using new CFA methods, Ann. Glaciol., 39, 300–306, https://doi.org/10.3189/172756404781814438, 2004. a
USGS: USGS overview LIMA maps, https://lima.usgs.gov/documents/LIMA_overview_map.pdf (last access: December 2023), 2022. a
- Abstract
- Introduction
- Methods
- Results and discussion
- Conclusions
- Appendix A: Sample pictures
- Appendix B: Additional LA-ICP-MS data
- Appendix C: Average grain sizes
- Code availability
- Data availability
- Author contributions
- Competing interests
- Disclaimer
- Acknowledgements
- Financial support
- Review statement
- References


