the Creative Commons Attribution 4.0 License.
the Creative Commons Attribution 4.0 License.
 | 18 Oct 2024
The cryostratigraphy of thermo-erosion gullies in the Canadian High Arctic demonstrates the resilience of permafrost
Daniel Fortier
Étienne Godin
Audrey Veillette
Thermo-erosion gullies (TEGs) are one of the most common forms of abrupt permafrost degradation. They generally form in ice-wedge polygonal networks where the interconnected troughs can channel runoff water. Although TEGs can form within a single thawing season, it takes them several decades to stabilize completely. While the inception of TEGs has been examined in several studies, the processes of their stabilization remain poorly documented, especially the cryostructures that form following permafrost aggradation in stabilizing TEGs. For this study, we investigated the impacts of two TEGs in the Canadian High Arctic (Bylot Island, NU, Canada) on ground ice content, cryostratigraphic patterns, and geomorphology to examine permafrost recovery following thermal erosion in ice-wedge polygonal tundra. We sampled 17 permafrost cores from two TEGs – one still active (since 1999) and one stabilized (> 100 years old) – to describe the surface conditions, interpret the cryostratigraphic patterns, and characterize the state of permafrost after TEG stabilization. Although the TEG caused discernable cryostratigraphic patterns in permafrost, ground ice content and thaw front depth in the TEGs were comparable to measurements made in undisturbed conditions. We also noted that, once stabilized, TEGs permanently (at the Anthropocene scale) alter landscape morphology and hydrological connectivity. We concluded that, although the formation of a TEG has profound effects in the short and medium term (years to decades) and leaves near-permanent geomorphological and hydrological scars in periglacial landscapes, in the long term (decades to centuries), High Arctic permafrost can recover and return to geocryological conditions similar to those pre-dating the initial disturbance. This suggests that, in stable environmental conditions undergoing natural variability, permafrost can persist longer than the geomorphological landforms in which it forms.
- Article
(12282 KB) - Full-text XML
-
Supplement
(451 KB) - BibTeX
- EndNote


Thermal erosion with the formation of thermo-erosion gullies (TEGs) is one of the most common forms of abrupt permafrost degradation (Abbott et al., 2015; Kokelj and Jorgenson, 2013; Olefeldt et al., 2016; Turetsky et al., 2020). Thermal erosion, which is defined as the erosion of ice-rich permafrost by the combined thermal and mechanical action of moving water (Goudie, 2004), often occurs in ice-wedge polygonal networks due to the interconnected troughs that can channel runoff water (i.e. snowmelt, summer precipitations, melting of ground ice) along ice wedges (Fortier et al., 2007; French, 2017; Godin and Fortier, 2012b). TEGs in polygonal networks are initiated by the infiltration of runoff water (e.g. snowmelt, rainfall) into open cracks and cavities in the active layer and can develop over a single thawing season (e.g. Fortier et al., 2007). Over time, TEGs can merge and form extensive gully systems which can eventually turn into thermo-erosion valleys (Are et al., 1979; Fortier et al., 2007; French, 2017; Gagnon and Allard, 2019; Godin and Fortier, 2012b; Morgenstern et al., 2021). Although the formation of TEGs can significantly affect permafrost environments by altering landscape morphology, runoff hydrology, and ecosystem functions (Bowden et al., 2008; Grosse et al., 2005, 2006; Lacelle et al., 2010; Lantz and Kokelj, 2008; Levy et al., 2008; Liljedahl et al., 2007; Morgenstern et al., 2021; Toniolo et al., 2009), TEGs are an integral part of landscape evolution in areas of continuous permafrost (Godin et al., 2014). However, the processes of stabilization of TEGs in polygonal networks remain poorly documented, especially the ground ice patterns that form following permafrost aggradation in stabilizing TEGs.
Ice-wedge polygons are among the most widespread landforms in permafrost environments (French, 2017). They occupy about 3 % of the Arctic landmass (Minke et al., 2009) and are the result of ground thermal contraction cracking leading to the formation of ice wedges and ridges (Lachenbruch, 1962; Fortier and Allard, 2005; Sarrazin and Allard, 2015; O'Neill and Christiansen, 2018; Matsuoka et al., 2018). Tundra polygons can range from several metres to a few decametres (Ulrich et al., 2011) and are separated by depressions, i.e. troughs, where the ice wedges form (French, 2017). They can be categorized into two main types based on their relief (Black, 1982; Lara et al., 2015; French, 2017): low-centred polygons, which have raised rims and wet, depressed centres where water can accumulate, and high-centred polygons, which have elevated centres relative to their surroundings. Flat-centred polygons can also form during the initial phase of ice-wedge development or as an intermediary stage between low- and high-centred polygons (Jones et al., 2023; Tanguy et al., 2023). Low-centred polygons commonly form in poorly drained areas of continuous permafrost and can evolve into flat- or high-centred polygons when there is an improvement in drainage resulting in stream incision in the troughs and the preferential melt of wedge ice (Mackay, 2000; French, 2017). A transition in the type of polygon can therefore be indicative of changes in surface conditions (Liljedahl et al., 2016; Gagnon and Allard, 2019). While changes in polygon relief and vegetation following a disturbance have been documented (Lara et al., 2015; Perreault et al., 2016; Godin et al., 2016), the effects on ground ice content and cryostratigraphy are unknown.
Cryostratigraphy, which is the study of layering within permafrost, can provide valuable information on the conditions of permafrost formation and its potential response to warming and thawing based on the amount, distribution, and nature of ground ice within sediment or bedrock (Murton, 2013; Gilbert et al., 2016). Cryostructures, i.e. structures that describe the shape, amount, and proportions of ice, sediment, or rock within frozen ground, are the building blocks of cryostratigraphy and can be used to infer ground thermal and hydrological conditions at the time of their formation (French and Shur, 2010; Murton, 2013). For this reason, cryostructures have been investigated in different environments, such as coastlands (Burn, 1997; Murton and French, 1994), yedoma and drained thermokarst lake basins (Jongejans et al., 2018; Kanevskiy et al., 2011), and lacustrine lowlands (Kanevskiy et al., 2014), and to study buried glacier ice (Coulombe et al., 2019). Such characterization has yet to be done in TEGs. This would help understand and predict the response of permafrost to thermal erosion, i.e. its resilience, which we define as the capacity of permafrost to maintain ground temperatures below 0 °C and similar ground ice contents and morphologies, and to recover to such a state following a disturbance and the associated perturbations (Chapin et al., 2009; Phillips, 2009; Jorgenson et al., 2010; Thoms et al., 2018; Piégay et al., 2020).
For this study, we investigated the geocryological and geomorphological processes of permafrost recovery following thermal erosion in ice-wedge polygonal tundra. More specifically, this study aimed to (1) characterize the cryostructures and cryostratigraphic patterns of two TEGs in polygonal tundra, (2) determine the impacts of thermal erosion on the ground ice content and surface characteristics of the two TEGs and compare them with undisturbed surrounding polygons, (3) describe the stages of TEG stabilization based on changes in surface geomorphology and permafrost cryostratigraphy, and (4) evaluate the stability and resilience of permafrost after thermal erosion based on ground ice content and cryostratigraphic patterns. To our knowledge, this study is the first to report ground ice contents and cryostratigraphic data in TEGs, which were used to discuss the evolution of periglacial landscapes following thermal erosion in areas with cold ice-rich permafrost.
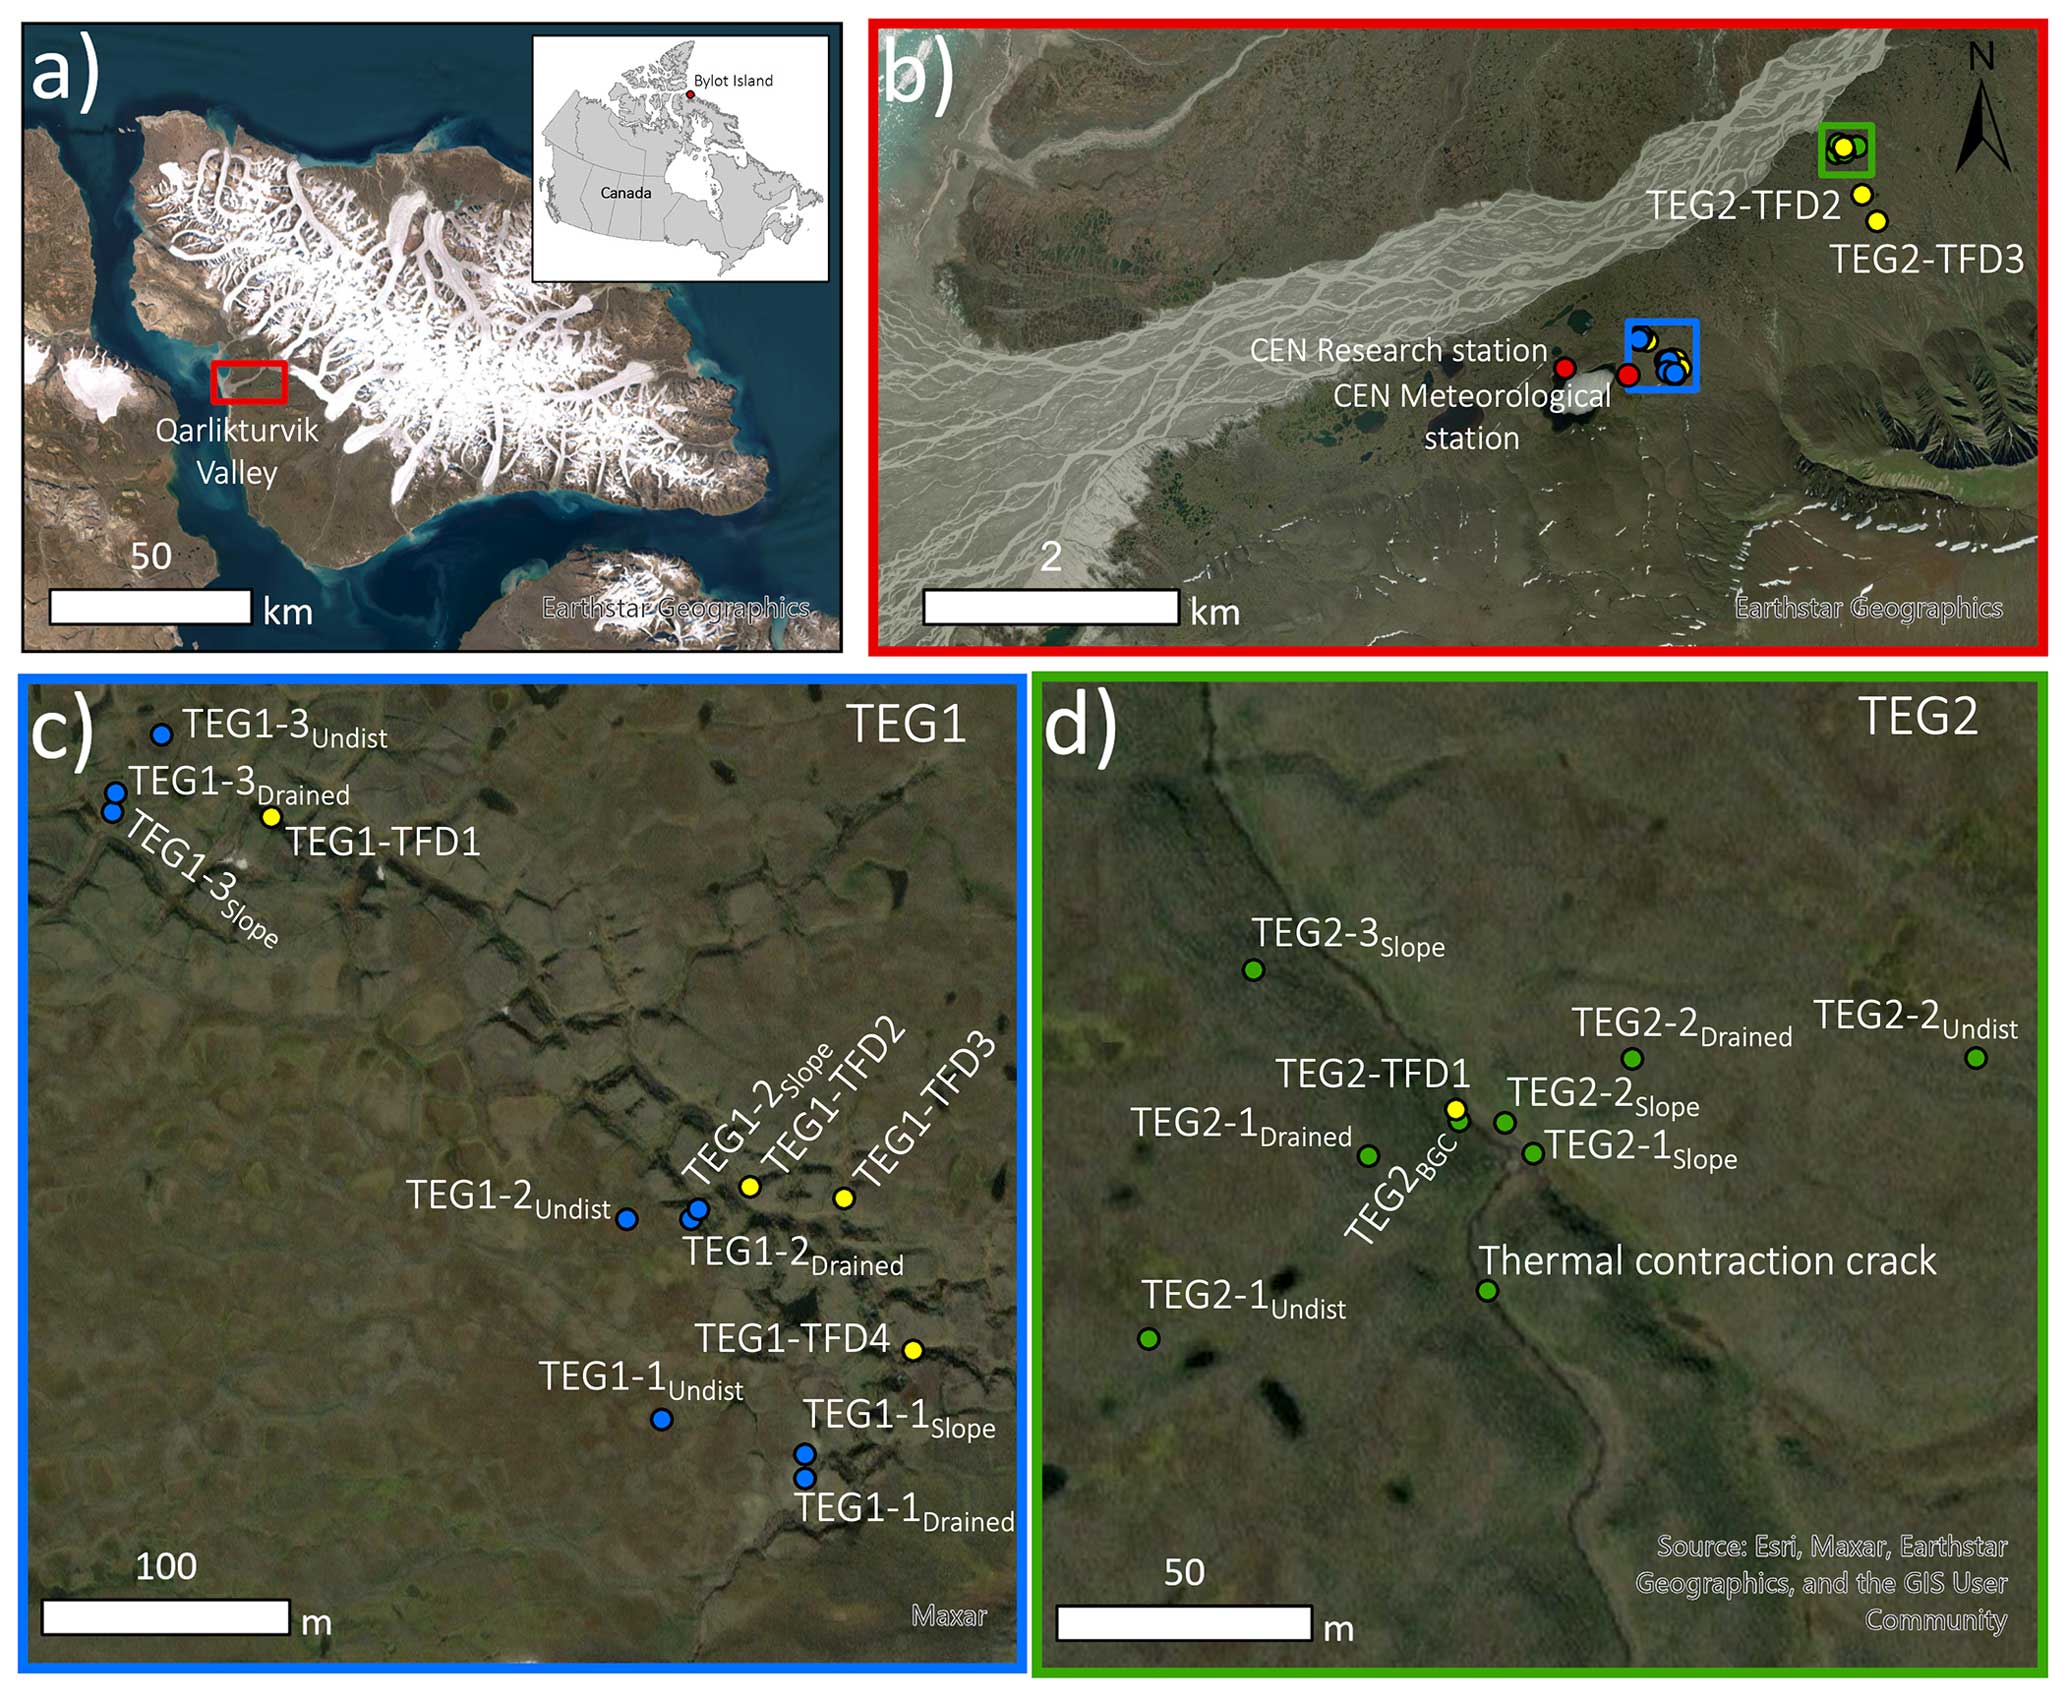
Figure 1(a) Bylot Island (NU, Canada) with the Qarlikturvik Valley in red. (b) The Qarlikturvik Valley with TEG1 in blue and TEG2 in green. The Centre for Northern Studies (CEN) research and meteorological stations are indicated with red dots. (c) For TEG1, the cores are indicated by blue dots. (d) For TEG2, the cores are indicated by green dots. For both TEGs, thaw front depth (TFD) transects are indicated with yellow dots (centre of the transect). TEG2-TFD2 and TEG2-TFD3 are shown in panel (b), upstream of the cores. Sources: Esri ArcGIS Pro World Imagery basemap, Earthstar Geographics (15 m resolution; top images), Maxar (30 cm resolution; bottom images), and the GIS User Community.
The two TEGs studied for this research are located in the Qarlikturvik Valley on the southwestern plain of Bylot Island, Nunavut (Canada) (Fig. 1). We selected Bylot Island for its cold ice-rich permafrost, the abundance of TEGs developed in ice-wedge polygons in the Qarlikturvik Valley, and the availability of meteorological and ground temperature data in the area. The ∼ 17 km long glacial valley is oriented ENE–WSW with a floor about 4–5 km wide. Two glaciers (C-79 and C-93) at the valley head feed a proglacial river that runs through braided channels in an outwash plain (Inland Waters Branch, 1969). The plain is bordered on both sides by terraces composed of over 4 to 5 m of organic-rich silty aeolian deposits and, in some areas, alluvial gravelly silty sands, overlying glaciofluvial deposits (Allard, 1996; Fortier et al., 2006). Well-developed networks of low-centred ice-wedge polygons that have formed syngenetically during the Late Holocene, along with thaw ponds, tundra lakes, and pingos, cover the terraces (Fortier and Allard, 2004).
The region has a High Arctic climate and is underlain by continuous permafrost estimated to be more than 400 m in thickness in some areas (Maxwell, 1980; Smith and Burgess, 2002). Mean annual ground temperature recorded by a thermistor cable in a borehole in an undisturbed low-centred polygon about 2 km west of the study area (BYLOTPD; Allard et al., 2024) was −10.8 °C at a depth of 3 m for the 2011–2020 period (missing 2013). Based on meteorological data recorded by a station (73°9′21.6′′ N, 79°57′24.8′′ W; 12 m a.s.l.) near the Centre for Northern Studies (CEN) research station on Bylot Island (Fig. 1), the mean annual air temperature was −14.6 °C for the 1995–2018 period (missing 1997, 1998, 2009, 2010, and 2014) (Centre d'études nordiques, 2022). At the Mittimatalik (Pond Inlet) Airport meteorological station (72°41′ N, 77°58′ W; 61.6 m a.s.l.), which is about 85 km southwest of the study area, the mean annual air temperature was −13.7 °C for the 1991–2020 period (Environment and Climate Change Canada, 2024). For the same period, the station recorded a mean annual precipitation of 195 mm, 38 % of which fell as rain between June and November. Surface vegetation in the valley floor is mainly composed of sedges, grasses, and mosses typical of wetlands and environments with a high water table (Perreault et al., 2016).
Thermo-erosion gully 1 (TEG1) has been studied since its initiation in 1999 (R08 in Fortier et al., 2007; Godin and Fortier, 2012b; Rioux, 2020). TEG1 is located on the southern terrace of the Qarlikturvik Valley, about 800 m east of the CEN research station and 5.5 km from the valley mouth (Fig. 1). It cuts into the north-facing terrace, which is gently sloping (2 %) toward the outwash river and about 20 m a.s.l., and it stretches about 750 m from the base of the valley side to a stream that connects the lake near the CEN research station to the proglacial river (Godin and Fortier, 2012b). The gully was initiated in a sinkhole, from which it developed in opposite directions in the first year, then upstream and laterally (Godin and Fortier, 2012b). The rates of erosion of the gully were very high during the first 10 years following its inception and decreased substantially after, from 75 to 5 m a−1 for the 1999–2009 and 2013–2017 periods, respectively (Fortier et al., 2007; Godin and Fortier, 2012b; Rioux, 2020). TEG1 had a main axis length of 863 ± 4 m and formed a hydrological network of 33 458 ± 379 m2 in 2017 (Rioux, 2020) and was still active in 2021 during fieldwork in the area. Thermo-erosion gully 2 (TEG2) (R05 in Godin and Fortier, 2012a; Veillette, 2019) is also located on the southern terrace of the valley, about 2.8 km east of the CEN research station and 7.4 km from the valley mouth (Fig. 1). TEG2 had a main axis length of 1899 m and a surface area of 29 485 m2 in 2010 (Godin and Fortier, 2012a). The head of TEG2 is located at the junction between two alluvial fans that formed from sediments eroded in the deep ravines incising the plateau of sedimentary rocks (Veillette, 2019). TEG2 cuts through the polygonal terrace (1.2 % slope) before reaching the proglacial river. Aerial photos (1958, 1961, 1972, and 1982) and satellite imagery (2007 and 2010) showed that TEG2 was already stabilized in 1958 and therefore much older than 65 years old (1958–2023) (Godin and Fortier, 2012a; Veillette, 2019). Based on stabilization rates by Godin and Fortier (2012a), the gully is likely > 100 years old.
3.1 Fieldwork and laboratory analyses
Fieldwork was carried out between June and August in 2013, 2016, 2017, and 2018. To assess the impacts of the TEG on the permafrost thermal regime, thaw front depth (TFD) was measured at different locations at TEG1 and TEG2 (Fig. 1). The TFD was obtained by probing to refusal with a graduated steel rod in 2017 from 13 June to 29 July and in 2018 from 12 June to 16 August. Measurements were made every 2–3 d along transects of ∼ 30 points (10 to 30 m in length) perpendicular to the TEG and averaged into three sections (shoulders, slopes, and channel; Fig. 2). The TFD was also calculated from temperatures (Supplement S1) recorded by thermistor cables installed in two boreholes in undisturbed low-centred polygons, one adjacent to TEG1 (IP-A; see Godin et al. 2016) and the other one from BYLOTPD (Allard et al., 2024). The tundra polygons near the gullies were described based on their shape (low-, flat-, and high-centred) and the moisture level (standing water, mesic, and dry). To measure ground ice content and analyse soil composition, the TEG and the surrounding polygons were drilled using a portable earth-drill, with a core barrel of 10 cm diameter. At TEG1, we drilled in 2013 along and in the TEG at three subsites of different ages to extract permafrost cores down to 0.95–1.46 m (Fig. 2). At each subsite, one hole was drilled in an undisturbed low-centred polygon (TEG1-1Undist, TEG1-2Undist, and TEG1-3Undist), one was drilled in a drained polygon adjacent to the TEG (TEG1-1Drained, TEG1-2Drained, and TEG1-3Drained), and one was drilled in the gully slope adjacent to the drained polygon (TEG1-1Slope, TEG1-2Slope, and TEG1-3Slope). At TEG2, we drilled at eight locations in 2016 to extract permafrost cores down to 1.15–2.12 m. The holes were located on an ∼ 170 m transect going across TEG2 and sampled undisturbed low-centred polygons (TEG2-1Undist and TEG2-2Undist), drained polygons adjacent to the TEG (TEG2-1Drained and TEG2-2Drained), gully slopes (TEG2-1Slope, TEG2-2Slope, and TEG2-3Slope), and the bottom of the gully channel (TEG2BGC) (Figs. 1, 2). For both sites, drained polygons corresponded to low-centred polygons that drained when thermo-erosion gullying caused breaching and collapsing of their rims (Godin et al., 2016). All permafrost cores were kept frozen and brought back to Université de Montréal for laboratory analyses.
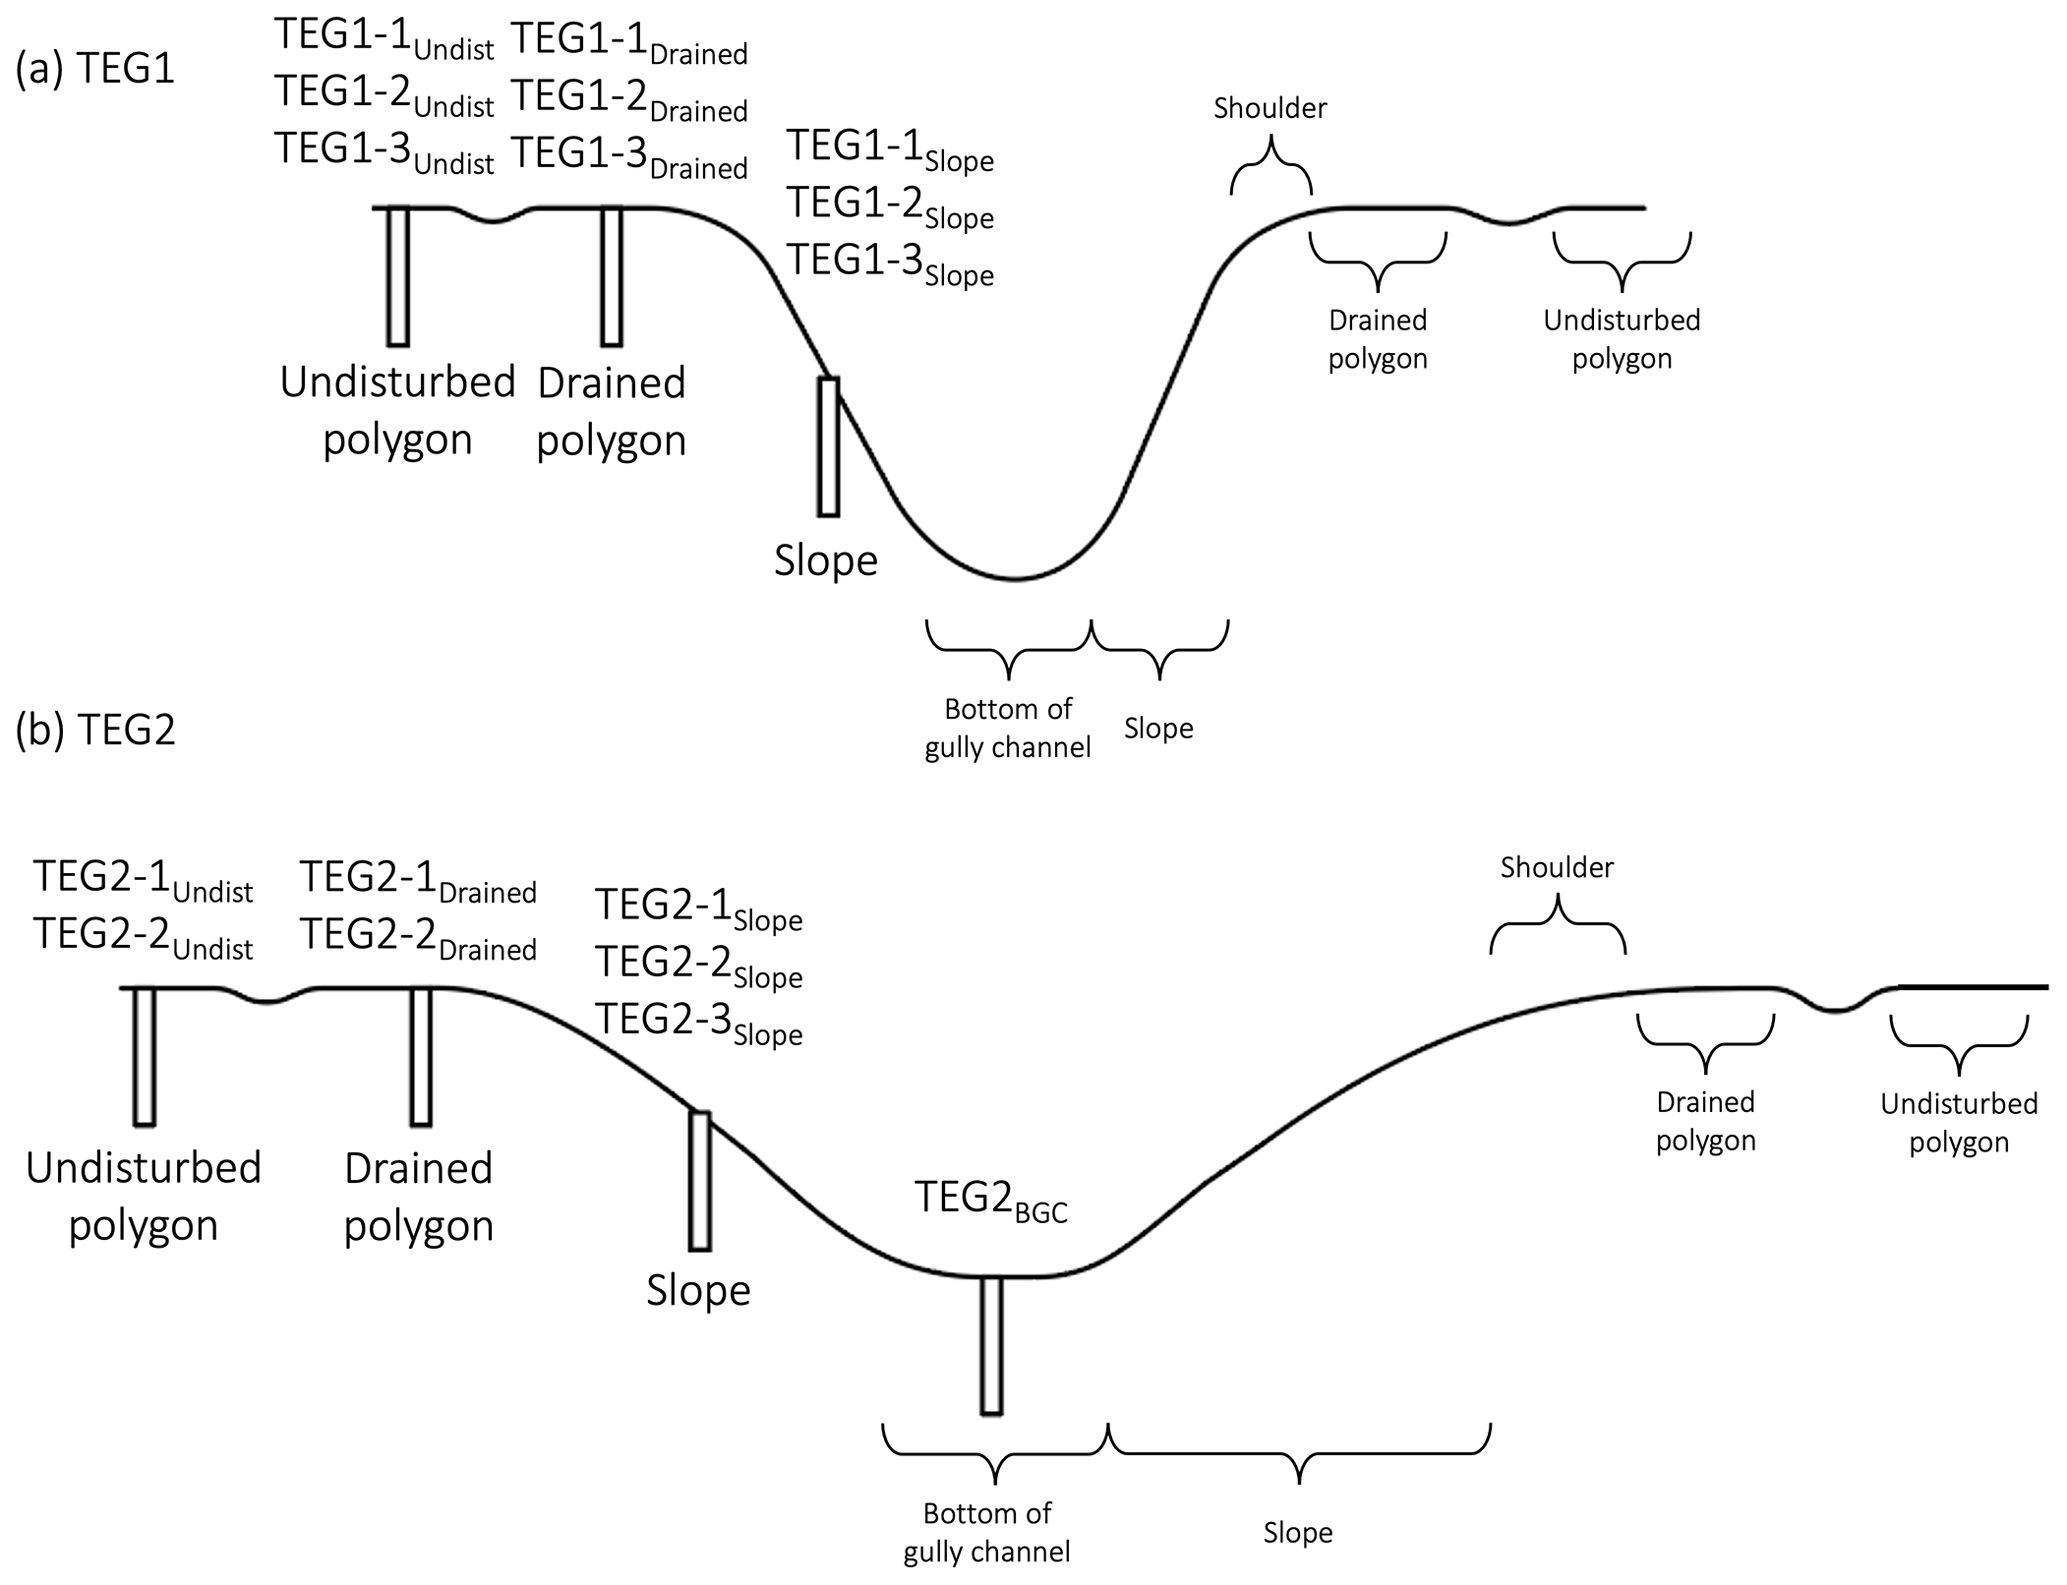
Figure 2Conceptual cross-section of the two thermo-erosion gullies, TEG1 (a) and TEG2 (b), showing the sections of the TEGs where thaw front depth was probed (only one side is annotated, but both sides were probed for slopes and shoulders) and the locations where we drilled into permafrost. While TEG1 was composed of three subsites, TEG2 had cores relatively close to one another. The locations of the cores are relative to the cross-section of the gullies; for their exact locations, see Fig. 1. Figure not to scale.
The cores were first scanned using micro-computed tomodensitometric analysis (CT scanner SOMATOM Definition AS + 128, Siemens®, resolution of 0.4 mm). The scans were used to characterize the cryostructures present in permafrost (Calmels and Allard, 2004). Cryostructures were described using a classification based on the existing literature (French and Shur, 2010; Kanevskiy et al., 2013; Murton, 2013). Then, the cores were cut into samples ranging from 0.5 to 49 cm for TEG1 and 2 to 36 cm for TEG2 that corresponded to the main cryostructures and sediment textures (TEG1 n=173 and TEG2 n=56). The frozen samples were vacuum-sealed in plastic bags to determine their total volume using the water displacement method (Strauss et al., 2013). Afterwards, the samples were weighed, dried in an oven at 105 °C until dry, and reweighed to determine the water content. The volume and mass of the samples were used to calculate bulk (ρbulk) and dry (ρdry) densities and the mass of water for volumetric ice content (VIC; in cm cm; Supplement S2). Grain size analyses were performed on the dry samples using a sieve column (0.5 phi increments: 1.0, 1.4, 2.0, 2.8, 4.0, 5.6, 8.0, 11.2, and 16.0 mm) for particles > 1.0 mm and a particle size analyser (triplicate measurements; HORIBA Partica LA-950V2) for particles ≤ 1.0 mm. Soil composition was determined by calculating the proportion (% of total mass) of gravel (> 2 mm), sand (> 63 µm to ≤ 2 mm), silt (> 2 to ≤ 63 µm), and clay (≤ 2 µm) in each sample. Organic matter content (OMC) was determined using the loss-on-ignition method (5–10 g triplicates at 550 °C for 5 h; Gagnon and Allard, 2020) on samples representative of the main soil layers (TEG1 n=57 and TEG2 n=56).
3.2 Data analyses
The weighted average VIC (VICwa) and OMC (OMCwa) were calculated for each cryostructure, cores from a same hole (hereafter referred to as cores), and TEG (Supplement S2). To facilitate comparison between cores, VICwa and OMCwa down to 1 m were used (VICwa and OMCwa hereafter describe the weighted average down to 1 m). For TEG1-1Undist and TEG1-1Drained, which were 95 and 96 cm deep, respectively, the bottom cryostructure/stratigraphic unit and associated VIC/OMC were assumed to be the same down to 100 cm deep. Cryostructures were used to produce the cryostratigraphy for each core and for the interpretation of geocryological layers, i.e. layers that describe temporal changes in active-layer thickness (Shur et al., 2005). The interpretation of the geocryological layers was based on the cryostructures and VIC and was used to describe permafrost resilience and recovery to thermal erosion. The geocryological layers were the active layer (unfrozen and frozen); transient layer, which is an ice-rich layer in the uppermost part of permafrost that is susceptible to thawing due to sub-decadal to centennial variations in active-layer thickness; intermediate layer, a more ice-rich layer directly below the transient layer that is susceptible to thawing due to decadal to multi-centennial variations in active-layer thickness; buried intermediate layer, an intermediate layer that has been buried under layers of sediment in which permafrost has aggraded syngenetically; and permafrost (French and Shur, 2010; Murton, 2013; Gilbert et al., 2016; Kanevskiy et al., 2017).
To produce the generalized stratigraphy of each core, we used the grain size statistics combined with the photographs and CT scans of the cores. Grain size analyses were performed with the GRADISTAT program (version 9.1) (Blott and Pye, 2001). Based on sediment size classes derived from sieving and from the particle size analyser, the program generated statistical parameters that were used to determine the textural groups and the types of sediment (measures from Folk and Ward, 1957, were used). We also performed statistical analyses to determine if VICwa, OMCwa, or the weighted average mean grain size down to 1 m differed between the two TEGs, between all subsites of the TEGs, and between the position of the cores about the TEGs (i.e. undisturbed polygon, drained polygon, gully slope, gully channel) using RStudio software (RStudio Inc., version 1.4.1103). This was done using VICwa and OMCwa down to 1 m of each core in a one-way analysis of variance (ANOVA) with a 95 % confidence interval followed by a Tukey's HSD analysis.
4.1 State of the TEG, polygon shape, and thaw front depth
The two TEGs differed significantly in their surface characteristics and general shape. TEG1 was characterized by a narrow (10–15 m) box-shaped main channel, i.e. high-angle slopes connecting to a flat gully channel bottom, and had many ramifications through the surrounding polygonal network. The depth of the main channel varied between 1 and 5 m, and younger areas where erosion was more active tended to be deeper, narrower, and have steeper slopes. Erosion was apparent in all the channels, i.e. the sides of channels were steep and uneven with blocks of ground falling off, causing the soil to be exposed (Fig. 3). It was also possible to see thermokarst mounds, i.e. baydzherakhi, in the main channel of TEG1 where ice-wedge melt and thermal erosion isolated polygon centres. TEG2 was characterized by a well-developed main channel with few ramifications. The main channel was wide (30–40 m from side to side) with a flat bottom (3–7 m) and was between 2 and 6 m deep. The slopes were smooth and at a low angle (Fig. 3). Both the sides and bottom of the gully channel were stabilized with a continuous vegetation cover except at the bottom of the gully channel where water was flowing.
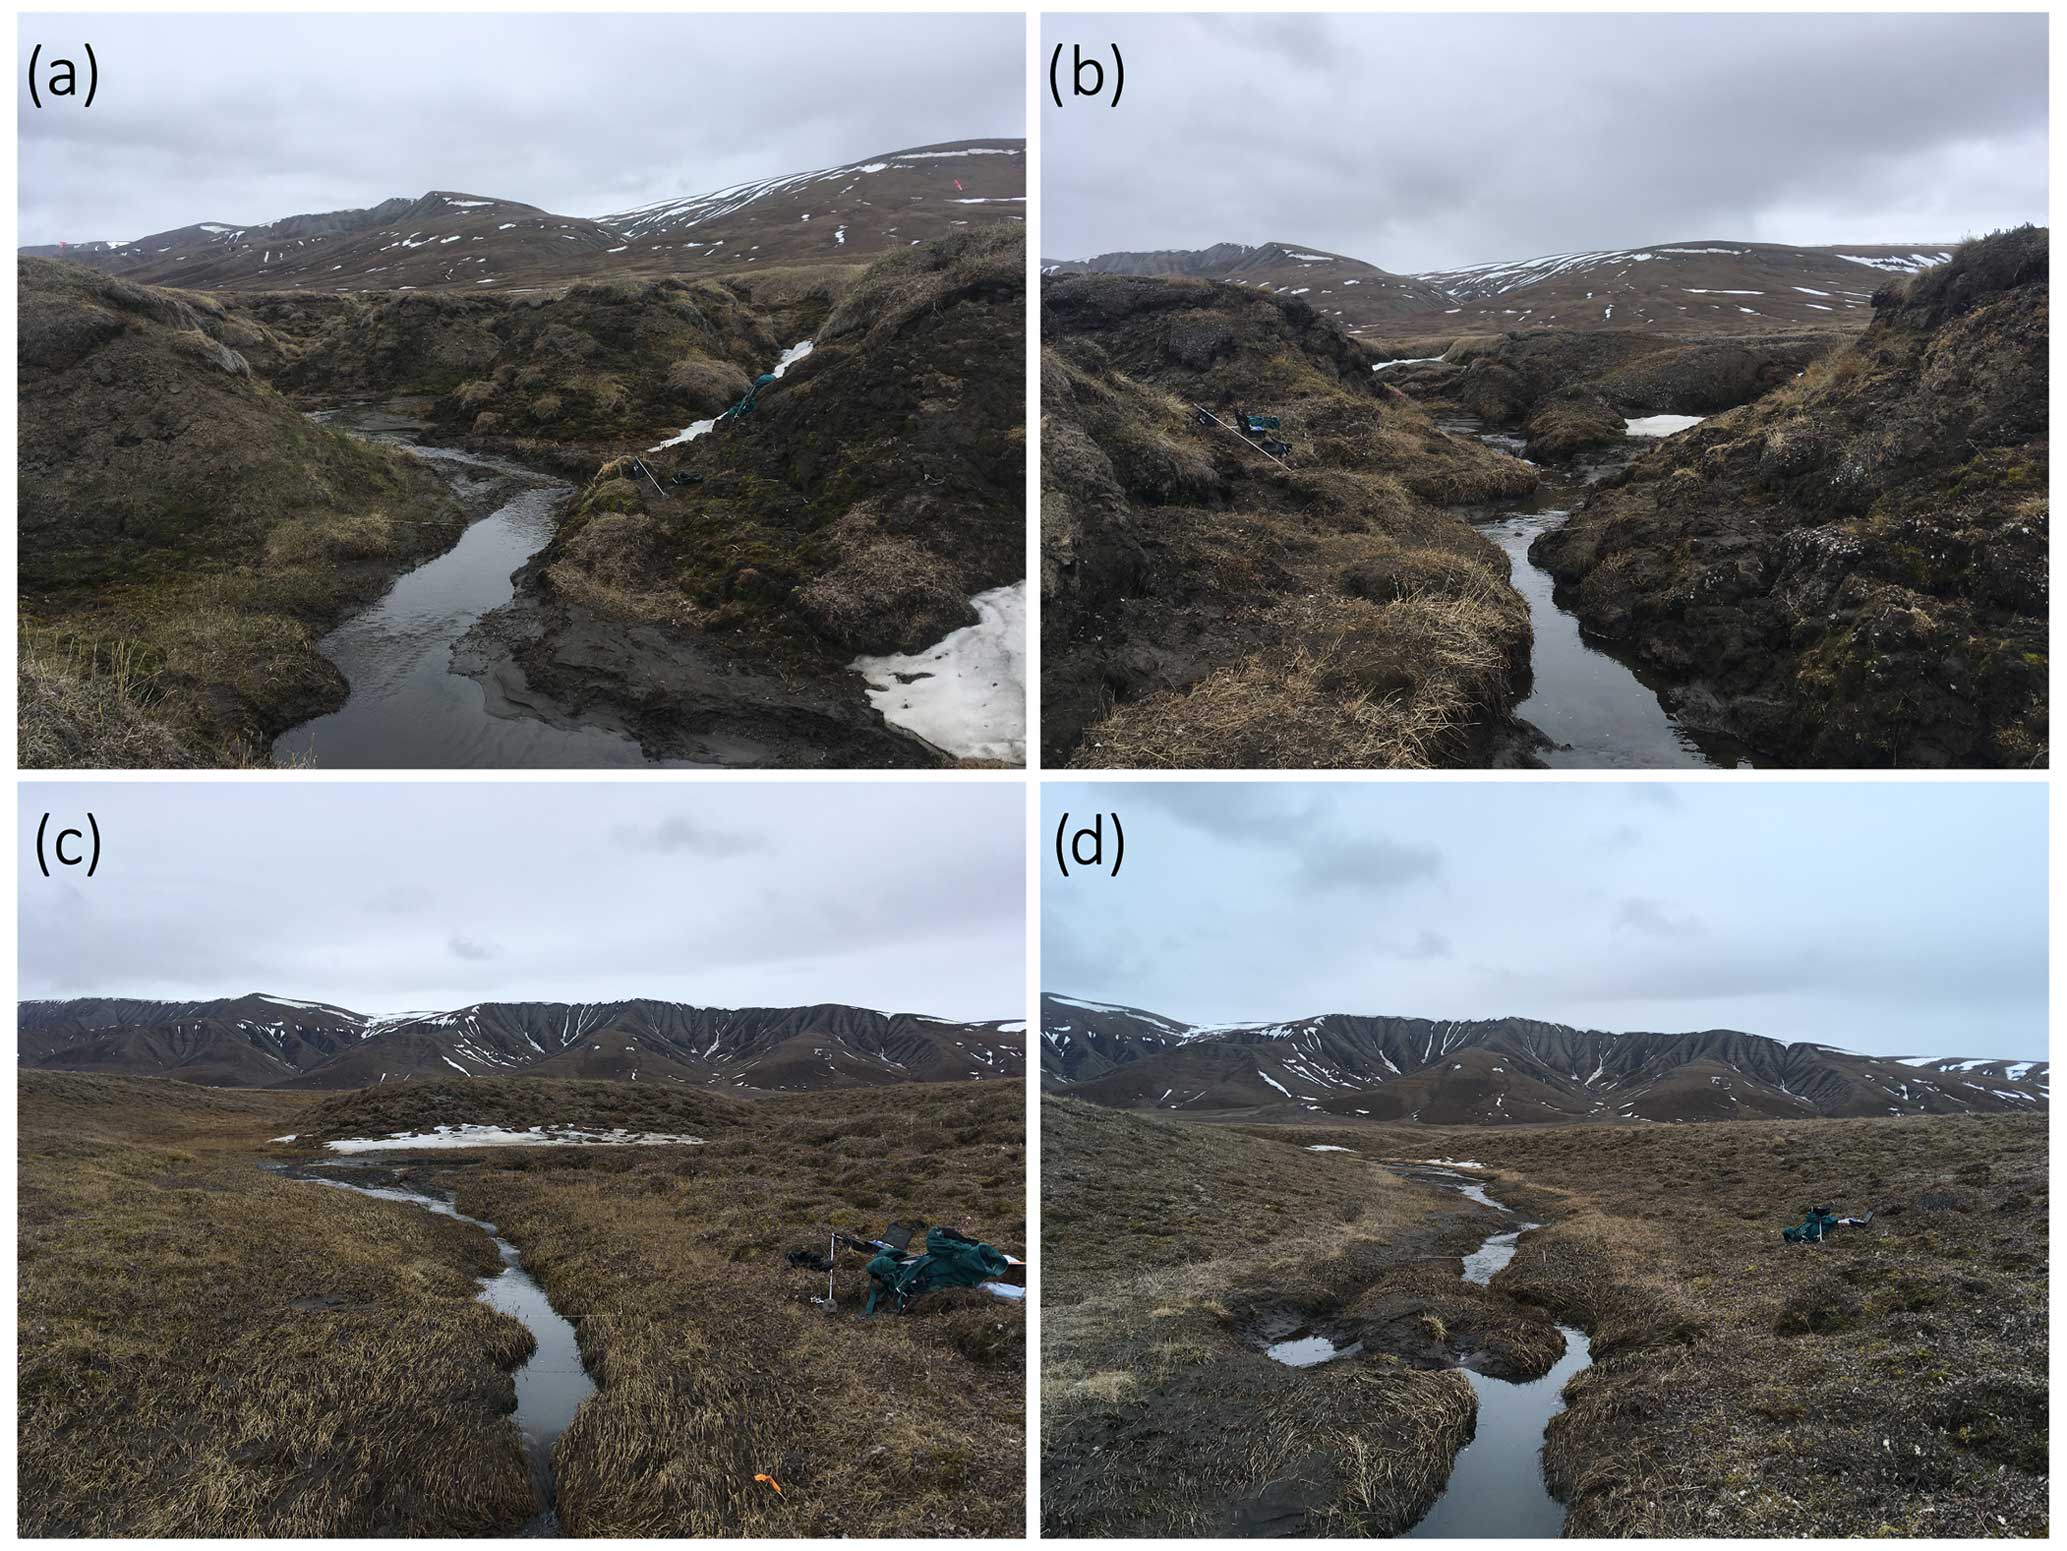
Figure 3Thermo-erosion gullies 1 (TEG1, panels a–b) and 2 (TEG2, panels c–d). (a) TEG1, near subsite TEG1-2, and (b) TEG1, near subsite TEG1-3. (c) TEG2, near the transect where the cores were drilled, and (d) TEG2, near TEG2_TFD2, about 400 m upstream of the cores. All pictures were taken on 24 June 2018 and point southeast. The backpack on the pictures is about 80 cm long.
For both TEG1 and TEG2, the polygons adjacent to the TEG were drained, i.e. mesic to dry (TEG1-1-2-3Drained and TEG2-1-2Drained), compared to undisturbed low-centred polygons away from the gully incisions where ponds at the centre of polygons and in the troughs separating them were common (TEG1-1-2-3Undist and TEG2-1-2Undist). At TEG1, the drained polygons adjacent to the TEG were low-centred. At TEG2, the drained polygons were flat- or high-centred, while the undisturbed polygons were low-centred. In addition, the area encompassing the drained polygons along the TEG was also higher in elevation than the surrounding low-centred polygons (based on a normalized topographic position index; see Veillette, 2019). Over 70 thermal contraction cracks were found in the flat bottom and in the slopes of TEG2 (Veillette, 2019). The cracks seemed to follow the same pre-disturbance polygonal network, as many cracks were extending from the troughs of the surrounding network.
The TFD varied between the two TEGs and depended on the location of the measurements in the TEGs. At TEG1, TEG1_TFD1-2-3-4 averaged 26, 46, and 39 cm on 29 July 2017 for the shoulders, slopes, and bottom of the gully channel, respectively (Supplement S1). On 30 July 2018, TEG1_TFD1 and TEG1_TFD3 averaged 38 cm (shoulders), 46 cm (slopes), and 34 cm (bottom of gully channel). Although there was some variability (e.g. TEG1_TFD2 2018), the general trend in TFD at TEG1 was deepest on the slopes and shallowest on the shoulders, and measurements on the slopes and the gully channel were comparable to an undisturbed TFD (BYLOTPD and IP-A) (Fig. 4a–f). At TEG2, TEG2_TFD1-2-3 averaged 41, 30, and 56 cm on 30 July 2018 for the shoulders, slopes, and bottom of the gully channel, respectively (Supplement S1). All three locations at TEG2 showed the same trend: the TFD was deepest at the bottom of the gully channel and shallowest on the slopes, similar to an undisturbed TFD (Fig. 4g–i). Shoulder values showed more variability than at TEG1.
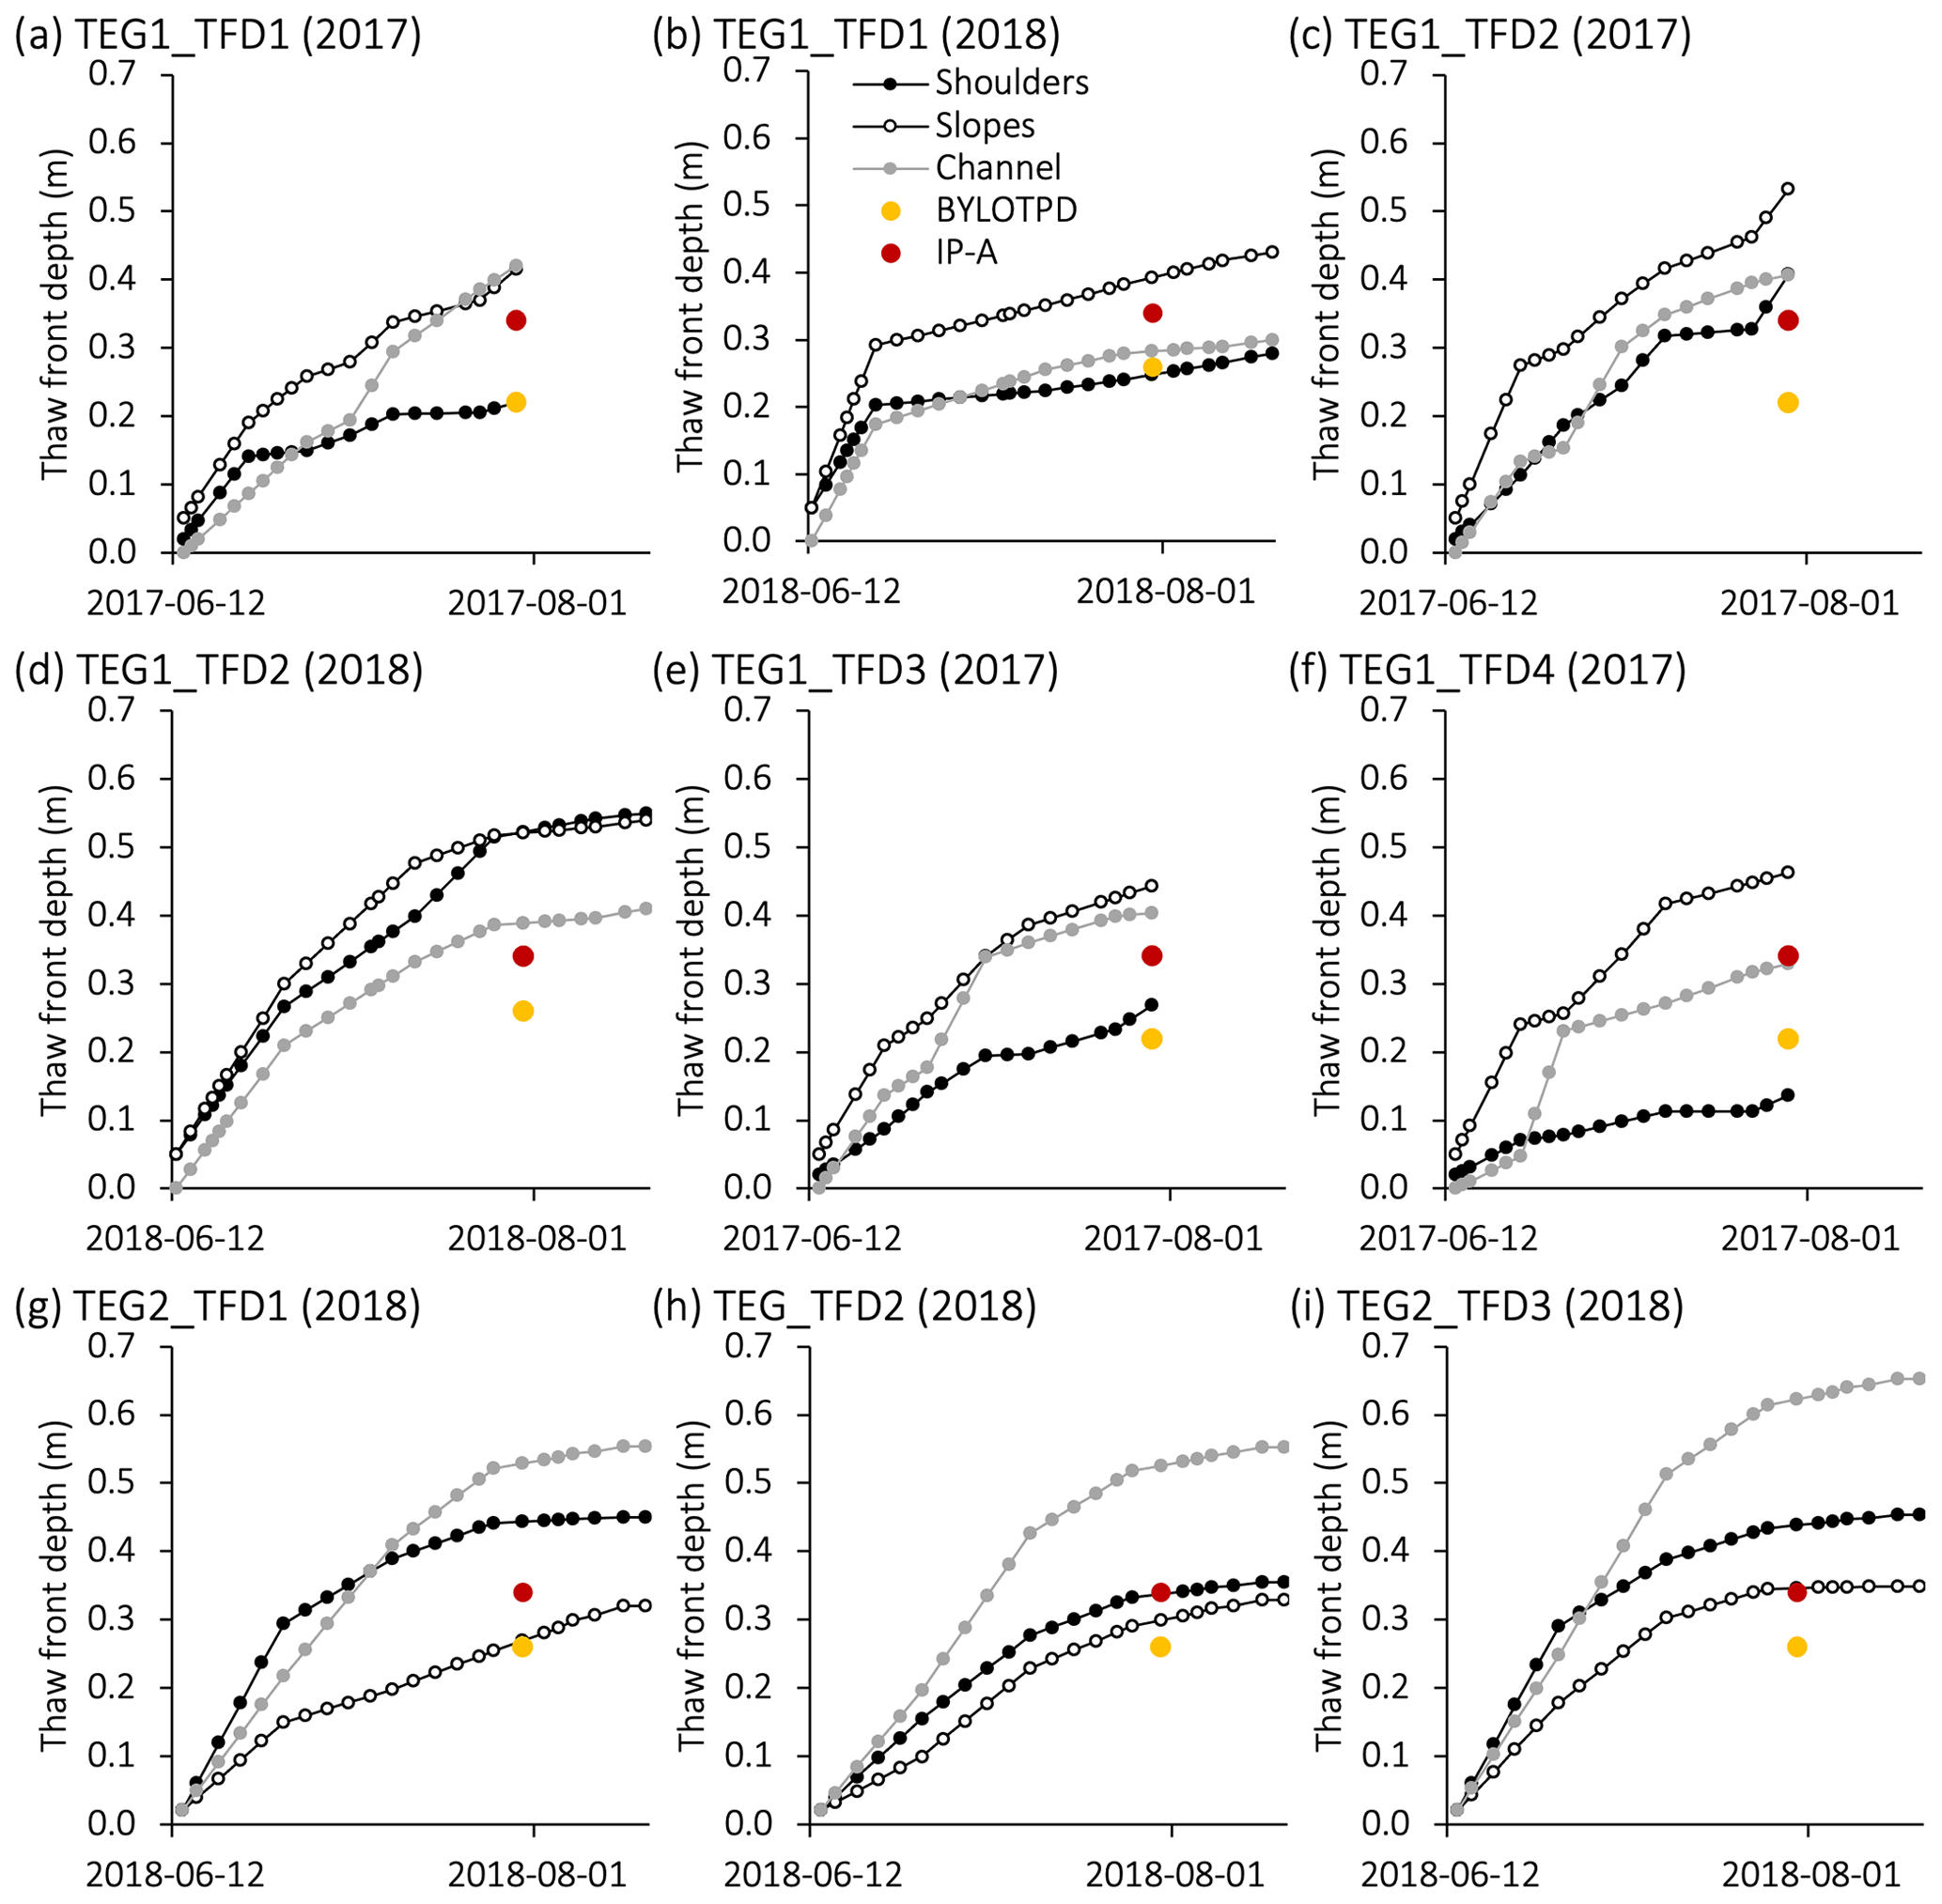
Figure 4Thaw front depth (TFD) measured in 2017 (13 June to 29 July) and 2018 (12 June to 16 August) in cross-sectional transects of the thermo-erosion gullies (TEGs; curves) and the TFD calculated from ground temperature measurements (red and yellow dots). (a, b) TEG1_TFD1, near subsite TEG1-3, in 2017 and 2018, respectively. (c, d) TEG1_TFD2, near subsite TEG1-2, in 2017 and 2018, respectively. (e) TEG1_TFD3, about 40 m upstream of TEG1_TFD2. (f) TEG1_TFD4, about 90 m upstream of TEG1_TFD2. (g) TEG2_TFD1, along the transect of the cores. (h) TEG2_TFD2, about 400 m upstream of TEG2_TFD1. (i) TEG2_TFD3, about 640 m upstream of TEG2_TFD1. See Fig. 1 for the position of the TFD transects.
4.2 Soil profiles
The generalized stratigraphy of the cores at TEG1 showed that permafrost was characterized by silty sand or sandy silt sediment, with a larger proportion of peaty material than at TEG2 (Fig. 5). There were also some gravelly sediments in cores TEG1-1Undist and TEG1-1Slope. OMC values varied between 3.1 % and 47.8 %, and the OMC-weighted averages of each core varied between 5.6 % and 20.0 %. At TEG2, the cores were largely dominated by sandy silt sediment, sometimes with peaty material (Fig. 6). OMC values of the different strata varied between 4.0 % and 25.0 %, but the weighted averages of each core remained between 6.2 % and 15.3 % (Table 1). In general, there was more peaty sediment in the undisturbed and drained polygons than in the slopes and the bottom of the TEG.
A total of 10 main cryostructures were identified in the cores of both TEGs: interstitial (pore ice not visible to the unaided eye), interstitial visible (pore ice visible), crustal, ice veins, layered, lenticular (includes micro-lenticular cryostructures and non-parallel ice lenses), isolated ice lens, organic matrix (ice-saturated peat), reticulate, and suspended (Figs. 5 and 6, Table 2). Reticulate, suspended, organic matrix, and layered cryostructures accounted for 75.3 % of the total length of all cores, while the six other cryostructures covered the remaining length. Most of the cryostructures predominantly developed in sandy silt sediment (Table 2 and Supplement S2), except for crustal (silty sandy gravel) and interstitial/interstitial visible (silty sand) cryostructures. The poorly defined sections corresponded to transitional cryostructures, often composed of organic matter unevenly mixed with mineral sediment. The VIC within each cryostructure varied between 28.9 % and 100.0 %, and the VIC range (max–min) averaged 27 % (Table 2). Sections with layered and reticulate cryostructures showed the widest VIC ranges (52.2 % and 46.2 %, respectively). VICwa of all cores ranged between 47.0 % and 81.5 % and averaged 69.3 % (Table 1). There was no statistical difference (p-value> 0.05) in VICwa, OMCwa, or the weighted-average mean grain size between TEG1 and TEG2, between any of the subsites, or between the positions of the cores. For both TEGs, cores with a higher OMC tended to have a higher VIC (TEG1 R2=0.47, TEG2 R2=0.28), but VIC showed no trend with mean grain size (both R2<0.0; Fig. 7). Cores in undisturbed polygons (TEG1-1-2-3Undist and TEG2-1-2Undist) were mostly composed of layered, organic matrix, and reticulate cryostructures (Supplement S3). Cores in drained polygons (TEG1-1-2-3Drained and TEG2-1-2Drained) showed similar cryostructures and some ice enrichment closer to the surface. In the slopes of the gullies, the cores (TEG1-1-2-3Slope and TEG2-1-2-3Slope) often displayed inclined layers of sediment/ice/air bubbles and were dominated by the reticulate cryostructure.
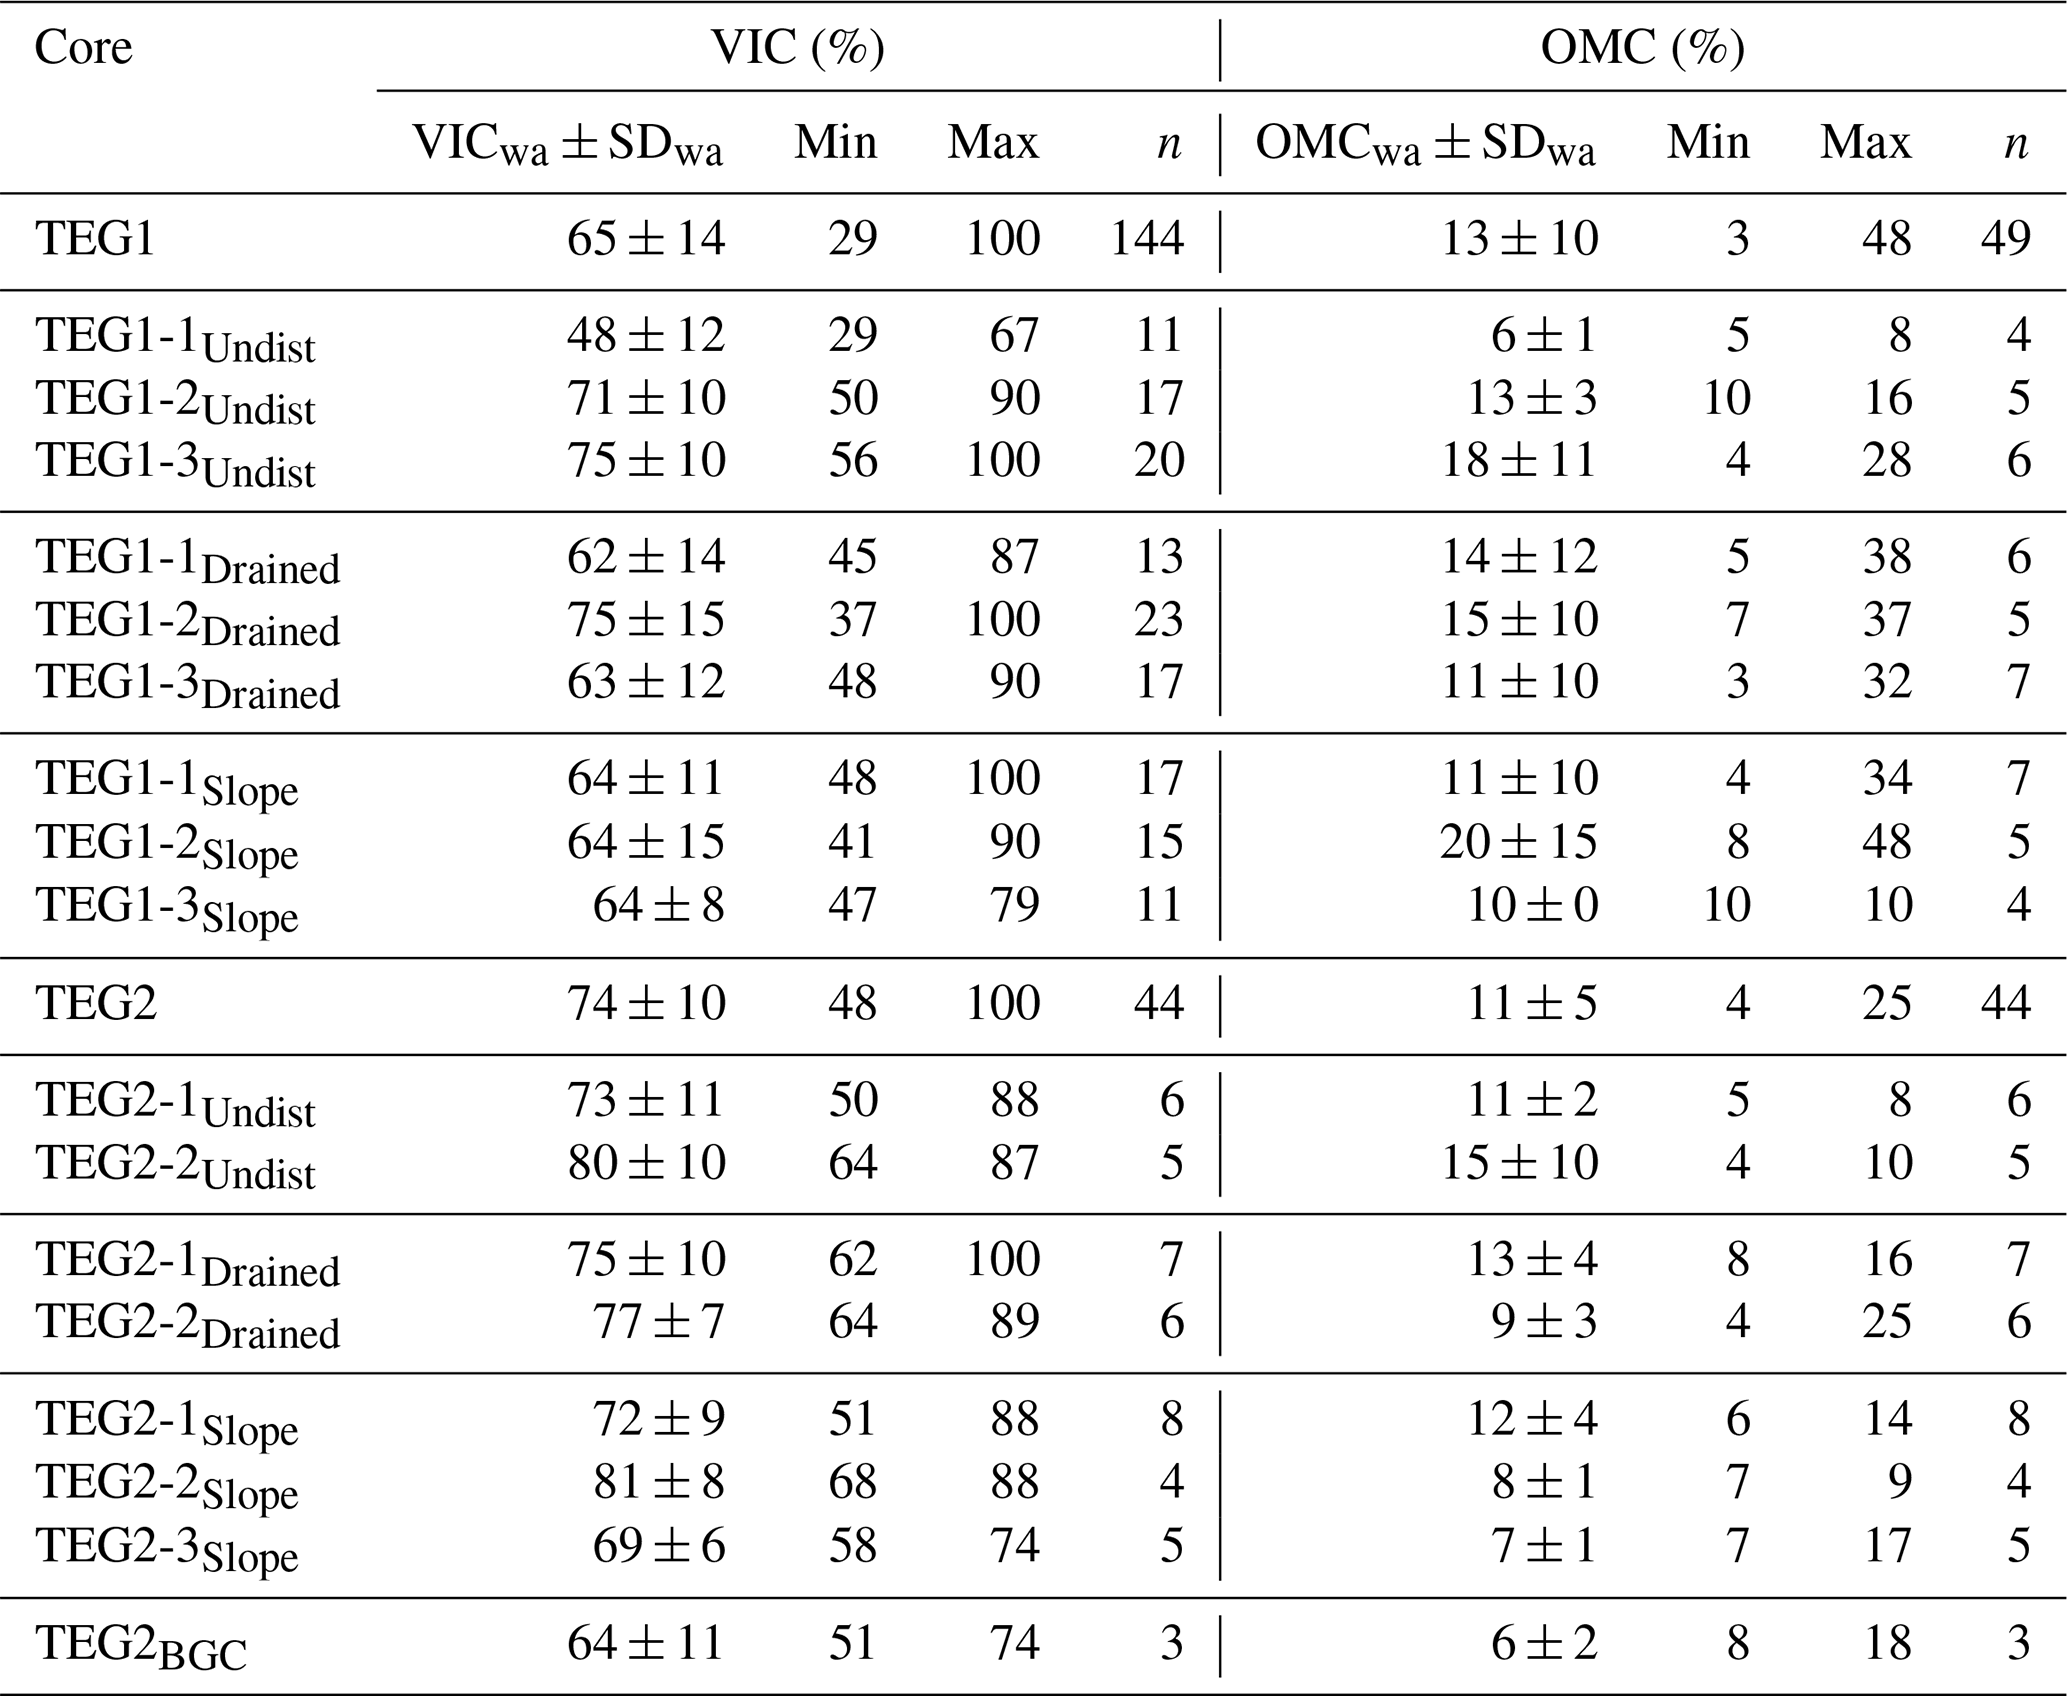
Table 1Weighted average and range (minimum/maximum) of volumetric ice content (VIC) and organic matter content (OMC) down to a depth of 1 m (excluding the surface thawed layer) for the two thermo-erosion gullies (TEG1 and TEG2) and for each core. n is the number of samples used for the calculations, and the uncertainty is the weighted standard deviation (SDwa).
4.2.1 TEG1
Cores at TEG1 had VICwa values ranging between 47.9 % and 75.4 % and averaged 65.5 % (Fig. 5 and Table 1). The cores extracted from undisturbed polygons varied in soil composition, stratigraphy, and cryostratigraphy (Fig. 5a). TEG1-1Undist contrasted with the other undisturbed cores due to its top layer of sandy gravel and by having the lowest VICwa (47.9 %). The gravelly sediments were characterized by crustal cryostructures, and ice casts of some of the stones were visible, directly below them (e.g. ice lens at 47–48 cm deep). TEG1-2Undist was composed of layers of sandy silt and silty sand with a peaty inclusion (organic matrix cryostructure) at 63–78 cm. There were ice-rich layers above and below the peaty inclusion at 31–63 and 88–115 cm. TEG1-3Undist was characterized by a top-half organic layer (organic matrix cryostructure) in silty sand sediment overlying a bottom half of mineral sediment with a layered cryostructure. The ice layers of the bottom section increased in thickness as the sediment changed from silty sand (62–90 cm) to sandy silt (> 90 cm).
In drained polygons, the stratigraphic layers were mostly composed of silty sand and sandy silt, sometimes peaty (Figure 5b). TEG1-1Drained was composed of sandy silt and silty sand layers with peaty inclusions at the surface and at 66–79 cm. Most of the core was characterized by interstitial and organic matrix cryostructures, except for an ice-rich layer (suspended cryostructure) at 55–66 cm. TEG1-2Drained showed an ice-rich layer (suspended and reticulate cryostructures) at 44–88 cm with peaty (organic matrix cryostructure) sediment directly below it and at the surface of the core. The sediment in the suspended cryostructure was almost entirely composed of silt. TEG1-3Drained was mostly composed of silty sand. Organic layers (organic matrix cryostructure) were observed both at the top and the bottom of the core. In the centre, the only section composed of sandy silt was characterized by a layered cryostructure.
Cores from the gully slopes showed contrasting stratigraphy and cryostratigraphy (Fig. 5c). TEG1-1Slope was composed of three main sections: a top section (4–28 cm) with peaty–silty–sandy sediments, a middle section (28–68 cm) with silty sand sediment showing some cross-stratification, and a bottom section (68–116 cm) with coarser gravelly–silty–sandy sediments. The top section was characterized by an organic matrix cryostructure, the middle section by mostly interstitial visible cryostructures, and the bottom section by mostly reticulate cryostructures. TEG1-2Slope displayed a thick ice lens at 110–120 cm separating the bottom silty sand sediment from the sandy silt sediment above and including a few oblique streaks of bubbles (< 0.5 cm). The bottom sandy sediment was characterized by horizontal stratification and cross-stratification at 120–135 cm (interstitial visible) and by inclined stratification (> 135 cm) with layered cryostructure aligned with the stratification plane. Above the ice lens and up to 78 cm deep, the sediments and the cryostructures were inclined. TEG1-3Slope contrasted with the two other cores by being more uniform in soil composition and cryostructures. Except at the top of the core (< 36 cm), TEG1-3Slope was entirely composed of reticulate cryostructures in sandy silt sediment. Starting at 76 cm, the sediment/ice layers were inclined.
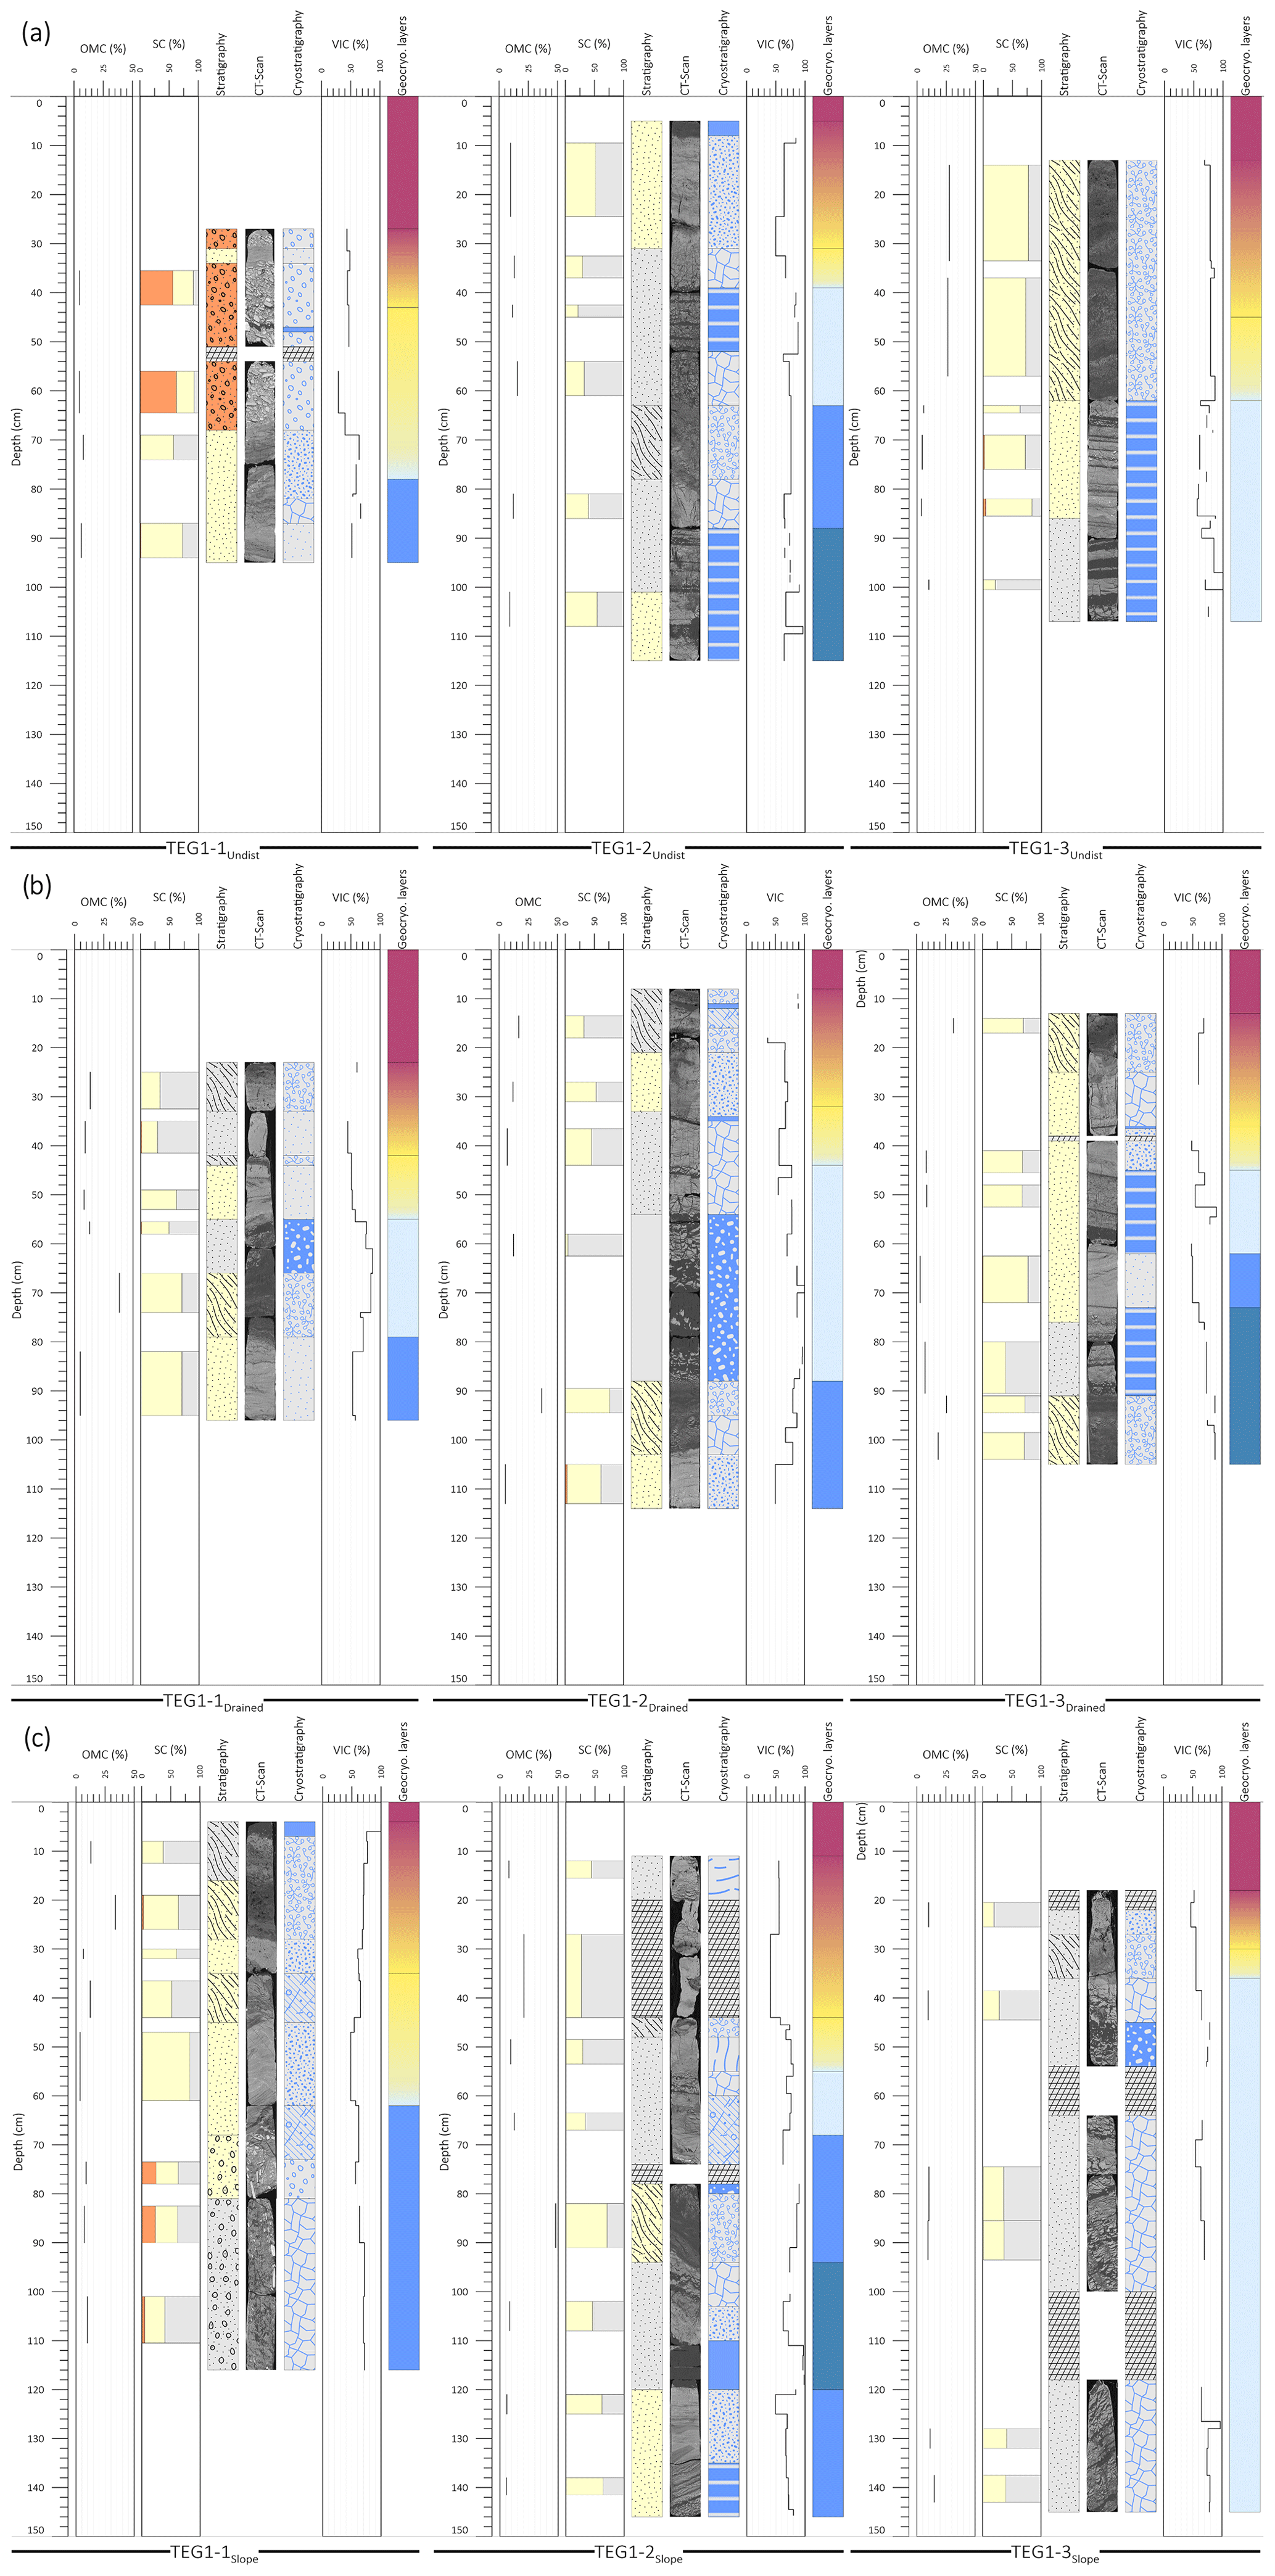
Figure 5Organic matter content (OMC; %), soil composition (SC; %gravel, %sand, %silt), soil stratigraphy, CT-scan imagery, soil cryostratigraphy, volumetric ice content (VIC; %), and geocryological layers for the cores at TEG1. (a) Cores in undisturbed polygons, (b) cores in drained polygons, and (c) cores in the slopes of TEG1. While delineations were used to mark the transitions between the frozen part of the active layer, the transient layer, and the intermediate layer, colour gradients were also used to denote the uncertainty in the limits between these layers. Refer to Fig. 6 for the legend.
4.2.2 TEG2
Cores at TEG2 had VICwa values ranging between 64.2 % and 81.4 % and averaged 74.2 % (Fig. 6, Table 1). TEG2-1Undist and TEG2-2Undist were mostly composed of sandy silt with some layers of peaty sandy silt (Fig. 6a). TEG2-1Undist was characterized by a succession of organic layers (organic matrix) underlain by ice-rich layers (suspended, reticulate, and layered). Similarly, TEG2-2Undist was dominated by an organic matrix cryostructure in the top section (13–52 cm) underlain by an ice-rich (suspended cryostructure) layer (61–81 cm) in sandy silt above a layered cryostructure with thin ice lenses in silty sand.
In drained polygons (TEG2-1Drained and TEG2-2Drained), the soil layers were mostly composed of sandy silt, sometimes peaty (Fig. 6b). Both cores were characterized by an ice-rich layer (ice lens, suspended, reticulate, and layered cryostructures) near the top of permafrost (22–50 and 12–34 cm, respectively), a middle section (50–82 and 34–51 cm) with organic-rich sediment (organic matrix cryostructure), and a bottom section (82–118 and 51–112 cm) characterized by more developed cryostructures (layered, reticulate, and ice lens) and ice lenses.
In the gully slopes, while TEG2-2Slope and TEG2-3Slope were entirely composed of sandy silt, TEG2-1Slope also contained peaty sections (Fig. 6c). In TEG2-1Slope, it was possible to see the alternation of peaty sediment (organic matrix cryostructure) and ice-rich (suspended, reticulate, and layered cryostructures) sandy silt sediment. TEG2-2Slope was dominated by ice-rich cryostructures (layered, reticulate, and suspended) transitioning from one to the other. The reticulate and layered cryostructures were well developed, i.e. had high VIC values and were characterized by thick ice inclusions (and vice versa for poorly developed). TEG2-3Slope was dominated by reticulate cryostructures, though they were often poorly developed. The layered cryostructures at the bottom of the core were very clearly defined. Oblique streaks of bubbles (< 1.5 cm) were found in the suspended and reticulate cryostructures of the slope cores, i.e. parallel to the slope surface.
Finally, the stratigraphy of core at the bottom of the gully channel (TEG2BGC) contrasted with the other cores of TEG2 with more sandy sediments and some gravel at the bottom of the core (Fig. 6d). The core had the lowest VICwa of all cores at TEG2 (Table 1), though this only included the top 40 cm of the core, which was not representative of deeper layers where ice-rich cryostructures (reticulate, suspended, and layered) were found. Starting at 192 cm deep, inclined layers of coarser sediments formed inclined cryostructures.
Table 2Weighted average volumetric ice content (VICwa), cryostructure proportion, and proportion of the dominant soil compositions of each cryostructure identified. The cryostructure proportions were calculated by dividing the total length of a cryostructure by the total length of all cryostructures found in the cores, and the proportions of the dominant soil compositions were calculated by dividing the total length of a type of sediment within a cryostructure by the total length of the cryostructure. Only VIC values falling within one cryostructure (i.e. not sections overlapping two or more cryostructures) were used in the total proportion to obtain representative values.
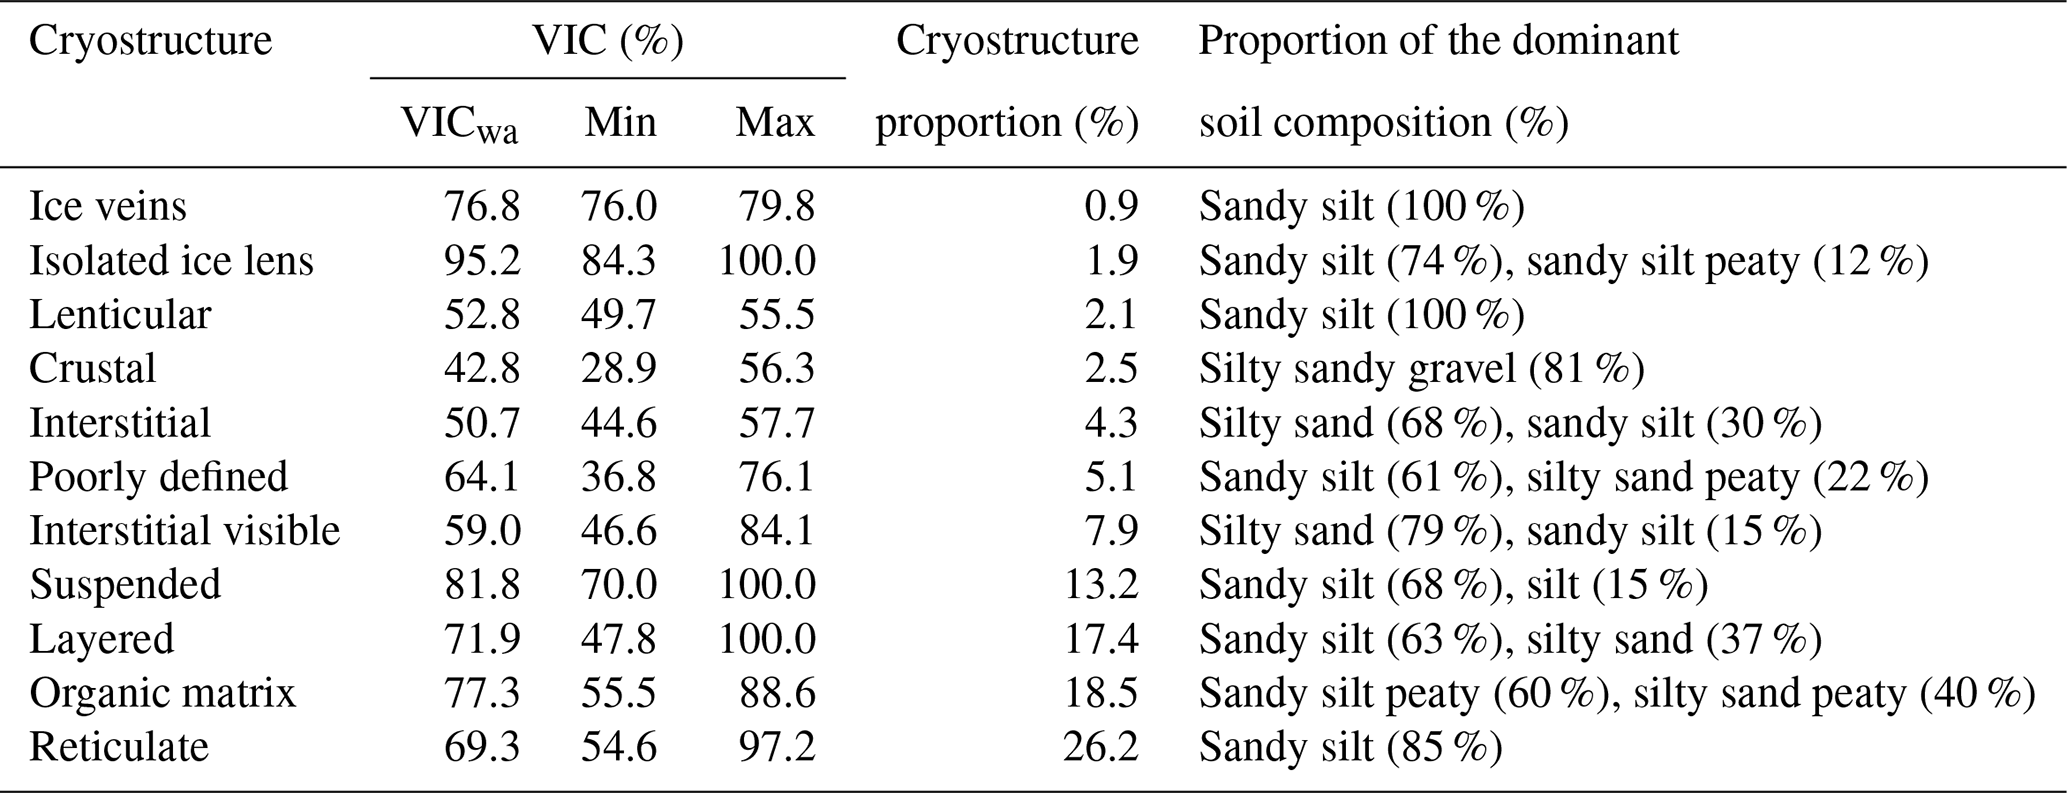
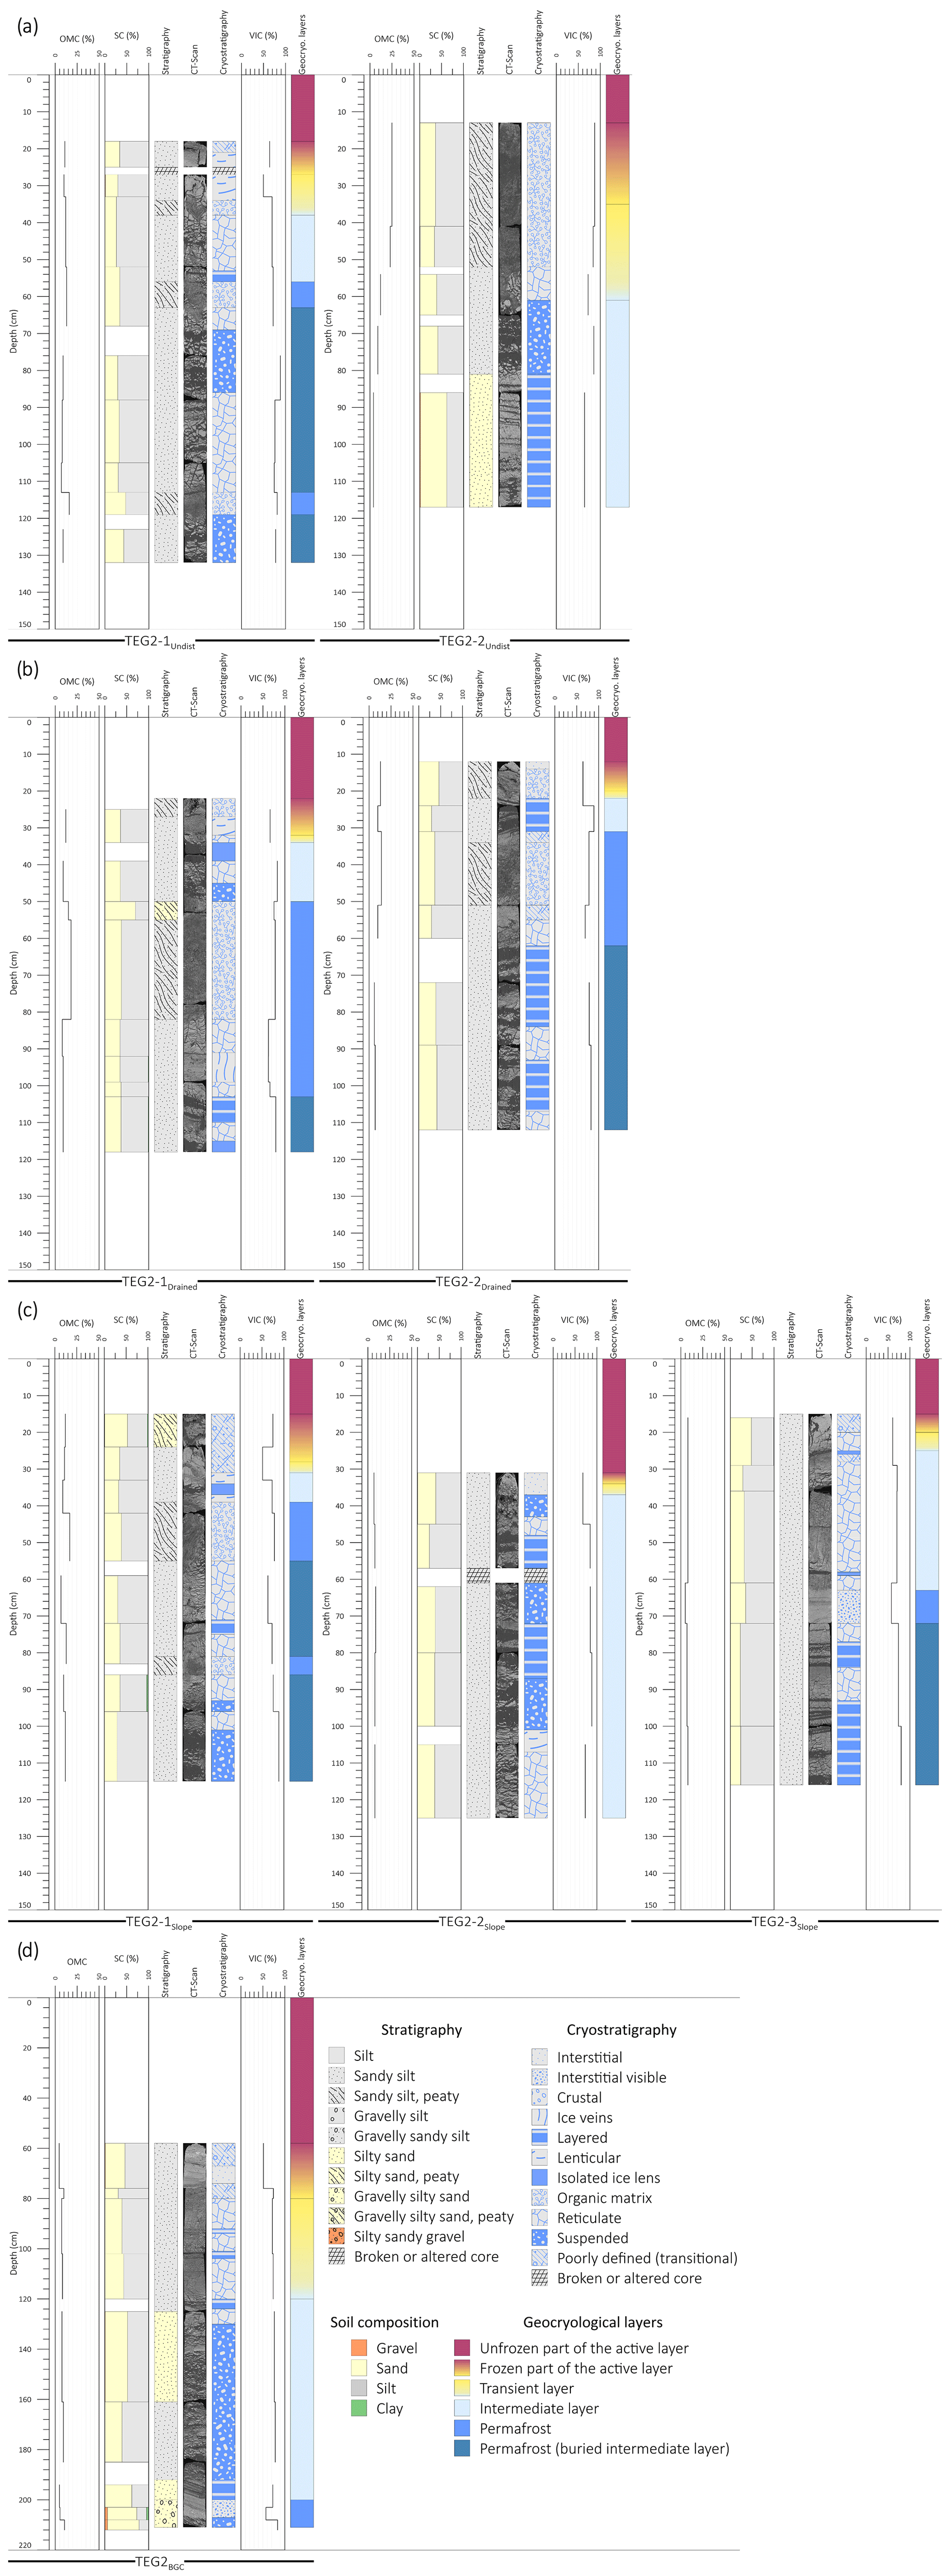
Figure 6Organic matter content (OMC; %), soil composition (SC; %gravel, %sand, %silt), soil stratigraphy, CT-scan imagery, soil cryostratigraphy, volumetric ice content (VIC; %), and geocryological layers for the cores at TEG2. (a) Cores in undisturbed polygons, (b) cores in drained polygons, (c) cores in the slopes of TEG2, and (d) core at the bottom of the gully channel of TEG2. While delineations were used to mark the transitions between the frozen part of the active layer, the transient layer, and the intermediate layer, colour gradients were also used to denote the uncertainty in the limits between these layers.
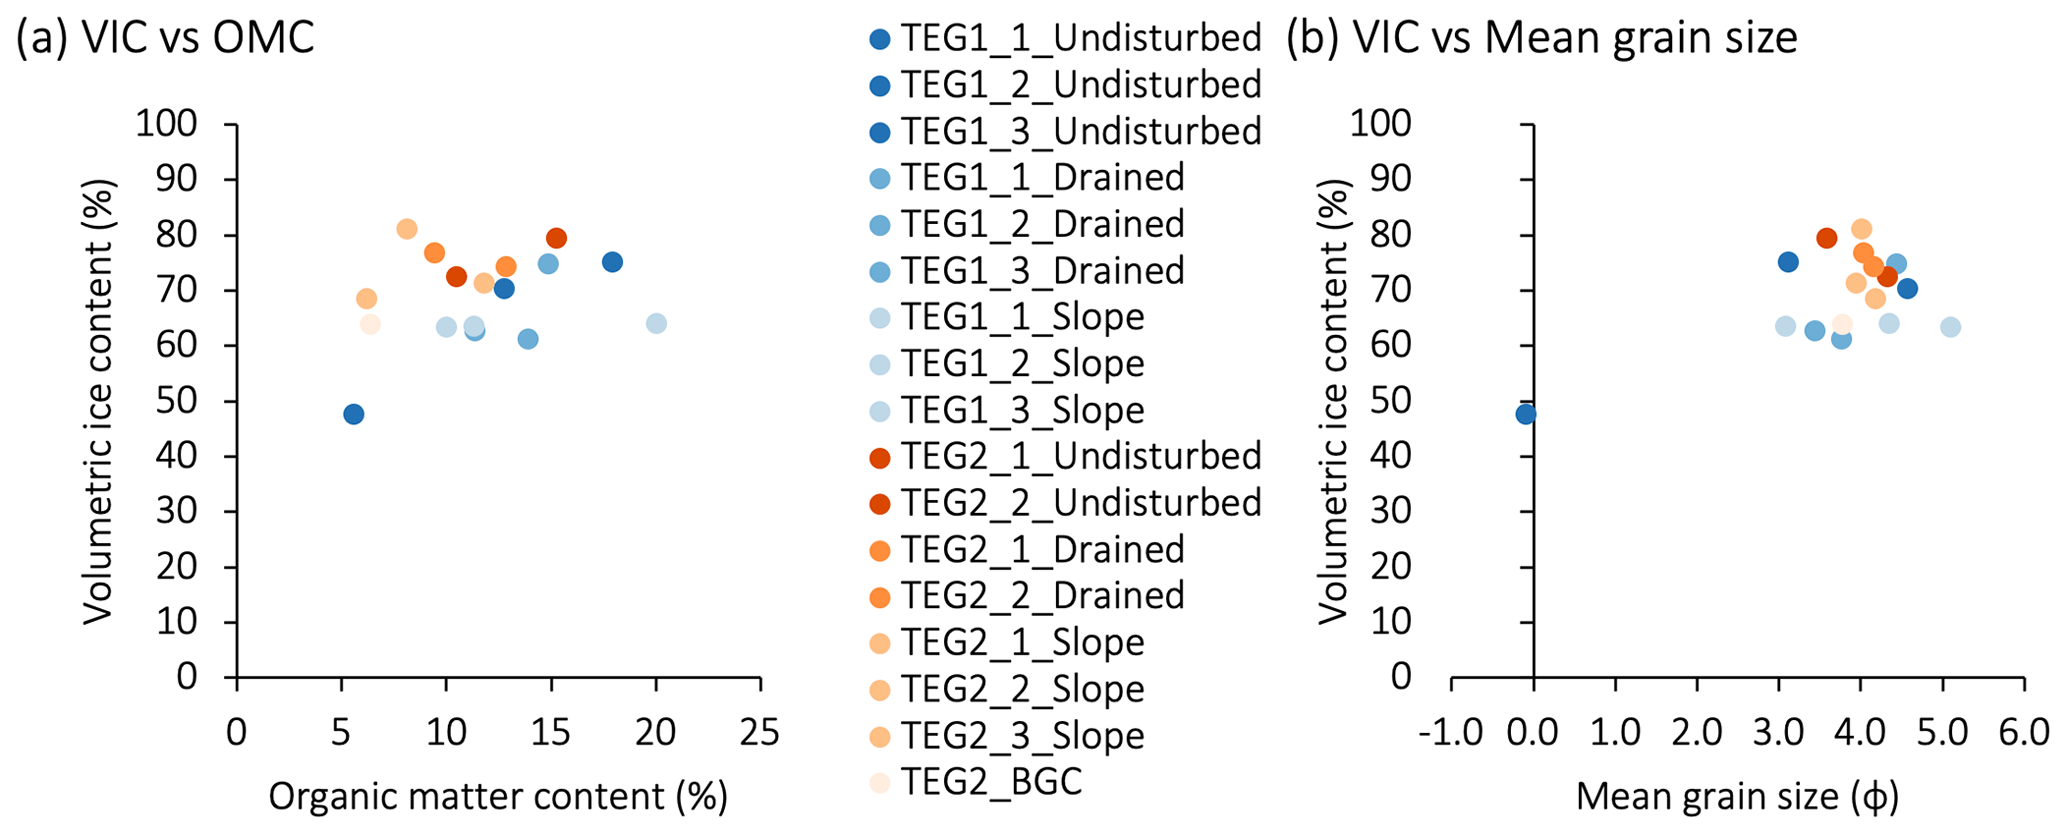
Figure 7Volumetric ice content (VIC) against (a) organic matter content (OMC) and (b) mean grain size for each core of TEG1 and TEG2. Cores from TEG1 and TEG2 are in blue and orange shades, respectively. VIC, OMC, and mean grain size are weighted averages down to 1 m deep for each core.
5.1 Cryostratigraphy
5.1.1 Cryostructures
Our results show that the development of cryostructures was largely influenced by the soil and organic matter composition of the deposits. The cold climate and permafrost at our study site also significantly affected freezing processes and thus the formation of the cryostructures. Here we present a more detailed description of 4 out of 11 cryostructures, as those 4 accounted for 75.3 % of all cryostructure occurrences, while most of the other ones accounted for < 5 %.
The reticulate cryostructure was the most abundant one and formed almost exclusively in sandy silt, resulting in VICwa similar to what others have reported (Kanevskiy et al., 2013; Shur et al., 2021; Thévenin, 2023). Since permafrost in the study area is syngenetic, reticulate cryostructures likely formed by the hydraulic fracturing of the sediment ahead of an advancing freezing front followed by an infilling of the resulting fractures with expelled and pressurized pore water (McRoberts and Nixon, 1975). Layered cryostructures formed in both predominantly silty (62 %) and sandy (38 %) sediments, though more well-developed (thicker) ice layers were generally found in silty sediment (e.g. TEG1-3Undist), reflecting how ice segregation was facilitated in finer sediments. They likely formed due to prolonged periods of ice segregation when the thaw front was stationary and water was available, mirroring sediment deposition patterns and consistent with syngenetic permafrost (French and Shur, 2010). Both the reticulate and layered cryostructures had a wide VIC range. While all cryostructures showed some variability in VIC, the reticulate and layered cryostructures were the most affected because of the variability in the thickness of the ice lattices (reticulate) or lenses (layered). Depending on the saturation of the host sediments, those cryostructures can be observed as much in ice-rich sediments as in sediment-poor ice in permafrost and reflect the surface conditions (e.g. water availability) during their formation (Paquette et al., 2022).
Except for the isolated ice lenses, the suspended and organic matrix cryostructures had the highest VICwa. The suspended cryostructure predominantly (> 80 %) formed in silty sediment, which is consistent with ice segregation during periods of rapid sedimentation of fine sediments and sustained water availability (Murton, 2013). Suspended cryostructures were often found with grading cryostructures (e.g. reticulate and layered) before and/or after them leading to lower VIC. This suggests an acceleration and/or slowing down of ice segregation and thus of sedimentation during their formation or that two freezing fronts contributed to the formation of the cryostructures. Organic matrix cryostructures were found in similar proportions in peaty sandy silt (60 %) and peaty silty sand (40 %), thus making the presence of organic material rather than a specific grain size the main factor of formation.
5.1.2 Cryostratigraphic patterns
Most of the cryostructures in this study developed with syngenetic permafrost aggradation, irrespective of their position with regard to the TEG. In general, we observed that the inclusion of organic matter in the soil profiles largely affected the cryostratigraphy due to the peaty material promoting ice aggradation below it. This was observed in cores from both TEGs, where it was common to see suspended, reticulate, layered, and isolated ice lens cryostructures either directly or 10–20 cm below the organic matter inclusion. This suggests that, when organic matter accumulated, the top of permafrost not only moved up due to the new material accumulating (syngenetic permafrost growth), but also because of the low thermal conductivity of organic matter compared to mineral sediment (Andersland and Ladanyi, 2004), which promoted ice enrichment in the layers below. Organic layers at depth also promoted ice enrichment in the mineral sediment above them by slowing down the progression of the thaw front and thus facilitating ice segregation.
The cryostratigraphy of the cores in undisturbed polygons (except TEG1-1Undist) reflected the conditions during permafrost formation, i.e. reticulate, layered, and suspended cryostructures forming in fine-grained aeolian sediment coupled with layers of organic layers promoting ice enrichment below them. Some of the cores in drained polygons (TEG1-3Drained, TEG2-1Drained, and TEG2-2Drained) also showed an ice-rich layer closer to the surface than in undisturbed polygons, which we attribute to permafrost aggradation after polygon drainage. Our TFD measurements at TEG1 showing shallower TFDs on the shoulders of the TEG are supported by Godin et al. (2016), who noted that drained polygons had a thinner active layer causing upward (syngenetic) permafrost aggradation, and by the results of Veillette (2019) showing general uplifting of the drained polygons along TEG2. In the slopes, the high values of TFD at TEG1 showed that, after formation of the TEG, the slopes experience greater thawing than in undisturbed conditions. This can be explained by the lack of vegetation protecting the ground surface from air convection and solar radiation, which, after vegetation colonization, is substantially reduced. This is supported by the TFD at TEG2, where the slopes have values similar to undisturbed conditions. The oblique streaks of bubbles and inclined ice layers indicated that the permafrost table moved up following an inclined plane likely parallel to the slope surface during permafrost aggradation. For the core at the bottom of the gully channel, the stratigraphy and cryostratigraphy suggest that, after the initial accumulation of coarser alluvial sediment, finer alluvial sediment accumulated relatively quickly, which led to rapid ice segregation.
Based on the types of cryostructure (e.g. suspended and well-developed reticulate) and their high VIC, we estimate that permafrost was able to re-aggrade relatively quickly and with sufficient water following stabilization of the TEG. We attribute this to the low permafrost temperatures of the study site (Allard et al., 2024), which promoted permafrost aggradation upward following TEG stabilization. There was ice enrichment in all sections affected by the TEG (drained, slope, and bottom of the gully channel), which led to ice contents similar to undisturbed conditions. Though there was no statistical difference in VICwa between the position of cores in the TEG, between the TEG or between the subsites, some patterns deserve attention. Firstly, looking at the cryostratigraphy beyond 1 m deep shows that re-aggradation of cold permafrost following a disturbance may lead to ice enrichment; i.e. the recovery from the disturbance may lead to more ice than initially. It is also possible that permafrost recovery leads to ice enrichment in more concentrated layers instead of throughout the entire permafrost column near the surface. However, new, deeper cores would be necessary to confirm this. Secondly, drainage of the polygons bordering the TEG could also cause ice enrichment, specifically near the surface. This could be a stabilization mechanism preventing further TEG enlargement. Finally, the slope cores had less peaty/organic material than at other positions because it was likely eroded away during the formation of the TEG. Although permafrost re-aggradation promoted ice enrichment in the mineral sediment, the slopes are now prone to greater thaw subsidence, as organic material requires an external load to cause thaw settlement comparable to mineral soil with similar VIC (Kanevskiy et al., 2012).
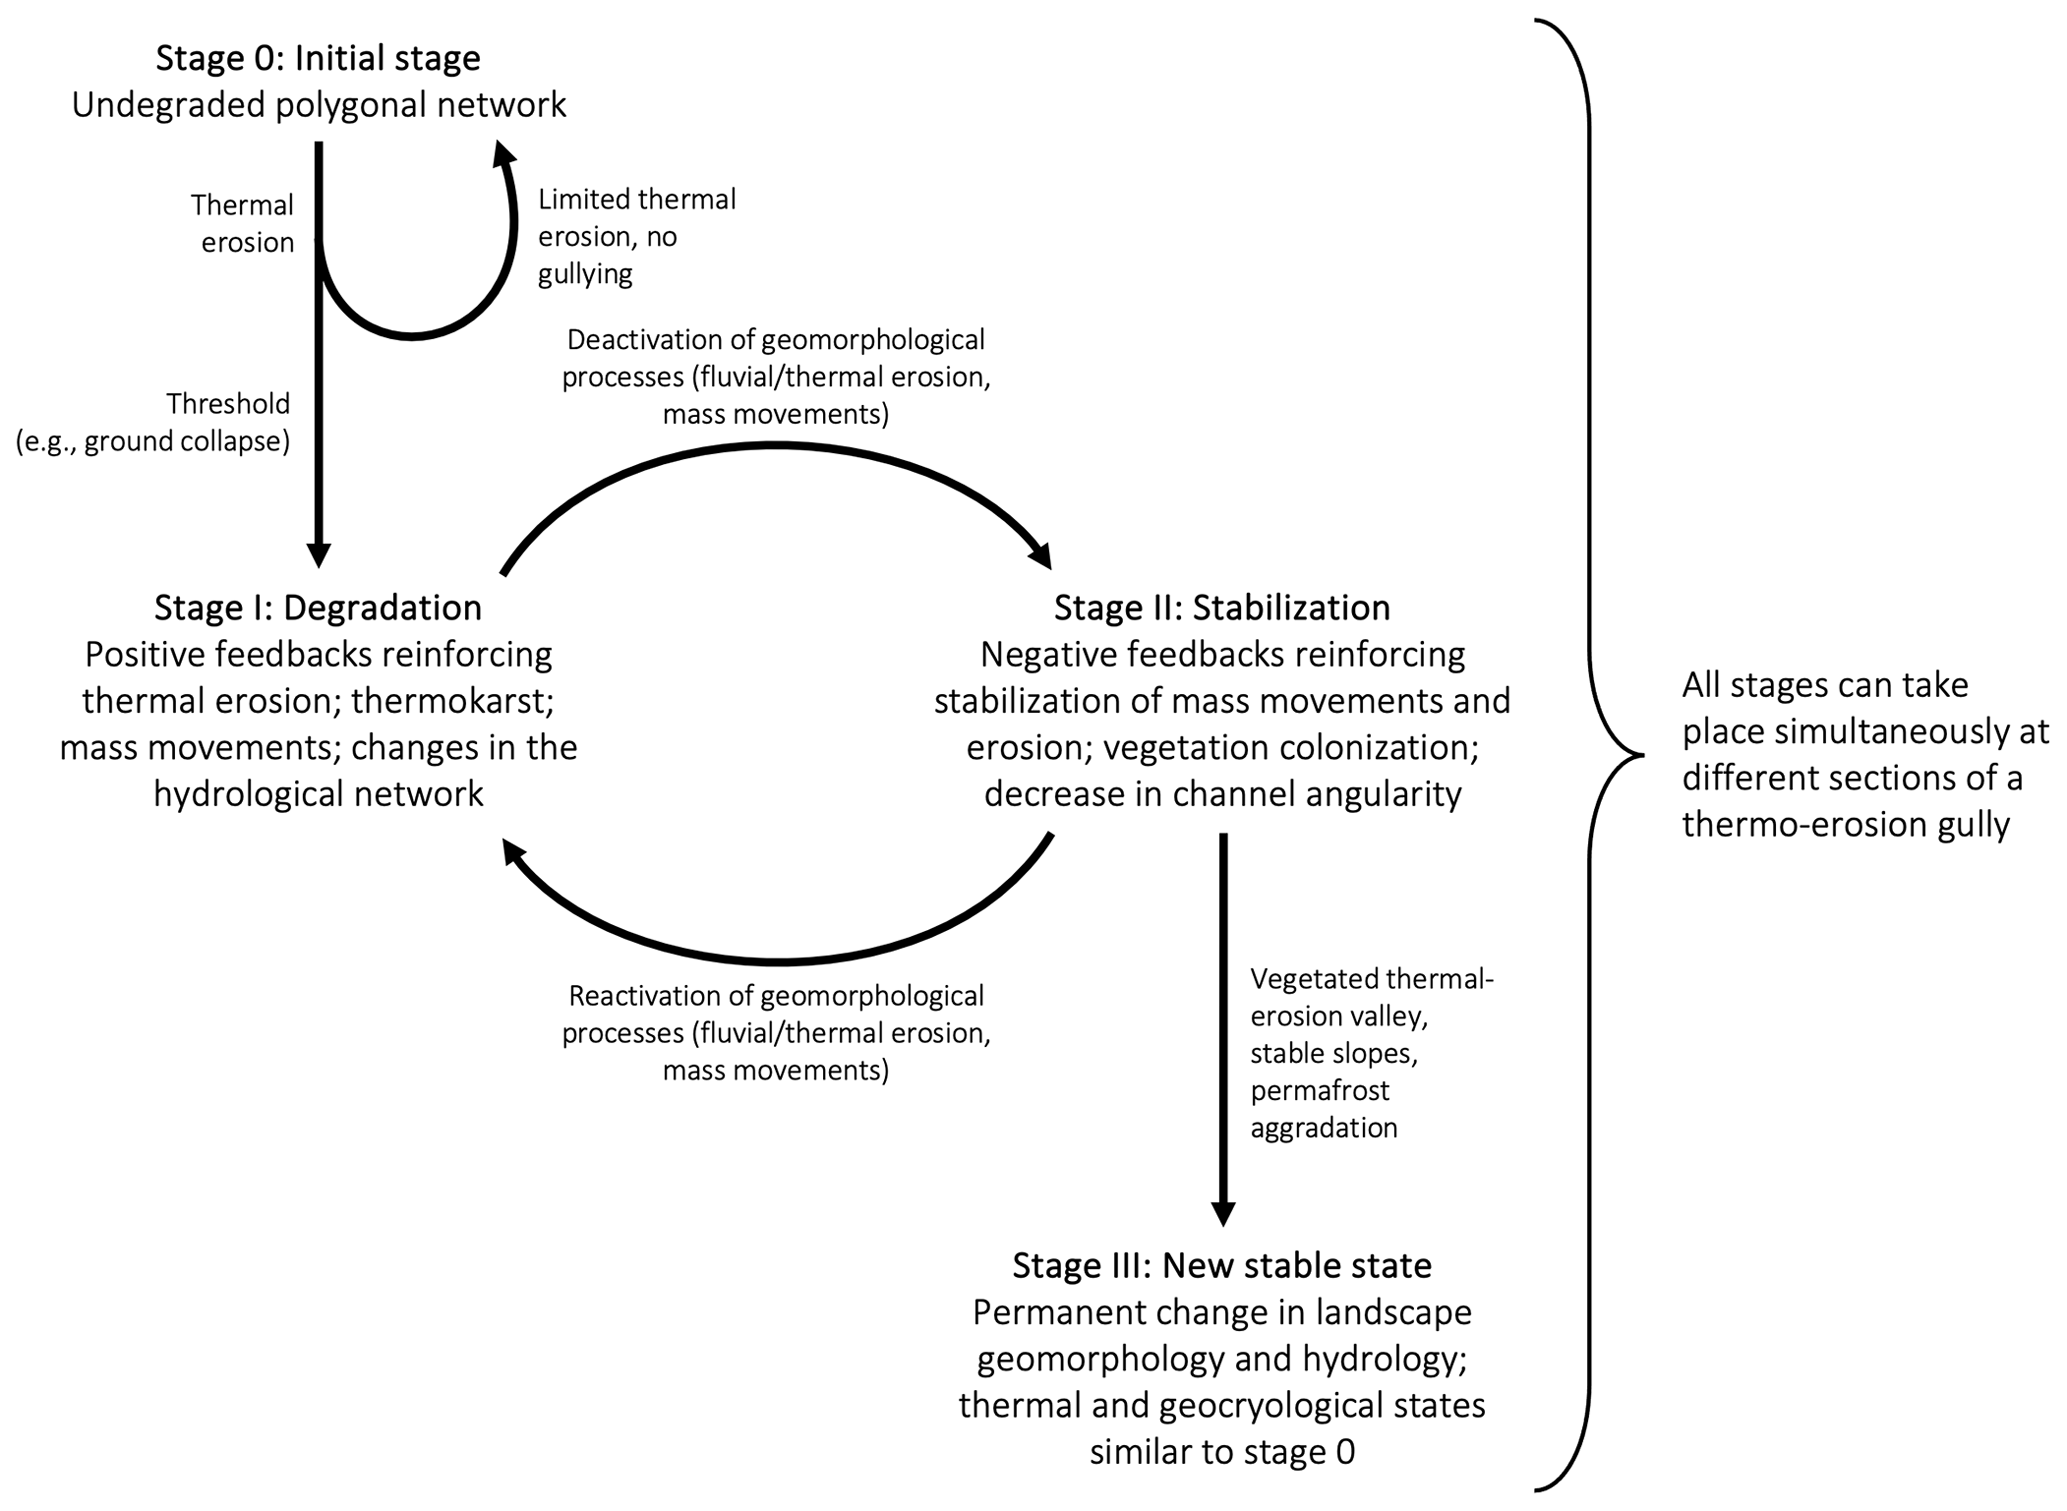
Figure 8Conceptual model of thermo-erosion gully (TEG) evolution in cold permafrost. At stage 0, the polygonal network has well-developed ice wedges that can withstand some thermal erosion, until a threshold is surpassed and causes a TEG to form. At stage I, the thermal regime and geomorphological processes are in disequilibrium, which causes high rates of degradation. As the TEG reaches new thermal, hydrological, and geomorphological equilibria, geomorphological processes slow down and stabilization begins. At stage II, stabilization takes place and the channel angularity gradually decreases. However, hydrological disturbances and changes in environmental conditions can reactivate geomorphological processes and cause further stage I degradation as the lack of a developed intermediate layer reduces the capacity of permafrost to withstand disturbances. If stabilization persists, the TEG enters a new state of the periglacial landscape. At stage III, the TEG is stabilized, and, even though the permafrost thermal regime and ground ice content have recovered to conditions similar to stage 0, the TEG has caused long-lasting geomorphological and hydrological changes to the landscape.
5.1.3 Geocryological layers
All cores were characterized by a transient layer, which we expected because it is the result of the interannual variations in the active-layer thickness and all sites experience it (French and Shur, 2010; Shur et al., 2005; Shur, 1988). Most of the cores were interpreted to have an intermediate layer, except for TEG1-1Undist and TEG1-1Slope. Those two cores were both characterized by coarser sediments than in other cores, resulting in higher hydraulic conductivities and therefore better drainage and less water available to form ice-rich ground layers. The average depth of the top of the intermediate layers from cores in drained polygons and slopes was shallower than in undisturbed conditions, especially in the slope cores, where the intermediate layers were also thicker. In drained polygons, this is consistent with the permafrost table moving up after the formation of a TEG causing drainage of the bordering polygons and their uplifting. For the slopes and TEG2BGC, the increased thickness of the combined transient and intermediate layers suggests that permafrost recovery following TEG stabilization can increase permafrost resilience to thawing compared to undisturbed conditions. They form a protective layer against annual thawing that would require a strong disturbance at the surface to be degraded (Kanevskiy et al., 2016, 2017) and thus contribute to the long-term stabilization of the TEG.
Finally, buried intermediate layers were interpreted in most of the TEG2 cores, but only in TEG1-2Undist, TEG1-2Slope, and TEG1-2Drained at TEG1. Those intermediate layers were interpreted as buried because they represented different sequences of permafrost aggradation. In most cases, the buried intermediate layers were located under a layer of organic sediment, which promoted ice enrichment in the mineral sediment below. Then, new mineral sediment accumulated over the organic layer and was part of the active layer, until organic matter started to accumulate again. This resulted in the gradual decrease in active-layer thickness, i.e. permafrost aggradation and formation of aggradational ice (Burn, 1988; French and Shur, 2010; Mackay, 1972), which led to the formation of a new intermediate layer in the mineral sediment below the newly accumulated organic matter.
5.2 Landscape evolution following thermo-erosion gullying
By investigating an active and a stable TEG in the High Arctic, we were able to identify and characterize the main processes of formation and stabilization of a TEG and the long-term impacts of thermal erosion in ice-rich polygonal tundra. We summarize these processes in a conceptual model describing three main stages of TEG formation and stabilization in our study area (Fig. 8). The following sections describe each stage in detail.
5.2.1 Stage 0: undisturbed polygonal network
In areas with cold continuous syngenetic permafrost where thick transient and intermediate layers have developed, permafrost is well protected against interannual climatic variations and meteorological events (Kanevskiy et al., 2017; Shur et al., 2005). Indeed, the infiltration of surface runoff water from snowmelt, summer precipitation, or thawing permafrost (French, 2017) into open thermal contraction cracks and other types of cavities, followed by the thermal erosion of permafrost and ice wedges, may occur on an annual basis but not necessarily lead to gullying (Fig. 8, Stage 0). The transient and intermediate layers act as buffers against disturbances due to the high latent heat of fusion of ice (Andersland and Ladanyi, 2004; Jorgenson et al., 2010), and cold permafrost promotes rapid recovery. However, a change in surface conditions (e.g. polygon drainage), a disturbance (e.g. heavy rainfalls, above average snow accumulation leading to increased snowmelt, and catastrophic lake drainage), or a shift in climate conditions (e.g. more precipitation and warmer air temperatures increasing permafrost temperature) can trigger additional runoff and increase the power of thermal erosion, eventually surpassing a threshold (e.g. tunnel collapse) and forming a TEG (Fig. 8, Stage I).
5.2.2 Stage I: degradation and disequilibrium
This first stage of thermo-erosion gullying is characterized by major geomorphic, hydrological, and thermal disequilibria. This transitional stage is unstable and undergoes rapid changes (years to decades) through positive feedbacks caused by thermal erosion of ice wedges and of the channel, thaw slumping, collapse of active-layer and tunnel overhangs, slope failure, and mudflows to reach a new equilibrium (Fortier et al., 2007; Godin et al., 2016; Godin and Fortier, 2012b). This translates into a box-shaped channel with unstable slopes and multiple ramifications, sometimes forming baydzherakhi. Thermal erosion also progresses vertically into ice wedges and permafrost until it reaches its base level or enough sediment is deposited at the bottom of the newly formed stream (French, 2017). Then, lateral thermal erosion occurs and contributes to enlarge the TEG channels (Morgenstern et al., 2021). Thermokarst mounds become increasingly affected by thermal erosion and thermokarst degradation due to the increased surface area when isolated and are eventually completely eroded from the main channel if erosion persists.
During this stage, sediment export is high because of the active erosion and collapsed material being remobilized downstream in low-gradient areas of the TEG channel (Godin and Fortier, 2012b; Rioux, 2020). The uncovered ground material in the TEG becomes exposed to solar radiation and atmospheric heat, which both contribute to erosion, even without running water (i.e. thermal erosion) (Fortier et al., 2007). In addition, the thaw front can penetrate deeper into permafrost due to the lack of protective cover, causing degradation of the transient and intermediate layers of the slopes and the bottom of the gully channel and leading to deepening and widening of the gully.
5.2.3 Stage II: stabilization and transition to a new state
While TEG inception can occur within a single thawing season, it often takes several decades for erosion, mass movement, thermokarst, and sediment export to decrease, at which point stabilization can begin (Fig. 8, Stage II). Over time, slope angularity of the TEG decreases (Godin and Fortier, 2010), which contributes to reduced mass movements. In addition, alluvial sediment deposited on the sides of main channel of the TEG can form alluvial levees that reduce gully wall mechanical erosion by water (Godin and Fortier, 2012b). As the slopes become stable and erosion winds down, permafrost re-aggradation takes place and vegetation starts to colonize exposed ground in the TEG. This creates a negative feedback on mass movement and promotes further permafrost aggradation by shielding the ground surface from incoming solar radiation and insulating it from atmospheric heat. The breaching and collapsing of the rims of the low-centred polygons encompassing the TEG also contribute to TEG stabilization by causing drainage of the active layer and of ponds in the polygons, i.e. decreasing soil moisture content (Godin and Fortier, 2012b; Godin et al., 2016). This creates a dry porous top layer with reduced thermal conductivity (Fortier et al., 2007), resulting in a thinning of the active layer on the shoulders of the gully. The drier conditions cause a shift in vegetation (Perreault et al., 2016, 2017), from wet to mesic, which also contributes to decreased thermal conductivity and active-layer thickness, resulting in thin transient and intermediate layers to form closer to the surface than in undisturbed conditions. This ice enrichment contributes to increasing the thermal resistance of the encompassing polygons and thus to reducing further widening of the TEG. Together, the accumulation of alluvial sediment, the growth of vegetation, and ice segregation lead to a decrease in the depth of the gully. It is important to note that not all sections of a TEG are at the same stage simultaneously and that sections of a TEG can go back and forth between stages I and II. Once the slopes of the TEG are vegetated and the gully no longer experiences erosion (decades to centuries), the permafrost environment supporting the TEG reaches a new state.
5.2.4 Stage III: new stable state of the periglacial landscape
The formation of a TEG has profound impacts on ice-wedge polygonal networks, permanently (at the Anthropocene timescale) altering landscape morphology (Fig. 8, Stage III). The stabilized TEG has now evolved into a thermo-erosional valley (Morgenstern et al., 2021) characterized by a broad, densely vegetated main channel with stable low-angle slopes and limited ramifications. Despite alluvial sedimentation at the bottom of the gully channel, the base level of the gully is now lower than the surrounding polygons, thus affecting local hydrological connectivity. Drainage in the troughs of the encompassing polygons toward the TEG has caused ice-wedge melt and stream incision, which has led to broadening of the troughs and lowering of the rims of the low-centred polygon (Mackay, 2000; French, 2017). As a result, the low-centred polygons along the margins of the TEG have changed into raised flat-/high-centred ones. The changes in their thermal properties caused a thinning of the active layer and ground ice aggradation, ultimately raising the polygons and further affecting local hydrological patterns (Liljedahl et al., 2016; Jones et al., 2023).
In this new state, the TEG has caused long-lasting geomorphological and hydrological changes to the landscape; i.e. the polygonal network will not recover to its pre-disturbance state. In comparison, the permafrost affected by the TEG can recover similar ground ice content and temperature as in undisturbed permafrost pre-dating the disturbance and is thus resilient. However, permafrost re-aggradation now leads to the formation of thicker intermediate layers in areas that have been the most disturbed, i.e. the slopes and bottom of the gully channel. Thermal contraction cracking can resume following the same pre-disturbance network, causing ice-wedge formation or rejuvenation (Gagnon and Allard, 2019; Lewkowicz, 1994). While permafrost shows resilience, the local landscape does not because it has surpassed thresholds of recovery to pre-disturbance conditions. From a landscape evolution perspective, this suggests that, in stable environmental conditions undergoing natural variability, permafrost is able to persist longer than the geomorphological landforms in which it forms. This adds to the stabilizing effect of thermal erosion on tundra landscapes, which levels gradients and limits thermokarst processes by enhancing hydrological connectivity (Morgenstern et al., 2021).
This study investigated the impacts of two TEGs in the Canadian High Arctic on ground ice content, cryostratigraphic patterns, and geomorphology to examine permafrost recovery following thermal erosion in ice-wedge polygonal tundra. Our results concurred with other research showing that thermal erosion affects hydrological connectivity, snow accumulation patterns, and snowmelt dynamics; changes vegetation; and causes the remobilization of soil material and nutrients. We showed that, once stabilized, TEGs permanently (at the Anthropocene scale) alter landscape morphology. In addition to the gully channel, the polygons bordering the TEGs evolved from wet, low-centred to dry, high-centred, causing changes in the ground thermal properties and ultimately leading to ice aggradation and raising the drained polygons encompassing the gully. This cryostratigraphic pattern, in addition to vegetation colonization and decrease in slope angularity, were interpreted as stabilization mechanisms leading to permafrost aggradation and TEG stabilization. The study also reported the first VIC values in the slopes and at the bottom of the gully channel of TEGs. Although the TEGs caused discernable cryostratigraphic patterns, the ice contents in the cores affected by the TEGs were comparable to undisturbed polygons. The presence of ice-rich geocryological layers and cold ground temperatures played a significant role in the inception and stabilization of the TEGs both by buffering against smaller disturbances and by promoting permafrost aggradation following thermal erosion. Once stabilized, the TEGs were in a new state characterized by long-lasting geomorphological and hydrological changes to the landscape but were able to recover to pre-disturbance geocryological and thermal conditions, showing that permafrost is more resilient to thermal erosion disturbances than surface geomorphology. This suggests that, in stable environmental conditions undergoing natural variability, permafrost can persist longer than the geomorphological landforms in which it forms.
The data that support the findings of this study are openly available on NordicanaD (https://doi.org/10.5885/45900CE-763A49F2D1F2442A, https://doi.org/10.5885/45903CE-33A7E0A483AD4C3D, Fortier et al., 2024a, b).
The supplement related to this article is available online at: https://doi.org/10.5194/tc-18-4743-2024-supplement.
SG: conceptualization, methodology, investigation, formal analysis, data curation, writing (original draft and review and editing), and visualization. DF: conceptualization, methodology, resources, writing (review and editing), supervision, and funding acquisition. ÉG: investigation, methodology, and writing (review and editing). AV: investigation.
The contact author has declared that none of the authors has any competing interests.
Publisher's note: Copernicus Publications remains neutral with regard to jurisdictional claims made in the text, published maps, institutional affiliations, or any other geographical representation in this paper. While Copernicus Publications makes every effort to include appropriate place names, the final responsibility lies with the authors.
We thank Karine Rioux and Stéphanie Coulombe for their help during fieldwork. We also thank the Centre for Northern Studies for providing access and logistical support to its research station. We are also grateful to Parks Canada; Fonds de recherche du Québec – Nature et technologies; the Northern Scientific Training Program; and the Polar Continental Shelf Program (PCSP).
This research has been supported by the Natural Sciences and Engineering Research Council of Canada.
This paper was edited by Anne Morgenstern and reviewed by Sebastian Wetterich and Go Iwahana.
Abbott, B. W., Jones, J. B., Godsey, S. E., Larouche, J. R., and Bowden, W. B.: Patterns and persistence of hydrologic carbon and nutrient export from collapsing upland permafrost, Biogeosciences, 12, 3725–3740, https://doi.org/10.5194/bg-12-3725-2015, 2015.
Allard, M.: Geomorphological Changes and Permafrost Dynamics: Key Factors in Changing Arctic Ecosystems. An Example from Bylot Island, Nunavut, Canada, Geosci. Can., 23, 205–212, 1996.
Allard, M., Sarrazin, D., and L'Hérault, E.: Borehole and near-surface ground temperatures in northeastern Canada, v. 1.6.0 (1988–2023), Nordicana, D8, https://doi.org/10.5885/45291SL-34F28A9491014AFD, 2024.
Andersland, O. B. and Ladanyi, B.: Frozen Ground Engineering, 2nd Edn., Wiley, 384 pp., ISBN 978-0-471-61549-1, 2004.
Are, F. E., V. T. Balobaev, and N. P. Bosikov: Characteristics of the reshaping of shorelines of thermokarst lakes of central Yakutia, Draft Transl., Cold Reg. Res. and Eng. Lab., U.S. Army Corps of Eng., Hanover, N. H., 711, 23 pp., 1979.
Black, R. F.: Ice-Wedge Polygons of Northern Alaska, in: Glacial Geomorphology, edited by: Coates, D. R., Springer, Dordrecht, https://doi.org/10.1007/978-94-011-6491-7_9, 1982.
Blott, S. J. and Pye, K.: GRADISTAT: a grain size distribution and statistics package for the analysis of unconsolidated sediments, Earth Surf. Process. Land., 26, 1237–1248, https://doi.org/10.1002/esp.261, 2001.
Bowden, W. B., Gooseff, M. N., Balser, A., Green, A., Peterson, B. J., and Bradford, J.: Sediment and nutrient delivery from thermokarst features in the foothills of the North Slope, Alaska: Potential impacts on headwater stream ecosystems: Thermokarst Impacts on Stream Ecosystems, J. Geophys. Res., 113, G02026, https://doi.org/10.1029/2007JG000470, 2008.
Burn, C. R.: The development of near-surface ground ice during the Holocene at sites near Mayo, Yukon Territory, Canada, J. Quaternary Sci., 3, 31–38, https://doi.org/10.1002/jqs.3390030106, 1988.
Burn, C. R.: Cryostratigraphy, paleogeography, and climate change during the early Holocene warm interval, western Arctic coast, Canada, Can. J. Earth Sci., 34, 912–925, https://doi.org/10.1139/e17-076, 1997.
Calmels, F. and Allard, M.: Ice segregation and gas distribution in permafrost using tomodensitometric analysis, Permafrost Periglac., 15, 367–378, https://doi.org/10.1002/ppp.508, 2004.
Centre d'études nordiques: Climate station data from Bylot Island in Nunavut, Canada, v. 1.11 (1992–2019), Nordicana, D2, https://doi.org/10.5885/45039SL-EE76C1BDAADC4890, 2022.
Chapin, F. S., Kofinas, G. P., and Folke, C. (Eds.): Principles of Ecosystem Stewardship: Resilience-Based Natural Resource Management in a Changing World, Springer New York, https://doi.org/10.1007/978-0-387-73033-2, 2009.
Coulombe, S., Fortier, D., Lacelle, D., Kanevskiy, M., and Shur, Y.: Origin, burial and preservation of late Pleistocene-age glacier ice in Arctic permafrost (Bylot Island, NU, Canada), The Cryosphere, 13, 97–111, https://doi.org/10.5194/tc-13-97-2019, 2019.
Environment and Climate Change Canada: Climatic data of Pond Inlet, Nunavut, 1991–2020, Environment and Climate Change Canada, https://climate.weather.gc.ca/climate_normals/ (last access: 11 October 2024), 2024.
Folk, R. L. and Ward, W. C.: Brazos River bar [Texas]; a study in the significance of grain size parameters, J. Sediment. Res., 27, 3–26, https://doi.org/10.1306/74D70646-2B21-11D7-8648000102C1865D, 1957.
Fortier, D. and Allard, M.: Late Holocene syngenetic ice-wedge polygons development, Bylot Island, Canadian Arctic Archipelago, Can. J. Earth Sci., 41, 997–1012, https://doi.org/10.1139/E04-031, 2004.
Fortier, D. and Allard, M.: Frost-cracking conditions, Bylot Island, eastern Canadian Arctic archipelago, Permafrost Periglac., 16, 145–161, https://doi.org/10.1002/ppp.504, 2005.
Fortier, D., Allard, M., and Pivot, F.: A late-Holocene record of loess deposition in ice-wedge polygons reflecting wind activity and ground moisture conditions, Bylot Island, eastern Canadian Arctic, The Holocene, 16, 635–646, https://doi.org/10.1191/0959683606hl960rp, 2006.
Fortier, D., Allard, M., and Shur, Y.: Observation of rapid drainage system development by thermal erosion of ice wedges on Bylot Island, Canadian Arctic Archipelago, Permafrost Periglac., 18, 229–243, https://doi.org/10.1002/ppp.595, 2007.
Fortier, D., Gagnon, S., Veillette, A., and Godin, É.: Soil properties and computed tomography scans (CT-scans) of two thermo-erosion gullies and the adjacent tundra polygons on Bylot Island, Nunavut, Canada, v. 1.0 (2013–2016), Nordicana D135 (1.0) [data set], https://doi.org/10.5885/45900CE-763A49F2D1F2442A, 2024a.
Fortier, D., Gagnon, S., Veillette, A., and Godin, É.: Thaw front depth at the bottom, on the slopes and on the adjacent tundra polygons of two thermo-erosion gullies on Bylot Island, Nunavut, Canada, (2017–2018). Nordicana D134 (1.0) [data set], https://doi.org/10.5885/45903CE-33A7E0A483AD4C3D, 2024b.
French, H. and Shur, Y.: The principles of cryostratigraphy, Earth-Sci. Rev., 101, 190–206, https://doi.org/10.1016/j.earscirev.2010.04.002, 2010.
French, H. M.: The periglacial environment, 4th Edn., Wiley, Blackwell, Hoboken, NJ, 544 pp., ISBN 978-1-119-13278-3, 2017.
Gagnon, S. and Allard, M.: Changes in ice-wedge activity over 25 years of climate change near Salluit, Nunavik (northern Québec, Canada), Permafrost Periglac., 31, 69–84, https://doi.org/10.1002/ppp.2030, 2019.
Gagnon, S. and Allard, M.: Geomorphological controls over carbon distribution in permafrost soils: the case of the Narsajuaq river valley, Nunavik (Canada), Arctic Sci., 6, 509–528, https://doi.org/10.1139/as-2019-0026, 2020.
Gilbert, G. L., Kanevskiy, M., and Murton, J. B.: Recent Advances (2008–2015) in the Study of Ground Ice and Cryostratigraphy: Recent Advances in the Study of Ground Ice and Cryostratigraphy, Permafrost and Periglac., 27, 377–389, https://doi.org/10.1002/ppp.1912, 2016.
Godin, E. and Fortier, D.: Geomorphology of thermo-erosion gullies – case study from Bylot Island, Nunavut, Canada, Proceedings of GEO 2010 Calgary 63rd Canadian Geotechnical Conference & 6th Canadian Permafrost Conference, Calgary, AB, Canada, 2010, https://doi.org/10.13140/2.1.4498.9120, 2010.
Godin, E. and Fortier, D.: Fine Scale Spatio-Temporal Monitoring of Multiple Thermo-Erosion Gullies Development on Bylot Island, Eastern Canadian Archipelago, Proceedings of the Tenth International Conference on Permafrost (TICOP), Salekhard, Russia, 125–130, The Northern Publisher, ISBN 978-5-905911-01-9, 2012a.
Godin, E. and Fortier, D.: Geomorphology of a thermo-erosion gully, Bylot Island, Nunavut, Canada, Can. J. Earth Sci., 49, 979–986, https://doi.org/10.1139/e2012-015, 2012b.
Godin, E., Fortier, D., and Coulombe, S.: Effects of thermo-erosion gullying on hydrologic flow networks, discharge and soil loss, Environ. Res. Lett., 9, 105010, https://doi.org/10.1088/1748-9326/9/10/105010, 2014.
Godin, E., Fortier, D., and Lévesque, E.: Nonlinear thermal and moisture response of ice-wedge polygons to permafrost disturbance increases heterogeneity of high Arctic wetland, Biogeosciences, 13, 1439–1452, https://doi.org/10.5194/bg-13-1439-2016, 2016.
Goudie, A. (Ed.): Encyclopedia of Geomorphology, Routledge: International Association of Geomorphologists, London; New York, Routledge, 2 pp., ISBN 9780415863001, 2004.
Grosse, G., Schirrmeister, L., Kunitsky, V. V., and Hubberten, H.-W.: The use of CORONA images in remote sensing of periglacial geomorphology: an illustration from the NE Siberian coast, Permafrost Periglac., 16, 163–172, https://doi.org/10.1002/ppp.509, 2005.
Grosse, G., Schirrmeister, L., and Malthus, T. J.: Application of Landsat-7 satellite data and a DEM for the quantification of thermokarst-affected terrain types in the periglacial Lena–Anabar coastal lowland, Polar Res., 25, 51–67, https://doi.org/10.3402/polar.v25i1.6238, 2006.
Inland Waters Branch: Glacier Atlas of Canada, Bylot Island area, 46201, Inland Waters Branch, Ottawa, ON, Canada, 1969.
Jones, E. L., Hodson, A. J., Redeker, K. R., Christiansen, H. H., Thornton, S. F., and Rogers, J.: Biogeochemistry of low- and high-centered ice-wedge polygons in wetlands in Svalbard, Permafrost Periglac., 34, 359–369, https://doi.org/10.1002/ppp.2192, 2023.
Jongejans, L. L., Strauss, J., Lenz, J., Peterse, F., Mangelsdorf, K., Fuchs, M., and Grosse, G.: Organic matter characteristics in yedoma and thermokarst deposits on Baldwin Peninsula, west Alaska, Biogeosciences, 15, 6033–6048, https://doi.org/10.5194/bg-15-6033-2018, 2018.
Jorgenson, M. T., Romanovsky, V., Harden, J., Shur, Y., O'Donnell, J., Schuur, E. A. G., Kanevskiy, M., and Marchenko, S.: Resilience and vulnerability of permafrost to climate change, Can. J. Forest Res., 40, 1219–1236, https://doi.org/10.1139/X10-060, 2010.
Kanevskiy, M., Shur, Y., Fortier, D., Jorgenson, M. T., and Stephani, E.: Cryostratigraphy of late Pleistocene syngenetic permafrost (yedoma) in northern Alaska, Itkillik River exposure, Quaternary Res., 75, 584–596, https://doi.org/10.1016/j.yqres.2010.12.003, 2011.
Kanevskiy, M., Shur, Y., Connor, B., Dillon, M., Stephani, E., and O'Donnell, J.: Study of the Ice-Rich Syngenetic Permafrost for Road Design (Interior Alaska), Tenth International Conference on Permafrost, Boulders, Colorado, US, The Northern Publisher, 191–196, ISBN 978-5-905911-01-9, 2012.
Kanevskiy, M., Shur, Y., Jorgenson, M. T., Ping, C.-L., Michaelson, G. J., Fortier, D., Stephani, E., Dillon, M., and Tumskoy, V.: Ground ice in the upper permafrost of the Beaufort Sea coast of Alaska, Cold Reg. Sci. Technol., 85, 56–70, https://doi.org/10.1016/j.coldregions.2012.08.002, 2013.
Kanevskiy, M., Jorgenson, T., Shur, Y., O'Donnell, J. A., Harden, J. W., Zhuang, Q., and Fortier, D.: Cryostratigraphy and Permafrost Evolution in the Lacustrine Lowlands of West-Central Alaska: Cryostratigraphy and Permafrost Evolution in the Lacustrine Lowlands, Alaska, Permafrost Periglac., 25, 14–34, https://doi.org/10.1002/ppp.1800, 2014.
Kanevskiy, M., Shur, Y., Walker, D., Buchhorn, M., Jorgenson, T., Matyshak, G., Raynolds, M., Peirce, J., and Wirth, L.: Evaluation of Risk of Ice-Wedge Degradation, Prudhoe Bay Oilfield, AK, in: Eleventh International Conference on Permafrost – Book of abstracts, Potsdam, Germany, Bibliothek Wissenschaftspark Albert Einstein, 999–1001, https://doi.org/10.2312/GFZ.LIS.2016.001, 2016.
Kanevskiy, M., Shur, Y., Jorgenson, T., Brown, D. R. N., Moskalenko, N., Brown, J., Walker, D. A., Raynolds, M. K., and Buchhorn, M.: Degradation and stabilization of ice wedges: Implications for assessing risk of thermokarst in northern Alaska, Geomorphology, 297, 20–42, https://doi.org/10.1016/j.geomorph.2017.09.001, 2017.
Kokelj, S. V. and Jorgenson, M. T.: Advances in Thermokarst Research: Recent Advances in Research Investigating Thermokarst Processes, Permafrost Periglac., 24, 108–119, https://doi.org/10.1002/ppp.1779, 2013.
Lacelle, D., Bjornson, J., and Lauriol, B.: Climatic and geomorphic factors affecting contemporary (1950–2004) activity of retrogressive thaw slumps on the Aklavik Plateau, Richardson Mountains, NWT, Canada: Climatic and Geomorphic Factors affecting Thaw Slump Activity, Permafrost Periglac., 21, 1–15, https://doi.org/10.1002/ppp.666, 2010.
Lachenbruch, A. H.: Mechanics of Thermal Contraction Cracks and Ice-Wedge Polygons in Permafrost, in: Geological Society of America Special Papers, Geol. Soc. Am., 70, 1–66, https://doi.org/10.1130/SPE70-p1, 1962.
Lantz, T. C. and Kokelj, S. V.: Increasing rates of retrogressive thaw slump activity in the Mackenzie Delta region, N.W.T., Canada, Geophys. Res. Lett., 35, L06502, https://doi.org/10.1029/2007GL032433, 2008.
Lara, M. J., McGuire, A. D., Euskirchen, E. S., Tweedie, C. E., Hinkel, K. M., Skurikhin, A. N., Romanovsky, V. E., Grosse, G., Bolton, W. R., and Genet, H.: Polygonal tundra geomorphological change in response to warming alters future CO 2 and CH 4 flux on the Barrow Peninsula, Glob. Change Biol., 21, 1634–1651, https://doi.org/10.1111/gcb.12757, 2015.
Levy, J. S., Head, J. W., and Marchant, D. R.: The role of thermal contraction crack polygons in cold-desert fluvial systems, Antarctic Sci., 20, 565–579, https://doi.org/10.1017/S0954102008001375, 2008.
Lewkowicz, A. G.: Ice-wedge rejuvenation, Fosheim Peninsula, Ellesmere Island, Canada, Permafrost Periglac., 5, 251–268, https://doi.org/10.1002/ppp.3430050405, 1994.
Liljedahl, A., Hinzman, L., Busey, R., and Yoshikawa, K.: Physical short-term changes after a tussock tundra fire, Seward Peninsula, Alaska, J. Geophys. Res., 112, F02S07, https://doi.org/10.1029/2006JF000554, 2007.
Liljedahl, A. K., Boike, J., Daanen, R. P., Fedorov, A. N., Frost, G. V., Grosse, G., Hinzman, L. D., Iijma, Y., Jorgenson, J. C., Matveyeva, N., Necsoiu, M., Raynolds, M. K., Romanovsky, V. E., Schulla, J., Tape, K. D., Walker, D. A., Wilson, C. J., Yabuki, H., and Zona, D.: Pan-Arctic ice-wedge degradation in warming permafrost and its influence on tundra hydrology, Nat. Geosci., 9, 312–318, https://doi.org/10.1038/ngeo2674, 2016.
Mackay, J. R.: The World of Underground Ice, Ann. Assoc. Am. Geogr., 62, 1–22, 1972.
Mackay, J. R.: Thermally induced movements in ice-wedge polygons, western arctic coast: a long-term study, Geogr. Phys. Quater., 54, 41–68, https://doi.org/10.7202/004846ar, 2000.
Matsuoka, N., Christiansen, H. H., and Watanabe, T.: Ice-wedge polygon dynamics in Svalbard: Lessons from a decade of automated multi-sensor monitoring, Permafrost Periglac., 29, 210–227, https://doi.org/10.1002/ppp.1985, 2018.
Maxwell, J. B.: The climate of the Canadian Arctic islands and adjacent waters/Le climat des îles arctiques et des eaux adjacentes du canada, Environment Canada, Atmospheric Environment Service, ISBN 0660506416, 1980.
McRoberts, E. C. and Nixon, J. F.: Reticulate Ice Veins in Permafrost, Northern Canada: Discussion, Can. Geotech. J., 12, 159–162, https://doi.org/10.1139/t75-017, 1975.
Minke, M., Donner, N., Karpov, N., de Klerk, P., and Joosten, H.: Patterns in vegetation composition, surface height and thaw depth in polygon mires in the Yakutian Arctic (NE Siberia): a microtopographical characterisation of the active layer: Micro Scale Mapping of Low-centre Ice-wedge Polygons, Permafrost Periglac., 20, 357–368, https://doi.org/10.1002/ppp.663, 2009.
Morgenstern, A., Overduin, P. P., Günther, F., Stettner, S., Ramage, J., Schirrmeister, L., Grigoriev, M. N., and Grosse, G.: Thermo-erosional valleys in Siberian ice-rich permafrost, Permafrost Periglac., 32, 59–75, https://doi.org/10.1002/ppp.2087, 2021.
Murton, J. B.: 8.14 Ground Ice and Cryostratigraphy, in: Treatise on Geomorphology, Elsevier, 173–201, https://doi.org/10.1016/B978-0-12-374739-6.00206-2, 2013.
Murton, J. B. and French, H. M.: Cryostructures in permafrost, Tuktoyaktuk coastlands, western arctic Canada, Can. J. Earth Sci., 31, 737–747, https://doi.org/10.1139/e94-067, 1994.
Olefeldt, D., Goswami, S., Grosse, G., Hayes, D., Hugelius, G., Kuhry, P., McGuire, A. D., Romanovsky, V. E., Sannel, A. B. K., Schuur, E. A. G., and Turetsky, M. R.: Circumpolar distribution and carbon storage of thermokarst landscapes, Nat. Commun., 7, 13043, https://doi.org/10.1038/ncomms13043, 2016.
O'Neill, H. B. and Christiansen, H. H.: Detection of Ice Wedge Cracking in Permafrost Using Miniature Accelerometers, J. Geophys. Res.-Earth, 123, 642–657, https://doi.org/10.1002/2017JF004343, 2018.
Paquette, M., Fortier, D., and Lamoureux, S. F.: Cryostratigraphical studies of ground ice formation and distribution in a High Arctic polar desert landscape, Resolute Bay, Nunavut, Can. J. Earth Sci., 59, 759–771, https://doi.org/10.1139/cjes-2020-0134, 2022.
Perreault, N., Lévesque, E., Fortier, D., and Lamarque, L. J.: Thermo-erosion gullies boost the transition from wet to mesic tundra vegetation, Biogeosciences, 13, 1237–1253, https://doi.org/10.5194/bg-13-1237-2016, 2016.
Perreault, N., Lévesque, E., Fortier, D., Gratton, D., and Lamarque, L. J.: Remote sensing evaluation of High Arctic wetland depletion following permafrost disturbance by thermo-erosion gullying processes, Arctic Sci., 3, 237–253, https://doi.org/10.1139/as-2016-0047, 2017.
Phillips, J. D.: Changes, perturbations, and responses in geomorphic systems, Prog. Phys. Geogr., 33, 17–30, https://doi.org/10.1177/0309133309103889, 2009.
Piégay, H., Chabot, A., and Le Lay, Y.-F.: Some comments about resilience: From cyclicity to trajectory, a shift in living and nonliving system theory, Geomorphology, 367, 106527, https://doi.org/10.1016/j.geomorph.2018.09.018, 2020.
Rioux, K.: Impacts de la dégradation du pergélisol par thermo-érosion sur les processus hydrologiques et les flux de matières, Master’s thesis, Université de Montréal, Montréal, QC, Canada, 83 pp., https://hdl.handle.net/1866/25456 (last access: 11 October 2024), 2020.
Sarrazin, D. and Allard, M.: The thermo-mechanical behavior of frost-cracks over ice wedges: new data from extensometer measurements, in: Proceedings of the 68th Canadian Geotechnical Conference and 7th Canadian Permafrost Conference, Quebec City, Canada, 7 pp., 2015.
Shur, Y., Hinkel, K. M., and Nelson, F. E.: The transient layer: implications for geocryology and climate-change science, Permafrost Periglac., 16, 5–17, https://doi.org/10.1002/ppp.518, 2005.
Shur, Y., Jones, B. M., Kanevskiy, M., Jorgenson, T., Jones, M. K. W., Fortier, D., Stephani, E., and Vasiliev, A.: Fluvio-thermal erosion and thermal denudation in the yedoma region of northern Alaska: Revisiting the Itkillik River exposure, Permafrost Periglac., 32, 277–298, https://doi.org/10.1002/ppp.2105, 2021.
Shur, Y. L.: The upper horizon of permafrost soils, in: Proceedings of the Fifth International Conference on Permafrost, Fifth International Conference on Permafrost, Trondheim, Norway, Tapir Publishers, 867–871, ISBN 82-519-0863-9, 1988.
Smith, S. L. and Burgess, M. M.: A digital database of permafrost thickness in Canada,Geological Survey of Canada, OpenFile 4173, https://doi.org/10.4095/213043, 2002.
Strauss, J., Schirrmeister, L., Grosse, G., Wetterich, S., Ulrich, M., Herzschuh, U., and Hubberten, H.: The deep permafrost carbon pool of the Yedoma region in Siberia and Alaska, Geophys. Res. Lett., 40, 6165–6170, https://doi.org/10.1002/2013GL058088, 2013.
Tanguy, R., Whalen, D., Prates, G., Pina, P., Freitas, P., Bergstedt, H., and Vieira, G.: Permafrost degradation in the ice-wedge tundra terrace of Paulatuk Peninsula (Darnley Bay, Canada), Geomorphology, 435, 108754, https://doi.org/10.1016/j.geomorph.2023.108754, 2023.
Thévenin, E.: Les lithalses: étude d'un pergélisol marginal en dégradation dans la vallée Ä'ä ?y Chù, au Sud-Ouest du Yukon, Master’s thesis, Université de Montréal, Montréal, QC, Canada, https://hdl.handle.net/1866/32471 (last access: 11 October 2024), 2023.
Thoms, M. C., Piégay, H., and Parsons, M.: What do you mean, `resilient geomorphic systems'?, Geomorphology, 305, 8–19, https://doi.org/10.1016/j.geomorph.2017.09.003, 2018.
Toniolo, H., Kodial, P., Hinzman, L. D., and Yoshikawa, K.: Spatio-temporal evolution of a thermokarst in Interior Alaska, Cold Reg. Sci. Technol., 56, 39–49, https://doi.org/10.1016/j.coldregions.2008.09.007, 2009.
Turetsky, M. R., Abbott, B. W., Jones, M. C., Anthony, K. W., Olefeldt, D., Schuur, E. A. G., Grosse, G., Kuhry, P., Hugelius, G., Koven, C., Lawrence, D. M., Gibson, C., Sannel, A. B. K., and McGuire, A. D.: Carbon release through abrupt permafrost thaw, Nat. Geosci., 13, 138–143, https://doi.org/10.1038/s41561-019-0526-0, 2020.
Ulrich, M., Hauber, E., Herzschuh, U., Härtel, S., and Schirrmeister, L.: Polygon pattern geomorphometry on Svalbard (Norway) and western Utopia Planitia (Mars) using high-resolution stereo remote-sensing data, Geomorphology, 134, 197–216, https://doi.org/10.1016/j.geomorph.2011.07.002, 2011.
Veillette, A.: Stabilisation du paysage périglaciaire suite à un épisode de ravinement par thermo-érosion: implication pour la structure et la stabilité thermique du pergélisol de surface, Master’s thesis, Université de Montréal, Montréal, QC, Canada, 91 pp., https://hdl.handle.net/1866/22507 (last access: 11 October 2024), 2019.