the Creative Commons Attribution 4.0 License.
the Creative Commons Attribution 4.0 License.
 | 17 Oct 2024
Land cover succession for recently drained lakes in permafrost on the Yamal Peninsula, Western Siberia
Clemens von Baeckmann
Annett Bartsch
Helena Bergstedt
Aleksandra Efimova
Barbara Widhalm
Dorothee Ehrich
Timo Kumpula
Alexander Sokolov
Svetlana Abdulmanova
Drained lake basins (DLBs) are dominant features in lowland permafrost landscapes of the Arctic. Here, we present a novel approach describing and quantifying the succession progression of recently drained basins using a land cover unit retrieval scheme developed specifically for the Arctic tundra biome. The complementarity between land cover units and Normalized Difference Vegetation Index (NDVI) analyses is shown. Land cover units were linked to DLB ages (years passed since a drainage event occurred). The data were divided into bioclimate subzones, and the land cover units were grouped according to their characteristics, first related to vegetation and second to wetness gradients (dry, moist and wet). Regression analyses of NDVI values and fraction of each land cover unit group provided the justification for the utility of the units in our research. The regression results showed the highest correlation with NDVI values for the wetness group “Moist” and the vegetation group “Shrub Tundra” (R2=0.458 and R2=0.444). There was no correlation (R2=0.066) between NDVI and the fraction of the “Wet” group. The inconsistency in the association between those variables underlines the need to complement NDVI analyses with a scheme representing wetness, such as the use of land cover units to describe changes in wetland areas. Finally, our results showed different trajectories in the succession of land cover units in recently drained lake basins with respect to different bioclimate subzones. Remaining water in the basin after a lake drainage event was highest for the most southern subzone (median 6.28 %). The open water fraction dropped below 1 % for all subzones after 5 to 10 years since drainage. The results of this study contribute to an improved understanding of DLB land cover change in permafrost environments and to a better knowledge base of these unique and critically important landforms.
- Article
(9399 KB) - Full-text XML
-
Supplement
(603 KB) - BibTeX
- EndNote


Arctic permafrost regions are undergoing drastic disturbances as a result of climate variability, leading to widespread and unprecedented landscape disturbances (IPCC, 2022). Common Arctic permafrost landscape transformations, such as retrogressive thaw slumps, coastal erosion and drained lake basins, are of a gradual and abrupt nature and range from the plot scale to the landscape scale, which is a regional to circumpolar phenomenon (Turetsky et al., 2020). Warming induces the thawing of ice-rich permafrost landscapes, triggering the release of critical greenhouse gases such as methane and carbon dioxide into the atmosphere through decomposition (Turetsky et al., 2020; Manasypov et al., 2022; Schuur et al., 2022). Additionally, warming permafrost triggers the formation of characteristic landforms (i.e. polygon-shaped features) and can be defined as a process of the disturbance of the thermal equilibrium of the ground (Jones et al., 2011). Closed depressions filled with water, formed by the settling of the ground caused by the thermal-induced process, are called thermokarst lakes, and their formation and drainage cycles can span thousands of years. These are common features covering 50 % to 75 % of permafrost lowlands in parts of Alaska, Siberia and Canada (Jones et al., 2022). The distribution of thermokarst lakes, drained lake basins (DLBs) and the associated cycles (formation and drainage) differs between areas of different ground-ice content and between regions (subarctic, Arctic and high Arctic). The resulting mosaic provides a unique habitat for both flora and fauna. The lakes are crucial for wildlife and reindeer herders, both when full and drained (Kumpula et al., 2011; Laptander et al., 2024). When full, they provide essential water sources and support diverse ecosystems (Laptander et al., 2024). However, late freezing of lakes can delay reindeer migration, causing herders to move reindeer to winter pastures later than in previous decades (Kumpula et al., 2012; Laptander et al., 2024). Early snowmelt and unsafe ice cover can further complicate migration and increase the risk of avalanches and floods. When drained, the lakes create new grazing areas with abundant and diverse vegetation, attracting reindeer in the summer. This vegetation succession offers rich pastures but may pose health risks to reindeer due to unfamiliar plant species (Laptander et al., 2024). Arctic landscapes are widely influenced by DLBs and their role in the geomorphological, hydrological and ecological development in these regions (Jorgenson and Shur, 2007). The drainage of thermokarst lakes is a long-existing phenomenon in many lowland permafrost regions prone to thermokarst landforms, with DLBs of several thousand years of age present among existing lakes and recently drained basins. Studies suggest that the frequency of drainage events has been increasing with climate change (Smith et al., 2005; Carroll et al., 2011; Kanevskiy et al., 2013; Nitze, 2018; Nitze et al., 2020; Arp et al., 2023; Chen et al., 2023).
Lake changes and drainage processes can be observed using remote sensing methods. For example, the change in water area due to shrinking, expanding and disappearing of the surface water has been observed using a multitude of different satellite-based sensors as multiple studies showed (Grosse et al., 2013; Karlsson et al., 2014; Nitze et al., 2020; Bergstedt et al., 2021; Jones et al., 2022; Bartsch et al., 2023a). Monitoring lake drainage requires separation of open water from land area. Detecting previously drained lakes requires spatial data analyses to identify relevant depressions and gain knowledge about land surface hydrology changes and vegetation succession trajectories. Disappearing lakes were previously reported specifically for the southern part (Smith et al., 2005; Nitze, 2018). Central Yamal is known for rising temperatures and changes associated with unusually warm summers (thaw slumps, active layer deepening, etc.; Babkina et al., 2019; Bartsch et al., 2019a). The whole region has been shown to be a hot spot of thaw-lake change (Nitze, 2018).
The land cover in lake basins changes due to the decrease in open water area and the establishment of vegetation communities. Drained lake basins become sites for plant communities with high biomass and productivity, peat accumulation, and permafrost aggradation, and they are critical areas for the carbon cycle (Grosse et al., 2013; Göckede et al., 2019; Loiko et al., 2020; Bergstedt et al., 2021; Jones et al., 2022; Manasypov et al., 2022). Permafrost thaw often increases soil moisture and lake extent, generally enhancing CH4 emissions (Schuur et al., 2022; Treat et al., 2024). In contrast, lake drainage significantly alters permafrost and greenhouse gas emissions by reducing soil moisture and changing hydrology, leading to decreased CH4 emissions (Treat et al., 2024). However, predicting CO2 and CH4 fluxes is complex due to spatial variability in vegetation, soil carbon stocks and geomorphology across the permafrost domain. Additionally, distinguishing between wetlands and lakes in remote sensing data remains challenging, risking double counting of emission sources (Treat et al., 2024). Chen et al. (2021) and Liu et al. (2023) have used the Normalized Difference Vegetation Index (NDVI) to detect vegetation productivity and changes in DLBs. This popular spectral index is calculated by using the ratios between the red and near-infrared parts of the electromagnetic spectrum. An analysis of land cover succession in recently drained lake basins has not been addressed yet. One of the reasons is that the generation of land cover data requires a specialized approach tailored to the unique characteristics of Arctic landscapes and vegetation communities (Bartsch et al., 2016). Land cover classifications in permafrost regions are used, especially for upscaling of soil properties and fluxes (Bartsch et al., 2023a). The Circumpolar Arctic Vegetation Map (CAVM; Walker et al., 2005) provides detailed information for vegetation communities but at a comparably coarse spatial resolution (1 km). Bartsch et al. (2024) presented a novel approach of land cover characterization (10 m nominal resolution), with representation of moisture gradients and vegetation physiognomy, making it uniquely suitable for the analysis of DLBs. Actual land cover information can be potentially used for flux upscaling and studies that focus on habitat changes. The approach depends, however, on the fusion of Sentinel-1 and Sentinel-2 data, both Copernicus satellite missions, with availability limited to 2016 onwards. Several regions with frequent lake drainage have been identified previously. For example, Nitze (2018) investigated regions in Alaska, Eastern Siberia and Western Siberia. The last region includes the Yamal Peninsula, which is subject to a multitude of different environmental changes over the past 50 years, caused by both climate change and direct impacts of anthropogenic activity (Kumpula et al., 2010, 2011, 2012). Abundant lakes and DLBs in parts of Yamal create terrain which is important both as habitat and unique grazing ground for the local reindeer-herding community. Changes in the landscape influence those habitats and affect the local biodiversity (Kumpula et al., 2011, 2012).
Overall, NDVI analyses have been shown to provide valuable information on vegetation recovery after lake drainage. However, an approach representing changes in wetness is lacking. New land cover description schemes using recent satellite observations can provide relevant information and may thus complement NDVI analyses.
The aim of this study was to investigate the impacts of lake drainage on land cover change across the Yamal Peninsula, specifically focusing on the change in wetness gradients and vegetation composition. As vegetation growth is climate dependent, different bioclimate subzones were considered.
2.1 The Yamal Peninsula
The Yamal Peninsula (Western Siberia) has undergone numerous environmental changes over the years and encompasses multiple bioclimate subzones (Fig. 1). The peninsula is oriented north–south with a length of 780 km, covering a biogeographical gradient from the forest tundra to the high Arctic. The Yamal Peninsula is located in the northwestern part of the West Siberian Plain. The highest peak on the peninsula is at about 80 m elevation (Kumpula et al., 2012). Discontinuous and continuous permafrost are present in this region (Fig. 1). The permafrost fraction increases to the north on the Yamal Peninsula (Obu et al., 2021). Many land surface changes are associated with permafrost warming in this transition zone (Babkina et al., 2019). Yamal is covered by different tundra vegetation communities, thaw lakes, wetlands and river floodplains. The peninsula has the second-highest lake and drained lake basin coverage (78 %), following only the Yukon–Kuskokwim Delta (Jones et al., 2022). Drained thaw-lake basins differ from the surrounding areas in vegetation composition and permafrost conditions, introducing additional heterogeneity into the tundra landscape (Jones et al., 2022) and impacting habitat availability for both flora and fauna. Drained thaw-lake basins differ across the regions of Yamal in their size and abundance. Wetlands are the dominant landscape type throughout the region. Low erect shrub willow (Salix) is abundant on Yamal Peninsula and covers valleys and slopes (Kumpula et al., 2012; Leibman et al., 2015). The Vaskiny Dachi research station is situated in central Yamal, in bioclimate subzone D, and extensive slope processes have been are continuously monitored, including cryogenic landslides, since 1989 (Leibman et al., 2015).
One of the world's largest gas deposits is located in this region of Yamal. Human activity is not just limited to gas infrastructure projects, but extensive reindeer herding serves as the main traditional land use form. Nomadic reindeer herders, the Nenets, move annually between winter pastures at the treeline and the northern tundra, which exposes them to impacts associated with gas exploration and production activities (Kumpula et al., 2010; Volkovitskiy and Terekhina, 2023; Spiegel et al., 2023).
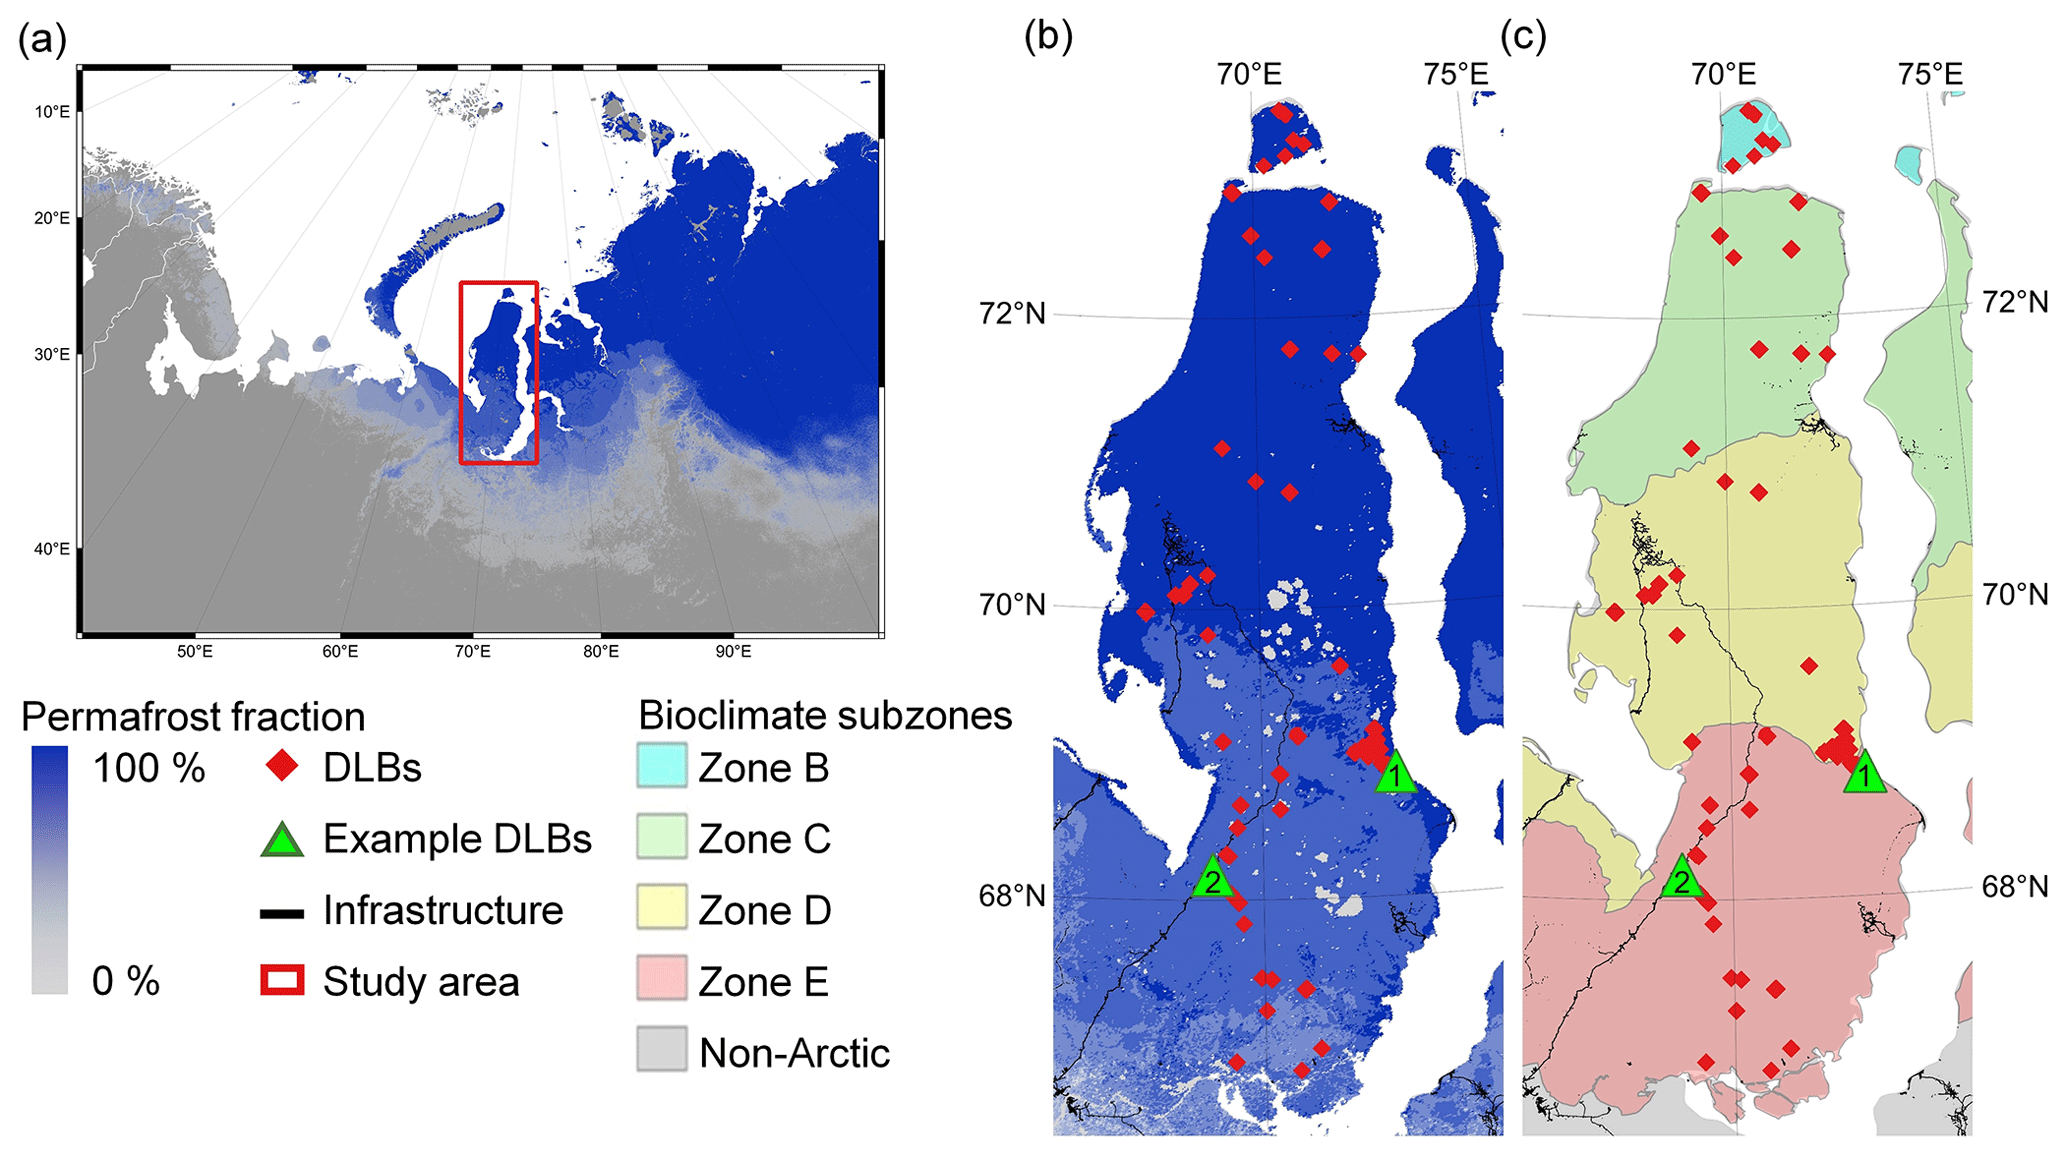
Figure 1Study area characteristics: (a) location of the study site (red rectangle), (b) permafrost fraction (data source: Obu et al., 2021) and (c) bioclimate subzones, with subzones ((B) Arctic tundra – northern variant, (C) Arctic tundra – southern variant, (D) Northern hypo-Arctic tundra and (E) Southern hypo-Arctic tundra) (data source: Walker et al., 2005). Infrastructure information is shown in black (data source: Bartsch et al., 2023b). Green triangles with the numbers “1” and “2” represent locations of the examples introduced in this study (1 is the DLB time series, 2 is the in situ data).
The temperature gradient over the study area represented in the bioclimate subzones is shown in Fig. A1 as monthly means. Precipitation is on average around 300 mm annually. In winter, snow accumulates up to 30 cm thick on flat surfaces; in some areas on the leeward slopes and in the valleys, it can accumulate up to several metres (6 m) (Leibman et al., 2015).
2.2 Data
This study utilized data from the Sentinel missions, part of Europe's Copernicus programme operated by the European Commission (EC) and the European Space Agency (ESA). We used the radar and the multispectral high-resolution acquisitions from Sentinel-1 and Sentinel-2.
2.2.1 Sentinel data
Sentinel-1 is a radar imaging mission using C-band synthetic aperture radar (SAR) and is operating during day and night (ESA, 2012). There are two operational, polar-orbiting satellites which use an identical C-band SAR sensor (Schubert et al., 2017):
-
Sentinel-1A, launched on 3 April 2014, and
-
Sentinel-1B, launched on 25 April 2016 (mission ended in 2021).
The satellites provide all-weather imagery of earth's surface. They orbit 180° apart, allowing for a 6 d revisiting period. However, the revisiting period varies and is only 12 d for most Arctic regions. For this study, we used data acquired in VV polarization (vertically emitted and vertically received), which is most sensitive to rough surface scattering caused from water or bare soil. Data availability in recent years is, however, limited for the Yamal region due to the failure of Sentinel-1B in 2021.
Sentinel-2 is a multispectral high-resolution imaging mission and is monitoring on 13 different spectral bands. There are two operational, polar-orbiting satellites (ESA, 2015):
-
Sentinel-2A, launched on 23 June 2015, and
-
Sentinel-2B, launched on 7 March 2017.
Both satellites are identical and operate in the same orbit. They provide a resolution of up to 10 m (depending on the spectral band) and achieve a 5 d revisit period when used in combination.
2.2.2 Auxiliary data
Daily temperature data, required for Sentinel-1 scene selection, were obtained from the ERA5-Land dataset by the Copernicus Climate Change Service (C3S) at the European Centre for Medium-Range Weather Forecasts (ECMWF). This fifth generation of atmospheric reanalysis data for global climate parameters covers a period from 1940 up to the present. It combines model data with observation data merged into a global dataset which is consistent over time (Hersbach et al., 2020). The data were downloaded via the Climate Data Store (CDS) portal. Air temperature data at 2 m above the surface were used for the selection of Sentinel-1 scene observations from the “ERA5 hourly data on single levels from 1940 to present” dataset. The spatial resolution is a 30×30 km grid in the horizontal (Hersbach et al., 2020).
Pre-drainage lake extent was derived using the Landsat product published by Nitze et al. (2018), adopted from the Hot Spot Regions of Permafrost Change (“Hot Spot Product”) by Nitze (2018). This trend dataset was generated using the following spectral indices: Tasseled Cap (TC) Brightness, Greenness, and Wetness; NDVI; Normalized Difference Moisture Index (NDMI); and Normalized Difference Water Index (NDWI). The indices provide information on surface properties, such as albedo, vegetation or moisture/water on the earth’s surface (Nitze, 2018). The main data source for the calculations was taken from the Landsat time-series stacks supplied by the United States Geological Survey (USGS). Data between the years 1999 and 2014 were used to calculate the slope and intercept parameters via the robust Theil–Sen regression algorithm. Only data for the peak summer season (July, August) were taken from the Landsat archive. The resolution of the dataset is 30 m. The final product extends over several regions in the Arctic: Western Siberia, Eastern Siberia, Alaska and eastern Canada. The study region in Western Siberia covers the whole Yamal Peninsula and was used for our study. Data were available as geospatial vector files for 218 882 individual lakes. For each of the lakes, certain attributes were given. This included the following: “Area at start of observation” (1999) (in ha), “Area at end observation” (2014) (in ha), “Net lake area change” (in ha) and “Net lake area change” in percent.
Bioclimatic zones were obtained from the Circumpolar Arctic Vegetation Map (CAVM; Walker et al., 2005), which was developed by vegetation experts. It offers plant community information north of the treeline and distinguishes between 16 classes. This widely used land cover product provides additional information including the dataset for different bioclimate subzones in the Arctic regions. This sub-dataset on bioclimate subzones separates the Arctic into five different zones. The boundaries are based on phytogeographic subzones (the geographic distribution of plant species) based on recent information from numerous sources (Raynolds et al., 2019). On a gradient from north to south, there is an increase in corresponding vascular plant size, coverage, abundance, productivity and species richness. In the coldest parts, fewer than 50 vascular species which form plant communities regarding their number of plants in local floras are available. They increase to more than 500 species in the southern zones near the treeline (Raynolds et al., 2019).
-
Subzone B, “Arctic tundra – northern variant”: historic mean July temperatures are about 3–5 °C, and woody plants first occur as prostrate (creeping) dwarf shrubs and increase in stature to hemiprostrate dwarf shrubs (< 15 cm tall);
-
Subzone C, “Arctic tundra – southern variant”: historic mean July temperatures reach about 5–7 °C, and erect dwarf shrubs (< 40 cm tall) and hemiprostrate dwarf shrubs (< 15 cm tall) are present;
-
Subzone D, “Northern hypo-Arctic tundra”: historic mean July temperatures are about 7–9 °C, and low shrubs (40–200 cm tall) and erect dwarf shrubs (< 40 cm tall) are present; and
-
Subzone E, “Southern hypo-Arctic tundra”: mean July temperature range about 9–12 °C, and low shrubs (40–200 cm tall) are present. Woody shrubs are abundant and reach up to 2 m in height closer to the treeline, where the historic mean July temperatures are between 10 and 12 °C.
Bartsch et al. (2024) focused on a static land cover product based on Sentinel-1 and Sentinel-2, targeting consistency at the circumpolar scale. Here, we focused on time series of selected DLBs for 2016 onwards. To tackle the issue of data availability in the years before, a space-for-time concept was applied. In a first step, a database of recently drained lakes was created based on the Landsat trend product (Nitze et al., 2018). The trends were used for identification of potentially drained lakes before the availability of Sentinel-1 and Sentinel-2, between 1999 and 2014, to facilitate the space-for-time assessment. The basin ages were determined using the change in the water area and the corresponding land cover year. In a second step, cloud-free Sentinel-2 images were used to identify drainage events from 2016 onwards and the calculation for the corresponding basin ages for events after 2015 (basin ages younger than 2015) until the year 2022. Land cover units were derived using Sentinel-1 and Sentinel-2 data, adapting the method described by Bartsch et al. (2024). The land cover units were grouped by vegetation type as well as wetness gradients. In situ data collected within DLBs were utilized to justify the grouping of the wetness gradients. NDVI was obtained from Sentinel-2 in addition. In a final step, the land cover and NDVI data were combined with the drainage age database covering the years before 2015 to enable the space-for-time assessment.
3.1 Lake selection and age determination
A first selection of potential DLB objects was carried out using the Landsat product by Nitze (2018). Lakes with at least 50 % of drainage were considered in the following processing. The main focus was on the lake position to cover all present bioclimate subzones on the Yamal Peninsula. A second filtering was done via visual inspection to exclude falsely detected DLBs caused by, for example, flood-plain-related water area change. Lakes were also excluded when no drainage age could be detected. This is likely due to refilling, unclear drainage or when the lake drained before 1984. The determination of the drainage year and the removing of the falsely detected DLBs were done by visual inspection of the actual Landsat acquisitions. Google Earth Pro Historical Landsat Timelapse imagery data were used for each selected object on a timeline starting from 1984. A different method was used for lakes which drained between 2015 and 2022. The land cover unit “Water” (no. 1, as defined in Bartsch et al., 2024) was investigated based on annual classifications of Sentinel-1 and Sentinel-2. The focus was on areas that are not classified as “Water” for the following year. Inspection of the original Sentinel-2 acquisitions was performed, and the basin was excluded when the described conditions occurred. The Landsat dataset provided the corresponding maximum lake extent (water area extent in 1999) for consistency, and the DLB was included in our database. The DLB age is the difference between the year of the used land cover and the year when the drainage event took place. Only DLBs with a maximum water extent (status before drainage) of larger than 0.01 km2 were considered.
3.2 Sentinel-1 and Sentinel-2 pre-processing
3.2.1 Sentinel-1
The Sentinel-1 interferometric wide (IW) swath mode data were downloaded from the Copernicus open-access hub. Only vertically transmitted and vertically received (VV) polarization information was used following the scheme of Bartsch et al. (2024). The effect of temperature on the backscatter data (Bergstedt et al., 2018; Bartsch et al., 2023a) was minimized by using acquisitions only within a certain ground temperature range derived using reanalysis data (ERA5). The defined temperature window ranged from −10 to 0 °C. To exclude the influence of soil moisture dynamics on the backscatter during unfrozen conditions, only data with temperatures below the freezing point were used. The minimum temperature was defined at −10 °C, because colder temperatures would result in higher backscatter as expected (Bergstedt et al., 2018). The Sentinel-1 processing was done using the SNAP toolbox provided by ESA. The steps included the following: applying precise orbit information, thermal noise removal, calibration, orthorectification using the Copernicus digital elevation model (DEM) at 90 m resolution, conversion to decibel (dB) values and normalization (Widhalm et al., 2018). The Sentinel-1 data acquired during frozen conditions represent surface roughness in tundra regions and complements the information contained in the Sentinel-2 bands.
3.2.2 Sentinel-2
The Sentinel-2 data were downloaded as the top-of-atmosphere (TOA) level-1C product and processed to bottom-of-atmosphere (BOA) level-2A product. Atmospheric, terrain and cirrus corrections were performed using the Sen2Core processor toolbox from ESA. We then processed the data with a super-resolution approach using Dsen2 (Lanaras et al., 2018) for the Sentinel-2 bands to utilize their multispectral capabilities due to the different spatial resolutions (bands B03, B04, and B08 at 10 m and bands B11 and B12 at 20 m). The tool Dsen2 (Lanaras et al., 2018) outperformed simpler up-sampling methods as it preserved spectral characteristics (Bartsch et al., 2024). The main difference to other upscaling methods was that a convolutional neural network was used. Clouds were masked using the scene classification map (SCM) from the Sen2Core product on the upscaled version.
3.3 NDVI, land cover and regression calculation
The NDVI was calculated on the BOA values. The changes in NDVI values were associated with the loss of water area (negative NDVI values) and colonization of vegetation (positive NDVI values) in the basin. The yearly NDVI data were masked for open water bodies using the corresponding land cover product for each year during the investigated time period (2015–2022).
A supervised maximum likelihood classification was performed on the processed Sentinel-1 and Sentinel-2 data. Five spectral bands were utilized from the Sentinel-2 satellite data: band 3 (green) at 10 m spatial resolution, band 4 (red) at 10 m, band 8 near-infrared (NIR) at 10 m, band 11 shortwave infrared (SWIR) at 20 m and band 12 (SWIR) at 20 m. Acquisitions between July and August were selected to cover the middle growing season for vegetation. The units for the supervised classification were originally derived from a k-means unsupervised classification done by Bartsch et al. (2019b) on a 100 km wide and 1400 km long transect in Western Siberia (along the 70° meridian, from 61 to 74° N). For this study, we used the updated scheme from Bartsch et al. (2024), also referred to as CALU (circumarctic land cover units).
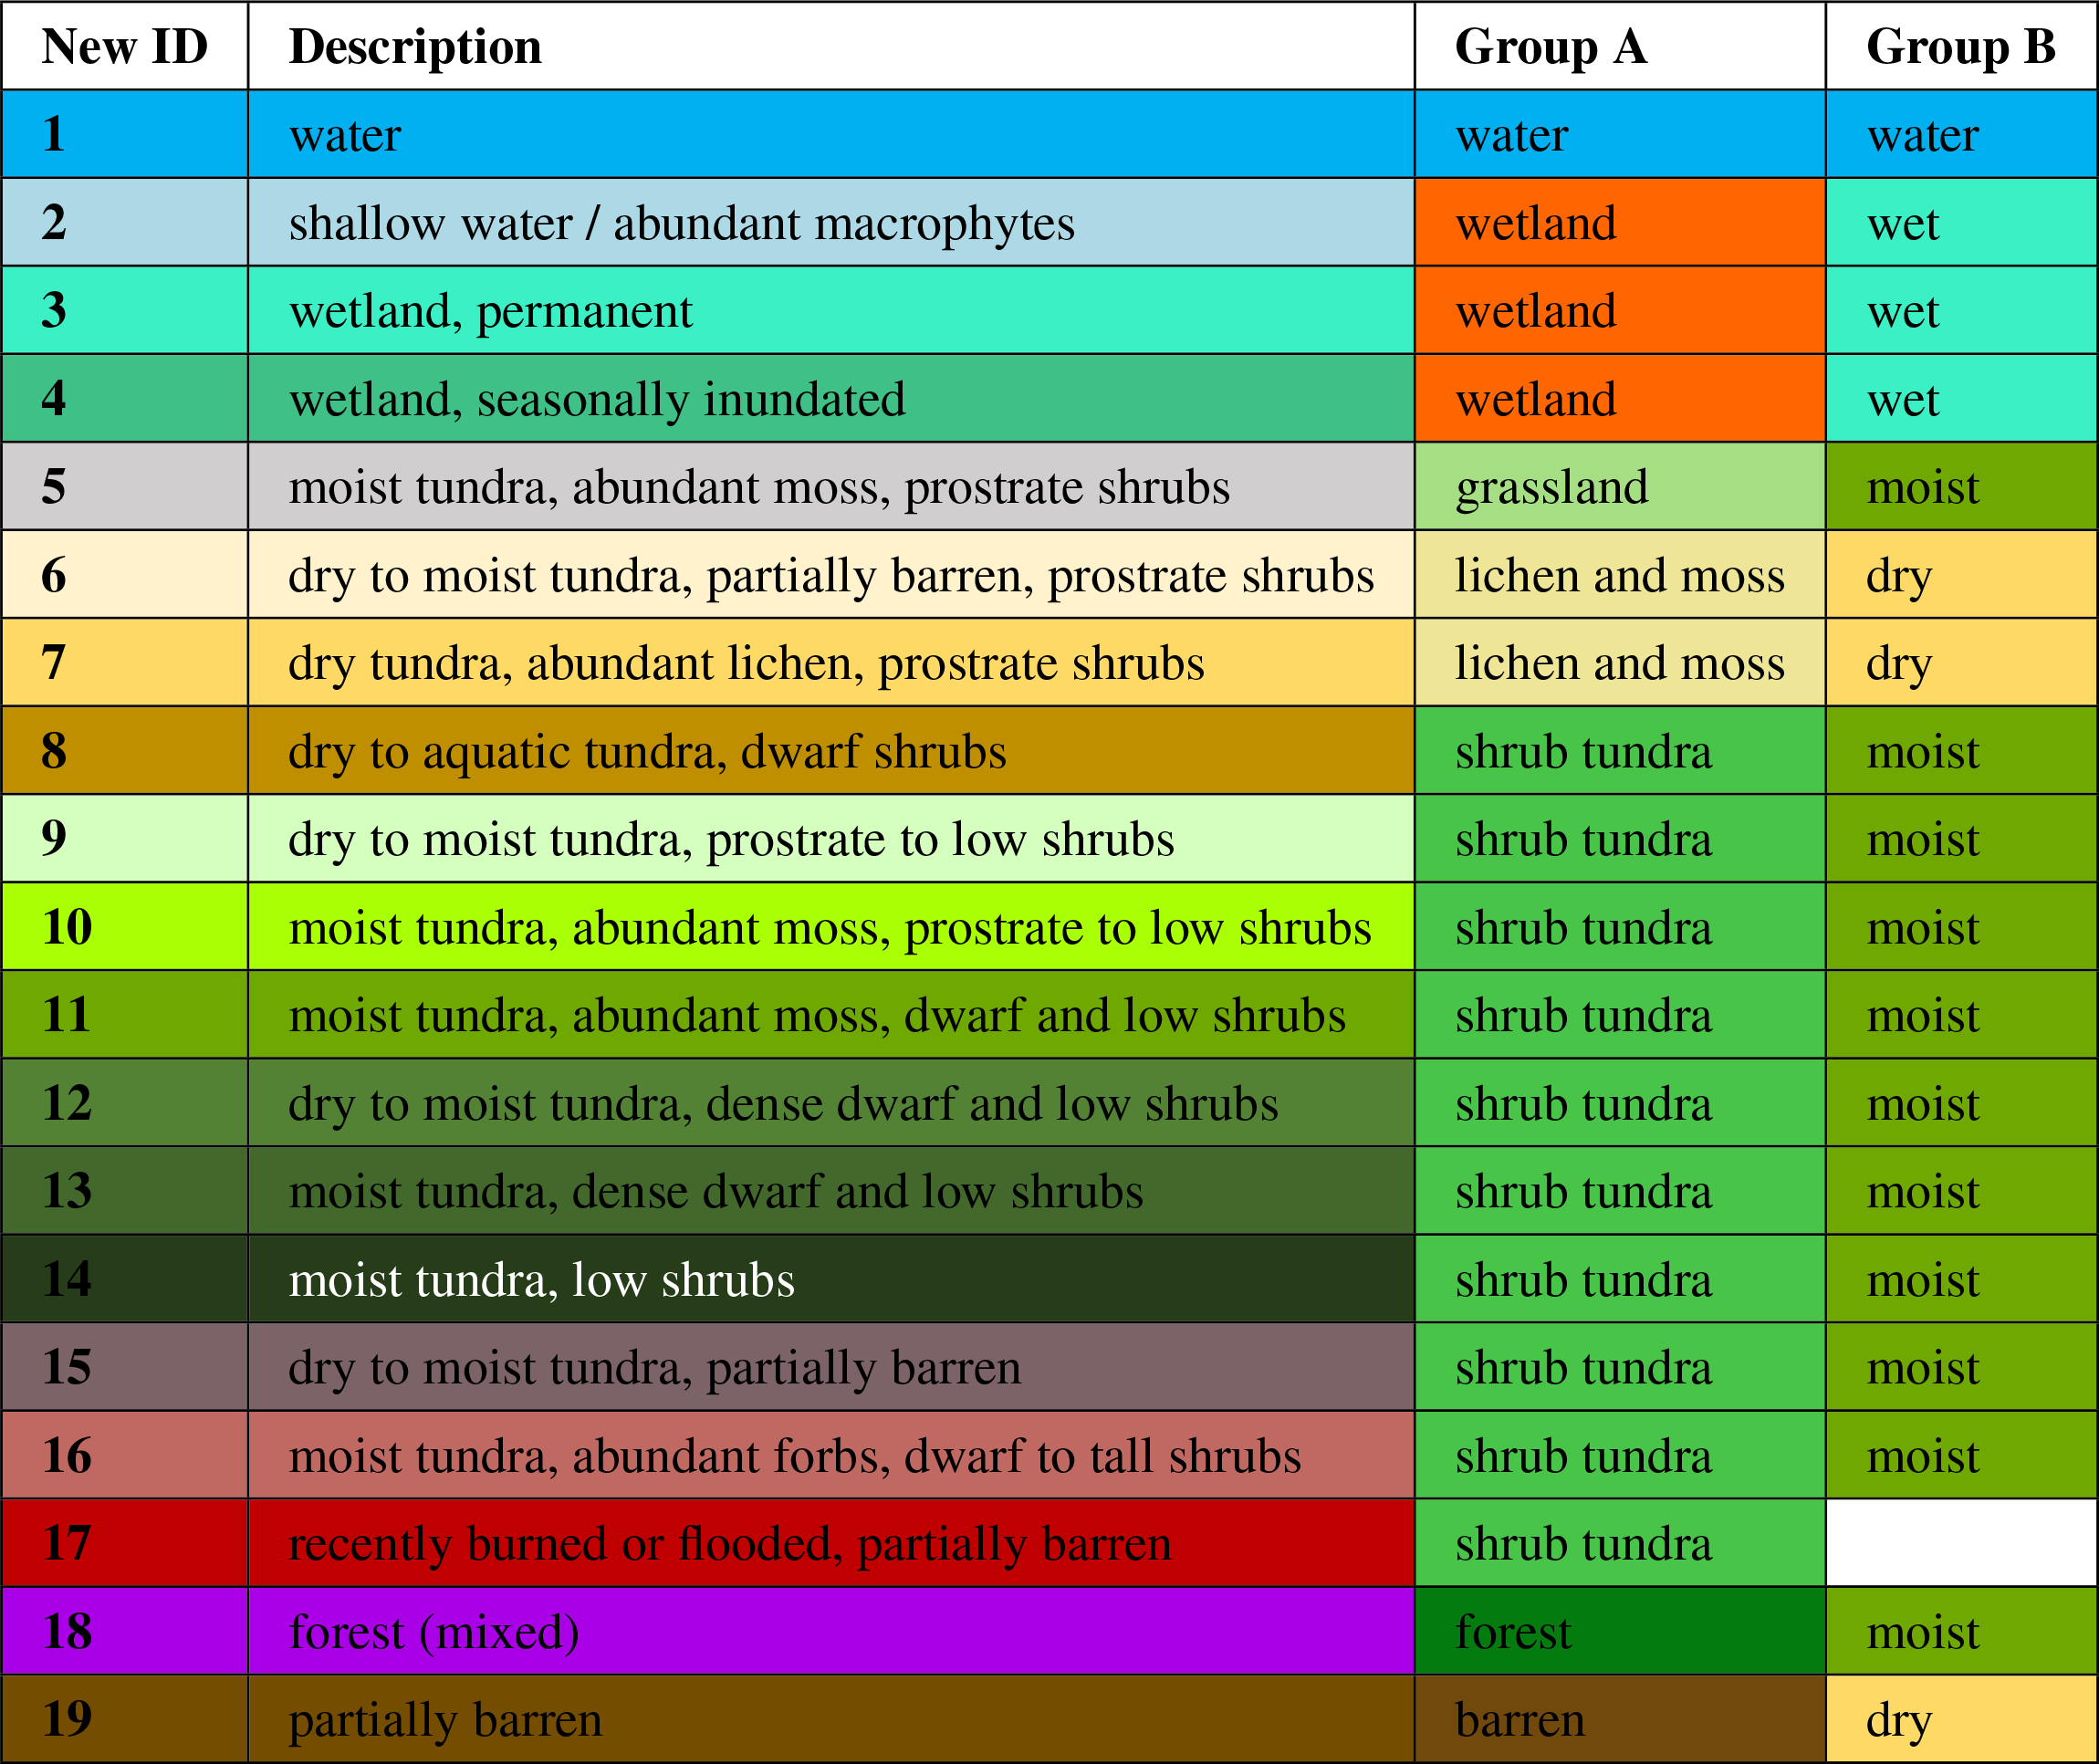
In a final step, the separation into the different land cover units from the CALU product was modified (Table 1). “Shadow” was often misclassified over lakes due to lower values in the spectral bands. The land cover unit “Water” (no. 1) was therefore merged with “Other, shadow” (no. 23) into one “Water” unit no. 1. The original CALU approach used three different input images from Sentinel-2 for robustness of the retrieval (e.g. handling potential haze, failure of cloud masking). Only one input image from Sentinel-2 was used to keep the temporal information on each year in our approach. The naming, colouring and the grouping for the land cover units followed Bartsch et al. (2024). Two groups were introduced, combining vegetation units and to distinguish between wetness gradients (Table 1):
-
Group A. Seven different units focusing on vegetation assessment considering shrub types.
-
Group B. Four different wetness gradients according to their wet–dry conditions. The forest units and the no. 1 unit “Water” were also included in addition to the original grouping. The “Recently burned or flooded, partially barren” land cover unit no. 17 was not considered.
The wetness gradients (Group B) were assessed with in situ data to justify the differentiation in this study.
Table 1Legend for the land cover units based on Bartsch et al. (2024) and grouping schemes. The original IDs 18, 19 and 20 (representing different forest types) were merged into the new ID 18. The original ID 21 is now ID 19.
The basins were analysed separately with respect to the bioclimate subzones. A buffer area of 1 km extent was derived based on the maximum water extent and was referred to as the “peripheral area”. A regression analysis was carried out for the NDVI values (dependent variable) and the fraction for the units of group A and B (independent variable).
3.4 In situ data collection
In situ vegetation information was collected in a drained lake basin on 26 July in 2016 (for location, see Fig. 1). Vegetation cover was recorded in eight 2×2 m sampling plots arranged along a transect extending from the edge of the old DLB to the open water (Fig. S1 in the Supplement). The plots were chosen to represent different vegetation assemblages. Coverage was recorded visually for the most important plant groups (e.g. forbs, shrubs) or genera (Salix, Eriophorum; see Table A1 for all recorded categories). The vegetation of the drained area was also documented with pictures. The featured lake had water level fluctuations since at least 1984. The recent basin was formed during a drainage event around 2010. The soil of the basin is clay. Some litter was found in the sample areas as well. Total vegetation cover was 80 % or above at the date of the fieldwork.
4.1 Basins and age
In total, 51 different recently drained basins were identified and analysed. The selected DLB events ranged from 1998 (one event) till 2021 (also one event). Most drainage events were detected in 2019 (15 events); 13 drainage events were included in the database for occurrences before 2015, and 28 events were included after 2015. The open water extent (before drainage) ranged between 0.02 and 6.88 km2. The number of available lakes strongly varied for each of the bioclimate subzones. Six recently drained basins were selected in bioclimate subzone B (0.55 km2 of total drained area, average: 0.09 km2), which covers Bely Island north of the Yamal Peninsula. Heading southwards, six recently drained basins were also selected for bioclimate subzone C (3.41 km2 drained area, average: 0.57 km2). Seventeen DLBs were selected for bioclimate subzone D (27.85 km2 drained area, average: 1.64 km2), and 22 were selected for subzone E (19.68 km2 drained area, average: 0.89 km2). Drainage event information was collected for a total of 30 consecutive years for the entire study area. Our annual land cover database included basin ages from 5 years before the drainage event to 24 years after a drainage event took place. The year 0 represents the year of the event of the drainage. The separation of the data into the bioclimate subzones resulted in data gaps for the more northern subzones, and no full data coverage of 10 years could be achieved. Further analyses (see Fig. 5) were therefore carried out, introducing two age groups (1–5 and 6–10 years). The water unit was analysed in detail, and all units were compared to the average fraction of their respective subzone.
4.2 NDVI change
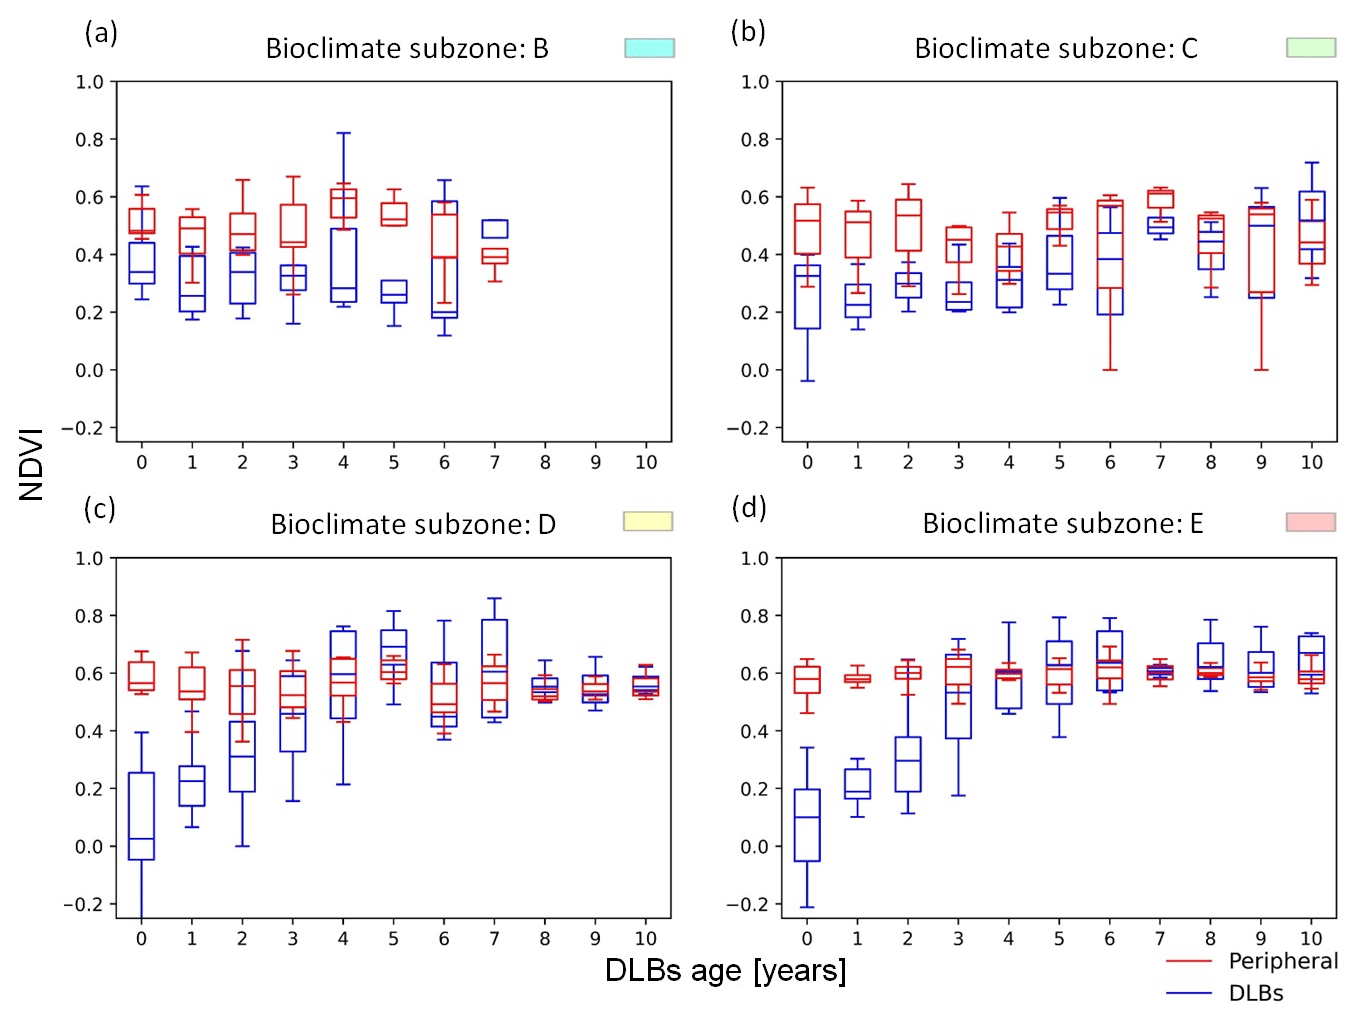
NDVI magnitude and change over time differed across the bioclimate subzones (Fig. 2). Within the first 3 to 4 years, NDVI values inside the basin increased to the level of peripheral values for the southern subzones D and E. The subzones B and C did not show such an increase within this time. Subzones B and C showed higher median NDVI values (B: 0.34, C: 0.33) already in the year of the drainage event (DLB age 0) compared to the southern subzones (D: 0.03, E: 0.10). The NDVI values in the Arctic region increase from colder to warmer bioclimate subzones (Fig. 2 and Table 2).
Table 2Median NDVI (Normalized Difference Vegetation Index) values derived from Sentinel-2 for lake basins up to 10 years after drainage, separated by bioclimate subzones (B to E; see Fig. 1). A line (–) indicates that there are no data.
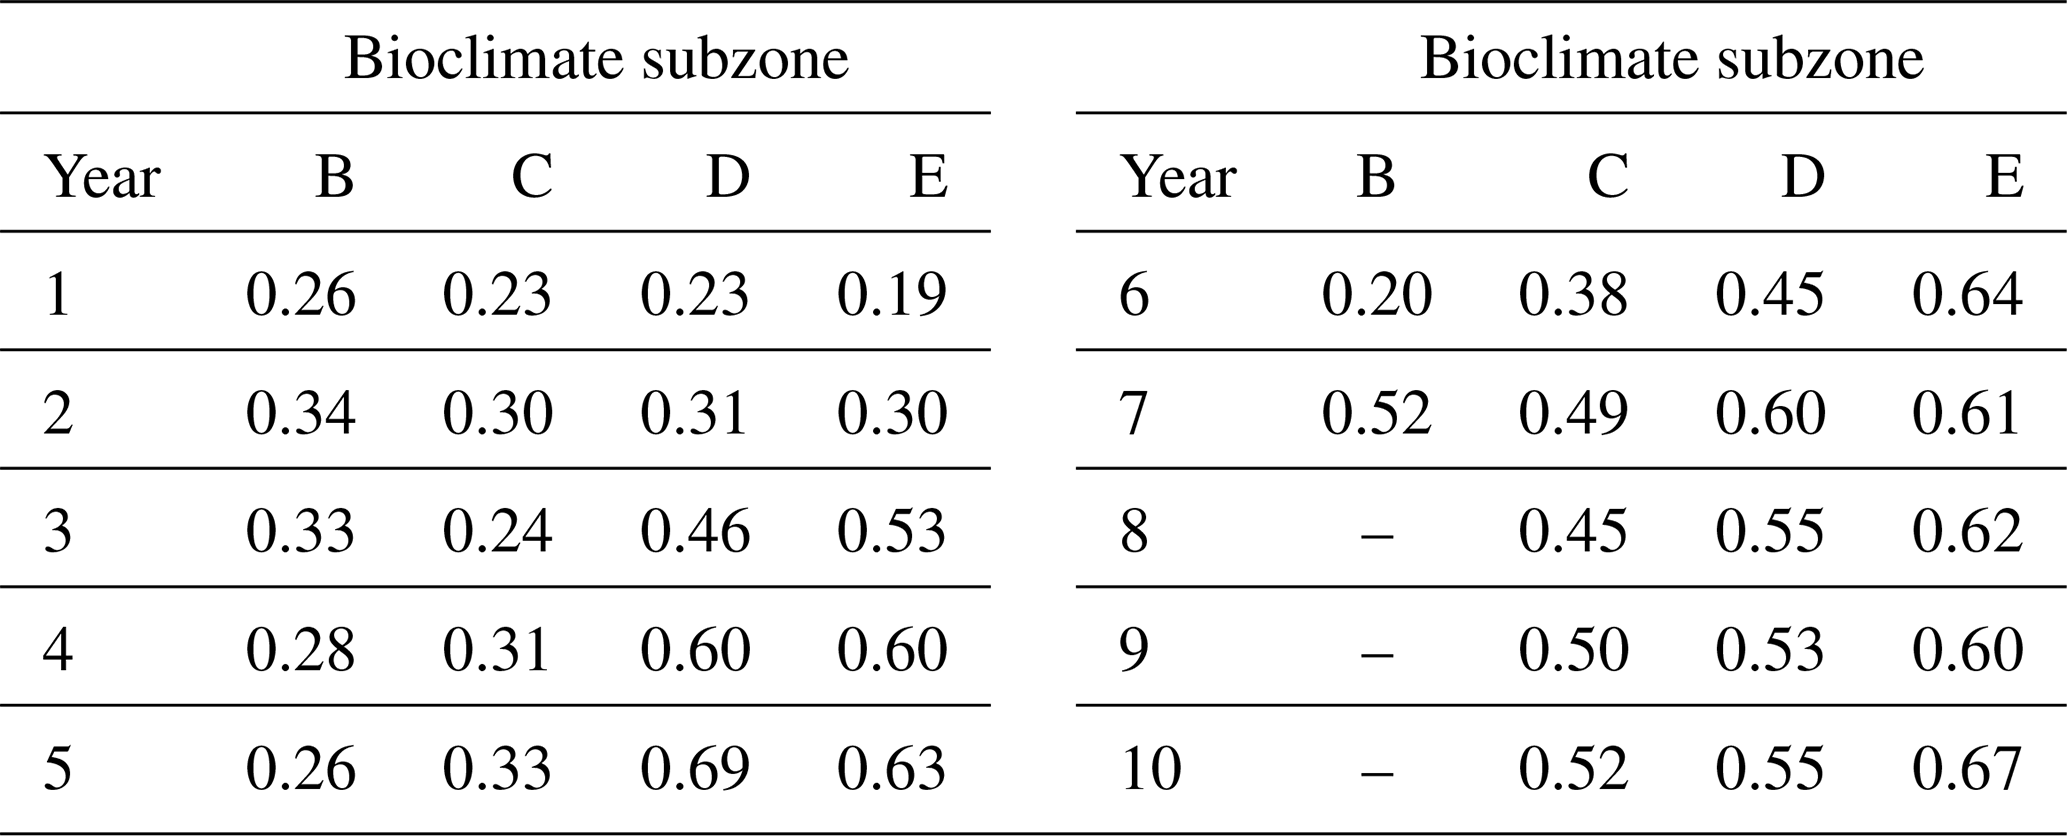
The NDVI for the peripheral area appeared stable when considering the entire time period, although some year-to-year differences occurred (Fig. 2). Peripheral median NDVI values increased on a north-to-south gradient from subzones B to E (B: 0.48, C: 0.51, D: 0.55, E: 0.58).
4.3 Land cover succession
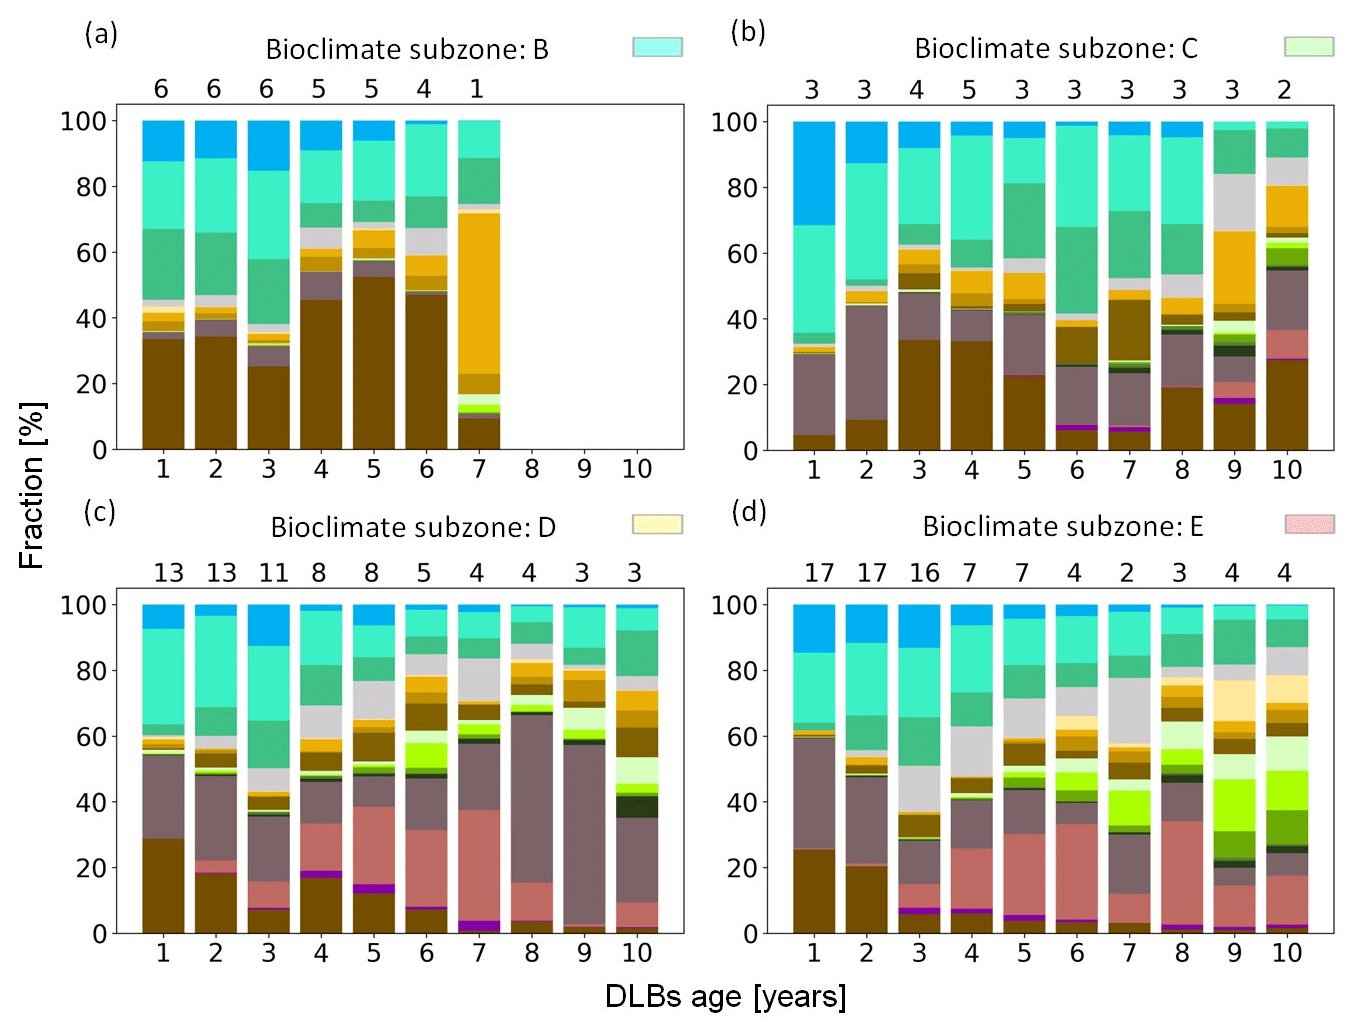
Land cover succession differed across the subzones (Fig. 3):
-
Bioclimate subzone B. 4 years after the drainage event, the “Water” (no. 1) fraction dropped to ≤ 10 %. The “Shallow water” area (no. 2) decreased from ∼ 20 % to 11 %. “Permanent wetland” (no. 3) dropped to ≤ 10 % at an age of 4. “Partially barren, dry to moist tundra” (no. 15) was an important component of all these DLBs, at all ages, but not in subzone B. “Dry tundra with abundant lichen” (no. 6) increased in the seventh year to 48 %.
-
Bioclimate subzone C. Unit no. 1 “Water” dropped to ≤ 10 % after 2 years since drainage. The wetland type changed over time: no. 2 stayed at ∼ 30 % until year eight and then decreased to ∼ 2 %, no. 3 increased to ∼ 25 % until year six and then decreased again ≤ 10 % in year 10; no. 4 stayed ≤ 10 %, except in year nine when the fraction increased to 17 %. “Partially barren, dry to moist tundra” (no. 15) decreased in the first 2 years from 34 % to ≤ 20 % and stayed ≤ 20 % for the remaining years. “Partially barren” (no. 19) increased to 34 % within the initial 5 years and then decreased and stabilized at ∼ 20 %.
-
Bioclimate subzone D. The no. 1 “Water” fraction in the basin dropped to ≤ 10 % after the basin reached an age of 3 years. The fraction of unit no. 2 decreased from 30 % by the fifth year and then stayed ≤ 10 %; no. 4 increased until the fourth year to ∼ 10 % and then stayed until year seven at ∼ 10 % but decreased after that to ≤ 5 %. Unit no. 15 stayed at ∼ 25 % until year seven and then increased to 54 % for the following 2 years, no. 16 increased until the seventh year to 33 % and decreased again, and “Partially barren” (no. 19) decreased from 28 % until an age of 5 years and then stayed at ≤ 10 %.
-
Bioclimate subzone E. Unit no. 1 “Water” decreased from 15 % to ≤ 1 % after year eight. Unit no. 2 stayed at ∼ 20 % for the first 4 years and then decreased to 4 %; no. 4 increased to 20 % in the seventh year and dropped in the following years to ≤ 10 % again. Unit no. 9 slowly increased to 10 % for the 10th year, no. 10 stayed ≤ 5 % until the fifth year and then increased to 15 % for the ninth year, and no. 11 slowly increased to 10 % by the 10th year of the DLBs.
An example of land cover change in a drained lake located in subzone E is shown in Fig. 4. The DLB is close to subzone D on the east side of the Yamal Peninsula (Fig. 1) and is indicated as a green triangle with the number 1 on top. The annual land cover showed a decrease (more than 90 %) in the no. 1 “Water” land cover unit from 2016 to 2017 (Fig. 4a and b), when the drainage event took place. Small wetlands (no. 2 “Wetlands”) formed during the years after drainage, especially in the southern part of the basin. The barren units no. 19 and no. 15 were present with a fraction of over 50 % for 2017 and 2018 (Fig. 4b and c) after the no. 1 “Water” fraction decreased. For the year 2019 (Fig. 4d), wetlands formed (no. 3 “Wetland, permanent wetland” and no. 4 “Wetland, seasonally inundated”), which were mostly replaced in the following years (2020–2022, Fig. 4e–g) with no. 16 “Moist tundra, abundant forbs, dwarf to tall shrubs”. More than 50 % is classified as no. 16 in 2022, the last year of the generated land cover. The land cover succession for the first 6 years of this example DLB (Fig. 4) aligns well with the patterns observed in the set of subzone E DLBs.

Figure 4Annual land cover for the example lake in zone E (2016–2022; a–g); for location, see Fig. 1. Fractional change in land cover units across the total lake area (h). For land cover unit legend, see Table 1. The lake extent was derived from Nitze et al. (2018).
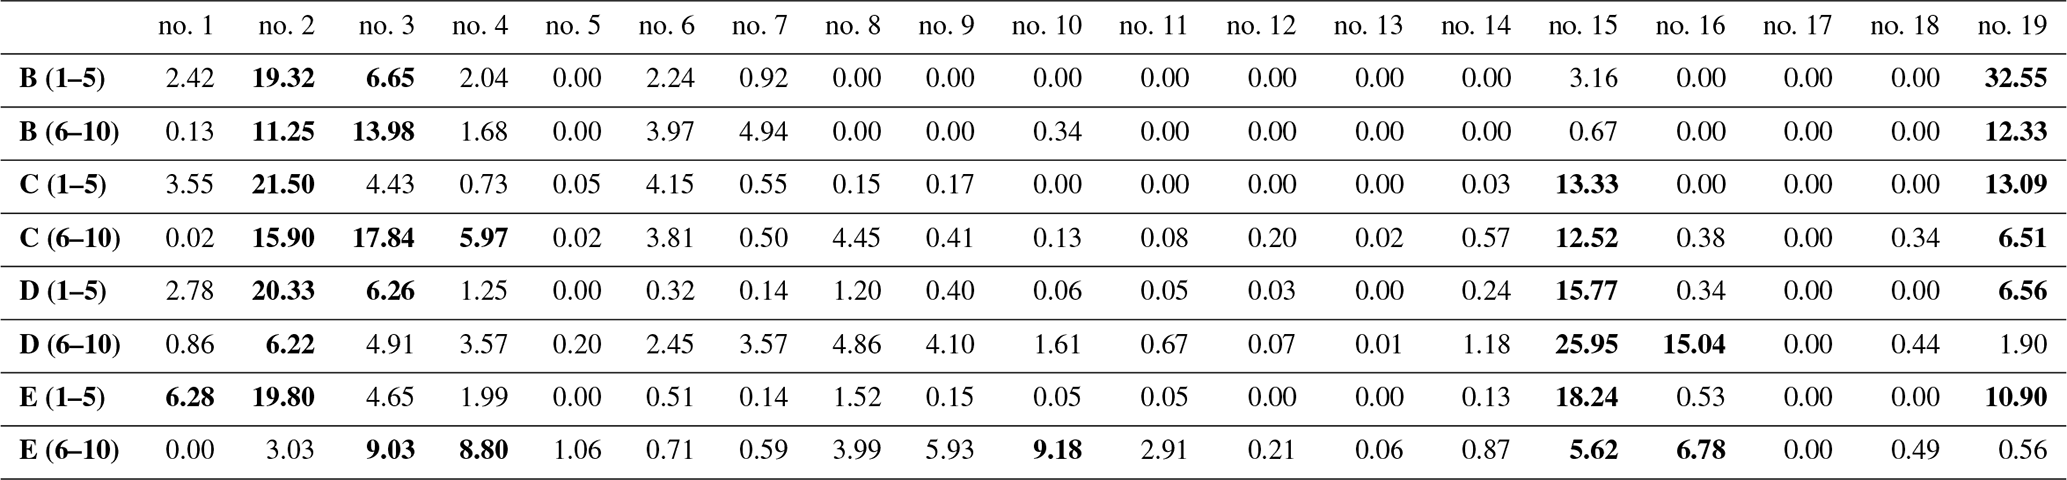
The grouping of yearly basin ages into two categories (1–5 and 6–10 years) resulted in an increase in the number of basins within each specific bioclimate subzone. In the first age category, subzone B had 28 basins, subzone C had 18, subzone D had 53 and subzone E had 64. In the second age category, subzone B had 5 basins, subzone C had 14, subzone D had 19 and subzone E had 17. In all subzones except subzone B, more shrub tundra units (nos. 8–17) were present in the second age category (6–10 years) compared to the first group (Table A2). Additionally, a more heterogeneous distribution of the land cover units was observed for the southern subzones, D and E, compared to the northern zones. A higher proportion of the wet units (nos. 2–4) was shown in all subzones, with the exception of subzone B, where unit no. 4 was still below average.
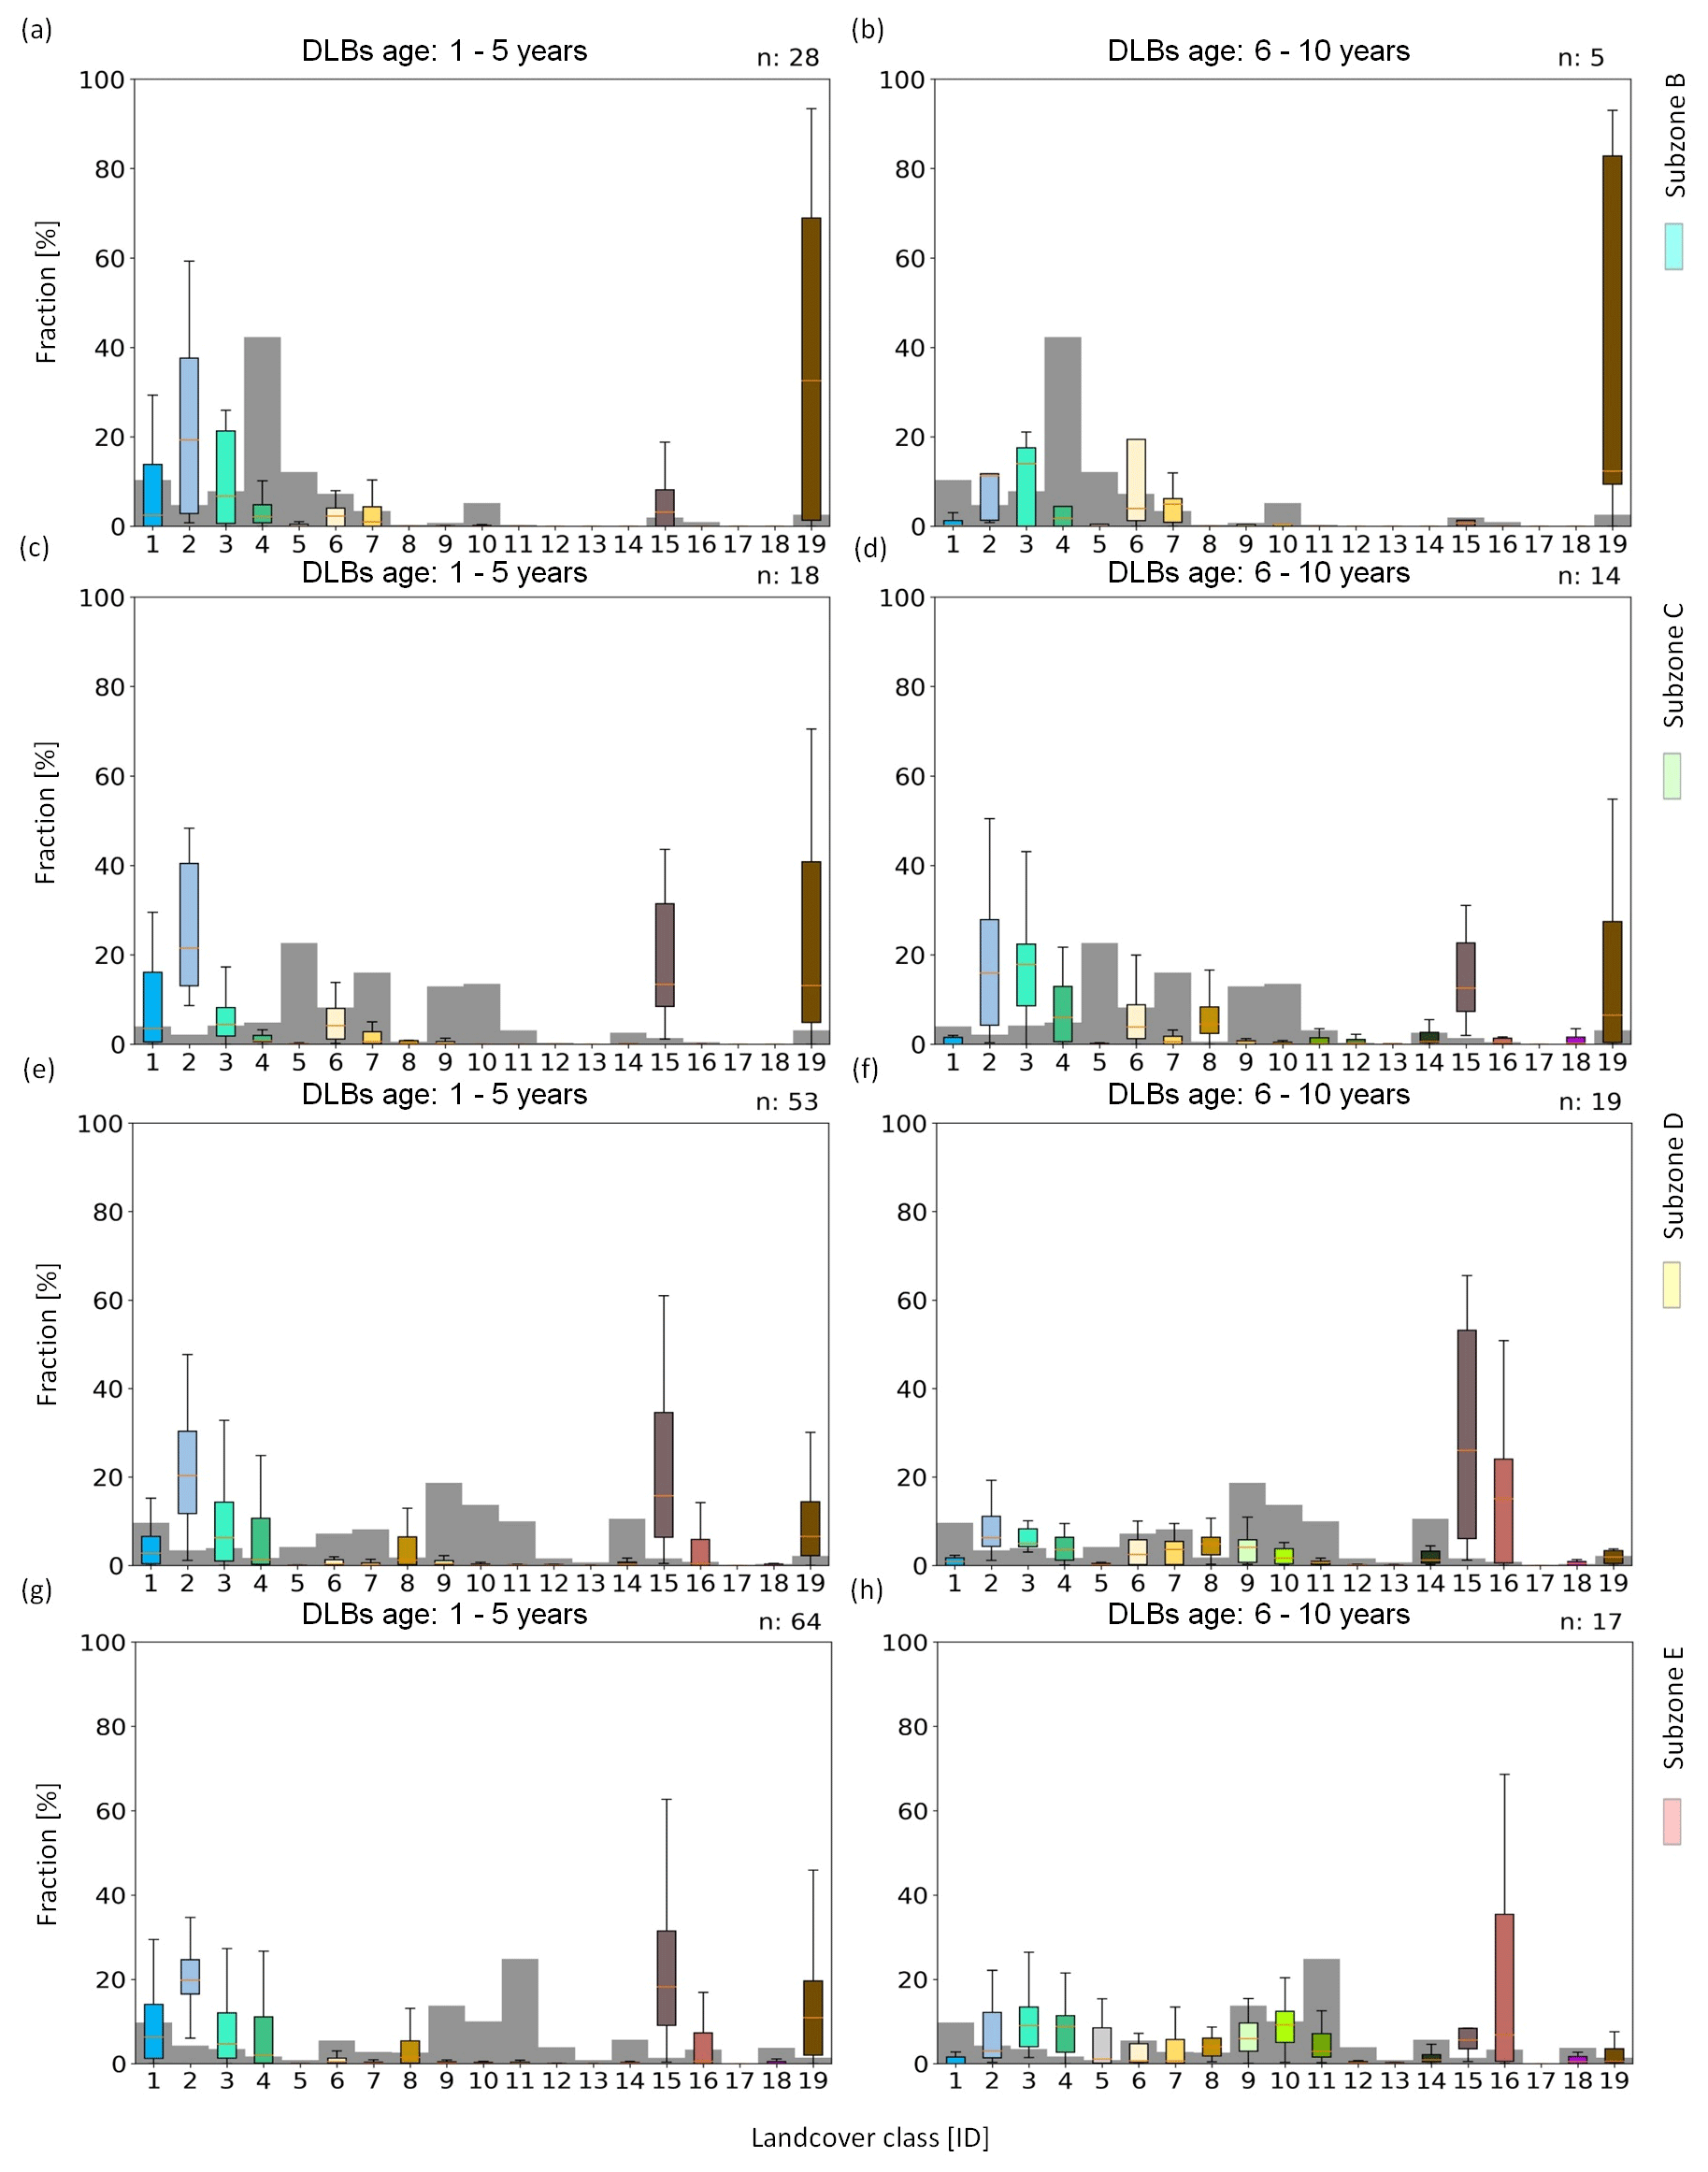
Figure 5Land cover distribution for two age categories: left (a, c, e, g) 1–5 years and right (b, d, f, h) 6–10 years after drainage. Different bioclimate subzones on Yamal Peninsula are addressed. The number of available DLBs is shown on the top right of each panel. For land cover unit legend, see Table 1. Subzones are shown in Fig. 1. Grey bars represent the average land cover distribution for each of the bioclimate subzones.
The fraction of the “Water” unit (no. 1) remains larger than 0 % after a drainage event (Table S1). The remaining “Water” fraction for the first age category (1–5 years) was the highest for bioclimate subzone E with 6.28 % and the lowest in the median for the second age category (6–10 years). The “Water” fraction dropped below 1 % for all subzones in the second age category. The values in Table S1 also include 0 % data to retain the full temporal information regarding the “Water” unit (no. 1).
4.4 Wetness group assessment and changes
The eight in situ sample plots were grouped by their corresponding classification (pixel based), resulting in five sample plots for the “Moist” and three sample plots for the “Wet” groups (grouping B, Table 1). Results confirmed the assumed differences in wetness between the groups (Fig. A2). The sample plots assigned to the “Wet” group were mostly dominated by Equisetum and Poaceae plants. One in situ sample plot contained more than 80 % coverage of horsetail (Equisetum) and was classified as “Wet”, indicating high wetness. Poaceae was present in more than one sample plot. The “Moist” group showed more heterogeneity in the vegetation data. A broad range of fractional cover, spanning from 0 % to over 90 %, is observed for Poaceae in the wet group and for Carex in the moist group.
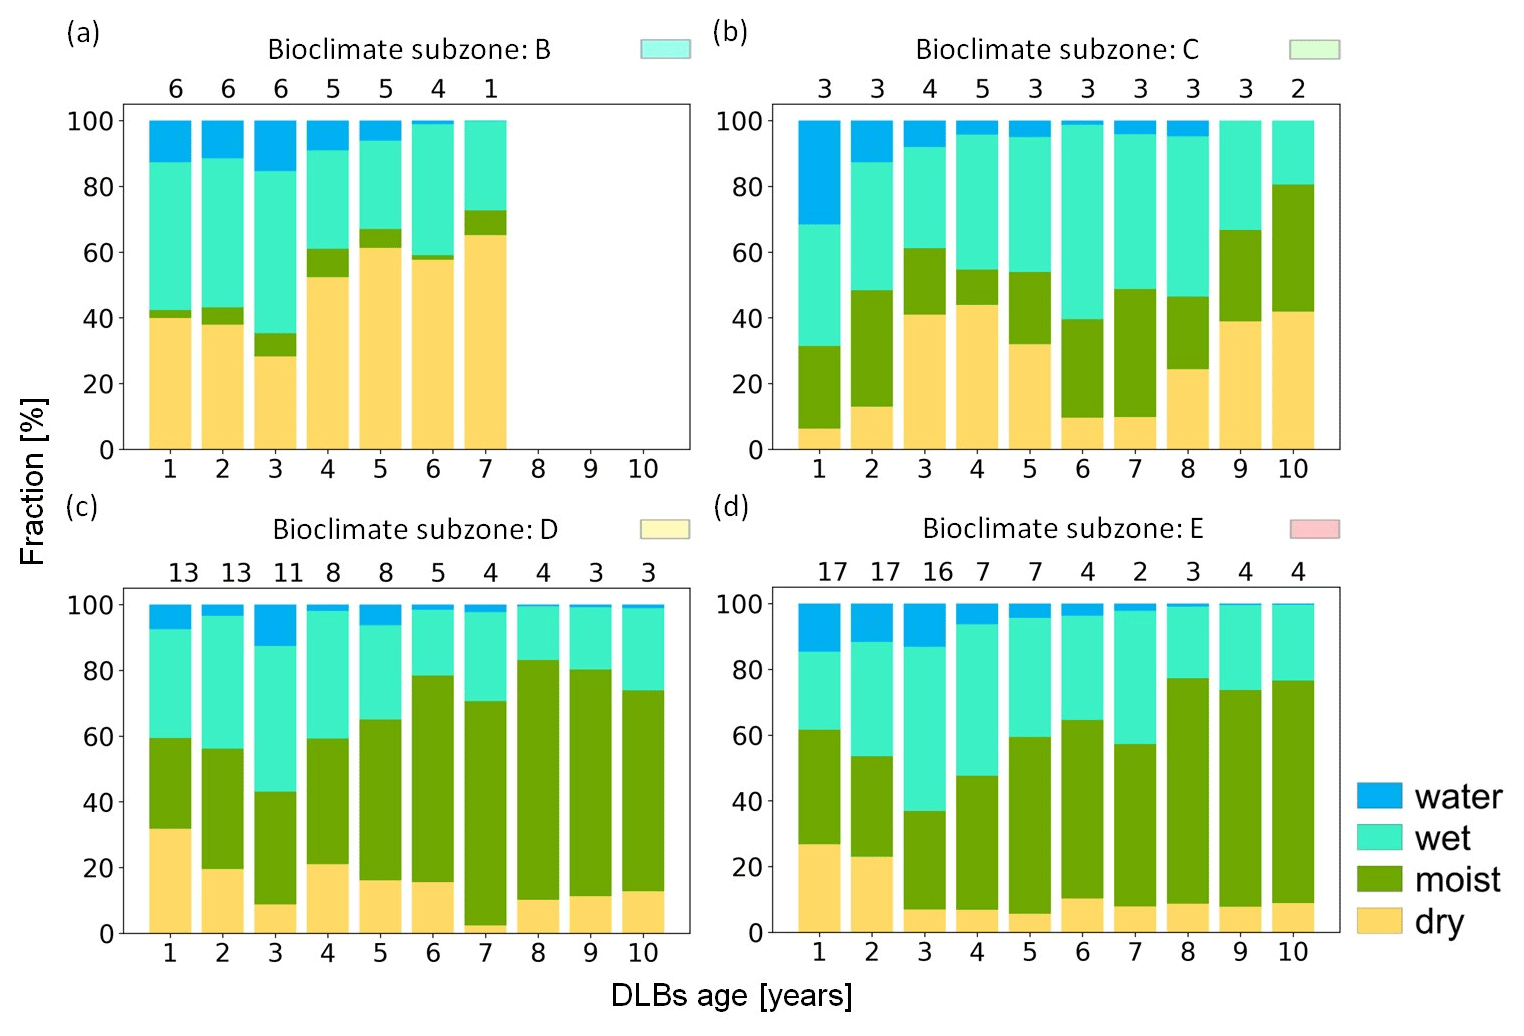
Figure 6 illustrates changes in basin wetness over a 10-year period, varying across different bioclimate subzones (see wetness groups in Table 1).
In subzone B, the “Water” fraction decreased over 7 years, while the “Wet” group remained above 20 % of the fraction for the DLBs in this subzone. The fraction of the “Moist” group in the northern part of Yamal changed very slowly compared to the other subzones (see Fig. 6), and the fraction of the “Dry” group increased over time, staying above 50 % after 4 years.
In subzone C, the “Water” fraction experienced a decrease comparable to that observed in subzone B. The “Wet” group showed a strong increase in the first 5 years after the drainage, followed by a gradual decrease. The “Moist” group varied around 10 %–20 % and remained relatively stable over time. However, the “Dry” group initially increased shortly after the drainage event, reaching up to 40 %, and then decreased before increasing again.
The “Water” fraction in subzone D remained relatively stable over time, consistently below 10 %. The fraction of the “Wet” group slowly decreased over the 10-year period, while the “Moist” group showed a strong increase, reaching over 50 %. In contrast, the “Dry” group fluctuated around 10 %.
In subzone E, “Water” slowly decreased over time. The “Wet” group initially increased shortly after the drainage event, and then decreased and fluctuated around 20 %. The fraction of the “Moist” group showed a slow but steady increase, reaching over 50 % fraction in the basin. Oppositely, The “Dry” group rapidly decreased from over 20 % after the first 2 years to around 10 % or lower for the following 8 years.
4.4.1 NDVI compared to vegetation groups (group A)
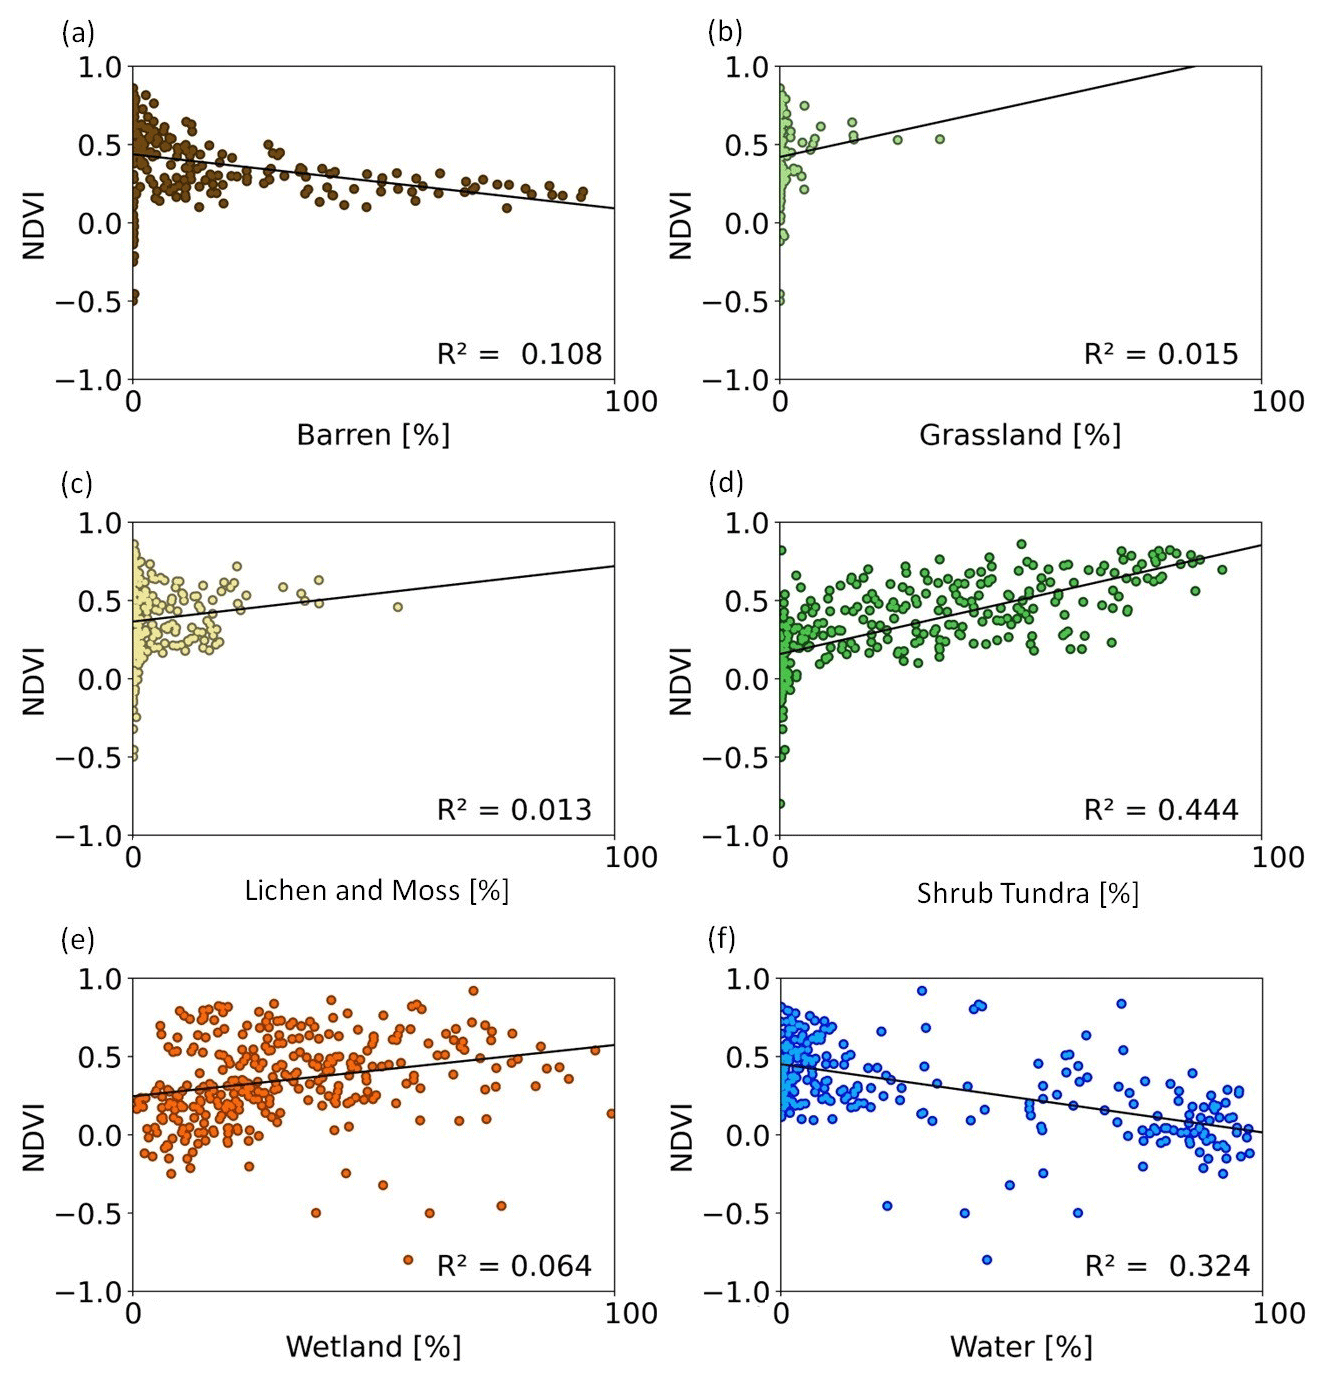
There were 341 different data points available for the regression analyses, with each data point representing a specific basin at a certain age. These data points include the mean NDVI value for that basin at the corresponding age, along with the fraction of the land cover group (e.g. “Barren”). One basin can have multiple data points if there are data available for different ages of that basin, which may vary for other basins. Grouping the data resulted in a reduction of data points: there were 267 data points for “Water” (fraction maximized at 97 %), 139 for “Grassland” (max. 33 %), 270 for “Lichen and Moss” (max. 55 %), 317 for “Shrub Tundra” (max. 92 %), 341 for “Wetland” (max. 99 %), 111 for “Forest” (max. 12 %) and 260 for “Barren” (max. 93 %). The fraction for the “Forest” group never exceeded 12 % and was therefore excluded. The correlation between the NDVI and the percent cover of “Shrub Tundra” (grouping A) was highest with R2=0.444 (Fig. 7). A negative correlation was detected for the “Water” unit and the “Barren” group, whereas the R value is rather low in the latter case. The “Wetland”, “Lichen and Moss” and “Grassland” groups did not show a correlation with NDVI (R2 below 0.1).
4.4.2 NDVI compared to wetness gradients (group B)
The availability of data varied across the merged units from group B. There were 341 data points for “Wet” (fraction maximized at 99 %), 317 for “Moist” (max. 93 %) and 290 for “Dry” (max. 99 %). The highest correlation (R2=0.458) was identified between the NDVI and the “Moist” group. A negative correlation () for “Water” (see Fig. 7) and nearly no correlation () was detected between the NDVI and the “Dry” and “Wet” groups (R2=0.066) (Fig. 8).
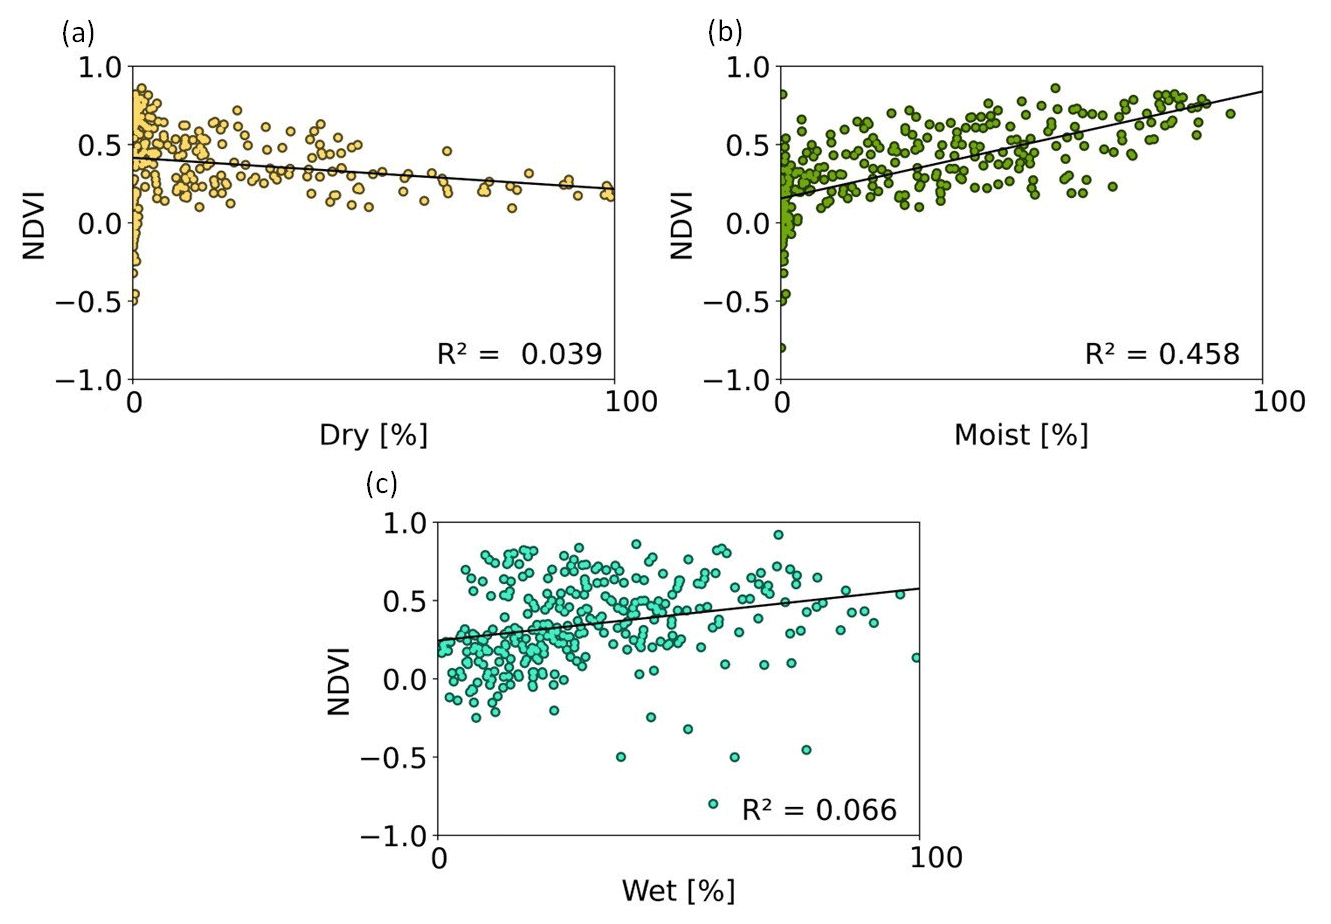
We quantified the succession of land cover and consistent patterns in proportion of moisture groups during the years after lake drainage. In addition, our results demonstrate the capability of the used land cover unit approach to capture relevant post-drainage land cover change processes on the basin scale. Furthermore, we could show that the detected changes cannot be identified with an analysis focusing solely on NDVI time series. Additional information on succession stages and landscape change trajectories could be derived using the land cover units. For example, changes in land cover dominated by “Wetlands” or “Lichen and Moss” are not represented by the changes in NDVI over time (see Figs. 7 and 8). The NDVI values did not show any correlation with the “Dry” group (R2 below 0.1), implying that an NDVI-only survey on DLBs misses important dryness–wetness information during the first 10 years after a drainage event takes place.
The utility of the consideration of bioclimate subzones for land cover change analyses in DLBs is particularly evident for the wetness gradients “Dry” and “Moist”. A higher fraction for the wetness group “Dry” occurs in the northern bioclimate subzones (B and C) compared to the subzones (D and E) located in the south (Fig. 6). The comparatively high fraction of (partially) barren area for all bioclimate subzones and all age groups agrees with previous observations of non-vegetated areas in recently drained basins (Lantz, 2017). Our results also showed that “Barren” areas account for a larger proportion of recently drained area in northern subzones. A higher fraction of “Moist” conditions was found in the basins in the south of the peninsula (Fig. 6). Loiko et al. (2020) concluded that the productivity of individual ecosystems can be limited by nutrient availability. We hypothesize that lakes in the south might have higher nutrition-rich lake sediment amounts compared to the north. This influences the colonizing of the basin in addition to different climate variables. Our results underline that the vegetation colonizing the basins exhibited differences between the southern bioclimate subzones (D and E) and the northern subzones (B and C) (Fig. 3). This agrees with previous in situ studies which have shown a strong dependence of vegetation establishment on local climate and other factors such as differences in local species abundance (Lantz, 2017; Loiko et al., 2020). The land cover product is not designed to differentiate between various plant species. The grouping into the wetness gradients “Dry”, “Moist” and “Wet” is supported by field vegetation data, despite limitations. Enhanced precision in these comparisons could be achieved through increased in situ data availability. Additionally, distributing sample plots evenly across the basin, rather than along a transect with varying intervals, may improve the analysis. We suggest one plot on a 10×10 m scale to cover each pixel from the land cover data product. However, the wetness separation is further justified by indicator plants for our in situ data (see Fig. A2 and Table A1). For example, horsetail Equisetum occupies the ecotope with the lowest soil fertility in wet areas with sandy sediments. Moist ecotopes are occupied by sedge meadows (Carex) in the elevated parts as also reported by Loiko et al. (2020).
DLBs have been previously found to be sites of wetland formation (Lantz et al., 2022); however, they have been mostly described as wetlands in older basins on centennial or millennial timescales. Following drainage, land cover of the area has a tendency to become more heterogeneous over time (Fig. 5). Our study showed a higher-than-average percentage of “Shallow water” (no. 2) and “Permanent wetland” area (no. 3) for DLBs of all age groups compared to the percentage of the same land cover unit in the respective bioclimate subzones (Fig. 5). Small wetlands formed after the drainage in the basin (Fig. 4). They might be covered with a thick (exceeding 10 cm) moss–grass layer and are located in wet depressions (Loiko et al., 2020). Methane fluxes differ between lakes, wet ecotopes and upland tundra (e.g. Schneider et al., 2009; Matthews et al., 2020). Therefore, a change in flux patterns can be expected after lake drainage, but the overall magnitude remains to be quantified.
We observed a higher ratio for “Dry to moist tundra, partially barren” (no. 15) and “Moist tundra, abundant forbs, dwarf to tall shrubs” (no. 16), which indicates the successive colonization of the basin by vegetation during the following years. The presence of “Partially barren” (no. 19) indicates that the area is still disturbed, and vegetation succession is still an ongoing process after 10 years of drainage for the northern subzones compared to the southern part of the peninsula where barren areas are less present in the basin. DLBs are known to have dry to aquatic tundra areas with the distributions of these different conditions depending on a multitude of factors such as time passed since drainage, local climate and basin topography (Jones et al., 2022). In particular, the high fraction of “Dry to aquatic tundra, dwarf shrubs” (land cover unit no. 8) compared to the surrounding average of that unit might indicate a recently drained basin for the bioclimate subzones C, D and E within the first 10 years (Fig. 5).
Drainage events frequently lead to only partial drainage, causing water areas to persist within the drained basin. Remaining “Water” fraction in our study sites dropped below 1 % after 10 years for all bioclimate subzones with water area decreasing over time after drainage. Our results show that more water remained in lakes after drainage in southern subzones within the first 10 years. This can, however, be biased since additional factors may also contribute to further changes: inundation related to floodplain dynamics or basin depth. Due to the lack of related data, we approach the interpretation of water fractions cautiously. Previously published work has shown a continued change in the open water fraction within DLBs over time, but it might vary for different basin age stages, confirming Magnússon et al. (2020). This trend may reverse in time. For older basins, an increase in open water fraction in the form of secondary lake development has been reported (Jorgenson and Shur, 2007; Jones et al., 2022).
The difference between DLBs and their surrounding area in land cover unit distribution is evident for all bioclimate subzones (Fig. 5). This supports the generally held assumption that lake drainage introduces land cover heterogeneity into the landscape (Bartsch et al., 2023a). Raynolds et al. (2019) used Advanced Very High Resolution Radiometer (AVHRR) surface temperature data from 1982 to 2003 for determination of the mean July temperature values to derive the bioclimate subzones. Due to the changing climate, those mean values are not true any longer (compare with Fig. A1). This is supported by recent studies; for example, Ermokhina et al. (2023) showed that the July isotherms of 6 °C are changing northwards. This may have an impact on zone-specific results, and updated boundaries should be considered for future studies.
The dependence of surface composition in DLBs on time passed since drainage is a phenomenon which has been observed for permafrost regions across the Arctic (Jorgenson and Shur, 2007; Hinkel et al., 2003). Previous research focused on C-band SAR data to distinguish between wetness gradients (Widhalm et al., 2016). It was highlighted that data availability was a problem and that their approach works only when there is no scattering, e.g. due to tree trunks. The use of HH (horizontally emitted and horizontally received) polarization is beneficial in this case, but it is of limited availability from Sentinel-1 across the terrestrial Arctic. In our land cover approach, we combine two different satellite sensors (SAR and multi-spectral data) to address this issue. The analysis presented here is limited to a time period when satellite data were available and focuses only on a specific region. Longer time series and extending the study area would allow for an analysis stretching beyond the 10-year mark, leading to additional insights into land cover change trajectories within DLBs. Increasing the number of study sites would provide additional insights for these trajectories over a larger number of diverse basins. The timing of a lake drainage event was determined through visual inspection of available satellite imagery. This can lead to inconsistencies, and an automatic approach would need to be considered when expanding the study area to a circumpolar scale. Our approach focuses on DLBs on the Yamal Peninsula that drained recently (between 1998–2021). Nitze et al. (2018) interpreted trends of indices for change from 1999–2014, and Bergstedt et al. (2021) identified DLBs on the North Slope of Alaska, but the question of when the lakes drained (abrupt change) remains. Geological records showed that abrupt changes in the earth system can arise from slow changes in one component (Brovkin et al., 2021). Palaeorecords would be needed to understand the full cycles of DLBs on longer timescales.
To constrain the analysis and to better enable surface change assessment, basins were carefully selected, omitting those which were located in active floodplains or drained due to suspected anthropogenic influence. To further study the complex dynamics of post drainage land cover development, basins of different characteristics, including those connected to floodplains and with partial drainage of less than 50 %, should be considered.
Improving our knowledge of processes following lake drainage events in Arctic environments associated with permafrost conditions and surrounding terrain is crucial for climate change impact assessments. Understanding the landscape changes associated with drainage, as described quantitatively through changes in land cover units in this study, is needed for representing consequences of permafrost thaw-lake change in land surface and landscape models. These models depend on precise quantitative data. We showed that the land cover succession of recently drained basins follows a certain sequence of land cover changes as the ecosystem transitions from a uniform to a heterogeneous land cover. It differs with location on Yamal Peninsula. The bioclimate subzones (north–south climatic gradient) play an important role in the succession progression. DLBs can be seen as hot spots of greening, but important additional information regarding the development of wetlands was also shown. Lake drainage leads to the development of wet ecotopes, which is reflected in the land cover units but not directly represented through conventional NDVI analyses. Differentiation considering wetness is of relevance for methane fluxes. A realistic representation of wetness gradients in land-surface models may allow for improved descriptions of associated changes in future fluxes. In addition to carbon cycle impacts, the corresponding change in biodiversity needs to be addressed since drainage is a common feature across the entire Arctic. The presented approach can facilitate such investigations. In summary, our results advance the understanding of the development for recently drained basins across a range of bioclimate subzones, drying versus wetting and land cover succession. The corresponding change, considering the different identified trajectories of land cover change for the carbon cycle and species abundance (flora and fauna), remains to be addressed.
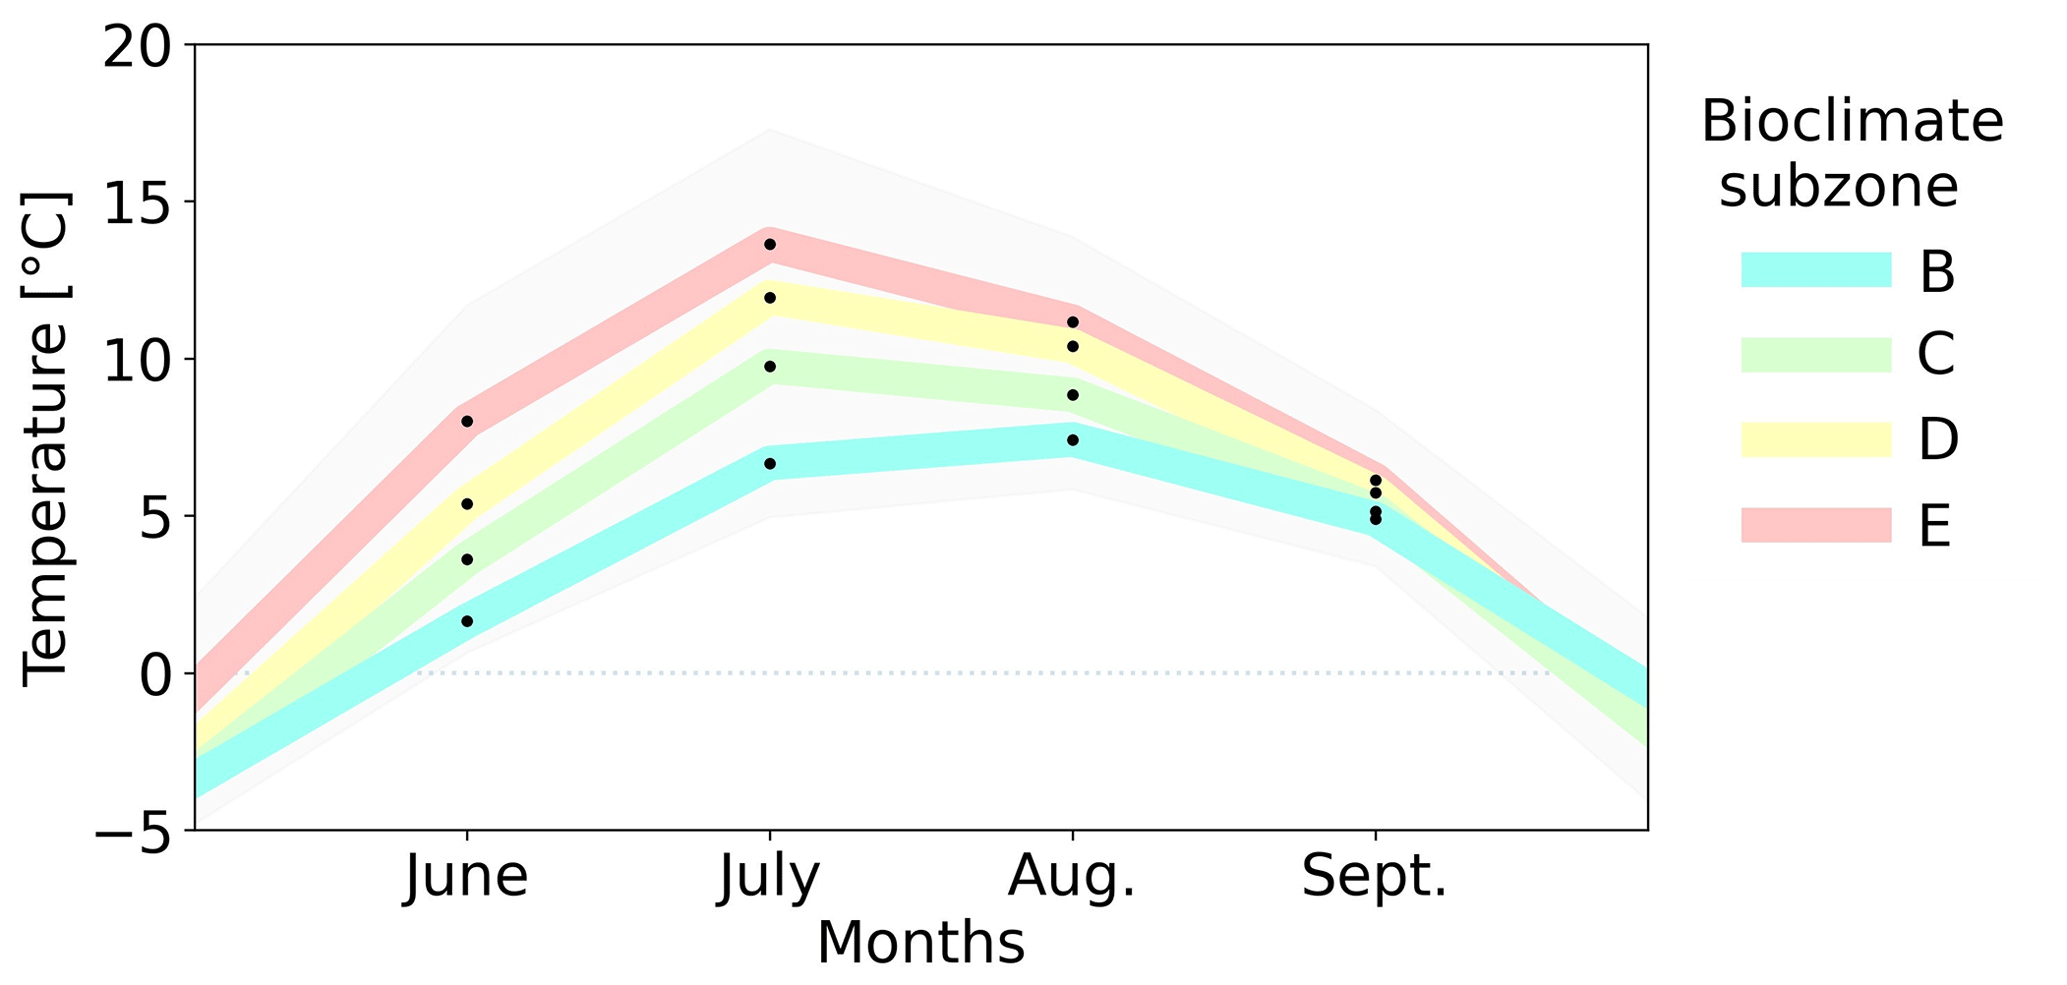
Figure A1Mean temperature data from ERA5 for the Yamal Peninsula separated by the bioclimate subzones (see Fig. 1). The covered data period is from 2015 to 2021. Only the months with a monthly mean higher than 0 °C are shown.
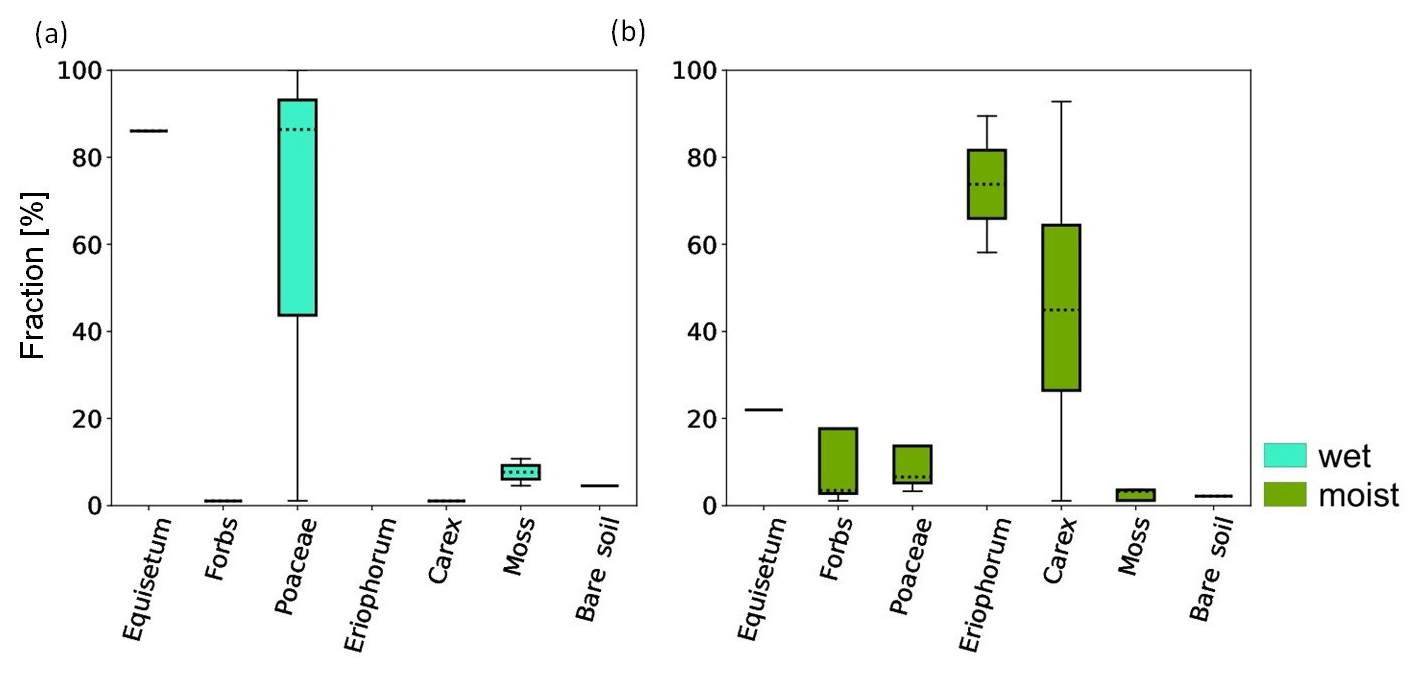
Figure A2Types of surface data collected in the field in subzone E, separated for the corresponding classified pixel (a: Moist, b: Wet). Different surface categories were distinguished: vegetated (Equisetum, Forbs, Poaceae, Eriophorum, Carex, Moss) and non-vegetated (“Bare soil”). For location, see Fig. 1 (indicated as a green triangle with the number 2).
Table A1Drained lake basin located in subzone E in situ data, Yamal Peninsula/Erkuta River (location 2 in Fig. 1, date: 26 July 2016). Start of transect is at P1 (68.18077° N, 69.05803° E), and end of the transect is at P2 (68.17712° N, 69.05982° E). The soil in the old shore zone is clay, and the soil on the old lake bed is clay; the vegetation cover on the remaining lake area is 1 %.
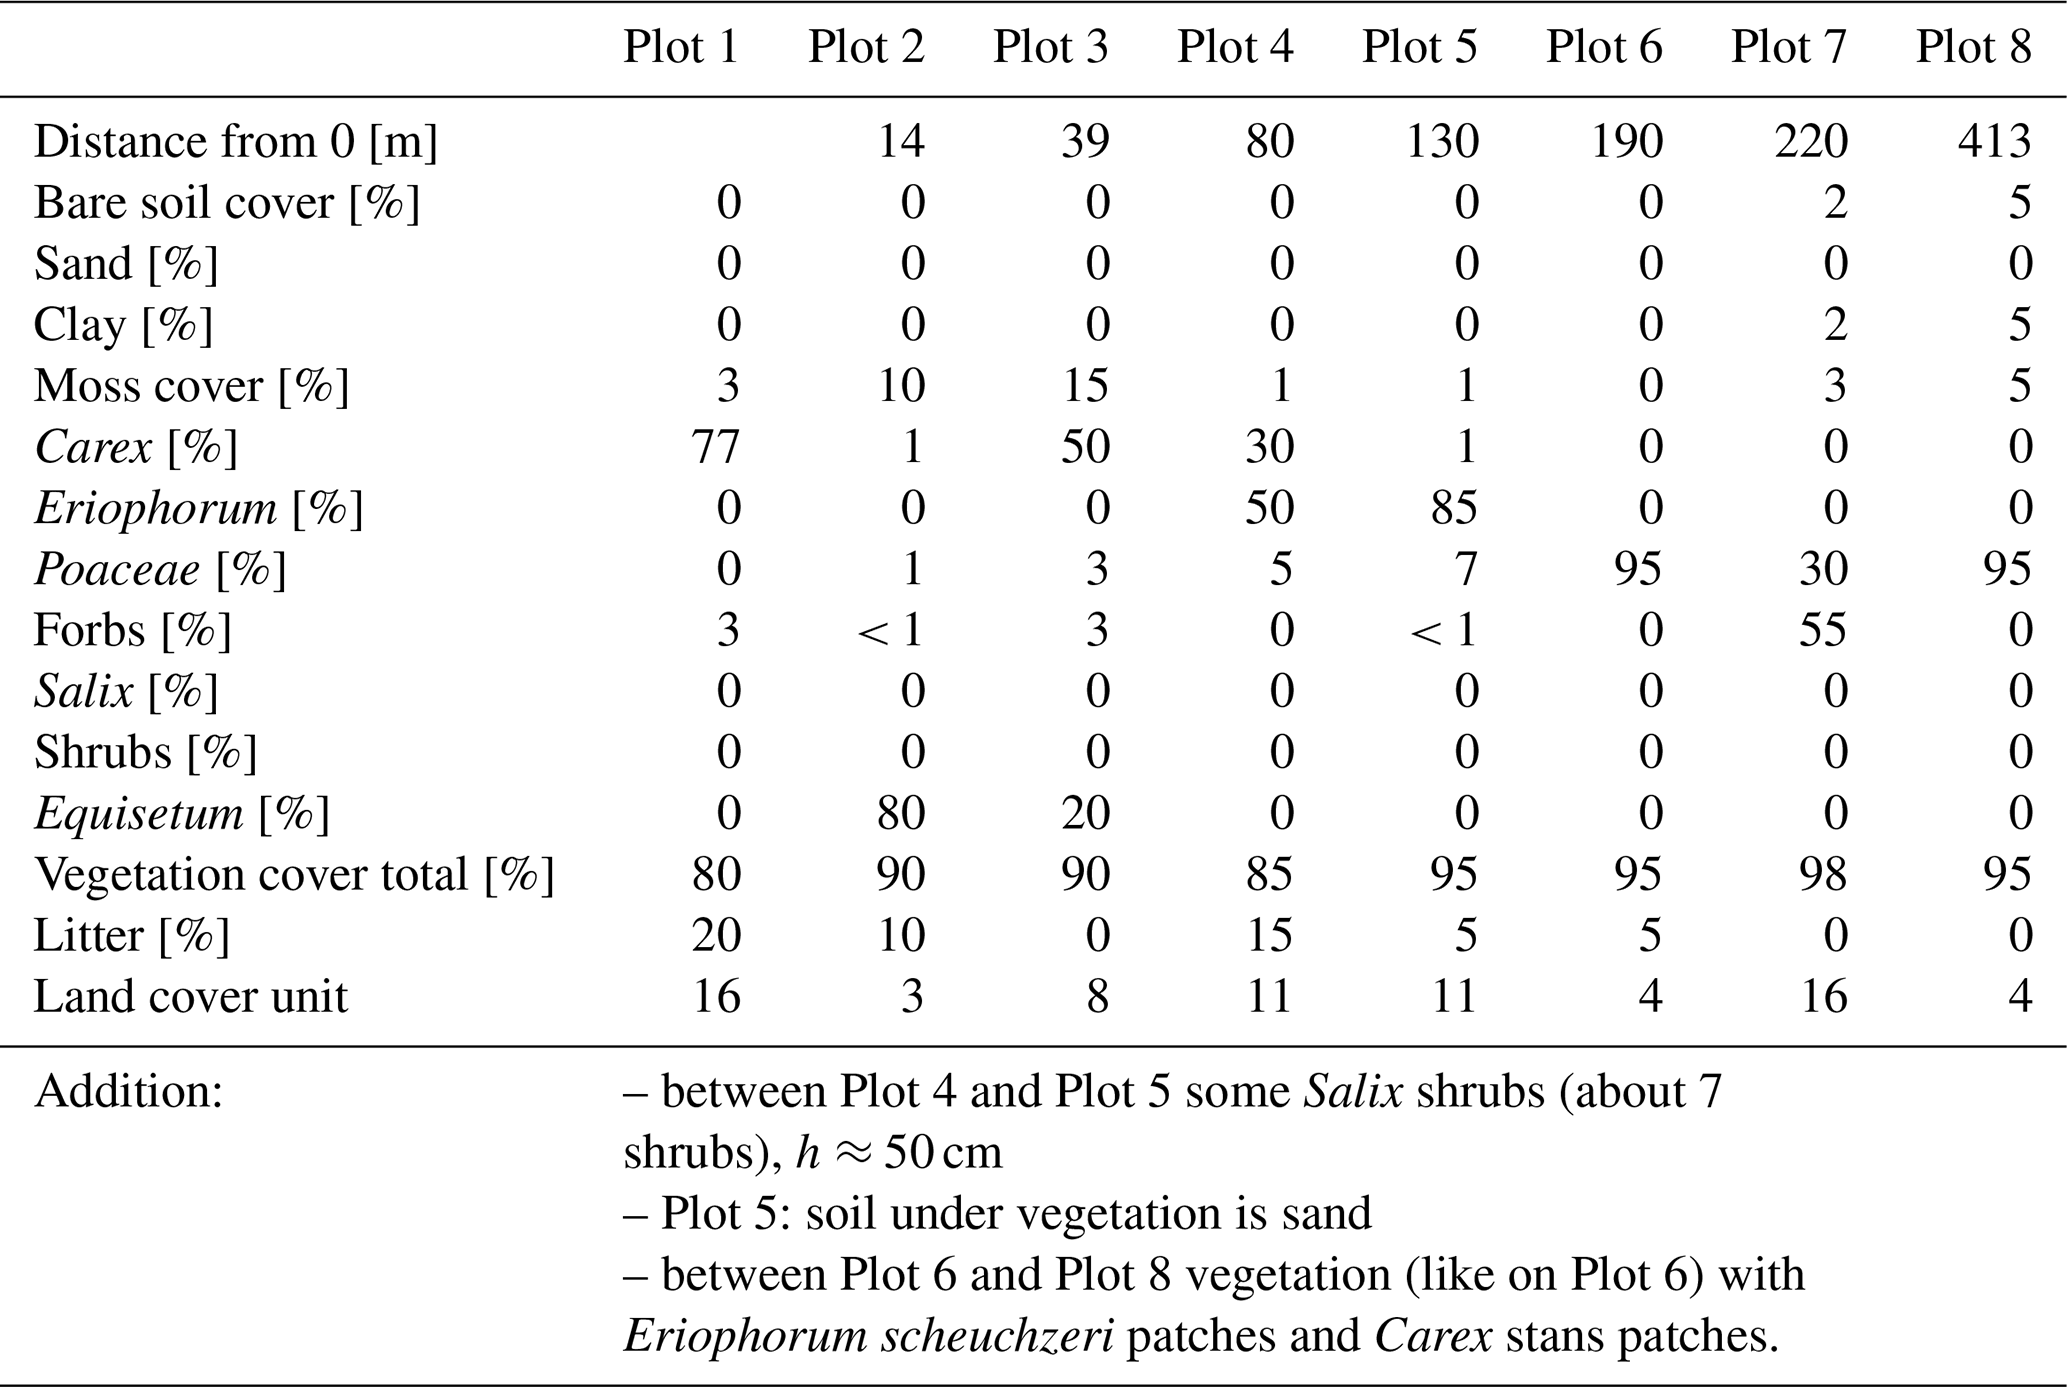
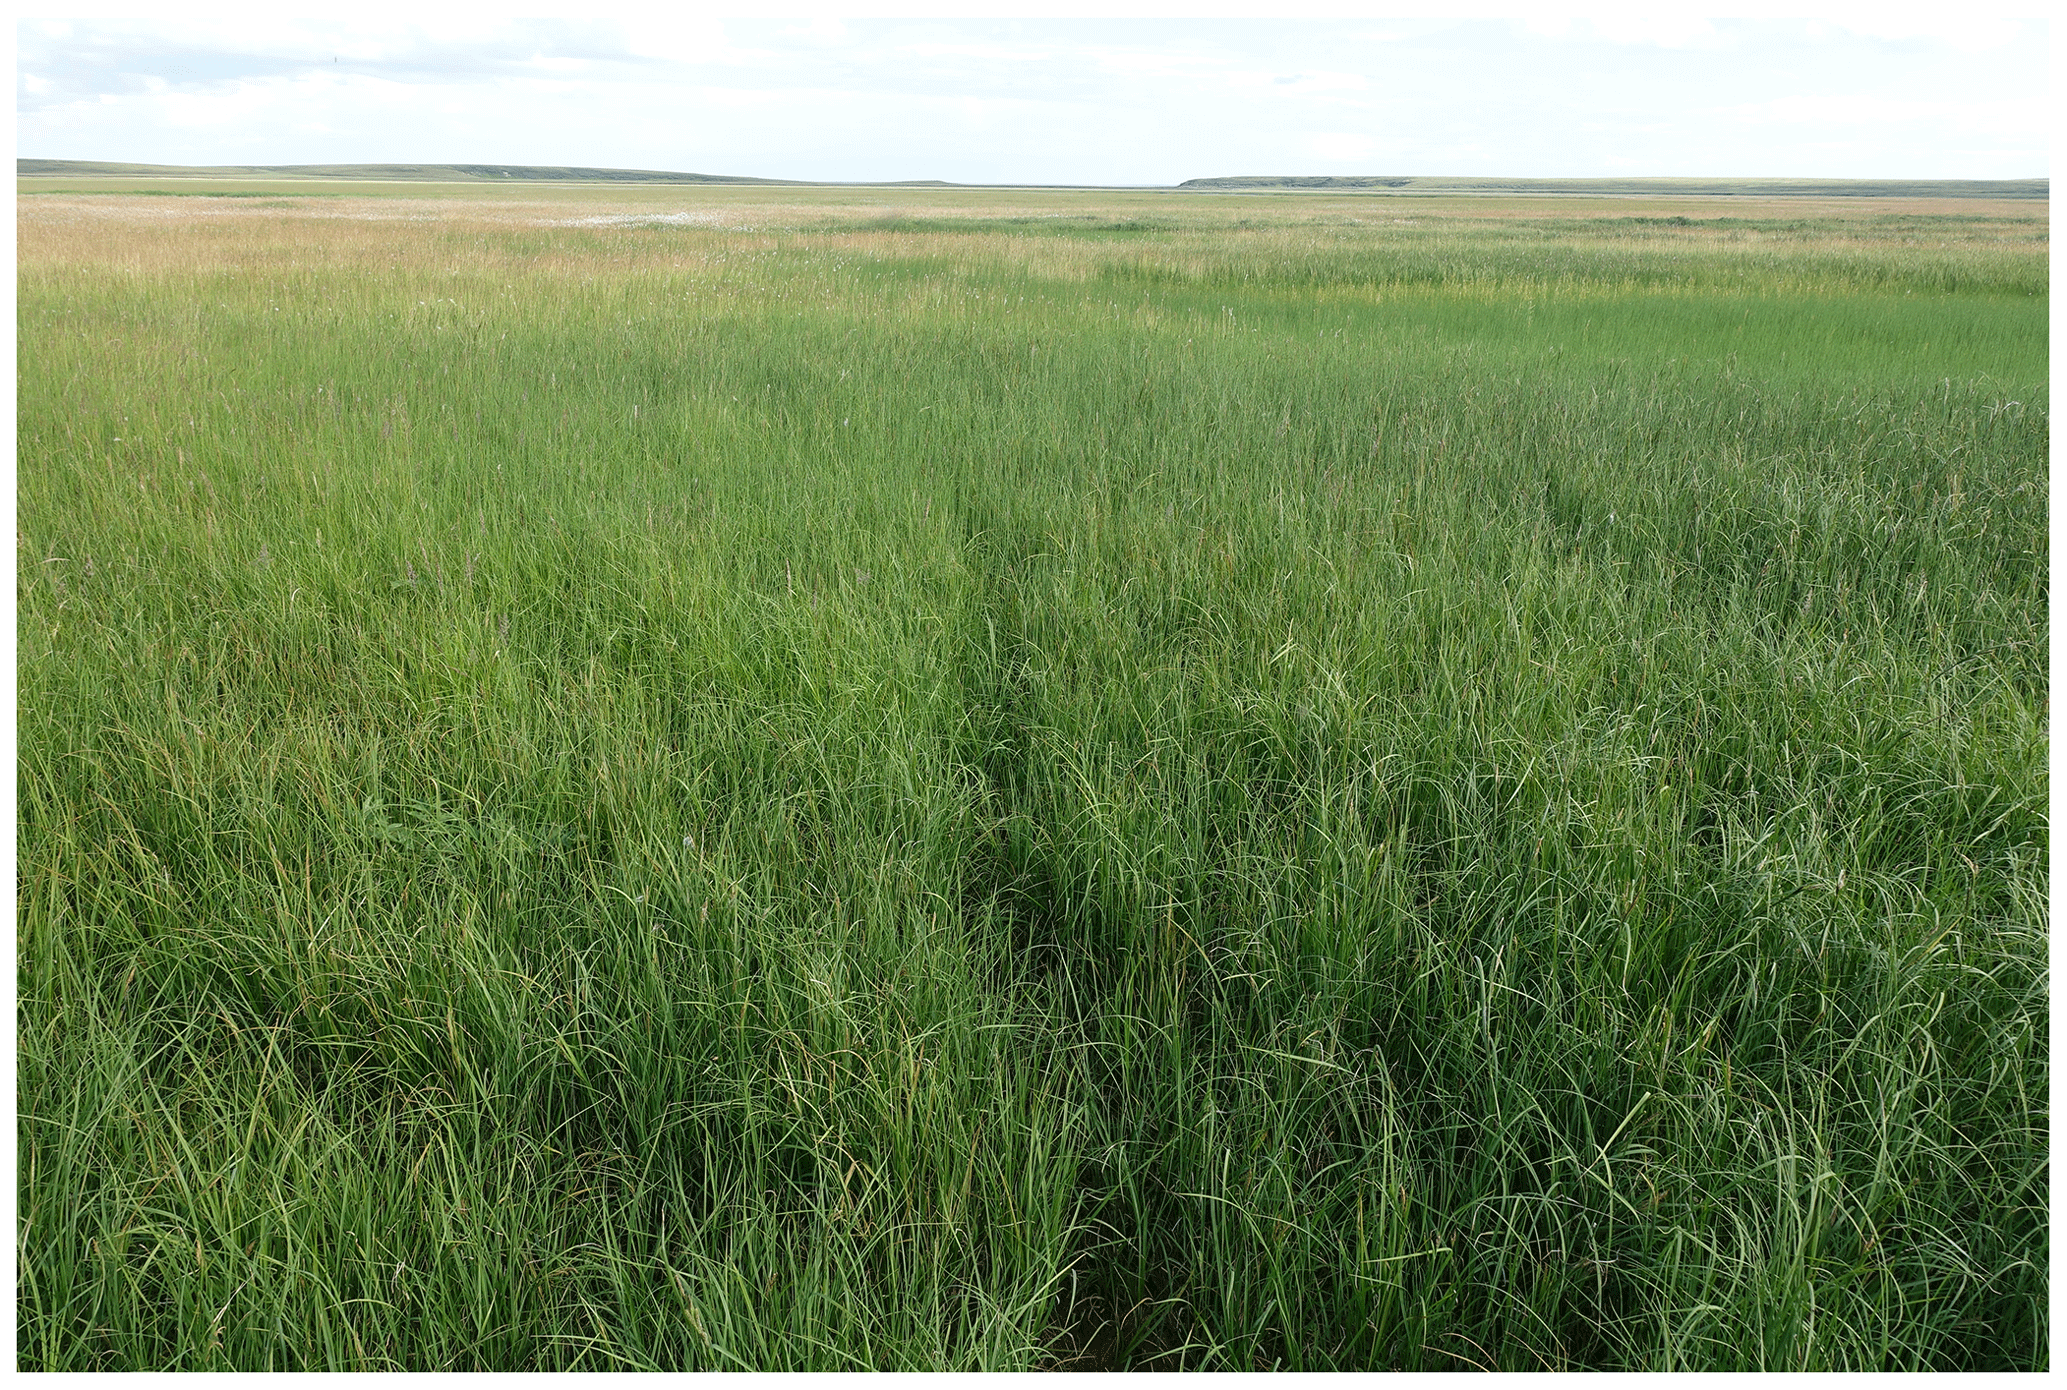
Figure A3Vegetation survey located in subzone E, Plot 1, at location 2 (Fig. 1) inside the DLB. The lush vegetation differs from the surrounding area (photo 26 July 2016, Dorothee Ehrich).
The lake data specifics are published in the Supplement (Table S3). The in situ data are published in the Appendix in Table A1. The land cover classification results can be provided on request by the contact author.
The supplement related to this article is available online at: https://doi.org/10.5194/tc-18-4703-2024-supplement.
AB developed the initial concept which was adapted by CvB. CvB processed the data, analszed the results and wrote the first draft of the manuscript. AB, HB, BW, AE, TK and DE contributed to the conception of the study and writing of the manuscript. AS and SA provided additional feedback. In situ data were collected by DE, AS and SA.
The contact author has declared that none of the authors has any competing interests.
Publisher’s note: Copernicus Publications remains neutral with regard to jurisdictional claims made in the text, published maps, institutional affiliations, or any other geographical representation in this paper. While Copernicus Publications makes every effort to include appropriate place names, the final responsibility lies with the authors.
This article is part of the special issue “Northern hydrology in transition – impacts of a changing cryosphere on water resources, ecosystems, and humans (TC/HESS inter-journal SI)”. It is not associated with a conference.
We thank the two anonymous reviewers for their constructive feedback that enabled us to significantly improve the quality of our paper.
This work was supported by the European Research Council project Q-Arctic (grant no. 951288) and the European Union's Horizon 2020 Research and Innovation programme under grant agreement no. 869471 (CHARTER). Further support has been received through the programme of the Ministry of Science and Higher Education of the Russian Federation “Terrestrial ecosystems of northwestern Siberia: assessment of the modern transformation of the communities”, no. 122021000089-9, as well as the European Space Agency CCI+ Permafrost and AMPAC-Net projects (grant nos. 4000123681/18/I-NB and 4000137912/22/I-DT). Publisher's note: the article processing charges for this publication were not paid by a Russian or Belarusian institution.
This paper was edited by Hanna Lee and reviewed by two anonymous referees.
Arp, C. D., Drew, K. A., and Bondurant, A. C.: Observation of a rapid lake-drainage event in the Arctic: Set-up and trigger mechanisms, outburst flood behaviour, and broader fluvial impacts, Earth Surf. Proc. Land., 48, 1615–1629, https://doi.org/10.1002/esp.5571, 2023. a
Babkina, E. A., Leibman, M. O., Dvornikov, Y. A., Fakashchuk, N. Y., Khairullin, R. R., and Khomutov, A. V.: Activation of Cryogenic Processes in Central Yamal as a Result of Regional and Local Change in Climate and Thermal State of Permafrost, Russ. Meteorol. Hydro.y, 44, 283–290, https://doi.org/10.3103/s1068373919040083, 2019. a, b
Bartsch, A., Kroisleitner, C., and Heim, B.: Circumpolar Landscape Units, links to GeoTIFFs, PANGAEA [data set], https://doi.org/10.1594/PANGAEA.864508, 2016. a
Bartsch, A., Leibman, M., Strozzi, T., Khomutov, A., Widhalm, B., Babkina, E., Mullanurov, D., Ermokhina, K., Kroisleitner, C., and Bergstedt, H.: Seasonal Progression of Ground Displacement Identified with Satellite Radar Interferometry and the Impact of Unusually Warm Conditions on Permafrost at the Yamal Peninsula in 2016, Remote Sens., 11, 1865, https://doi.org/10.3390/rs11161865, 2019a. a
Bartsch, A., Widhalm, B., Pointner, G., Ermokhina, K. A., Leibman, M., and Heim, B.: Landcover derived from Sentinel-1 and Sentinel-2 satellite data (2015–2018) for subarctic and arctic environments, PANGAEA [data set], https://doi.org/10.1594/PANGAEA.897916, 2019b. a
Bartsch, A., Strozzi, T., and Nitze, I.: Permafrost Monitoring from Space, Surv. Geophys., 44, 1579–1613, https://doi.org/10.1007/s10712-023-09770-3, 2023a. a, b, c, d
Bartsch, A., Widhalm, B., von Baeckmann, C., Efimova, A., Tanguy, R., and Pointner, G.: Sentinel-1/2 derived Arctic Coastal Human Impact dataset (SACHI), Zenodo [data set], https://doi.org/10.5281/ZENODO.10160636, 2023b. a
Bartsch, A., Efimova, A., Widhalm, B., Muri, X., von Baeckmann, C., Bergstedt, H., Ermokhina, K., Hugelius, G., Heim, B., and Leibman, M.: Circumarctic land cover diversity considering wetness gradients, Hydrol. Earth Syst. Sci., 28, 2421–2481, https://doi.org/10.5194/hess-28-2421-2024, 2024. a, b, c, d, e, f, g, h, i
Bergstedt, H., Zwieback, S., Bartsch, A., and Leibman, M.: Dependence of C-Band Backscatter on Ground Temperature, Air Temperature and Snow Depth in Arctic Permafrost Regions, Remote Sens., 10, 142, https://doi.org/10.3390/rs10010142, 2018. a, b
Bergstedt, H., Jones, B. M., Hinkel, K., Farquharson, L., Gaglioti, B. V., Parsekian, A. D., Kanevskiy, M., Ohara, N., Breen, A. L., Rangel, R. C., Grosse, G., and Nitze, I.: Remote Sensing-Based Statistical Approach for Defining Drained Lake Basins in a Continuous Permafrost Region, North Slope of Alaska, Remote Sens., 13, 2539, https://doi.org/10.3390/rs13132539, 2021. a, b, c
Brovkin, V., Brook, E., Williams, J. W., Bathiany, S., Lenton, T. M., Barton, M., DeConto, R. M., Donges, J. F., Ganopolski, A., McManus, J., Praetorius, S., de Vernal, A., Abe-Ouchi, A., Cheng, H., Claussen, M., Crucifix, M., Gallopín, G., Iglesias, V., Kaufman, D. S., Kleinen, T., Lambert, F., van der Leeuw, S., Liddy, H., Loutre, M.-F., McGee, D., Rehfeld, K., Rhodes, R., Seddon, A. W. R., Trauth, M. H., Vanderveken, L., and Yu, Z.: Past abrupt changes, tipping points and cascading impacts in the Earth system, Nat. Geosci., 14, 550–558, https://doi.org/10.1038/s41561-021-00790-5, 2021. a
Carroll, M. L., Townshend, J. R. G., DiMiceli, C. M., Loboda, T., and Sohlberg, R. A.: Shrinking lakes of the Arctic: Spatial relationships and trajectory of change, Geophys. Res. Lett., 38, L20406, https://doi.org/10.1029/2011gl049427, 2011. a
Chen, Y., Liu, A., and Cheng, X.: Vegetation grows more luxuriantly in Arctic permafrost drained lake basins, Glob. Change Biol., 27, 5865–5876, https://doi.org/10.1111/gcb.15853, 2021. a
Chen, Y., Cheng, X., Liu, A., Chen, Q., and Wang, C.: Tracking lake drainage events and drained lake basin vegetation dynamics across the Arctic, Nat. Commun., 14, 7359, https://doi.org/10.1038/s41467-023-43207-0, 2023. a
Ermokhina, K. A., Terskaia, A. I., Ivleva, T. Y., Dudov, S. V., Zemlianskii, V., Telyatnikov, M. Y., Khitun, O. V., Troeva, E. I., Koroleva, N. E., and Abdulmanova, S. Y.: The High–Low Arctic boundary: How is it determined and where is it located?, Ecol. Evol., 13, e10545, https://doi.org/10.1002/ece3.10545, 2023. a
ESA: Sentinel-1, ESA's Radar Observatory Mission for GMES Operational Services, Tech. rep., European Space Agency, ISBN 978-92-9221-418-0, 2012. a
ESA: Sentinel-2 User Handbook, Tech. rep., European Space Agency, 2015. a
Grosse, G., Jones, B., and Arp, C.: Thermokarst Lakes, Drainage, and Drained Basins, in: Treatise on Geomorphology, Elsevier, 325–353, https://doi.org/10.1016/b978-0-12-374739-6.00216-5, 2013. a, b
Göckede, M., Kwon, M. J., Kittler, F., Heimann, M., Zimov, N., and Zimov, S.: Negative feedback processes following drainage slow down permafrost degradation, Glob. Change Biol., 25, 3254–3266, https://doi.org/10.1111/gcb.14744, 2019. a
Hersbach, H., Bell, B., Berrisford, P., Hirahara, S., Horányi, A., Muñoz-Sabater, J., Nicolas, J., Peubey, C., Radu, R., Schepers, D., Simmons, A., Soci, C., Abdalla, S., Abellan, X., Balsamo, G., Bechtold, P., Biavati, G., Bidlot, J., Bonavita, M., De Chiara, G., Dahlgren, P., Dee, D., Diamantakis, M., Dragani, R., Flemming, J., Forbes, R., Fuentes, M., Geer, A., Haimberger, L., Healy, S., Hogan, R. J., Hólm, E., Janisková, M., Keeley, S., Laloyaux, P., Lopez, P., Lupu, C., Radnoti, G., de Rosnay, P., Rozum, I., Vamborg, F., Villaume, S., and Thépaut, J.-N.: The ERA5 global reanalysis, Q. J. Roy. Meteor. Soc., 146, 1999–2049, https://doi.org/10.1002/qj.3803, 2020. a, b
Hinkel, K. M., Eisner, W. R., Bockheim, J. G., Nelson, F. E., Peterson, K. M., and Dai, X.: Spatial Extent, Age, and Carbon Stocks in Drained Thaw Lake Basins on the Barrow Peninsula, Alaska, Arct. Antarct. Alp. Res., 35, 291–300, https://doi.org/10.1657/1523-0430(2003)035[0291:seaacs]2.0.co;2, 2003. a
IPCC: Climate Change 2022: Impacts, Adaptation, and Vulnerability. Contribution of Working Group II to the Sixth Assessment Report of the Intergovernmental Panel on Climate Change, IPCC Technical Summary, Cambridge, Cambridge University Press, 33–118, https://doi.org/10.1017/9781009325844.002, 2022. a
Jones, B. M., Grosse, G., Arp, C. D., Jones, M. C., Anthony, K. M. W., and Romanovsky, V. E.: Modern thermokarst lake dynamics in the continuous permafrost zone, northern Seward Peninsula, Alaska, J. Geophys. Res., 116, G00M03, https://doi.org/10.1029/2011jg001666, 2011. a
Jones, B. M., Grosse, G., Farquharson, L. M., Roy-Léveillée, P., Veremeeva, A., Kanevskiy, M. Z., Gaglioti, B. V., Breen, A. L., Parsekian, A. D., Ulrich, M., and Hinkel, K. M.: Lake and drained lake basin systems in lowland permafrost regions, Nat. Rev. Earth Environ., 3, 85–98, https://doi.org/10.1038/s43017-021-00238-9, 2022. a, b, c, d, e, f, g
Jorgenson, M. T. and Shur, Y.: Evolution of lakes and basins in northern Alaska and discussion of the thaw lake cycle, J. Geophys. Res., 112, F02S17, https://doi.org/10.1029/2006jf000531, 2007. a, b, c
Kanevskiy, M., Shur, Y., Jorgenson, M., Ping, C.-L., Michaelson, G., Fortier, D., Stephani, E., Dillon, M., and Tumskoy, V.: Ground ice in the upper permafrost of the Beaufort Sea coast of Alaska, Cold Reg. Sci. Technol., 85, 56–70, https://doi.org/10.1016/j.coldregions.2012.08.002, 2013. a
Karlsson, J., Lyon, S., and Destouni, G.: Temporal Behavior of Lake Size-Distribution in a Thawing Permafrost Landscape in Northwestern Siberia, Remote Sens., 6, 621–636, https://doi.org/10.3390/rs6010621, 2014. a
Kumpula, T., Forbes, B., and Stammler, F.: Remote Sensing and Local Knowledge of Hydrocarbon Exploitation: The Case of Bovanenkovo, Yamal Peninsula, West Siberia, Russia, Arctic, 63, 165–178, 2010. a, b
Kumpula, T., Pajunen, A., Kaarlejärvi, E., Forbes, B. C., and Stammler, F.: Land use and land cover change in Arctic Russia: Ecological and social implications of industrial development, Global Environ. Chang., 21, 550–562, https://doi.org/10.1016/j.gloenvcha.2010.12.010, 2011. a, b, c
Kumpula, T., Forbes, B. C., Stammler, F., and Meschtyb, N.: Dynamics of a Coupled System: Multi-Resolution Remote Sensing in Assessing Social-Ecological Responses during 25 Years of Gas Field Development in Arctic Russia, Remote Sens., 4, 1046–1068, https://doi.org/10.3390/rs4041046, 2012. a, b, c, d, e
Lanaras, C., Bioucas-Dias, J., Galliani, S., Baltsavias, E., and Schindler, K.: Super-resolution of Sentinel-2 images: Learning a globally applicable deep neural network, ISPRS J. Photogramm., 146, 305–319, https://doi.org/10.1016/j.isprsjprs.2018.09.018, 2018. a, b
Lantz, T. C.: Vegetation Succession and Environmental Conditions following Catastrophic Lake Drainage in Old Crow Flats, Yukon, Arctic, 70, 177, https://doi.org/10.14430/arctic4646, 2017. a, b
Lantz, T. C., Zhang, Y., and Kokelj, S. V.: Impacts of ecological succession and climate warming on permafrost aggradation in drained lake basins of the Tuktoyaktuk Coastlands, Northwest Territories, Canada, Permafrost Periglac. Proc., 33, 176–192, https://doi.org/10.1002/ppp.2143, 2022. a
Laptander, R., Horstkotte, T., Habeck, J. O., Rasmus, S., Komu, T., Matthes, H., Tømmervik, H., Istomin, K., Eronen, J. T., and Forbes, B. C.: Critical seasonal conditions in the reindeer-herding year: A synopsis of factors and events in Fennoscandia and northwestern Russia, Polar Sci., 39, 101 016, https://doi.org/10.1016/j.polar.2023.101016, 2024. a, b, c, d
Leibman, M., Khomutov, A., Gubarkov, A., Mullanurov, D., and Dvornikov, Y.: The research station “Vaskiny Dachi”, Central Yamal, West Siberia, Russia – a review of 25 years of permafrost studies, Fennia, 193, 3–30, https://doi.org/10.11143/45201, 2015. a, b, c
Liu, A., Chen, Y., and Cheng, X.: Effects of Thermokarst Lake Drainage on Localized Vegetation Greening in the Yamal–Gydan Tundra Ecoregion, Remote Sens., 15, 4561, https://doi.org/10.3390/rs15184561, 2023. a
Loiko, S., Klimova, N., Kuzmina, D., and Pokrovsky, O.: Lake Drainage in Permafrost Regions Produces Variable Plant Communities of High Biomass and Productivity, Plants, 9, 867, https://doi.org/10.3390/plants9070867, 2020. a, b, c, d, e
Magnússon, R. Í., Limpens, J., van Huissteden, J., Kleijn, D., Maximov, T. C., Rotbarth, R., Sass-Klaassen, U., and Heijmans, M. M. P. D.: Rapid Vegetation Succession and Coupled Permafrost Dynamics in Arctic Thaw Ponds in the Siberian Lowland Tundra, J. Geophys. Res.-Biogeo., 125, e2019JG005618, https://doi.org/10.1029/2019jg005618, 2020. a
Manasypov, R. M., Lim, A. G., Krickov, I. V., Shirokova, L. S., Shevchenko, V. P., Aliev, R. A., Karlsson, J., and Pokrovsky, O. S.: Carbon storage and burial in thermokarst lakes of permafrost peatlands, Biogeochem., 159, 69–86, https://doi.org/10.1007/s10533-022-00914-y, 2022. a, b
Matthews, E., Johnson, M. S., Genovese, V., Du, J., and Bastviken, D.: Methane emission from high latitude lakes: methane-centric lake classification and satellite-driven annual cycle of emissions, Sci. Rep., 10, 12465, https://doi.org/10.1038/s41598-020-68246-1, 2020. a
Nitze, I.: Trends of land surface change from Landsat time-series 1999–2014, PANGAEA [data set], https://doi.org/10.1594/PANGAEA.884137, 2018. a, b, c, d, e, f, g
Nitze, I., Grosse, G., Jones, B. M., Romanovsky, V. E., and Boike, J.: Remote sensing quantifies widespread abundance of permafrost region disturbances across the Arctic and Subarctic, Datasets, PANGAEA [data set], https://doi.org/10.1594/PANGAEA.894755, 2018. a, b, c, d
Nitze, I., Cooley, S. W., Duguay, C. R., Jones, B. M., and Grosse, G.: The catastrophic thermokarst lake drainage events of 2018 in northwestern Alaska: fast-forward into the future, The Cryosphere, 14, 4279–4297, https://doi.org/10.5194/tc-14-4279-2020, 2020. a, b
Obu, J., Westermann, S., Barboux, C., Bartsch, A., Delaloye, R., Grosse, G., Heim, B., Hugelius, G., Irrgang, A., Kääb, A. M., Kroisleitner, C., Matthes, H., Nitze, I., Pellet, C., Seifert, F. M., Strozzi, T., Wegmüller, U., Wieczorek, M., and Wiesmann, A.: ESA Permafrost Climate Change Initiative (Permafrost cci): Permafrost extent for the Northern Hemisphere, v3.0, CEDA Archive [data set], https://doi.org/10.5285/6E2091CB0C8B4106921B63CD5357C97C, 2021. a, b
Raynolds, M. K., Walker, D. A., Balser, A., Bay, C., Campbell, M., Cherosov, M. M., Daniëls, F. J., Eidesen, P. B., Ermokhina, K. A., Frost, G. V., Jedrzejek, B., Jorgenson, M. T., Kennedy, B. E., Kholod, S. S., Lavrinenko, I. A., Lavrinenko, O. V., Magnússon, B., Matveyeva, N. V., Metúsalemsson, S., Nilsen, L., Olthof, I., Pospelov, I. N., Pospelova, E. B., Pouliot, D., Razzhivin, V., Schaepman-Strub, G., Šibík, J., Telyatnikov, M. Y., and Troeva, E.: A raster version of the Circumpolar Arctic Vegetation Map (CAVM), Remote Sens. Environ., 232, 111297, https://doi.org/10.1016/j.rse.2019.111297, 2019. a, b, c
Schneider, J., Grosse, G., and Wagner, D.: Land cover classification of tundra environments in the Arctic Lena Delta based on Landsat 7 ETM+ data and its application for upscaling of methane emissions, Remote Sens. Environ., 113, 380–391, https://doi.org/10.1016/j.rse.2008.10.013, 2009. a
Schubert, A., Miranda, N., Geudtner, D., and Small, D.: Sentinel-1A/B Combined Product Geolocation Accuracy, Remote Sens., 9, 607, https://doi.org/10.3390/rs9060607, 2017. a
Schuur, E. A., Abbott, B. W., Commane, R., Ernakovich, J., Euskirchen, E., Hugelius, G., Grosse, G., Jones, M., Koven, C., Leshyk, V., Lawrence, D., Loranty, M. M., Mauritz, M., Olefeldt, D., Natali, S., Rodenhizer, H., Salmon, V., Schädel, C., Strauss, J., Treat, C., and Turetsky, M.: Permafrost and Climate Change: Carbon Cycle Feedbacks From the Warming Arctic, Ann. Rev. Environ. Res., 47, 343–371, https://doi.org/10.1146/annurev-environ-012220-011847, 2022. a, b
Smith, L. C., Sheng, Y., MacDonald, G. M., and Hinzman, L. D.: Disappearing Arctic Lakes, Science, 308, 1429–1429, https://doi.org/10.1126/science.1108142, 2005. a, b
Spiegel, M. P., Volkovitskiy, A., Terekhina, A., Forbes, B. C., Park, T., and Macias‐Fauria, M.: Top‐Down Regulation by a Reindeer Herding System Limits Climate‐Driven Arctic Vegetation Change at a Regional Scale, Earth’s Future, 11, e2022EF003407, https://doi.org/10.1029/2022ef003407, 2023. a
Treat, C. C., Virkkala, A., Burke, E., Bruhwiler, L., Chatterjee, A., Fisher, J. B., Hashemi, J., Parmentier, F. W., Rogers, B. M., Westermann, S., Watts, J. D., Blanc‐Betes, E., Fuchs, M., Kruse, S., Malhotra, A., Miner, K., Strauss, J., Armstrong, A., Epstein, H. E., Gay, B., Goeckede, M., Kalhori, A., Kou, D., Miller, C. E., Natali, S. M., Oh, Y., Shakil, S., Sonnentag, O., Varner, R. K., Zolkos, S., Schuur, E. A., and Hugelius, G.: Permafrost Carbon: Progress on Understanding Stocks and Fluxes Across Northern Terrestrial Ecosystems, J. Geophys. Res.-Biogeo., 129, e2023JG007638, https://doi.org/10.1029/2023jg007638, 2024. a, b, c
Turetsky, M. R., Abbott, B. W., Jones, M. C., Anthony, K. W., Olefeldt, D., Schuur, E. A. G., Grosse, G., Kuhry, P., Hugelius, G., Koven, C., Lawrence, D. M., Gibson, C., Sannel, A. B. K., and McGuire, A. D.: Carbon release through abrupt permafrost thaw, Nat. Geosci., 13, 138–143, https://doi.org/10.1038/s41561-019-0526-0, 2020. a, b
Volkovitskiy, A. and Terekhina, A.: A microregional reindeer herding landscape in Yamal: patterns and dynamics of movements, Pastoralism, 13, 27, https://doi.org/10.1186/s13570-023-00292-6, 2023. a
Walker, D. A., Raynolds, M. K., Daniëls, F. J., Einarsson, E., Elvebakk, A., Gould, W. A., Katenin, A. E., Kholod, S. S., Markon, C. J., Melnikov, E. S., Moskalenko, N. G., Talbot, S. S., Yurtsev, B. A., and other members of the CAVM Team: The Circumpolar Arctic vegetation map, J. Veg. Sci., 16, 267–282, https://doi.org/10.1111/j.1654-1103.2005.tb02365.x, 2005. a, b, c
Widhalm, B., Bartsch, A., Siewert, M. B., Hugelius, G., Elberling, B., Leibman, M., Dvornikov, Y., and Khomutov, A.: Site scale wetness classification of tundra regions with C-band SAR satellite data, Proceedings of the ESA Living Planet Symposium, ESA SP-740 (August 2016), ISBN 9789292213053, 2016. a
Widhalm, B., Bartsch, A., and Goler, R.: Simplified Normalization of C-Band Synthetic Aperture Radar Data for Terrestrial Applications in High Latitude Environments, Remote Sens., 10, 551, https://doi.org/10.3390/rs10040551, 2018. a