the Creative Commons Attribution 4.0 License.
the Creative Commons Attribution 4.0 License.
 | 23 Aug 2024
Interactive snow avalanche segmentation from webcam imagery: results, potential, and limitations
Elisabeth D. Hafner
Theodora Kontogianni
Rodrigo Caye Daudt
Lucien Oberson
Jan Dirk Wegner
Konrad Schindler
Yves Bühler
For many safety-related applications such as hazard mapping or road management, well-documented avalanche events are crucial. Nowadays, despite the variety of research directions, the available data are mostly restricted to isolated locations where they are collected by observers in the field. Webcams are becoming more frequent in the Alps and beyond, capturing numerous avalanche-prone slopes. To complement the knowledge about avalanche occurrences, we propose making use of this webcam imagery for avalanche mapping. For humans, avalanches are relatively easy to identify, but the manual mapping of their outlines is time intensive. Therefore, we propose supporting the mapping of avalanches in images with a learned segmentation model. In interactive avalanche segmentation (IAS), a user collaborates with a deep-learning model to segment the avalanche outlines, taking advantage of human expert knowledge while keeping the effort low thanks to the model's ability to delineate avalanches. The human corrections to the segmentation in the form of positive clicks on the avalanche or negative clicks on the background result in avalanche outlines of good quality with little effort. Relying on IAS, we extract avalanches from the images in a flexible and efficient manner, resulting in a 90 % time saving compared to conventional manual mapping. The images can be georeferenced with a mono-photogrammetry tool, allowing for exact geolocation of the avalanche outlines and subsequent use in geographical information systems (GISs). If a webcam is mounted in a stable position, the georeferencing can be re-used for all subsequent images. In this way, all avalanches mapped in images from a webcam can be imported into a designated database, making them available for the relevant safety-related applications. For imagery, we rely on current data and data archived from webcams that cover Dischma Valley near Davos, Switzerland, and that have captured an image every 30 min during the daytime since the winter of 2019. Our model and the associated mapping pipeline represent an important step forward towards continuous and precise avalanche documentation, complementing existing databases and thereby providing a better base for safety-critical decisions and planning in avalanche-prone mountain regions.
- Article
(6585 KB) - Full-text XML
- BibTeX
- EndNote


Information on avalanche occurrences is crucial for many safety-related applications: for hazard mitigation, the dimensions of past avalanches are crucial for planning new and evaluating existing protection measures (e.g., Rudolf-Miklau et al., 2015). For the derivation of risk scenarios and the estimation of avalanche frequency, past events are an important piece of information as well (Bründl and Margreth, 2015). Mapped avalanches are also used to fine-tune and further develop numerical avalanche simulation software like SAMOS or RAMMS (Sampl and Zwinger, 2004; Christen et al., 2010). Today, information on past avalanches is still mainly reported and collected unsystematically from isolated locations by observers and (local) avalanche warning services, though more recent research has proposed using satellite imagery (e.g., Eckerstorfer et al., 2016; Wesselink et al., 2017; Bianchi et al., 2021; Hafner et al., 2022). Depending on the source, these reports contain information on the avalanche type; the avalanche size; the approximate release time; the complete outlines, or at least the approximate location; the aspect; the type of trigger; and additional parameters. To enlarge the knowledge about avalanche occurrences, we propose a systematic recording of avalanches from webcam imagery. This usage of existing infrastructure allows for a large-scale application anywhere avalanche-prone slopes are already captured by webcams. Images can be acquired as frequently as needed without additional cost, enabling a near-real-time determination of release time. Furthermore, the sequence of images increases the chance of obtaining an image without low cloud cover or fog that would prevent documentation of the whole avalanche. Except for our own initial proposition (Hafner et al., 2023a) and that of Fox et al. (2023), we do not know of any attempt that makes use of this data source for avalanche identification and documentation. Fox et al. (2023) proposed two models in their initial experimental study for automatic avalanche detection from ground-based photographs: one for classifying images with and without avalanche occurrences and the other for segmenting the contained avalanches with bounding boxes. In opposition to their focus on finding the images and areas containing avalanches, we are aiming to extract the exact avalanche outlines from the imagery.
Detecting individual objects and determining their outlines is the objective of instance segmentation. This is important, for example, in the fields of autonomous driving (e.g., De Brabandere et al., 2017), remote sensing (e.g., Liu et al., 2022), and medical imaging (e.g., Chen et al., 2020). Numerous instance segmentation models have been proposed in recent years that are based on the superior image-understanding capabilities of deep learning. Besides the quest for fully automatic methods, there is also an area of research dedicated to interactive object segmentation (IOS), where a human collaborates with the computer vision model to segment the desired object with high accuracy but low effort (Boykov and Jolly, 2001; Gulshan et al., 2010; Xu et al., 2016; Sofiiuk et al., 2020; Kontogianni et al., 2020; Lin et al., 2022; Kirillov et al., 2023). The human operator explicitly controls the segmentation, first by an initial input to mark the desired object (e.g., through a click or scribbles) and then by iteratively adding annotations to correct the segmentation where the automatic model makes mistakes, gradually refining the result. The goal is an accurate segmentation, provided by the IOS model with as little user input as possible. The key differences compared to instance segmentation are the user corrections and the way they are processed and encoded in the model. The vast majority of models proposed in recent years are employing clicks from the user for correcting the segmentation (e.g., Boykov and Jolly, 2001; Rother et al., 2004; Xu et al., 2016; Benenson et al., 2019; Kontogianni et al., 2020; Sofiiuk et al., 2021) and are using a combination of random sampling and simulating user clicks for training the model. The neighborhood of the clicked pixel is expanded to disks with radii of 3 to 5 pixels or to Gaussians, depending on the model. When disks are used to encode clicks, the whole area specified by the radius is given the same weight. When clicks are encoded as Gaussians, the weight is a Gaussian distribution, decreasing from the center of the click over the area specified by the radius.
There has been little work on webcam(-like) imagery; the dominant data source for automatic avalanche documentation so far has been satellite imagery (e.g., Bühler et al., 2019; Eckerstorfer et al., 2019; Hafner et al., 2021; Bianchi et al., 2021; Karas et al., 2022; Kapper et al., 2023). Optical satellite data, proven to be suitable to reliably capture avalanches (spatial resolution of approx. 2 m or finer; Hafner et al., 2021, 2023b), need to be ordered and captured upon request, which is expensive and dependent on cloud-free weather conditions. Radar data have the big advantage of being weather independent, but with one satellite in operation, open-access Sentinel-1 data are only available at selected dates (currently, approximately every 12 d in Switzerland), and other suitable radar data need to be ordered and purchased as well. Additionally, with a spatial resolution of approximately 10–15 m, it is not possible to confidently map avalanches of size 3 and smaller from Sentinel-1 imagery (Hafner et al., 2021; Keskinen et al., 2022). Furthermore, the exact or even approximate time of avalanche release cannot be retrieved from satellite data and remains unknown. However, where suitable satellite data are available, areas affected by avalanches may be identified and documented continuously over large regions with identical methodology.
Applications relying on information about avalanche occurrences not only seek confirmation of an avalanche near a specific webcam but also require details such as the precise location, extent, aspect of the release area, and size of the avalanche. Avalanches captured on oblique photographs may be georeferenced to enable a transfer of the avalanche identified in the image to a map. There are several mono-photogrammetry tools available to georeference single images, initially developed to georeference historic photographs (e.g., Bozzini et al., 2012, 2013; Produit et al., 2016; Golparvar and Wang, 2021). Only with existing georeferencing can the detected avalanches be exactly geolocated; compared by size, aspect, or slope angle; and imported into existing long-term databases. Since most webcams are mounted in a stable position, always capturing the same area, the georeferencing only needs to be done once and may be re-used for all subsequent images.
To complement the currently established ways avalanche occurrences are documented, we propose using webcam infrastructure, regularly acquiring imagery for avalanche mapping. In the present work, we identify avalanches in imagery employing interactive object segmentation (interactive avalanche segmentation, IAS). Since human user interactions are modeled during training, we investigate the transferability of our model results to real-world use by humans in a user study. We use webcam imagery from stations maintained by the WSL Institute for Snow and Avalanche Research SLF (SLF), available every 30 min in near-real time, and the avalanche library published by Fox et al. (2023). Additionally, we propose a workflow to georeference the identified avalanches with the mono-photogrammetry tool from Bozzini et al. (2012, 2013). By mapping avalanches from webcam imagery, we enlarge existing avalanche databases, thereby allowing for better decision-making for downstream applications.
2.1 SLF webcam network
Our webcam network covers the Dischma Valley, a high alpine side valley of Davos, with 14 cameras mounted at six different locations (Fig. 1). The valley is about 13 km long, and the valley floor reaches from 1500 to 2000 m a.s.l., while the summits reach heights over 3000 m a.s.l. The Dischma Valley is permanently inhabited in the lower 5 km, while the road leading to its upper part is closed in winter. Steep mountains are located on both sides of the valley, and over 80 % of the entire area constitutes potential avalanche terrain (Bühler et al., 2022). Outside the permanent settlements, avalanches can only be monitored remotely, especially during high avalanche danger.
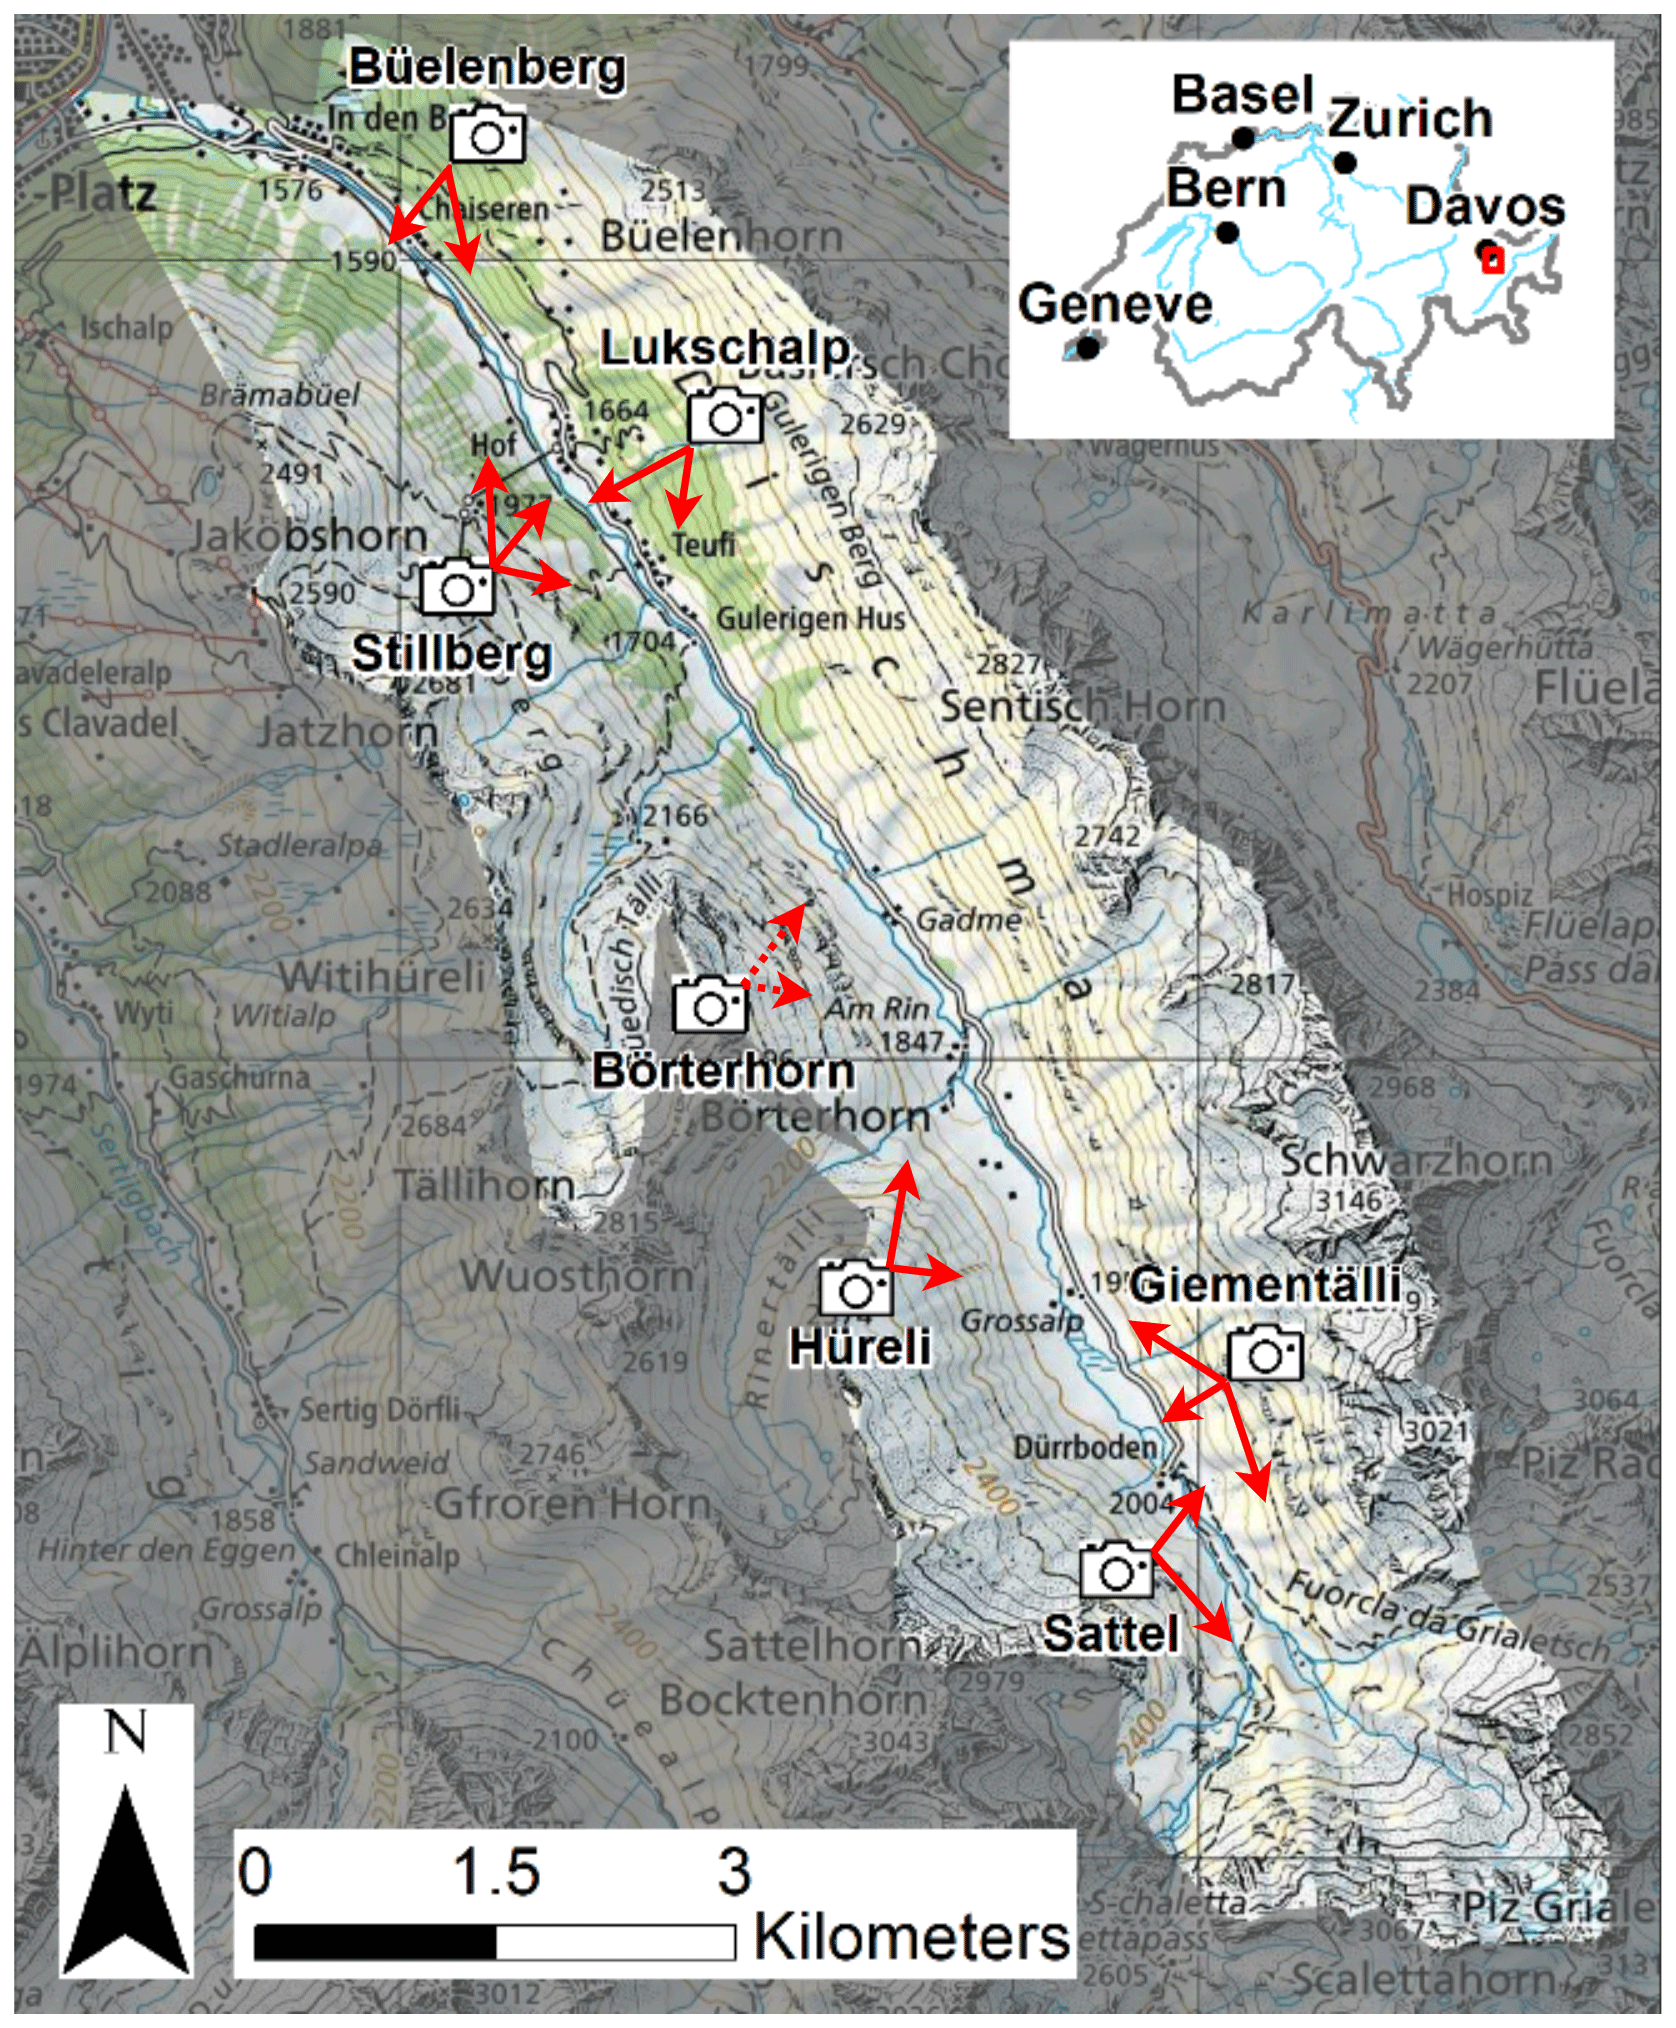
Figure 1Locations, view directions (red arrows), and area covered by the 14 cameras mounted in six different locations in the Dischma Valley, Davos. The Hüreli station succeeded the Börterhorn station (dashed arrows), which is no longer in operation (map source: Federal Office of Topography).
Each of our six stations is equipped with two to three cameras (usually a Canon EOS M100), operated with an independent power supply with a solar panel and a battery, except for Stillberg, where we connected to existing power lines (Fig. 2). The acquisition of images every 30 min during daylight is programmed and automatically triggered by a small on-station computer. This interval lowers the risk of cloud cover and captures avalanches under different illumination conditions once they have occurred. The images are then sent to SLF in near-real time via the mobile network and are stored on a server. The first camera was mounted at the Büelenberg station in the summer of 2019, with the next four stations being established in the following months. The Börterhorn station came later, having only been in operation from December 2021 to June 2023, and was moved to a new location with a similar view in December 2023 (Hüreli station). The images have previously been used in the ESA DeFROST project (ESA, 2020) and in Baumer et al. (2023).
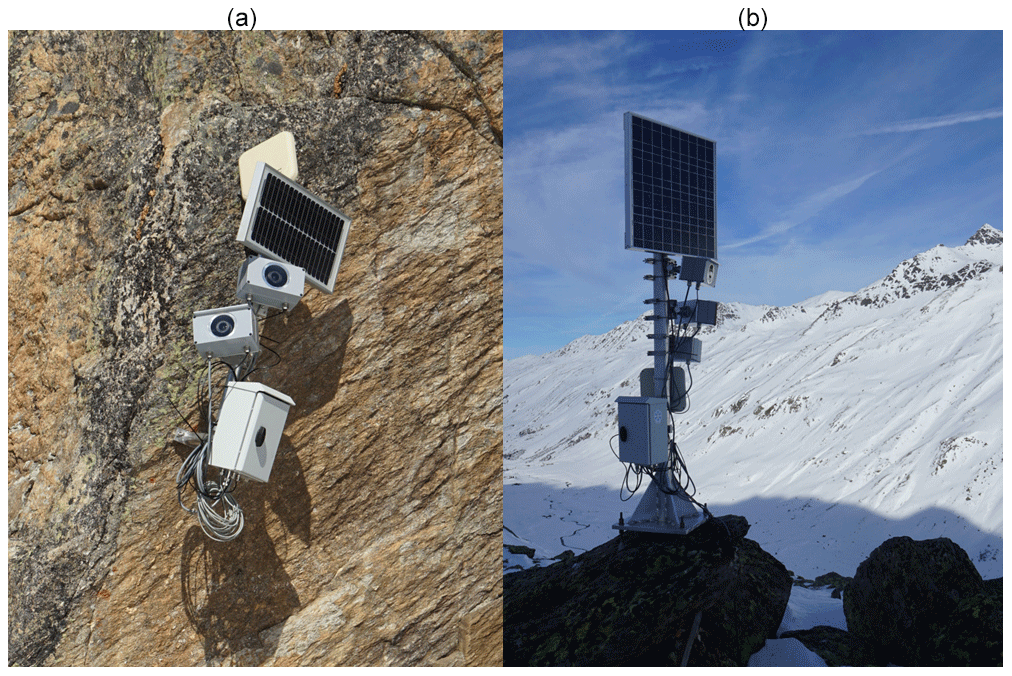
Figure 2The stations in the Dischma Valley were either bolted to rock faces (a: Lukschalp) or mounted on a mast (b: Sattel). They host two to three cameras and all the infrastructure necessary to ensure power supply, as well as data acquisition and transmission.
2.2 Avalanche images and annotations
We used unique sets of images for the model to learn from (training), for the unbiased evaluation during training and hyperparameter tuning (validation), and for the unbiased evaluation of the final model (testing).
2.2.1 SLF dataset
We rely on imagery from the webcams at our stations for training (all except Börterhorn and Hüreli; Sect. 2.1), validation, and testing. The images, with a size of 6000×4000 pixels, are from seven different cameras that have captured identifiable avalanches well since being in operation. For training, we prepared the images and cropped them to 1000×1000 pixels, keeping only the avalanches and their immediate surroundings in the original resolution. For evaluation and for our user study, we want to segment all captured avalanches per image; therefore, we only resized the images to 3600×2400, the largest the model may handle.
The avalanches in the images were manually annotated with the smart labeling interface provided by Supervisely (Supervisely, 2023). The SLF dataset contains roughly 400 annotated avalanches (Table 1). About three-quarters of the avalanches are used for training, testing, and validation, while the rest are used to test generalizability. For this, we use images with a certain domain gap relative to the training images: 46 images from the two Börterhorn webcams, excluded from training (WebNew) and a set of 44 images taken from handheld cameras (GroundPic; Table 1). The WebNew contains mostly small avalanches, some of them captured under diffuse illumination conditions, while the GroundPic depicts larger avalanches and includes some lower quality images taken with mobile phones. For our user study, we relied on a combination of different webcam images showing avalanches of different sizes and captured under varying illumination conditions. Of the 20 annotated avalanches (UserPic), 75 % are unique to the dataset, while the rest are also part of the WebNew or the GroundPic.
Fox et al. (2023)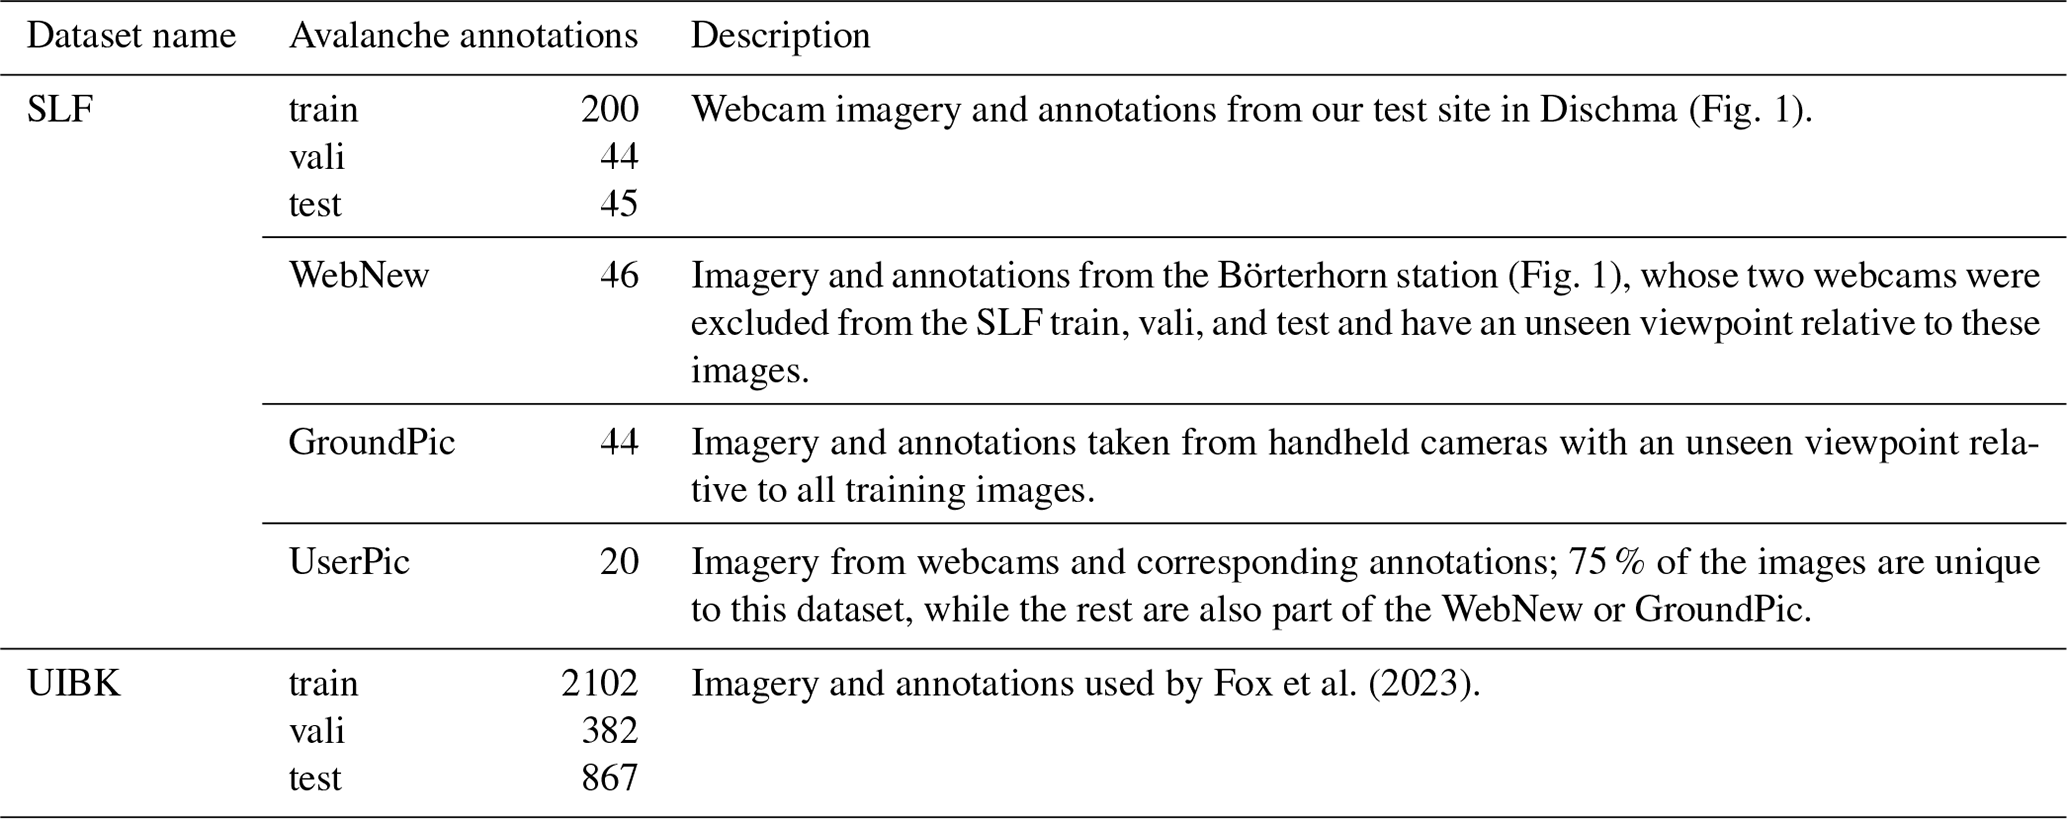
2.2.2 UIBK dataset
Fox et al. (2023) have published a dataset containing images of over 3000 avalanches from different perspectives, with annotations of the avalanche type (slab, loose snow, and glide snow avalanches; University of Innsbruck et al., 2023). In addition to avalanches, their category “glide snow avalanche” also contains glide snow cracks where no avalanche has occurred (yet). We decided to include a selection of their annotations in some of our training configurations to evaluate the performance of our setup using a multi-source dataset. We are, however, interested in avalanches only; therefore, we manually sorted out images with glide snow cracks and excluded them for training. Consequently, we used a subset of 2102 binary avalanche masks from the UIBK dataset for training and 382 avalanches for validation, which we prepared by cropping to 1000×1000 pixels (Table 1). For the test dataset, we kept all images, depicting 867 avalanches and glide snow cracks, to allow for a fair comparison to Fox et al. (2023). Fox et al. (2023) provide no details about the manual annotation procedure. We note that, upon comparison, their annotations are markedly coarser than ours, with significantly smoother and more generalized avalanche outlines (e.g., Fig. 3). We resized the images larger than 3600×2400 to that size for the evaluation.
Figure 3Comparing the details in the annotation from one of the SLF webcam images (left) to an image from the UIBK dataset (right; University of Innsbruck et al., 2023).
We used a state-of-the-art interactive image segmentation model (Sofiiuk et al., 2021), modified it for avalanches, and trained it with three different sets of avalanche imagery. The trained model was then applied to new, unseen images to qualitatively and quantitatively evaluate the resulting avalanche outlines using both per-pixel and per-avalanche metrics. It is important to note that click locations have to be selected automatically to enable large-scale training and testing. This could lead to performance differences caused by deviations between simulated clicks and real user behavior. We therefore additionally designed and carried out a user study with human annotators to ascertain that the efficiency gains carry over to the real use case.
3.1 Model architecture
We employed the interactive segmentation model introduced by Sofiiuk et al. (2021), adapted it specifically to avalanches, and trained it with a variety of avalanche datasets. Sofiiuk et al. (2021) used the HRNet+OCR method, a high-resolution network (HRNet) with an added object-contextual-representation (OCR) module (Wang et al., 2020; Yuan et al., 2020; Xu and Zhao, 2024). The HRNet+OCR architecture connects high- and low-resolution convolutional processing streams in parallel and enables information exchange across different resolutions (Wang et al., 2020). The OCR module explicitly accounts for the global context to achieve better segmentation of objects in complex images (Xu and Zhao, 2024), which is particularly valuable in our case, where avalanches that can make up large parts of the images while being hard to distinguish from the white snow in the background if considering only local evidence. Positive and negative click locations from interactive user input were encoded as disks with a fixed radius of 5 pixels (Benenson et al., 2019).
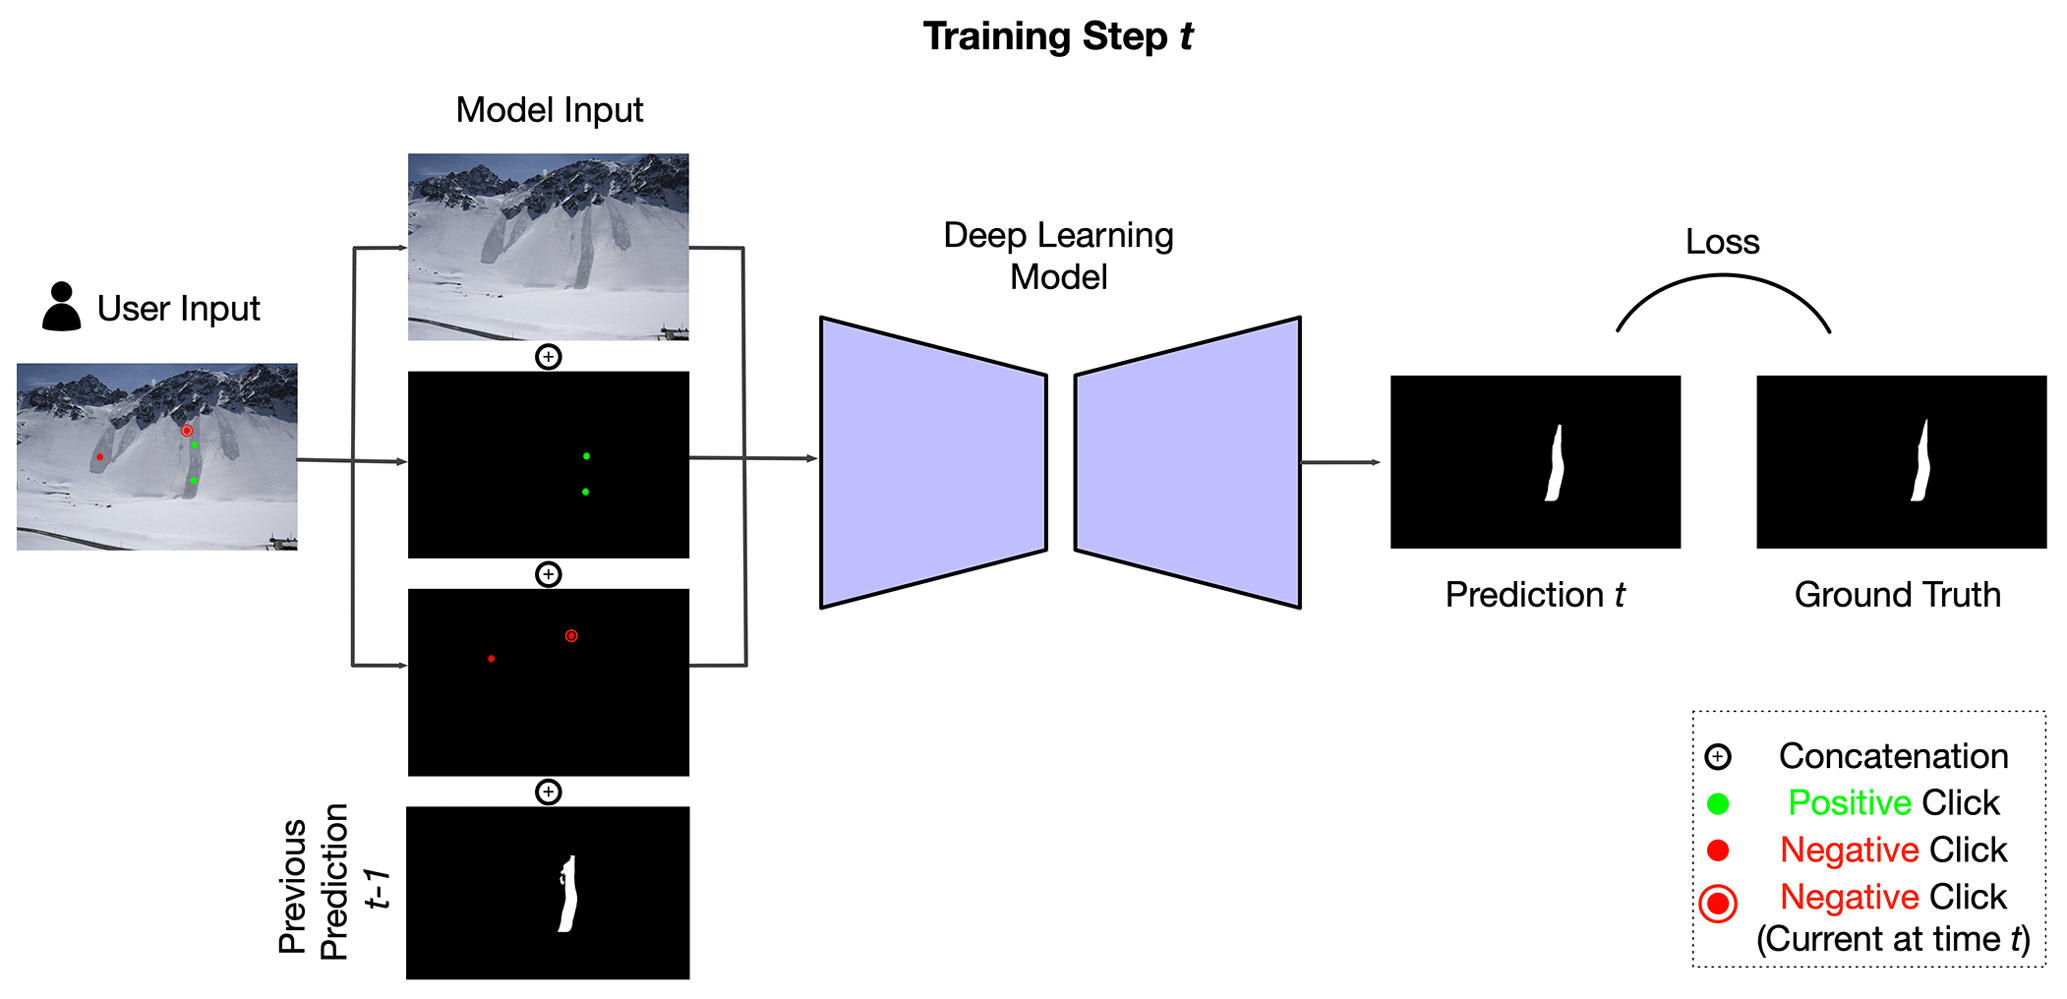
Semantic segmentation backbones usually take only RGB images as input; for interactive segmentation, the handling of additional model input – in our case, encoded user clicks – needs to be carefully implemented (Fig. 4). Sofiiuk et al. (2021)'s solution to this is Conv1S: a convolutional block that outputs a tensor of exactly the same shape as the first convolutional block in the backbone. The output of the first backbone convolutional layer (usually 64 channels) is then summed up element-wise, with the convolutional block being applied to the encoded user clicks. With this implementation, it is possible to choose a different learning rate for new weights without affecting the weights of a pre-trained backbone.
A combination of random and iterative sampling strategies are employed to simulate human user clicks for training, with masks from previous steps being included in the iterative sampling procedure (Fig. 5). Morphological erosion is used to shrink the largest mislabeled region before setting the sampling point into its center, which proved to be superior to simply setting the next click in the center of the erroneous region (Mahadevan et al., 2018). The click may be positive, denoting the avalanche, or negative for the background. In the evaluation mode, the click is put at the center of the largest erroneous region, be it false positive or false negative, as proposed in Xu et al. (2016) and Li et al. (2018). The maximum number of clicks (positive or negative) is set to 20 for both training and evaluation.
We made the following adaptions to the original model from Sofiiuk et al. (2021):
-
We trained on patches of 600×600 pixels instead of patches of 320×480 pixels, which we cropped from varying places of our training images.
-
For data augmentation during training, we additionally included random translation (max. 3 %) and rotation (max. 10°).
-
We replaced the manual multistep learning-rate scheduler with a cosine learning-rate scheduler to profit from a decreasing learning rate without the need to fiddle with the steps and rates of decay.
-
We did not use the zoom-in function.
-
We used a batch size of 4 instead of 28 due to our relatively small training dataset but fine image resolution.
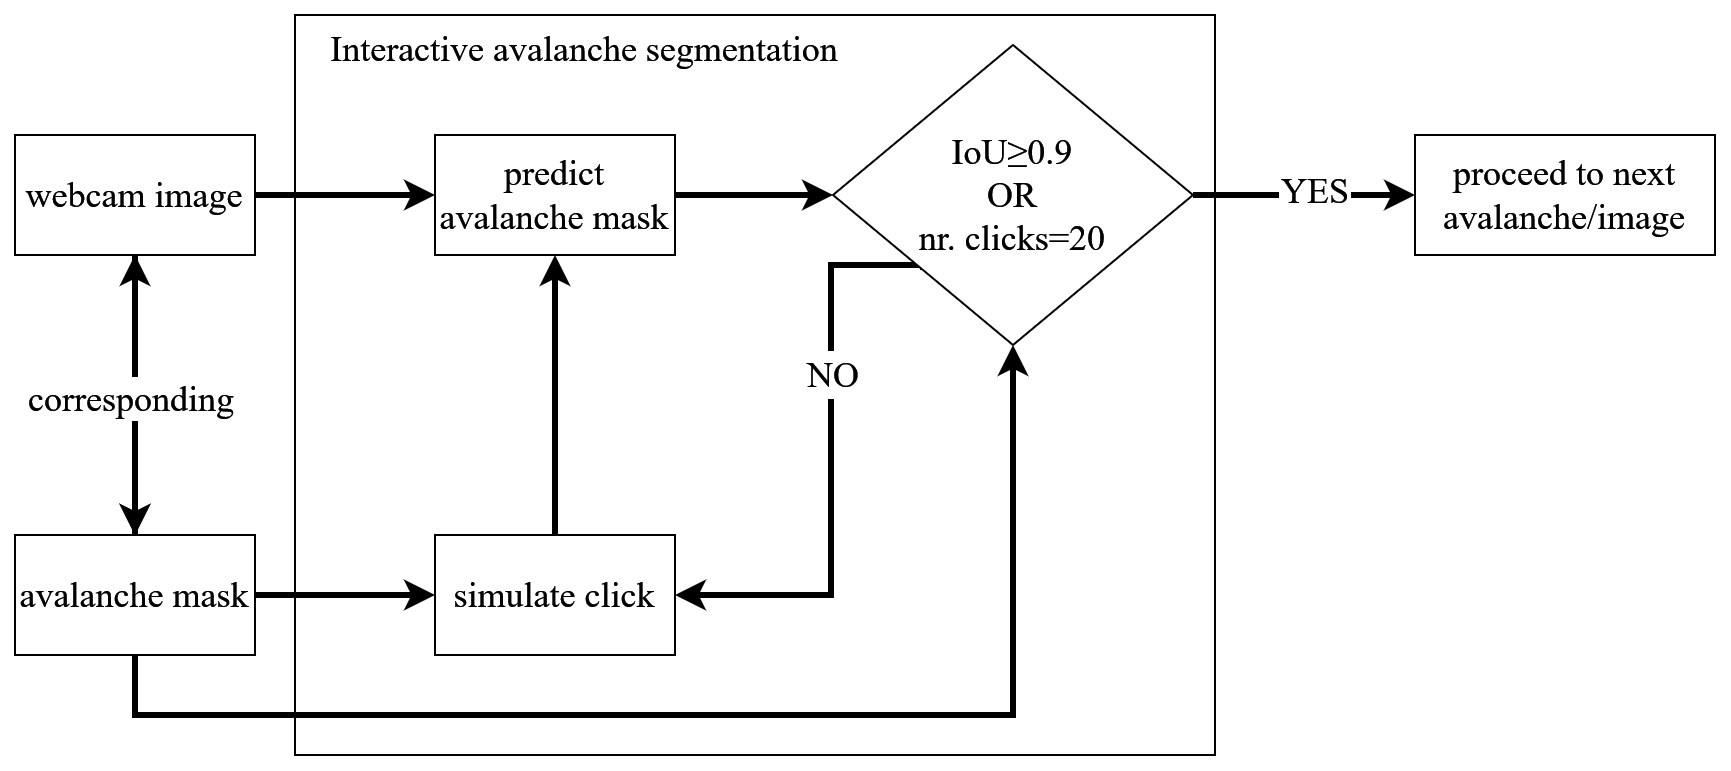
Figure 5Illustration of the handling of one avalanche when training the IAS model with clicks generated by random and iterative sampling. For the new prediction, all previous clicks, as well as the previous mask (if available), are considered.
3.2 Evaluation metrics
The raw predictions (i.e., the per-pixel probabilities for being part of the avalanche) were thresholded at 0.5 to obtain binary avalanche masks for the analyses. We used the intersection over union (IoU) as an indicator of spatial agreement between either the predicted and ground truth masks or the bounding boxes around those masks (e.g., Levandowsky and Winter, 1971).
3.2.1 Pixel-wise metrics
On the pixel level of the masks, we recorded the average number of clicks (NoC) necessary to reach IoU thresholds of 0.8 and 0.9 (denoted as mNoC@80 and mNoC@90, respectively). Achieving a high IoU after few clicks makes the model most useful. Consequently, we compared the IoU at click k (for ) averaged over all the images (mIoU@k). Additionally, we calculated the number of images that do not reach 0.85 IoU, even after 20 clicks (NoC20@85).
3.2.2 Object-wise metrics
On the object level, we compared the IoU of the bounding box of the predicted and that of the ground truth avalanche annotation. If the IoU between two bounding boxes is larger than or equal to a threshold T, the detection is considered to be correct, while, for values below the threshold T, it is not (Padilla et al., 2020). Like Fox et al. (2023), we first considered a T≥5 % between the bounding boxes to be a match, but, additionally, we evaluated with T≥50 %, which is a more standard value in literature (Redmon et al., 2016; He et al., 2018).
From the matches, we computed the F1 score as
where the probability of detection (POD) and positive predictive value (PPV) are defined as
where TP is true positive, FP is false positive, and FN is false negative.
3.2.3 Comparison of time needed
The time spent to map an avalanche with the “traditional method”, such as with the avalanches that are part of the DAvalMap inventory (Hafner et al., 2021), is not recorded by default. For a comparison to the time spent on IAS, we had one experienced person record the number of minutes needed for manually mapping 274 avalanches from photographs (mean size of 1.75; European avalanche size definition (EAWS, 2024)) with the methodology described in Hafner et al. (study 2; 2023b).
3.3 Experimental setup
To find the best model for interactively segmenting avalanches from our webcam imagery, we evaluated several training regimes, all with the same model architecture but varying training datasets (see Sect. 3.1). Our baseline was the model trained only on COCO+LVIS (104 000 images and 1.6 million instance-level masks; Lin et al., 2015; Gupta et al., 2019), meaning that it has never seen an avalanche. We then trained three further versions, re-using the knowledge already learned from being trained on COCO+LVIS and fine-tuning the model with different sets of avalanche data: AvaWeb, trained on the SLF dataset; AvaPic, trained on the UIBK dataset; and AvaMix, trained on a combination of those two (Table 1). Preliminary tests confirmed that fine-tuning the model pre-trained on COCO+LVIS was always superior to training from scratch using only avalanche data. This is in line with previous work on avalanches (Hafner et al., 2022). We performed hyperparameter tuning on the validation set (e.g., selecting the ideal number of training epochs – 90 for AvaWeb and AvaPic and 95 for AvaMix – and using a threshold of 0.5 on the raw predictions). We used the hyperparameters selected from the validation set, fixed during our evaluation, of the test set. Using the evaluation, we checked how well the model generalizes to the SLF test, as well as to images from other webcams (WebNew). We additionally evaluated the GroundPic and the UIBK test to assess the robustness of the model configurations in relation to images from outside our webcam perspective. In addition, we compared to segmentation results from previous work by Fox et al. (2023) by calculating bounding boxes for our predictions and evaluating their overlap with respect to the ground truth bounding boxes from the UIBK test.
3.4 User study
We carried out a small user study to investigate if the metrics from evaluating our model hold with real users, whose inputs are noisier and who may adapt to model behavior. Eight participants were given a short introduction and mapped one avalanche per UserPic image. For our user study, we used the graphical user interface (GUI) provided by Sofiiuk et al. (2021), adapting it to save the click coordinates, the time needed per click, and the predicted masks for each click together with the IoU. Since several images captured more than one avalanche, we added an arrow pointing at the desired avalanche in each UserPic image. Before segmenting the marked avalanches in UserPic, the participants performed two trial segmentations that were not used for evaluation to familiarize themselves with the GUI, the annotation protocol, and the data characteristics. Participants were allowed a maximum number of 20 clicks per avalanche but were told they could stop earlier if they were satisfied with the segmentation. As metrics for the user study, we calculated the mNoC@80 and mNoC@90 and compared the mIoU@k, the mean annotation time, the NoC20@85, and the differences between the best and worst results in terms of mean IoU. To investigate variability in the avalanche areas identified, like in Hafner et al. (2023b), we calculated pairwise IoU scores for the final masks based on the last employed click per participant. To test whether the differences between the mIoU scores of the participants are statistically significant, we used the two-sided t test (as implemented in R Core Team, 2021), with a significance level p≤0.05.
4.1 Pixel-wise metrics
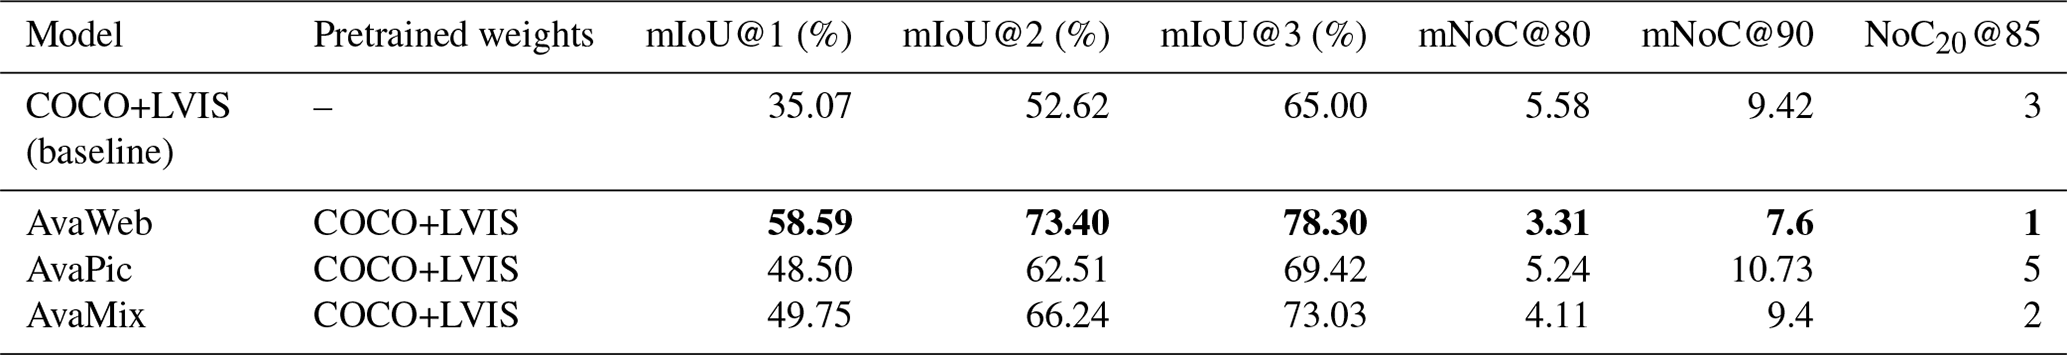
Evaluating based on the SLF test, the model trained on the AvaWeb was almost 10 % better than the others and almost 25 % better than the baseline (COCO+LVIS; Fig. 6) from click 1. It remained on top, but the others caught up by approximately click 16. AvaPic was consistently the worst at high click numbers and even dropped below the baseline. Adding the data from AvaWeb to AvaPic in the AvaMix improved the results, but the quality reached only half that of the results of the AvaWeb alone. Compared to the baseline, all models trained with avalanches were superior to the baseline, especially for the first half of the clicks and, except for the AvaPic, for the last half of the clicks. Overall, the AvaWeb needed the least clicks to reach the desired IoU thresholds, and it was only for one image that it never reached the NoC20@85. The AvaPic never reached this threshold for five images, while this was the case for only two images for the AvaMix, and even the baseline reached an IoU of 85 % for more images. For the remaining analyses, we did not consider the model trained only on COCO+LVIS (baseline).
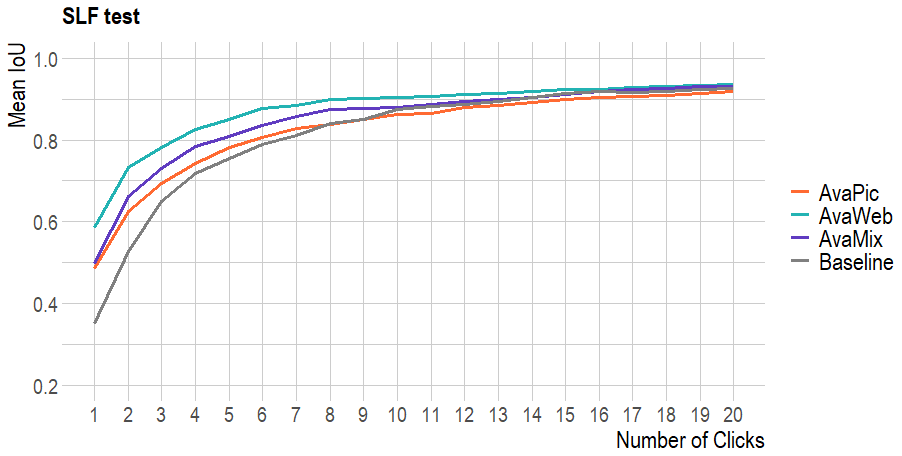
Figure 6Evaluation on the SLF test based on models trained with different datasets: baseline (COCO-LVIS), AvaWeb (SLF-train), AvaPic (UIBK-train), and AvaMix (SLF + UIBK-train).
Table 2Results for the different datasets when evaluating based on the SLF test. The bold values highlight the best metrics.
To check how well the models generalize to new avalanches under varying perspectives, we evaluated them based on the WebNew, the GroundPic, and the UIBK test (Fig. 8, Table 3): AvaWeb was superior, with a margin of up to 30 % from click 1, over the AvaPic and AvaMix based on the WebNew (Table 2; Fig. 7). The AvaPic and AvaMix only caught up around click 10 but never surpassed the AvaWeb. For all models, the images in the NoC20@85 category depicted small, often long and slim avalanches located in the shade in imagery acquired under diffuse-illumination conditions and/or avalanches that had been snowed on, reducing the overall visibility of the features (Fig. 9).
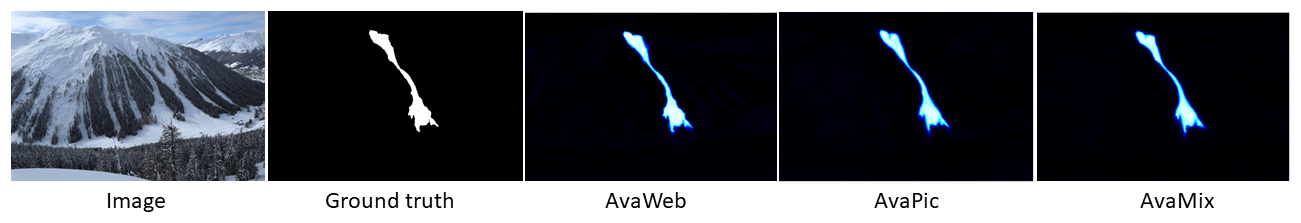
Figure 7Example of an image from the SLF test that all three models solved well. The lighter the hue in the model predictions, the higher the model certainty concerning the existence of an avalanche. In a close-up look, the AvaWeb prediction exhibits more nuanced and detailed avalanche boundaries.
Based on the ground-based GroundPic, the AvaWeb started out being the worst by a margin of about 10 %, but it caught up and surpassed the AvaPic from click 5 onwards, though it never reached the AvaMix. For the large but more coarsely annotated UIBK test, the AvaPic and the AvaMix were consistently superior to the AvaWeb by 10 % to 20 %. The AvaWeb struggled the most with ground-based close-up views of avalanches, often in combination with diffuse-illumination conditions or shade, as well as avalanches captured on coarse images from mobile phones (Fig. 10). For some of those avalanches, the IoU score reached after 20 clicks is well below 50 %. For more than one-quarter of all avalanches, the AvaWeb never reached the NoC20@85, while, for the AvaPic and AvaMix, less than 1 % of all avalanches never reached an IoU of 85 %. The AvaPic and AvaMix struggled mostly with the same images, which depicted close-up views of the release area of avalanches in diffuse-illumination conditions or avalanches which have been snowed on and are hard to spot.
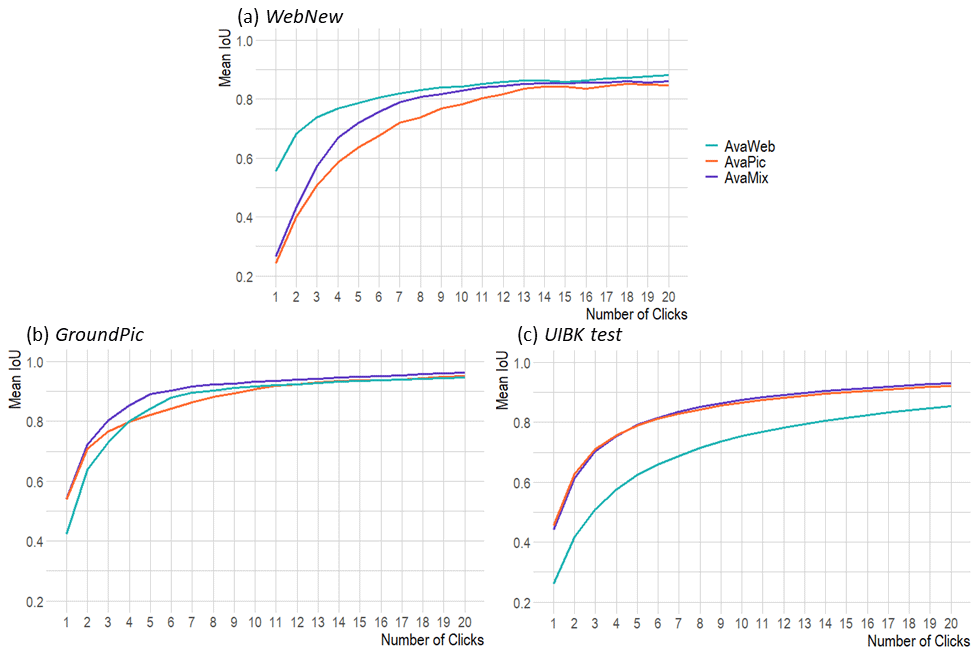
Figure 8Comparing mIoU per click for three datasets with a domain gap in relation to the initial webcam data for our three training configurations: AvaWeb (SLF-train), AvaPic (UIBK-train), and AvaMix (SLF + UIBK-train).
Table 3Results when evaluating the generalizability in relation to data not seen during training, with a domain gap with respect to the training data. The bold values highlight the best metrics.
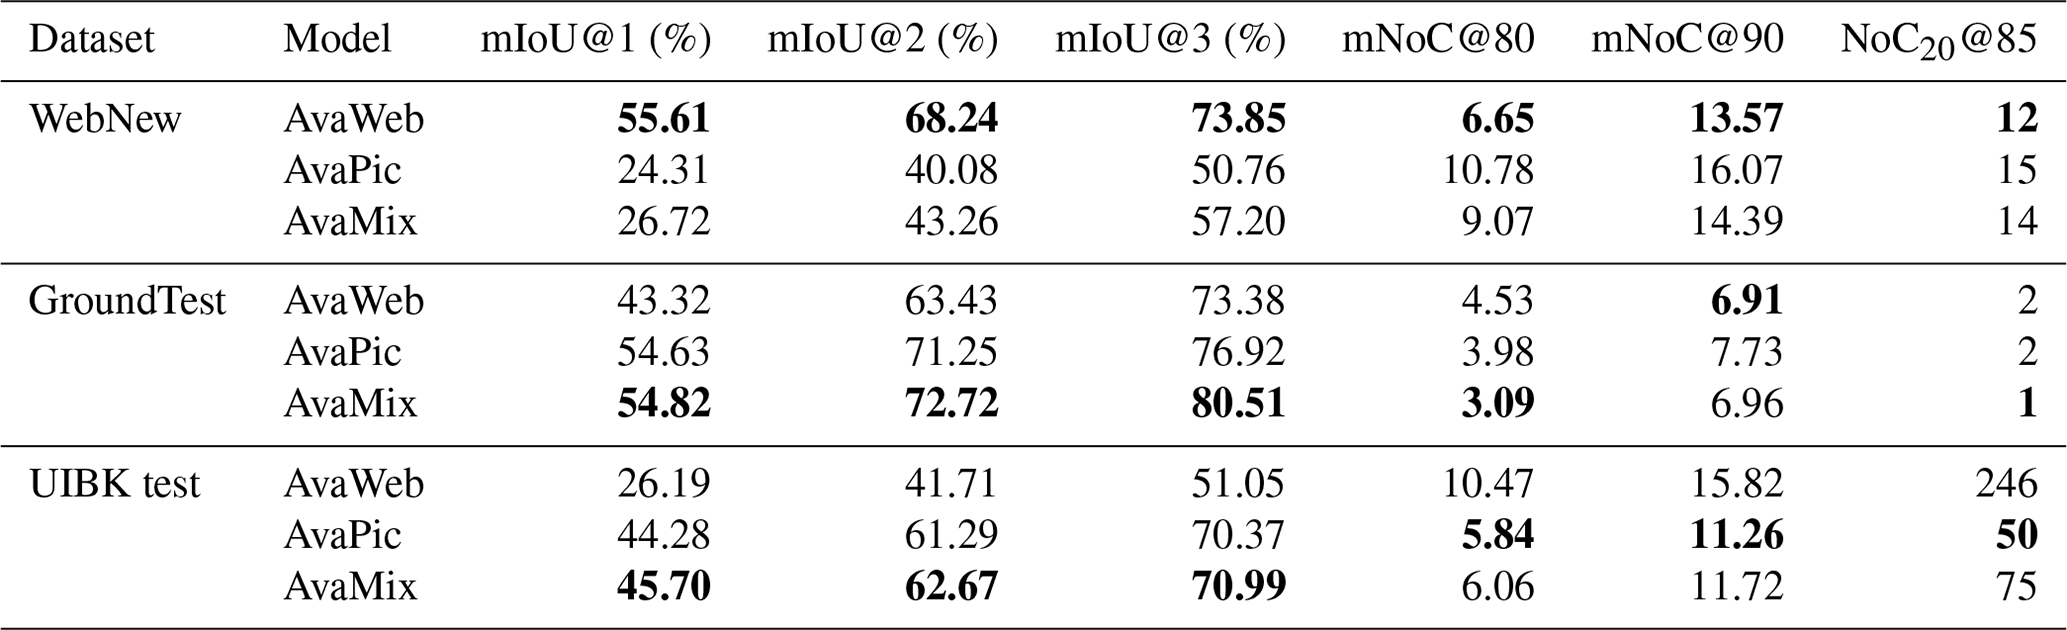
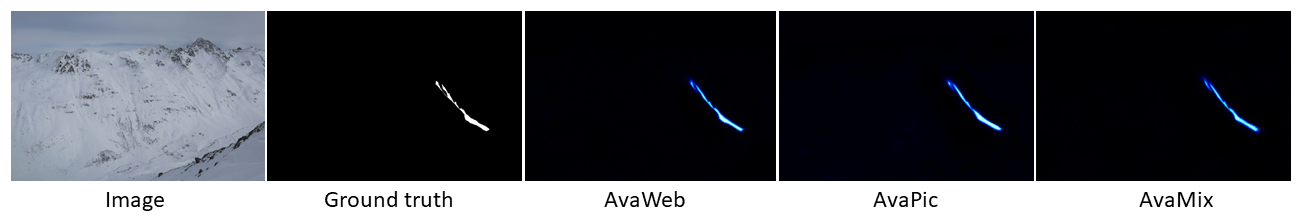
Figure 9Example for an image from the WebNew with diffuse illumination and a long and slim avalanche that all three models struggled with. The lighter the hue in the model predictions, the higher the model certainty concerning the existence of an avalanche.
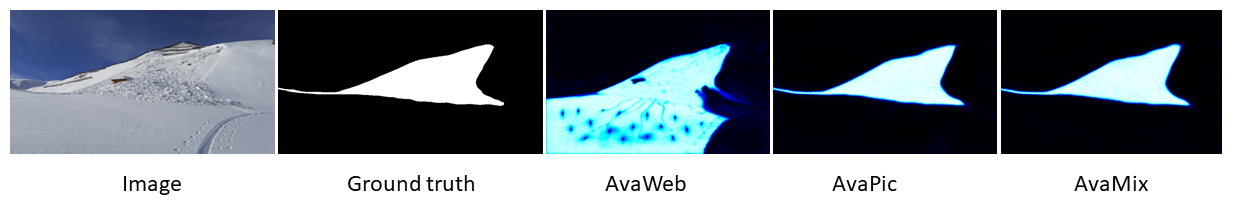
Figure 10Example of a close-up view of an avalanche from the GroundPic, where the AvaWeb struggled with correctly identifying the avalanche area close to the photographer. The lighter the hue in the model predictions, the higher the model certainty concerning the existence of an avalanche.
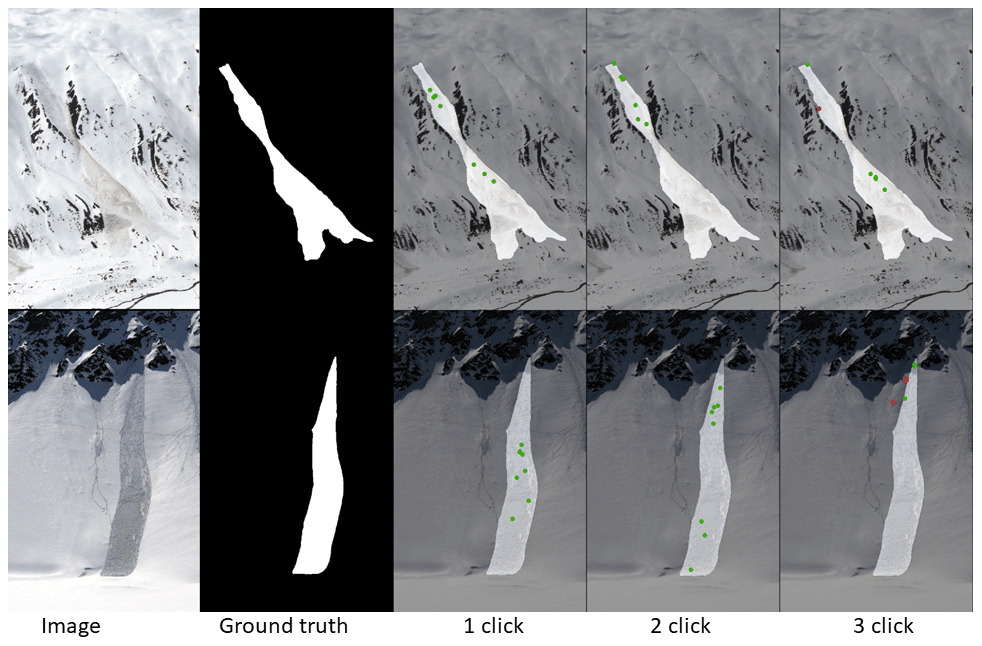
Figure 11Illustration of where the first three clicks in two images from the UserPic dataset were placed. Green dots denote positive clicks, while red dots denote negative clicks.
4.2 Object-wise metrics
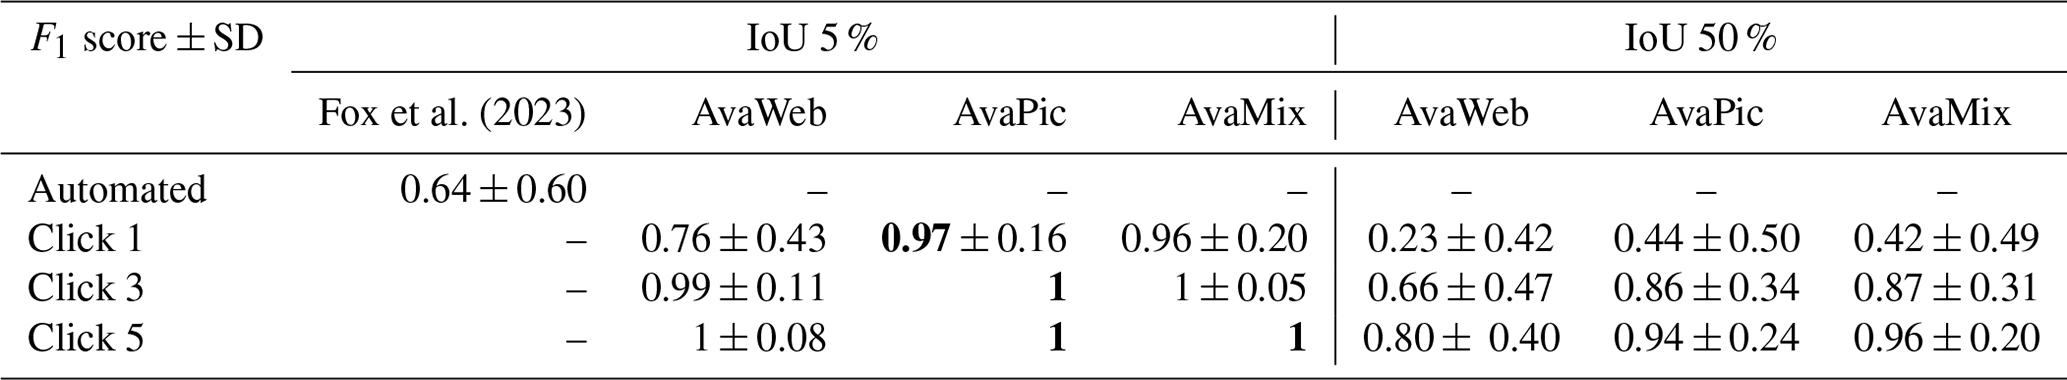
Comparing bounding boxes, the AvaWeb achieved an F1 score 0.12 points higher than that of Fox et al. (2023) from the first click onwards (0.64 vs. 0.76; bounding-box threshold of 0.05; Table 4). For both the AvaPic and the AvaMix, the F1 score was even close to 1, therefore being superior to Fox et al. (2023) by 0.33 to 0.34 and higher than the AvaWeb. With a threshold of 0.5 for the overlap of the bounding boxes, the scores were lower and lay between 0.23 (AvaWeb) and 0.44 (AvaPic) for the first click. Consequently, the AvaPic and the AvaMix were again superior to the AvaWeb (by around 0.2) and also remained on top for click 3 and 5. For click 5, the AvaPic and the AvaMix already achieved an exceptionally good F1 score above or equal to 0.94. No comparison to Fox et al. (2023) was possible for the 0.5 bounding-box threshold.
Fox et al. (2023)Table 4Comparison of F1 scores and standard deviations (SDs) for the two different IoU thresholds (5 % like Fox et al. (2023) and 50 %) for the UIBK test. The bold values highlight the best metrics.
4.3 User study and time saved
For our user study, we loaded the model trained on AvaWeb for making predictions upon user input. On average, the participants employed 4.9 clicks for the UserPic, with variations from 1.25 to 9.63 clicks for the 20 different images. The employed clicks were on avalanches in 79 % of all cases, while the rest were on the background. The avalanches that needed fewer clicks to reach a certain IoU threshold tended to be the smaller ones. Even though not everyone always clicked until an IoU of 85 % was reached, on average, only one image remained below that value. This image depicted an avalanche that was located in a partly shaded and partly illuminated area, where, especially in the shade, features are hard to identify. On average, participants needed 6.5 s to reach an IoU of 80 % and 9.1 s to reach an IoU of 90 %. In opposition, on average, 2 min and 36 s were required for mapping one avalanche with the traditional method, with the time needed ranging from 1 to 8 min. This is more than 2 min extra than when relying on IAS and translates to a saving in time of more than 90 % compared to a manual mapping.
In our user study, we observed large variations between the different participants in terms of the average number of clicks (2.90 to 8.10), the mNoC@80 (1.80 to 2.80), and the mNoC@90 (2.00 to 3.12). Additionally, for avalanches such as that in Fig. 11 (top), there was no clear “middle” on which to place the first click, which resulted in very diverse click strategies for the participants. In contrast, for the avalanche in Fig. 11 (bottom), clicks were placed more homogeneously: first in the middle and then at the top and bottom, thereby correcting details. For clicks 1 to 5, where we had enough samples from all participants, we checked if the differences between the highest and the lowest mIoU values were statistically significant. The differences were not significant for IoU@1 and IoU@2 (t test; p value: >0.05) but they were statistically significant for IoU@3 (p value = 0.045), IoU@4 (p value = 0.034), and IoU@5 (p value = 0.035). This was caused by very consistent results with low standard deviations for the participants with the highest mIoU@k scores. However, when taking the mask from the last click as a final result, the differences between participants were quite small: the mean pairwise IoU was 93.53 %, the maximum was 95.44 %, and the minimum was 90.59 %. Consequently, all pairs had an IoU within 5 % of each other as their segmented final avalanche masks were very similar (Fig. 13).
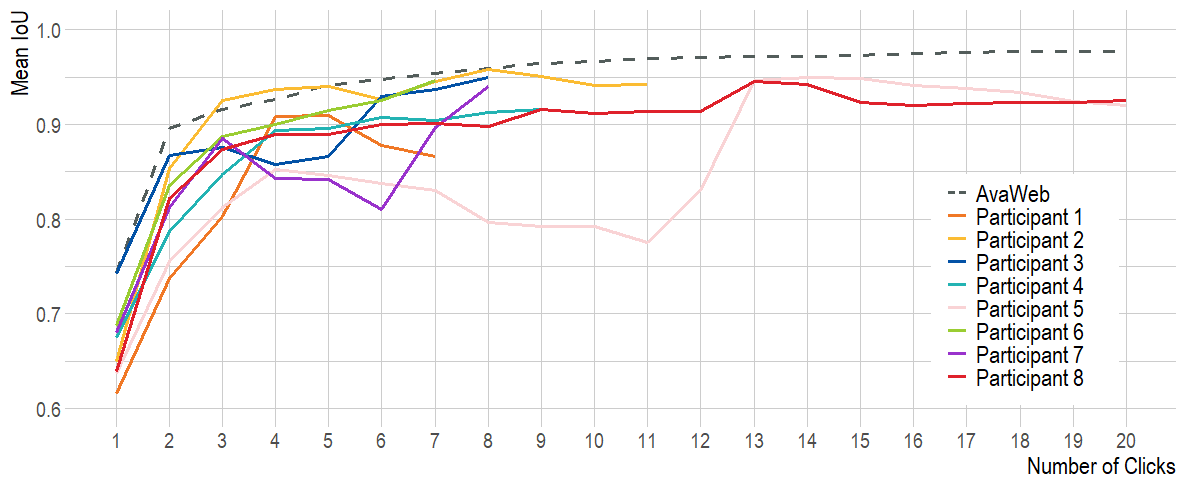
Figure 12Comparison of the mIoU for all participants of the user study to the mIoU of the AvaWeb evaluated based on the UserPic dataset. Note that only two participants used the maximum possible number of 20 clicks.
When evaluating the model trained on AvaWeb based on the UserPic with simulated clicks and comparing to the user study results (see Table 5), the AvaWeb results were superior for all investigated metrics, except for the mNoC@80. The participants with the highest mIoU@k held up in comparison to the numbers from the model (Fig. 13).
Table 5Comparison of the results from the user study with the model results when evaluating based on the same imagery (UserPic; N=20).
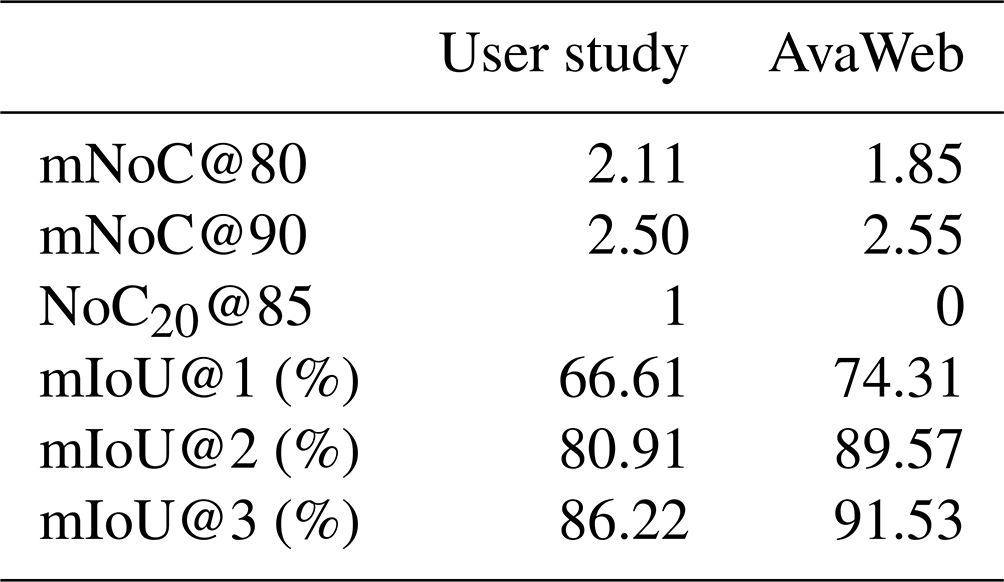
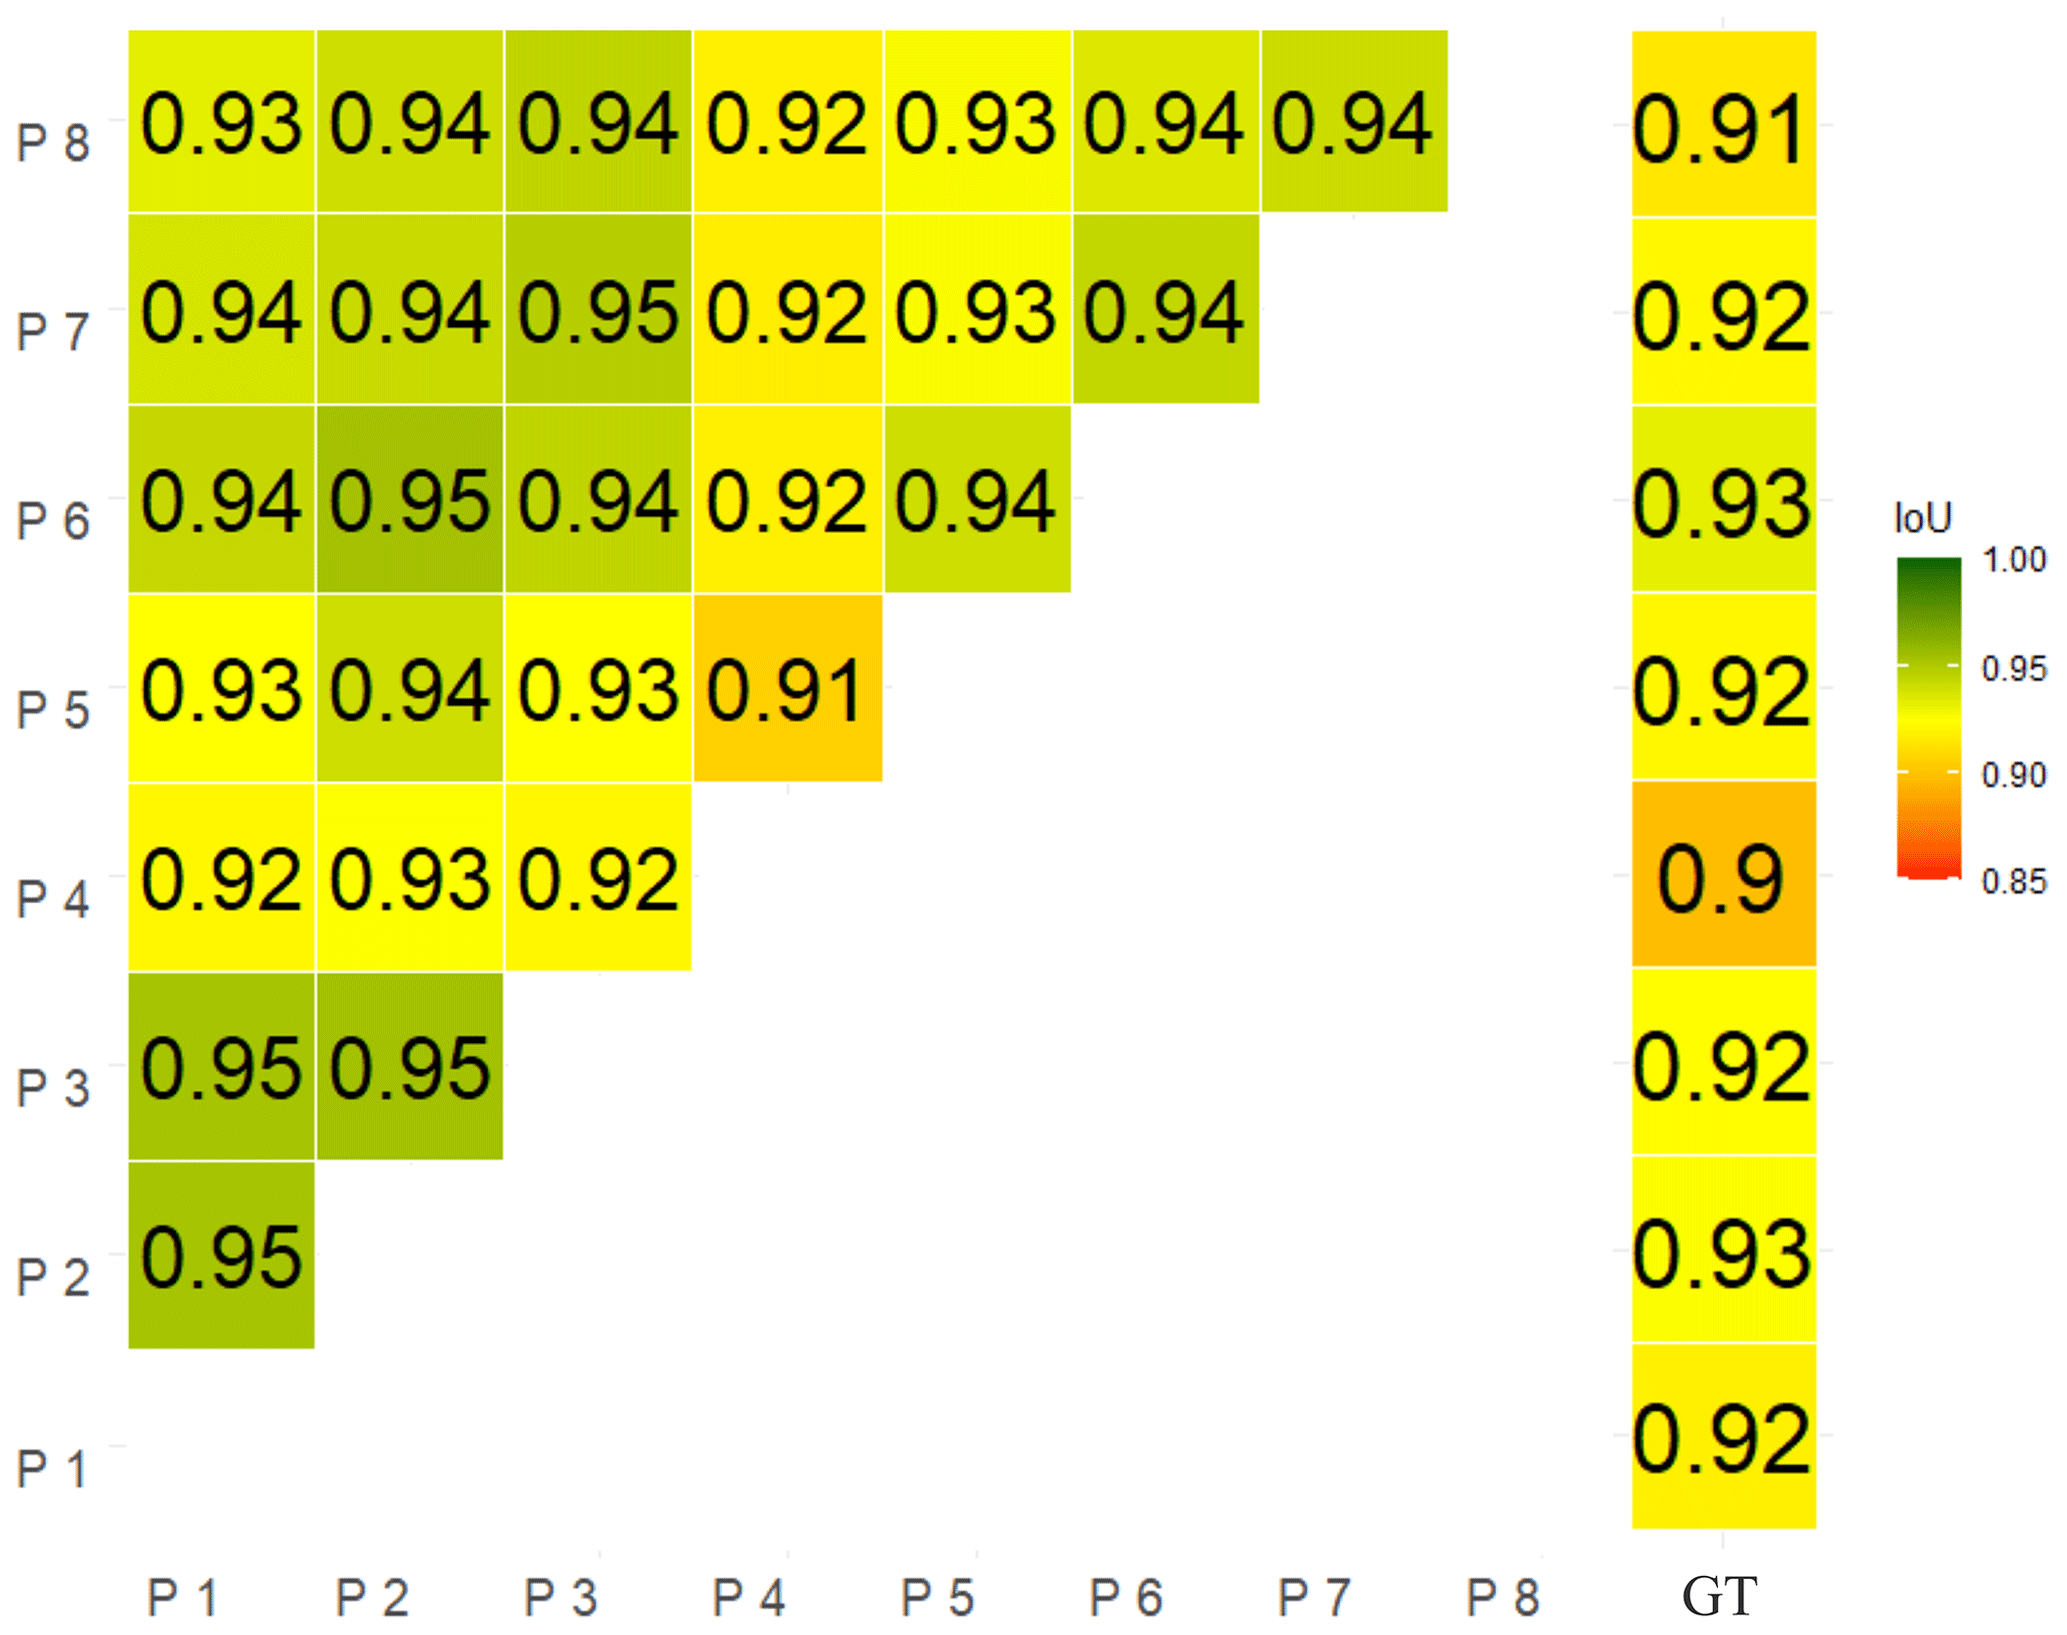
Figure 13IoU for all participant pairs (participants are denoted as P, and the ground truth is denoted as GT) for the final masks from our user study on the UserPic.
Our results show that IAS enables the segmentation of avalanches from webcam imagery within seconds. We compared the performance of the model trained with different datasets: as expected, the model trained with any avalanche dataset outperformed the baseline (COCO+LVIS). The model trained on AvaWeb performed best for the two test datasets containing webcam imagery (SLF test and WebNew) and performed on par with the dataset with a perspective unlike those of the webcams (GroundPic) but failed to generalize well to the large but coarsely annotated UIBK test, with a large variety of perspectives and resolutions. In contrast, the model trained on larger and more diverse datasets (AvaPic and AvaMix) exhibited lower mIoU scores and a higher number of clicks to reach a certain IoU for all test sets containing webcam imagery (SLF test and WebNew), but it performed better with imagery not from webcams (GroundPic and UIBK test). The model trained on AvaMix seems to have learned more details since the mIoU scores were higher than for the AvaPic for three out of four datasets from approximately click 3 to 10. During those clicks, after the initial coarse segmentation, details of the avalanche are segmented. We suspect that the detailed annotations, following the visible texture from the SLF dataset, helped the AvaMix to outperform the AvaPic.
Overall, the model struggled with images of avalanches recorded under unfavorable illumination conditions. This is in line with previous studies that found the agreement between different experts for manual mapping to be lower in shaded areas (Hafner et al., 2022, 2023b). Furthermore, in particular, the AvaWeb struggled with close-up views of avalanches; often, these images are photographed from below the avalanche, resulting in a very specific perspective that the model has never seen during training. But overall, the AvaWeb, with less than 10 % of the training data of the other two datasets, achieved the best performance for two out of three test sets with detailed avalanche annotations (SLF test, WebNew, GroundPic). Even though the UIBK test contained perspectives unknown to the AvaWeb, we believe the low performance (approximately 20 % lower IoU) compared to AvaPic and AvaMix is mostly caused by the coarseness of the annotations in combination with low-resolution imagery, which the model struggles to reproduce. However, results also showed that any model trained on avalanches is better than the baseline, which has never before seen an avalanche. We believe the coarseness of the annotations in the AvaPic prevents the model from learning all it could from such a large and diverse dataset. Investigating this in more detail is beyond the scope of this paper, but future work should consider experimenting with a larger dataset of finely annotated avalanches covering various perspectives, avalanche types, avalanche sizes, and snow and illumination conditions.
For their fully automated method, Fox et al. (2023) only evaluated bounding-box overlap, which is less challenging than the pixel overlap we focused on. When comparing our IAS best-model bounding boxes on the first click to the result of Fox et al. (2023), we outperformed their F1 score by a large margin (0.64 vs. 0.97). Consequently, we captured the area that the avalanche covers better from the first prediction onwards.
In our user study, the participants with the best performance were as good as the simulation, but the mean IoU scores of all participants did not exceed the model (Table 5). We attribute this to the lack of serious training (visible in the variations in the number of clicks and time used) and knowing that estimations of avalanche area exhibit large variabilities (Hafner et al., 2023b) as there is no clear, unambiguous definition of an avalanche boundary. Since the differences between the model and the participants were rather small, we consider the way user clicks are simulated during training to be representative of employed real-life click strategies.
Previous work (Hafner et al., 2023b) found variations of up to 43 % between experts when mapping avalanches from oblique photographs or from remote sensed imagery. In opposition to Hafner et al. (2023b), our mean pairwise IoU scores for the avalanche area mapped (pixels, in our case) were all within 5 % of each other and all have an IoU above 0.9 with respect to the ground truth mask (Fig. 13). We believe having humans collaborate with the same underlying model homogenizes the avalanche area identified as it guides the participants and constrains the results. Consequently, IAS not only improves efficiency but enhances the reliability, defined as the consistency of repeated measurements or judgments of the same event relying on the same process (Cronbach, 1947). Even though we had no overlapping avalanches in our UserPic, we still believe our findings also apply in this more challenging scenario.
As opposed to fully automatic avalanche segmentation, IAS requires a human annotator. We do not see this as a disadvantage but rather as complementary since humans are present and will remain present in the future in many settings where avalanches are recorded, either in connection to work or as part of winter leisure activities in the mountains. Compared to the traditional way of mapping avalanches, IAS shows time savings of 90 %. We believe that the time saved may be even greater since the avalanches with a time recording were rather small (mean size of 1.75; European avalanche size definition (EAWS, 2024)) compared to the ones in the user study, and all were located in an area well known to the person mapping. In practice, when using the tool to segment new avalanches, the user needs to decide when the predicted and corrected masks are detailed enough. Consequently, the final masks are the most important.
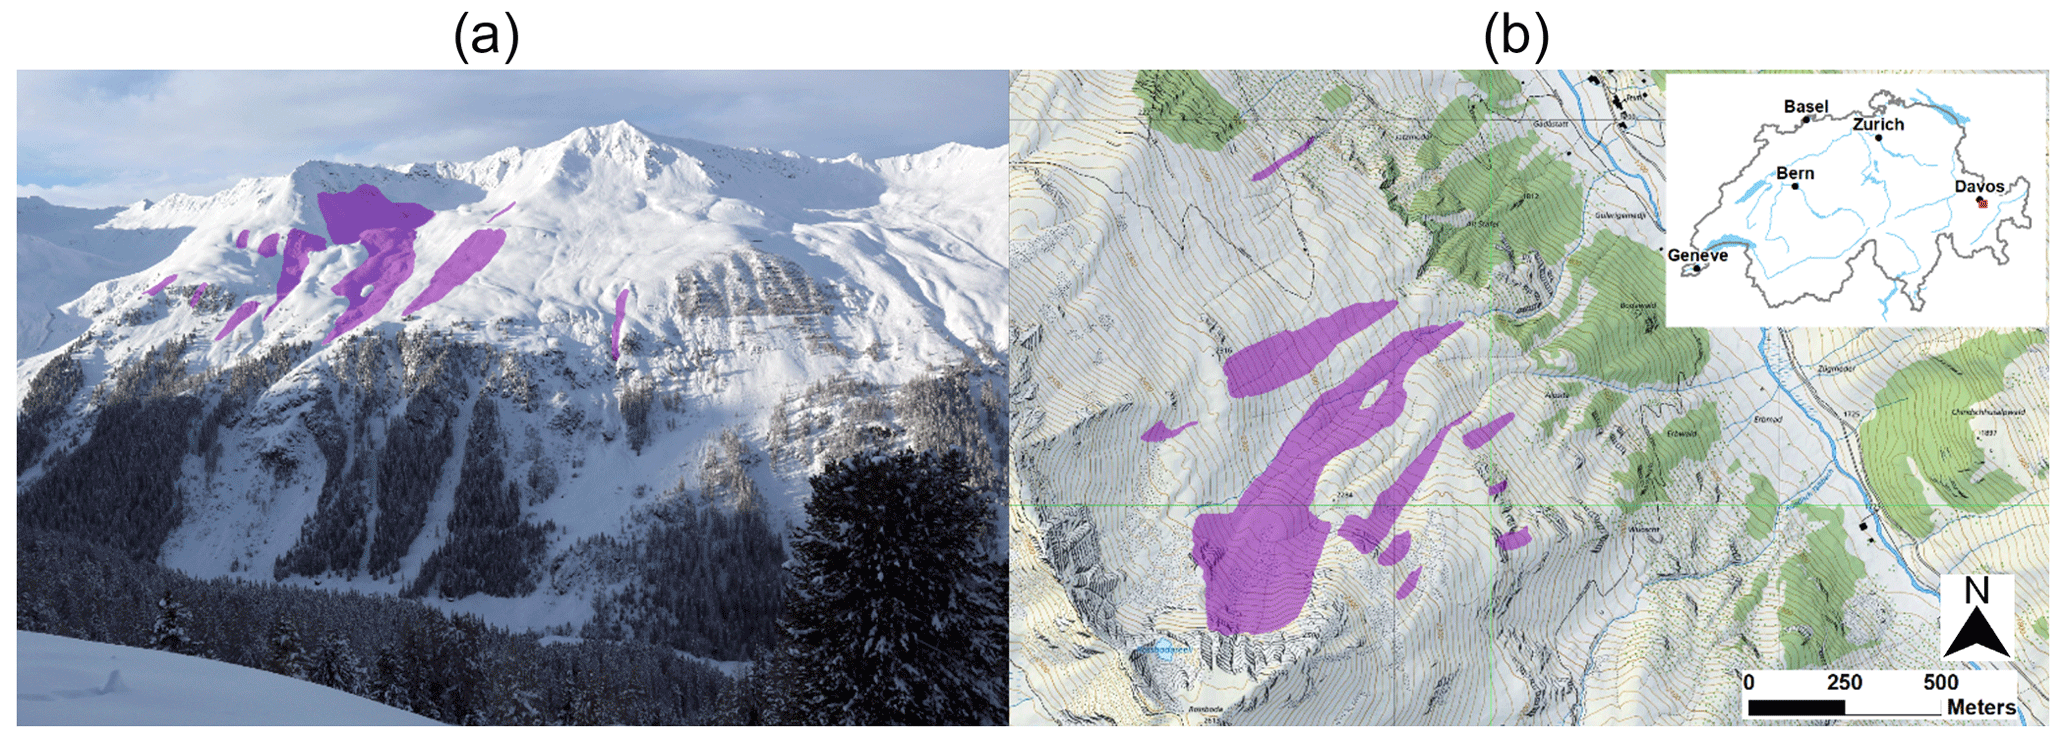
Figure 14Example of avalanches segmented from an image with AvaWeb (a) and the corresponding avalanches displayed on a map after they have been georeferenced with the mono-plotting tool (b, Bozzini et al., 2012; map source: Federal Office of Topography).
Webcams have limited coverage and cannot record avalanches in a spatially continuous manner like satellite imagery can (Bühler et al., 2019; Eckerstorfer et al., 2019; Hafner et al., 2022), but their temporal resolution is superior and allows for a better monitoring of the avalanche activity over the course of the winter, leading to more complete datasets and allowing for more detailed analyses of, e.g., predisposition factors. However, their inclusion in existing databases requires the georeferencing of the avalanches, achievable with, e.g., mono-photogrammetry tools like those of Bozzini et al. (2012, 2013), Produit et al. (2016), or Golparvar and Wang (2021). The georeferencing allows for avalanches segmented in an image to be displayed on a map (as is exemplarily shown in Fig. 14). Without that, the application is limited to providing an overview of the current activity to an avalanche warning service, while all other downstream applications cannot profit from the data.
We introduce a novel approach to map avalanches from webcam imagery employing interactive object segmentation. During training, the user's clicks that guide and correct the segmentation were simulated, optimizing the model to quickly identify the features of an avalanche. With IAS, a human user may, in seconds instead of minutes, segment the desired avalanche in collaboration with the model. Compared to satellite imagery, webcam imagery covers only limited areas. However, the abundance of webcams and the possibility of acquiring images as frequently as needed without additional cost increase the likelihood of capturing avalanches, even under adverse visibility conditions, offering a very valuable complementary data source for existing avalanche databases. This allows for the documentation of avalanche activity for a whole season compared to for just one extreme event, like in Bühler et al. (2019). Additionally, the release time may be determined with less uncertainty, helping avalanche warning services and research endeavors to better connect the snow and weather conditions to avalanche releases.
In combination, IAS and georeferencing have great potential to improve avalanche mapping: existing mono-photogrammetry tools may be used to import avalanches detected with IAS from webcams. Assuming the camera position and area captured are stable, the georeferencing can be reused for all subsequent images. In the past, this has been done for webcam-based snow cover monitoring (Portenier et al., 2020). In the future, existing approaches could be enhanced and expanded to a pipeline hosting the entire process from IAS to georeferencing and for purposes of importing the detected avalanches into existing databases. Furthermore, we see potential to automatically georeference images from mobile devices with the available information on the location and orientation in combination with the visible skyline and a digital elevation model (DEM). This would allow avalanche observers and the interested backcountry skiers to photograph an observed avalanche; quickly segment it with IAS; and automatically send the georeferenced outlines to existing databases, making them available to, e.g., the avalanche warning service. This would make the outlines and geolocations of avalanches mapped in the field more reliable compared to the traditional mapping approach described in Hafner et al. (2023b). The possibility of recording observed avalanches in an easy way could also help to motivate more people in reporting observed avalanches and therefore enlarge current databases with valuable detailed records.
Compared to the currently widely used mapping method (study 2; Hafner et al., 2023b), segmenting an avalanche with IAS shows time savings of over 90 %, and the results are more reliable in terms of consistency between mappings from different individuals. For the future, we recommend training with a larger dataset with fine annotations and various perspectives, avalanche types, avalanche sizes, and snow and illumination conditions. Our results indicate that this would help the model significantly in making fast and detailed segmentations, as well as in generalizing well to all sorts of unseen perspectives. For fast image annotation or the correction of existing annotations with minimum user input, our current model may be used. Annotations generated with IAS may, in addition, be used to develop and enhance models for automatic avalanche segmentation, saving time while generating outlines that follow the visible avalanche textures, thereby easing the learning and obtaining more accurate and reliable avalanche annotations in the future. Overall, this is a promising approach for continuous and precise avalanche documentation, complementing existing databases and thereby providing a better base for safety-critical decisions and planning in avalanche-prone mountain regions.
The images and corresponding annotations used for training, testing, and validation are available on EnviDat (https://doi.org/10.16904/ENVIDAT.526, Hafner, 2024). The code is available on Zenodo (https://doi.org/10.5281/zenodo.12698270, Hafner and Oberson, 2024).
EDH and TK came up with the initial idea. EDH coordinated the study, collected the images, and annotated the avalanches used for training. EDH and LO adapted the model for avalanches, and EDH did the analyses and organized the user study. TK, RCD, JDW, and KS advised on the machine learning aspects of the project and critically reviewed the associated results. EDH wrote the initial paper, and all the co-authors critically reviewed and complemented it.
The contact author has declared that none of the authors has any competing interests.
Publisher’s note: Copernicus Publications remains neutral with regard to jurisdictional claims made in the text, published maps, institutional affiliations, or any other geographical representation in this paper. While Copernicus Publications makes every effort to include appropriate place names, the final responsibility lies with the authors.
We thank the SLF Workshop and Electronics for developing, building, and setting up our camera system in the Dischma Valley. We are grateful to Simon Aeschbacher, Jor Fergus Dal, Amelie Fees, Julia Glaus, Matthias Lichtenegger, Isabelle Rittmeyer, Pia Ruttner-Jansen, and Linda Zaugg-Ettlin for participating in our user study. We thank Luis Scherer for recording the time spent on mapping avalanches in the traditional way. We are grateful to the two anonymous reviewers and Ron Simenhois (community comment) for asking critical questions, giving suggestions, and making comments that helped to improve this work.
The initial development and mounting of the majority of the webcams were part of the DeFROST project financed by the European Space Agency (ESA; grant no. 4000127451/19/NL/CLP).
This paper was edited by Alexandre Langlois and reviewed by two anonymous referees.
Baumer, J., Metzger, N., Hafner, E. D., Daudt, R. C., Wegner, J. D., and Schindler, K.: Automatic Image Compositing and Snow Segmentation for Alpine Snow Cover Monitoring, in: 2023 10th IEEE Swiss Conference on Data Science (SDS), Zurich, Switzerland, 22–23 June 2023, 77–84, https://doi.org/10.1109/SDS57534.2023.00018, 2023. a
Benenson, R., Popov, S., and Ferrari, V.: Large-Scale Interactive Object Segmentation With Human Annotators, in: 2019 IEEE/CVF Conference on Computer Vision and Pattern Recognition (CVPR), Long Beach, California, USA, 15–20 June 2019, 11692–11701, https://doi.org/10.1109/CVPR.2019.01197, 2019. a, b
Bianchi, F. M., Grahn, J., Eckerstorfer, M., Malnes, E., and Vickers, H.: Snow Avalanche Segmentation in SAR Images With Fully Convolutional Neural Networks, IEEE J. Sel. Top. Appl., 14, 75–82, https://doi.org/10.1109/JSTARS.2020.3036914, 2021. a, b
Boykov, Y. and Jolly, M.-P.: Interactive graph cuts for optimal boundary & region segmentation of objects in N-D images, in: Proceedings Eighth IEEE International Conference on Computer Vision, ICCV 2001, vol. 1, Vancouver, B.C., Canada, 7–14 July 2001, 105–112 https://doi.org/10.1109/ICCV.2001.937505, 2001. a, b
Bozzini, C., Conedera, M., and Krebs, P.: A New Monoplotting Tool to Extract Georeferenced Vector Data and Orthorectified Raster Data from Oblique Non-Metric Photographs, International Journal of Heritage in the Digital Era, 1, 499–518, https://doi.org/10.1260/2047-4970.1.3.499, 2012. a, b, c, d
Bozzini, C., Conedera, M., and Krebs, P.: A new tool for facilitating the retrieval and recording of the place name cultural heritage, Int. Arch. Photogramm. Remote Sens. Spatial Inf. Sci., XL-5/W2, 115–118, https://doi.org/10.5194/isprsarchives-XL-5-W2-115-2013, 2013. a, b, c
Bründl, M. and Margreth, S.: Integrative Risk Management, in: W. Haeberli & C. Whiteman (Eds.), Snow and Ice-Related Hazards, Risks and Disasters, 2015, 263–301, https://doi.org/10.1016/B978-0-12-394849-6.00009-3, 2015. a
Bühler, Y., Hafner, E. D., Zweifel, B., Zesiger, M., and Heisig, H.: Where are the avalanches? Rapid SPOT6 satellite data acquisition to map an extreme avalanche period over the Swiss Alps, The Cryosphere, 13, 3225–3238, https://doi.org/10.5194/tc-13-3225-2019, 2019. a, b, c
Bühler, Y., Bebi, P., Christen, M., Margreth, S., Stoffel, L., Stoffel, A., Marty, C., Schmucki, G., Caviezel, A., Kühne, R., Wohlwend, S., and Bartelt, P.: Automated avalanche hazard indication mapping on a statewide scale, Nat. Hazards Earth Syst. Sci., 22, 1825–1843, https://doi.org/10.5194/nhess-22-1825-2022, 2022. a
Chen, L., Strauch, M., and Merhof, D.: Instance Segmentation of Biomedical Images with an Object-aware Embedding Learned with Local Constraints, arXiv [preprint], https://doi.org/10.48550/arXiv.2004.09821, 2020. a
Christen, M., Kowalski, J., and Bartelt, P.: RAMMS: Numerical simulation of dense snow avalanches in three-dimensional terrain, Cold Reg. Sci. Technol., 63, 1–14, https://doi.org/10.1016/j.coldregions.2010.04.005, 2010. a
Cronbach, L. J.: Test “reliability”: Its meaning and determination, Psychometrika, 12, 1–16, https://doi.org/10.1007/bf02289289, 1947. a
De Brabandere, B., Neven, D., and Van Gool, L.: Semantic Instance Segmentation for Autonomous Driving, in: 2017 IEEE Conference on Computer Vision and Pattern Recognition Workshops (CVPR), Honolulu, Hawaii, USA,, 21–26 July 2017, 478–480, https://doi.org/10.1109/CVPRW.2017.66, 2017. a
EAWS: Standards: Avalanche Size, https://www.avalanches.org/standards/avalanche-size/, last access: 15 August 2024. a, b
Eckerstorfer, M., Bühler, Y., Frauenfelder, R., and Malnes, E.: Remote sensing of snow avalanches: Recent advances, potential, and limitations, Cold Reg. Sci. Technol., 121, 126–140, https://doi.org/10.1016/j.coldregions.2015.11.001, 2016. a
Eckerstorfer, M., Vickers, H., Malnes, E., and Grahn, J.: Near-Real Time Automatic Snow Avalanche Activity Monitoring System Using Sentinel-1 SAR Data in Norway, Remote Sensing, 11, 2863, https://doi.org/10.3390/rs11232863, 2019. a, b
ESA: DEFROST, https://business.esa.int/projects/defrost (last access 8 February 2024), 2020. a
Fox, J., Siebenbrunner, A., Reitinger, S., Peer, D., and Rodríguez-Sánchez, A.: Deep Learning for Real-Time Avalanche Detection in Webcam Images, International Snow Science Workshop ISSW, Bend, 8–13 October 2023, https://arc.lib.montana.edu/snow-science/objects/ISSW2023_P3.47.pdf (last access: 15 August 2024), 2023. a, b, c, d, e, f, g, h, i, j, k, l, m, n, o, p
Golparvar, B. and Wang, R.-Q.: AI-supported Framework of Semi-Automatic Monoplotting for Monocular Oblique Visual Data Analysis, arXiv [preprint], https://doi.org/10.48550/arXiv.2111.14021, 2021. a, b
Gulshan, V., Rother, C., Criminisi, A., Blake, A., and Zisserman, A.: Geodesic star convexity for interactive image segmentation, in: 2010 IEEE Computer Society Conference on Computer Vision and Pattern Recognition, San Francisco, CA, USA, 13–18 June 2010. 3129–3136, https://doi.org/10.1109/CVPR.2010.5540073, 2010. a
Gupta, A., Dollar, P., and Girshick, R.: LVIS: A Dataset for Large Vocabulary Instance Segmentation, in: Proceedings of the IEEE/CVF Conference on Computer Vision and Pattern Recognition (CVPR), arXiv [preprint], https://doi.org/10.48550/arXiv.1908.03195, 2019. a
Hafner, E. D.: Data interactive avalanche segmentation, EnviDat [data set], https://doi.org/10.16904/ENVIDAT.526, 2024. a
Hafner, E. D. and Oberson, L.: aval-e/InteractiveAvalancheSegmentation: Code to ineractivly segment avalanches from oblique photographs, Zenodo [code], https://doi.org/10.5281/zenodo.12698270, 2024. a
Hafner, E. D., Techel, F., Leinss, S., and Bühler, Y.: Mapping avalanches with satellites – evaluation of performance and completeness, The Cryosphere, 15, 983–1004, https://doi.org/10.5194/tc-15-983-2021, 2021. a, b, c, d
Hafner, E. D., Barton, P., Daudt, R. C., Wegner, J. D., Schindler, K., and Bühler, Y.: Automated avalanche mapping from SPOT 6/7 satellite imagery with deep learning: results, evaluation, potential and limitations, The Cryosphere, 16, 3517–3530, https://doi.org/10.5194/tc-16-3517-2022, 2022. a, b, c, d
Hafner, E., Oberson, L., Kontogianni, T., Daudt, R. C., Wegner, J. D., Schindler, K., and Bühler, Y.: Using interactive object segmentation to derive avalanche outlines from webcam imagery, EGU General Assembly 2023, Vienna, Austria, 24–28 Apr 2023, EGU23-10867, https://doi.org/10.5194/egusphere-egu23-10867, 2023a. a
Hafner, E. D., Techel, F., Daudt, R. C., Wegner, J. D., Schindler, K., and Bühler, Y.: Avalanche size estimation and avalanche outline determination by experts: reliability and implications for practice, Nat. Hazards Earth Syst. Sci., 23, 2895–2914, https://doi.org/10.5194/nhess-23-2895-2023, 2023b. a, b, c, d, e, f, g, h, i
He, K., Gkioxari, G., Dollár, P., and Girshick, R.: Mask R-CNN, arXiv [preprint], https://doi.org/10.48550/arXiv.1703.06870, 2018. a
Kapper, K. L., Goelles, T., Muckenhuber, S., Trügler, A., Abermann, J., Schlager, B., Gaisberger, C., Eckerstorfer, M., Grahn, J., Malnes, E., Prokop, A., and Schöner, W.: Automated snow avalanche monitoring for Austria: State of the art and roadmap for future work, Frontiers in Remote Sensing, 4, https://doi.org/10.3389/frsen.2023.1156519, 2023. a
Karas, A., Karbou, F., Giffard-Roisin, S., Durand, P., and Eckert, N.: Automatic Color Detection-Based Method Applied to Sentinel-1 SAR Images for Snow Avalanche Debris Monitoring, IEEE T. Geosci. Remote, 60, 1–17, https://doi.org/10.1109/TGRS.2021.3131853, 2022. a
Keskinen, Z., Hendrikx, J., Eckerstorfer, M., and Birkeland, K.: Satellite detection of snow avalanches using Sentinel-1 in a transitional snow climate, Cold Reg. Sci. Technol., 199, 103558, https://doi.org/10.1016/j.coldregions.2022.103558, 2022. a
Kirillov, A., Mintun, E., Ravi, N., Mao, H., Rolland, C., Gustafson, L., Xiao, T., Whitehead, S., Berg, A. C., Lo, W.-Y., Dollár, P., and Girshick, R.: Segment Anything, arXiv [preprint], https://doi.org/10.48550/arXiv.2304.02643, 2023. a
Kontogianni, T., Gygli, M., Uijlings, J., and Ferrari, V.: Continuous Adaptation for Interactive Object Segmentation by Learning from Corrections, ECCV 2020, online, 23–28 August 2020, https://doi.org/10.48550/arXiv.1911.12709, 2020. a, b
Levandowsky, M. and Winter, D.: Distance between sets, Nature, 234, 34–35, 1971. a
Li, Z., Chen, Q., and Koltun, V.: Interactive Image Segmentation with Latent Diversity, in: 2018 IEEE/CVF Conference on Computer Vision and Pattern Recognition, Salt Lake City, Utah, USA, 18–23 June 2018, 577–585, https://doi.org/10.1109/CVPR.2018.00067, 2018. a
Lin, T.-Y., Maire, M., Belongie, S., Bourdev, L., Girshick, R., Hays, J., Perona, P., Ramanan, D., Zitnick, C. L., and Dollár, P.: Microsoft COCO: Common Objects in Context, arXiv [preprint], https://doi.org/10.48550/arXiv.1405.0312, 2015. a
Lin, Z., Duan, Z.-P., Zhang, Z., Guo, C.-L., and Cheng, M.-M.: FocusCut: Diving into a Focus View in Interactive Segmentation, in: 2022 IEEE/CVF Conference on Computer Vision and Pattern Recognition (CVPR), New Orleans, Louisiana, USA, 19–24 June 2022, 2627–2636, https://doi.org/10.1109/CVPR52688.2022.00266, 2022. a
Liu, Y., Li, H., Hu, C., Luo, S., Luo, Y., and Chen, C. W.: Learning to Aggregate Multi-Scale Context for Instance Segmentation in Remote Sensing Images, IEEE T. Neur. Net. Lear., https://doi.org/10.1109/TNNLS.2023.3336563, 2022. a
Mahadevan, S., Voigtlaender, P., and Leibe, B.: Iteratively Trained Interactive Segmentation, in: 2018 Conference on Computer Vision and Pattern Recognition (CVPR), arXiv [preprint], https://doi.org/10.48550/arXiv.1805.04398, 2018. a
Padilla, R., Netto, S. L., and da Silva, E. A. B.: A Survey on Performance Metrics for Object-Detection Algorithms, 2020 International Conference on Systems, Signals and Image Processing (IWSSIP), Niteroi, Brazil, 1–3 July 2020, 237–242, https://doi.org/10.1109/IWSSIP48289.2020.9145130, 2020. a
Portenier, C., Hüsler, F., Härer, S., and Wunderle, S.: Towards a webcam-based snow cover monitoring network: methodology and evaluation, The Cryosphere, 14, 1409–1423, https://doi.org/10.5194/tc-14-1409-2020, 2020. a
Produit, T., Ingensand, J., and Milani, G.: QGIS plugin or web app? Lessons learned in the development of a 3D georeferencer, PeerJ Prepr., 4, e2243, https://api.semanticscholar.org/CorpusID:21774865 (last access: 15 August 2024), 2016. a, b
R Core Team: R: A Language and Environment for Statistical Computing, R Foundation for Statistical Computing, Vienna, Austria, https://www.R-project.org/ (last access: 15 August 2024), 2021. a
Redmon, J., Divvala, S., Girshick, R., and Farhadi, A.: You Only Look Once: Unified, Real-Time Object Detection, arXiv [preprint], https://doi.org/10.48550/arXiv.1506.02640, 2016. a
Rother, C., Kolmogorov, V., and Blake, A.: “GrabCut”: Interactive Foreground Extraction Using Iterated Graph Cuts, ACM Transaction on Graphics (TOM), 23, 309–314, https://doi.org/10.1145/1015706.1015720, 2004. a
Rudolf-Miklau, F., Sauermoser, S., and Mears, A. (Eds.): The technical avalanche protection handbook, Ernst & Sohn, Berlin, ISBN 978-3-433-03034-9, 2015. a
Sampl, P. and Zwinger, T.: Avalanche simulation with SAMOS, Ann. Glaciol., 38, 393–398, https://doi.org/10.3189/172756404781814780, 2004. a
Sofiiuk, K., Petrov, I., Barinova, O., and Konushin, A.: f-BRS: Rethinking Backpropagating Refinement for Interactive Segmentation, arXiv [preprint], https://doi.org/10.48550/arXiv.2001.10331, 2020. a
Sofiiuk, K., Petrov, I. A., and Konushin, A.: Reviving Iterative Training with Mask Guidance for Interactive Segmentation, arXiv [preprint], https://doi.org/10.48550/arXiv.2102.06583, 2021. a, b, c, d, e, f, g
Supervisely: Supervisely Computer Vision platform, https://supervisely.com, last access 20 July 2023. a
University of Innsbruck, Lo.La Peak Solutions GmbH, Avalanche Warning Service Tyrol, and Avalanche Warning Service Bavaria: UIBK Avalanche Dataset, University of Innsbruck [data set], https://doi.org/10.48323/H07F4-QZD17, 2023. a, b
Wang, J., Sun, K., Cheng, T., Jiang, B., Deng, C., Zhao, Y., Liu, D., Mu, Y., Tan, M., Wang, X., Liu, W., and Xiao, B.: Deep High-Resolution Representation Learning for Visual Recognition, arXiv [preprint], https://doi.org/10.48550/arXiv.1908.07919, 2020. a, b
Wesselink, D. S., Malnes, E., Eckerstorfer, M., and Lindenbergh, R. C.: Automatic detection of snow avalanche debris in central Svalbard using C-band SAR data, Polar Res., 36, 1333236, https://doi.org/10.1080/17518369.2017.1333236, 2017. a
Xu, N., Price, B., Cohen, S., Yang, J., and Huang, T.: Deep Interactive Object Selection, in: 2016 IEEE Conference on Computer Vision and Pattern Recognition (CVPR), Las Vegas, NV, USA, 2016, 373–381, https://doi.org/10.1109/CVPR.2016.47, 2016. a, b, c
Xu, Z. and Zhao, S.: Fine-grained urban blue-green-gray landscape dataset for 36 Chinese cities based on deep learning network, Scientific Data, 11, 266, https://doi.org/10.1038/s41597-023-02844-2, 2024. a, b
Yuan, Y., Chen, X., and Wang, J.: Object-Contextual Representations for Semantic Segmentation, in: Computer Vision – ECCV 2020, Springer International Publishing, 173–190, https://doi.org/10.1007/978-3-030-58539-6_11, 2020. a