the Creative Commons Attribution 4.0 License.
the Creative Commons Attribution 4.0 License.
 | 29 Jul 2024
Sea-ice conditions from 1880 to 2017 on the Northeast Greenland continental shelf: a biomarker and observational record comparison
Kirsten Fahl
Matthias Moros
Alice Carter-Champion
Henrieka Detlef
Ruediger Stein
Christof Pearce
Marit-Solveig Seidenkrantz
This study reconstructs recent changes (1880–2017) in sea-ice conditions, using biomarkers (IP25 and phytoplankton sterols) from three sediment cores located in a transect across Belgica Trough, on the Northeast Greenland continental shelf. These results are evaluated using instrumental and historical data from the same region and time period. Over the entire study period, IP25 concentrations are highest at the inner shelf (site 90R) and decrease towards the mid-shelf (site 109R), with lowest values found at the outer shelf (site 134R). The PIP25 index yields the highest sea-ice cover at sites 109R and 90R and the lowest at 134R, in agreement with observational records. A decline in sea-ice concentration, identified visually and using change-point analysis, occurs from 1971 in the observational sea-ice data at sites 90R and 109R. A change in sea-ice concentration occurs in 1984 at site 134R. Sea-ice conditions in these years aligns with an increase in sterol biomarkers and IP25 at all three sites and a decline in the PIP25 index at sites 90R and 134R. The outcomes of this study support the reliability of biomarkers for sea-ice reconstructions in this region.
- Article
(5183 KB) - Full-text XML
-
Supplement
(1022 KB) - BibTeX
- EndNote


The decline in Arctic sea ice provides stark evidence that our climate is changing. In the last 4 decades, the extent of summer sea ice in the Arctic has decreased by around 44 % (Perovich et al., 2020). This is affecting global climate, through changes in albedo, freshwater flux, and surface heat exchange (Sévellec et al., 2017; Thomas, 2017). The decline in sea ice is attributed to warming air (AMAP, 2011) and ocean temperatures (Polyakov et al., 2011), and to changes in radiative (Kapsch et al., 2016) and wind forcings (Ogi et al., 2010). Yet, there is still uncertainty in the depiction of sea-ice conditions and seasonality in climate models, due, in part, to the relatively short length of instrumental records: specifically, continuous satellite data of sea ice that extend back only to 1979 and some historical records that extend back to 1850 (Walsh et al., 2019). In the absence of such records, we rely on proxies to reconstruct changes on longer timescales.
Biogenic and geochemical proxies have been developed to reconstruct sea ice (Belt and Müller, 2013; de Vernal et al., 2013; Stein et al., 2012). The mono-unsaturated highly branched isoprenoid (HBI), IP25 (sea-ice proxy with 25 carbon atoms), is produced solely by Arctic sea-ice dwelling diatoms during the spring bloom and deposited in sediments below when the sea ice melts (Belt, 2019, 2018; Belt et al., 2007). Together with biomarkers of open-water-dwelling phytoplankton (e.g. brassicasterol and dinosterol), these lipids can be used to reconstruct semi-quantitative estimates of sea-ice conditions, including sea-ice concentration, by calculating the PIP25 (phytoplankton biomarker IP25) index; this differentiates perennial sea ice and open water as both can be characterised by an absence of IP25 (Müller et al., 2011).
Sea-ice biomarkers (i.e. IP25 and PIP25) have been tested on surface samples by comparing reconstructions to instrumental data (Kolling et al., 2020; Müller et al., 2011; Navarro-Rodriguez et al., 2013; Xiao et al., 2015a) and subsequently used extensively for reconstructions of Holocene sea-ice conditions throughout the Arctic (e.g. Detlef et al., 2023, 2021; Georgiadis et al., 2020; Jackson et al., 2021; Müller et al., 2012; Stein et al., 2017; Syring et al., 2020a, b). Furthermore, some high-resolution sea-ice biomarker studies have been carried out for the last millennium, characterised by centennial cold and warm phases such as the Medieval Climate Anomaly and the Little Ice Age (Kolling et al., 2017; Massé et al., 2008). However, far fewer studies have undertaken high-resolution reconstructions that encapsulate changes over the last century and compared these results with instrumental datasets (Alonso-García et al., 2013; Cormier et al., 2016; Kim et al., 2019; Pieńkowski et al., 2017; Vare et al., 2010; Weckström et al., 2013). Currently, there are no such high-resolution records of sea-ice conditions from Northeast Greenland.
The upper parts of sediment cores often span the redox sedimentary boundary; this makes the degradation of sterols and HBIs more likely (Rontani et al., 2018). Unfortunately, this part of the record frequently coincides with anthropogenic climate change, where dramatic changes in sea ice have occurred. Thus, disentangling degradation signals from recorded environmental changes is important to improve the reliability of reconstructions of past sea-ice conditions. Such high-resolution studies can be used to address this issue, together with data from the ratio of two common phytoplankton sterols: epibrassicasterol and 24-methylenecholesterol, which have previously been used to investigate autoxidation processes that can affect the preservation of IP25 (Rontani et al., 2018). Furthermore, two selected degradation products of IP25 are analysed to assess degradation in this study.
Historical data from the Nordic Seas indicate changes in the position of the sea-ice margin over recent centuries (Divine and Dick, 2006), with an even stronger shift in perennial (multi-year) to seasonal sea ice across the Arctic marginal seas in recent decades (Nghiem et al., 2007; Onarheim et al., 2018; Wang et al., 2022), yet these latter changes are neither seasonally nor regionally uniform (Årthun et al., 2021). Northeast Greenland is an area characterised by several sea-ice types and features; it is thus a region of interest to understand the impact of climate changes on sea-ice extent. These features include landfast sea ice (hereafter “fast ice”), seasonal sea ice and the Northeast Water (NEW) polynya. Its location also means that it is influenced by sea ice exported from the Arctic Ocean through the Fram Strait. This results in the presence of multi-year sea ice in the region, on the outer shelf. Due to its extensive sea ice, this area had remained relatively undersampled until recently. It is also an area that has been subject to retreat of sea ice in recent decades. Consequently, Northeast Greenland is an ideal location to test time series comparisons of sea-ice proxies versus observational records, both to further develop the proxies and to investigate whether there have been previous periods of sea ice loss during the last century.
In this study, we present the first high-resolution biomarker reconstructions of recent sea ice from the Northeast Greenland shelf based on analyses of three marine sediment cores that span a transect from the inner to the outer Belgica Trough (Fig. 1). These data are compared with satellite and historical data to evaluate biomarkers for reconstructing sea ice in this region. Throughout the article, the term “recent” refers to the last ca. 130 years, spanning from 1880 to the date of core collection (September 2017).
Sea ice along the Northeast coast of Greenland can broadly be divided into four zones, seen from the shoreline towards the open sea: (1) fast ice, which forms along the coast and remains stationary throughout the winter months; (2) a transitional zone, forming the boundary between the fast ice and the pack ice zone; (3) the pack ice zone, which is composed of ice originating in the Arctic Ocean and subject to movement via both wind and ocean currents; and finally (4) the marginal ice zone, which defines the area between the pack ice and open water (Pedersen et al., 2010; Wadhams, 1981). Areas of open water are common within the transitional zone, where the mobile pack ice moves along the stationary fast ice; this includes well-defined polynyas (Pedersen et al., 2010).
The Norske Øer Ice Barrier (NØIB) is an area of perennial fast ice that acts as a buttress to marine-terminating glaciers in Northeast Greenland, reducing calving at the glacier front (Fig. 1c; Reeh et al., 2001). The formation of fast ice begins in the shallow areas of the Belgica Bank, with grounded ridge keels and icebergs keeping the drift ice in place (Hughes et al., 2011). The fast ice is made up of old drift ice carried southwards from the Arctic Ocean by the East Greenland Current and held together with newly formed ice (Hughes et al., 2011). The NØIB was first observed in 1938 (Koch, 1945). Whilst there has been considerable variation in the extent of the NØIB, in the past its breakup was a rare event, estimated to occur once every about 50 years (Higgins, 1989). However, the NØIB has been disintegrating almost every summer since 2000, likely driven by the warming oceans and atmosphere (Sneed and Hamilton, 2016); this has resulted in increased calving of nearby marine-terminating glaciers (Reeh et al., 2001). Furthermore, direct observations of the NØIB made between 2012 and 2013 indicate that high ocean heat fluxes, combined with thick snow cover, resulted in net loss of ice at the ice bottom (Wang et al., 2020).
The Northeast Greenland Ice Stream (NEGIS) drains approximately 12 % of the ice sheet interior, via two marine-terminating glaciers: Nioghalvfjerdsfjorden Glacier (79NG) and Zachariæ Isstrøm (ZI) (Fahnestock et al., 2001; Hvidberg et al., 2020; Khan et al., 2014; Mouginot et al., 2015). Due to its topographic setting, the NEGIS is particularly vulnerable to climate change and has retreated and thinned rapidly in recent decades (Khan et al., 2014; Mouginot et al., 2015). Modelling estimates suggest that the marine-based sectors of the NEGIS will contribute between 13.5 and 15 mm to sea-level rise by 2100 (Khan et al., 2022). Whilst 79NG has a more stable grounding line than ZI, modelling studies indicate that loss of the 79NG ice shelf would cause the grounding line to retreat by around 10 km (Mayer et al., 2018). Results show that the variability in basal melt of 79NG over the last 50 years is mainly associated with warming of Atlantic water (Wekerle et al., 2024). Direct observations have also linked reduced sea-ice concentrations to glacier front calving between 2002 and 2004 (Khan et al., 2014). Thus, accurate depictions of past sea-ice conditions in Northeast Greenland are important to understand the processes driving the stability of these glaciers in the future.
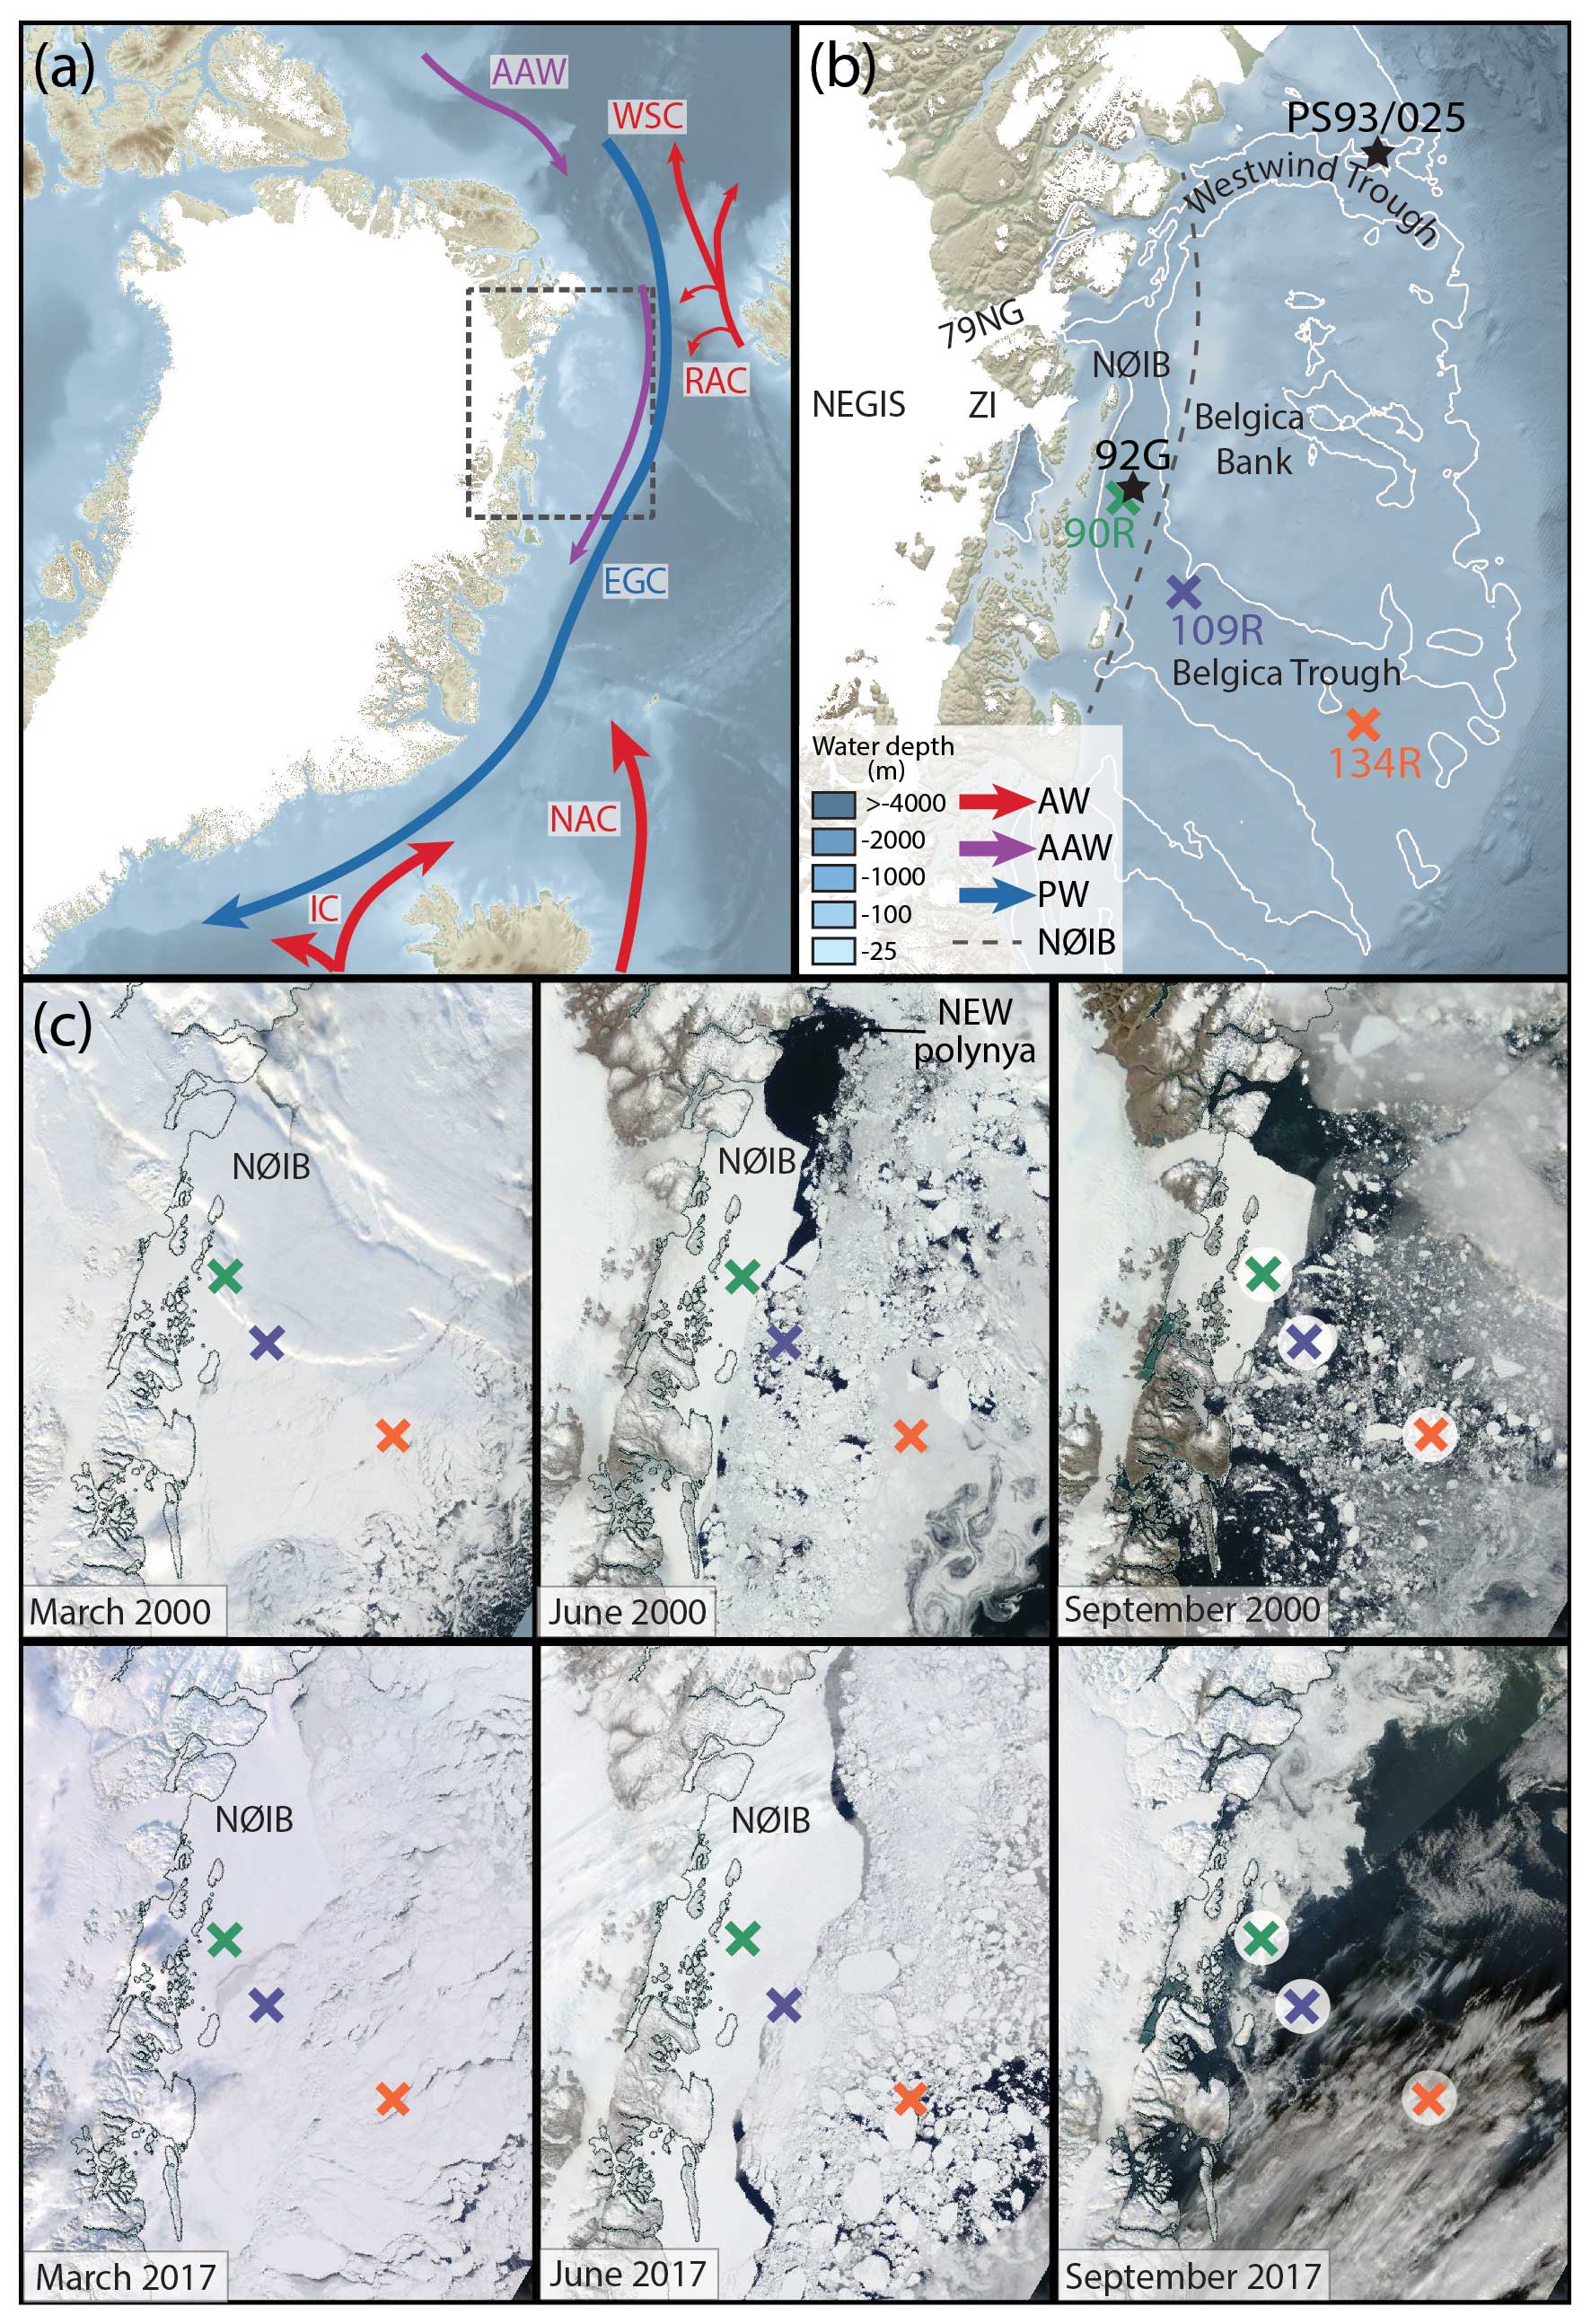
Figure 1(a) An overview of the study site showing key ocean circulation patterns: warm currents (red) – North Atlantic Current (NAC), Irminger Current (IC), Return Atlantic Current (RAC), West Spitsbergen Current (WSC), Arctic Atlantic Water (AAW; purple) and East Greenland Current (blue). (b) A close-up of the Northeast Greenland continental shelf, showing the location of the three sediment cores used in this study: 90R (green), 109R (dark purple) and 134R (orange). Gravity core 92G is shown (black star) and sediment core PS93/025 (black star; Syring et al., 2020a). The ocean bathymetry comes from the General Bathymetric Chart of the Oceans (GEBCO) and ice velocity data from Sentinel SAR data from 2019–2020 (Nagler et al., 2015). The glaciers that make up the Northeast Greenland Ice Stream (NEGIS) are shown: Zachariæ Isstrøm (ZI) and Nioghalvfjerdsfjorden Glacier (79NG). The approximate location and extent of the Norske Øer Ice Barrier (NØIB) is marked (dotted black line). (c) Satellite data showing sea-ice conditions from (top) 16 March (left), 6 June (middle) and 4 September (right) from 2000 and from (bottom) 15 March (left), 3 June (middle) and 19 September 2017 (right) respectively. The locations of the Northeast Water (NEW) polynya and NØIB are marked. The core locations are shown as coloured crosses. Images courtesy of the © NASA Worldview (https://worldview.earthdata.nasa.gov/, last access: 14 June 2023).
3.1 Sediment cores
Three Rumohr cores, DA17-NG-ST08-090R, DA17-NG-ST10-109R and DA17-NG-ST12-134R (henceforth 90R, 109R and 134R respectively), are used in this study (Fig. 1b; Table 1). All cores were collected from the Belgica Trough, which crosses the Northeast Greenland shelf from NW–SE. For all cores, the sediment–water interface was undisturbed at the time of sampling (clear sea water was preserved in the tube above the sediment), showing that the sediment surface was most likely intact. Gravity core DA17-NG-ST08-092G, henceforth 92G (Fig. 1b), located close to 90R is also used to assist in the chronology. All cores were collected on board the Danish research vessel DANA in 2017 as part of the NorthGreen2017 Expedition (Seidenkrantz et al., 2018). After collection, the cores were stored at 3 °C, at Aarhus University, Denmark, where they were split and sampled for analysis.
Table 1Location and water depth of the three Rumohr cores analysed, and the gravity core. The coordinates for the corresponding historical sea-ice data (obtained from Walsh et al., 2019) are also shown.
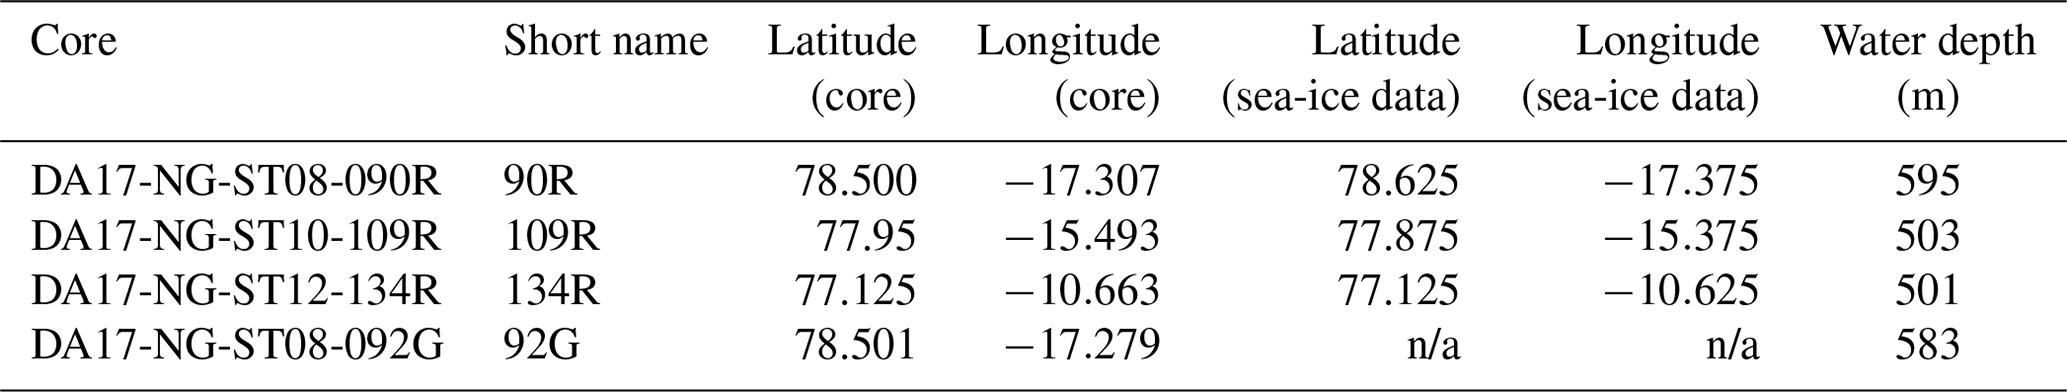
n/a: not applicable
3.2 Sampling
Sediment samples were taken at 0.5 cm resolution in the upper parts of the three cores (10 cm for 109R, 7.5 cm for 134R and 8 cm for 90R); one further sample was taken at 14 cm in all three sediment cores. These samples were weighed, freeze-dried and homogenised. Between 2.5 and 5 g of freeze-dried sediment was taken for biomarker analysis, for chronological constraint (100 mg); between 15 and 20 mg was taken for total organic carbon (TOC), total nitrogen (TN) and δ13Corg analyses.
3.3 X-ray fluorescence
For the purpose of precise correlation between the two cores from the same location, sediment cores 92G and 90R were scanned by X-ray fluorescence (XRF) with an ITRAX scanner equipped with a molybdenum X-ray tube at 30 kV and 30 mA to record the elemental spectra at 0.2 mm resolution, at the Department of Geoscience, Aarhus University, Denmark. As cores 109R and 134R were not correlated with other cores from the same sites, XRF analysis was not undertaken on these cores.
3.4 Grain size analysis
In order to further strengthen the correlation between the two cores, grain size analysis was undertaken on sediment cores 92G and 90R using a Sympatec HELOS laser diffractometer, equipped with a QUIXEL wet disperser, 6 mm cuvette and R4 lens, at 1 cm at the Department of Geoscience, Aarhus University, Denmark. A peptiser solution (10 mL (NaPO3)6 15 %) was first added to the laser diffractometer and a reference measurement undertaken, before the sample was measured. Grain sizes were grouped into four fractions: sand (>63 mm), medium to coarse silt (15.6–63 mm), very fine to fine silt (3.9–15.6 mm) and clay (0.6–3.9 mm). As cores 109R and 134R were not correlated with other cores from the same sites, grain size analysis was not undertaken on these cores.
3.5 Organic bulk sediment parameters
The freeze-dried and homogenised sediment (15–20 mg) was added into silver capsules with 30 µL Silex water. The samples were put in a microtiter plate, together with a beaker with concentrated HCl, and placed in a desiccator in a vacuum until the acid boiled (6–24 h). This removes any carbonates from the sediment sample. Acetanilide and soil standards are also added. Samples were then dried gently in an oven at 60 °C, and the capsules were then closed and analysed for TOC on an elemental analyser connected in continuous flow mode to an isotope ratio mass spectrometer (Delta V, Thermo Scientific). As working standards for isotope ratio analysis, pure gases of CO2 and N2, calibrated against certified reference materials of 13C sucrose and 15N–(NH4)2SO4, are used respectively. The analytical uncertainty of well-mixed, homogenous bulk sediment samples is ±0.1 ‰. This analysis was undertaken at the University of Copenhagen, Denmark. Previous studies have used such data to determine organic matter sources; however, in Northeast Greenland research shows (e.g. Andreasen et al., 2023) that it is difficult to decipher the marine and terrestrial sources in this region. As such, we use organic bulk parameter data only to normalise the sea-ice biomarker data in this study; however, the full downcore dataset can be found in the Supplement.
3.6 Biomarker analysis
Analysis was undertaken at AWI, Bremerhaven, Germany. Between 2.5 and 5 g of the freeze-dried and homogenised sediment was used for each sample. Internal standards were added to each sample prior to extraction: 7-hexylnonadecane (7-HND, 0.076 µg per sample), 9-octyl-heptadec-8-ene (9-OHD, 0.01 µg per sample), 5α-androstan-3β-ol (androstanol, 1.07 µg per sample) and squalane (0.32 µg per sample), for quantification. Extraction was undertaken using dichloromethane / methanol (DCM / MeOH, 2:1), followed by ultrasonication (15 min) and centrifugation (3 min); this was undertaken three times. The solvent was then removed under a slow stream of nitrogen. Hexane was then added to the extract and column chromatography undertaken.
Column chromatography was undertaken using SiO2 gel, with 5 mL of n-hexane and 9 mL of ethylacetate / n-hexane. Before measuring, the polar fraction, containing sterols, was silylated using 200 µL of bis(trimethylsilyl)trifluoroacetamide (BSTFA) at 60 °C for 2 h. The HBIs were measured using a gas chromatograph (Agilent Technologies 7890B GC system; 30 m DB-1MS column, 0.25 mm i.d., 0.25 µm film thickness) coupled to a mass spectrometer (Agilent 5977A MSD; 70 eV constant ionisation potential, scan 50–550 , one scan per second, ion source temperature 230 °C, Performance Turbo Pump) with the temperature programme: 60 °C (3 min), 150 °C (heating rate: 15 °C min−1), 320 °C (heating rate: 10 °C min−1) and 320 °C (15 min, isothermal). Sterols were measured with an Agilent 6850 GC (30 m DB-1MS column, 0.25 mm i.d., 0.25 µm film thickness) coupled to an Agilent 5975C VL MSD with the following temperature sequence: 60 °C (2 min), then 150 °C (heating rate: 15 °C min−1), 320 °C (heating rate: 3 °C min−1) and 320 °C (20 min isothermal).
The identification and quantification of biomarkers was done in ChemStation and is based on individual retention times and mass spectra (Belt et al., 2007; Boon et al., 1979; Rontani et al., 2018; Volkman, 1986). The highly branched isoprenoids (HBIs) and sterols were identified: IP25 at 350, HBI II at 348, HBI III (both isomers) at 346, epibrassicasterol (24-methylcholesta-5,22-dien-3β-ol) at 470, dinosterol (4α,23,24-trimethyl-5α-cholest-22E-en-3β-ol) at 500, sitosterol (24-ethylcholest-5-en-3β-ol) at 486, and campesterol (24-methylcholest-5-en-3β-ol) at 472. 24-Methylenecholesterol (24-methylcholesta-5,24(28)-dien-3 β-ol) at 470 was also identified for biodegradation rate calculations. The degradation products of IP25 were identified by the fragment ion 131 (Rontani et al., 2018): (a) 2,6,10,14-tetramethyl-9-(3-methylpent-4-enyl)-pentadecan-2-ol and (b) 2,6,10,14-tetramethyl-7-(3-methylpent-4-enyl)-pentadecan-2-ol. All sterols and the IP25 degradation products were quantified as trimethylsilyl ethers. For more details, please refer to Fahl and Stein (2012). The identified peaks were integrated and compared to the integrated peak area of the added internal standards. The data were normalised using the TOC of samples and freeze-dried sediment weights.
The PIP25 index was calculated using Eq. (1) (Müller et al., 2011):
where c is the balance factor. Eq. (2) is then as follows:
Brassicasterol has frequently been used as an open-water biomarker; thus, it is often selected as the phytoplankton biomarker when calculating the PIP25 index (PBIP25). However, research suggests that in some environments brassicasterol may also be influenced by other sources, including sea-ice algae and freshwater and terrestrial sources (Belt et al., 2015, 2013; Fahl and Stein, 2012; Huang and Meinschein, 1979; Volkman, 1986). In these instances, dinosterol has been used as the phytoplankton biomarker for calculation of the PIP25 index (PDIP25). In all three cores from Northeast Greenland, 90R, 109R and 134R, the concentration pattern of brassicasterol is similar to dinosterol. Thus, the differences in the PIP25 values are negligible (Supplement Fig. S3), and brassicasterol is deemed appropriate for use in the calculation. The mean brassicasterol concentrations were taken from the three cores combined, creating a regional average.
Correlation analysis was undertaken to assess the relationship between brassicasterol and IP25 and dinosterol and IP25 for each sediment core; the R2 and p values are presented for sites 90R, 109R and 134R respectively.
The ratio of two phytoplanktonic sterols, details above, were calculated in the upper 8 cm of the cores 90R, 109R and 134R: (1) epibrassicasterol and (2) 24-methylenecholesterol (Bra 24-Me). This ratio, together with IP25, can be used to investigate the degradation processes (Rontani et al., 2018). This is attributed to the different positions of double bonds in the alkyl chains of epibrassicasterol and 24-methylenecholesterol, which makes enhanced reactivity more likely in epibrassicasterol. Thus, an increase in the Bra 24-Me ratio has been used as an indicator of degradation (Rontani et al., 2018)
3.7 Chronology
Samples were taken at 0.5 cm intervals, freeze-dried and homogenised prior to analysis. All analyses were undertaken at the Leibniz Institute for Baltic Sea Research. Analyses (cf. Moros et al., 2017) of natural lead 210Pb and artificial 137caesium (137Cs) / 241americeum (241Am) radionuclides were carried out by gamma spectrometry with a Ge detector (BE3830-7500SL-RDC-6-ULB) at IOW and processed with GENIE 2000 software (Canberra Industries Inc., USA). Analysis of mercury (Hg) was undertaken using a DMA-80 Analyzer from the company MLS. This was calibrated against CRM (BCR) 142R certified reference material. Sample weights were 100 mg.
The combined event stratigraphic approach, applying radionuclide measurements and pollution records (Moros et al., 2017), has been successfully used in nearby areas (Perner et al., 2019, 2018, 2015). Due to low sedimentation rates, and the associated uncertainty, linear interpolation was undertaken between three tie points: ∼1900 (based on the increase in 210Pb and Hg, which indicates the increase in global atmospheric Hg pollution), ∼1954 (beginning of the atmospheric nuclear weapons testing period denotes first trace of 137Cs and 241Am in downcore profiles) and the sediment surface (2017), the year of sampling. For comparison, the upper part of core 92G was analysed for its Hg content and correlated with 90R using XRF and grain size data (Supplement).
3.8 Observational data
Monthly sea-ice concentration data were extracted from a historical sea-ice database (Walsh et al., 2019) for sites 90R, 109R and 134R from 1850 to 2017. It should be noted that changes in sea ice in Northeast Greenland have occurred since 2017. However, as this is beyond the timeline of our biomarker data, due to the date of core collection (2017), we do not outline or discuss those changes in this paper. The historical data are available as monthly concentrations on a 0.25×0.25° grid from the National Snow and Ice Data Center (NSIDC). The site locations are therefore rounded to the nearest 0.25° latitude and longitude for each site (Table 1) and extracted using the “tidync” and “dplyr” R packages alongside the averaged historical data for the area covering all three site locations. Five-year running means were then extracted for comparison with the lower-resolution biomarker data presented within this study. The September sea-ice concentration data are presented here, together with number of months with >25 % sea-ice concentration. September sea-ice data reflect the minima and are thus selected to compare with the biomarker data.
Between 1850 and 1979 the historical observations are derived from ship observations, naval oceanographer compilations and analyses by national ice services, with spatial–temporal interpolation based on regional climatology if no observational data were available in the earliest sections of the record (Walsh et al., 2019). Between 1953 and 1973, the US Navy produced detailed regional analyses of sea-ice concentration data, which were spatially–temporally interpolated if the coverage was insufficient (Walsh et al., 2019). After 1979, the dataset comprises sea-ice concentrations from satellite passive microwave data (Walsh et al., 2019).
3.9 Statistical analysis
Change-point analyses were undertaken on the observational sea-ice concentration dataset (September sea-ice concentration, 1850–2017; Walsh et al., 2019) to detect the timing of changes occurring within the dataset, using the “changepoint” software package from (Killick et al., 2021). A series of models, which examine changes to the mean, variance and trend, were applied on the annually resolved observational dataset, and the model with the best fit was selected. This is calculated by examining the Akaike information criterion (AIC) and Bayesian information criterion (BIC) estimates for each model. This analysis was undertaken on sites 90R, 109R and 134R separately.
The correlation between sterols (brassicasterol and dinosterol) and IP25 was investigated. Biomarkers are normalised with TOC. The same correlations with biomarkers normalised with sediment weight are presented in the Supplement (Fig. S1).
4.1 Chronology
The intact surfaces (0 cm) of all three Rumohr cores are assumed to correspond to the year of collection (2017), due to the undisturbed sediment visible at the time of collection. 210Pbunsupp. surface values are 136, 146 and 180 Bq kg−1 for 90R, 109R and 134R respectively; these values decrease exponentially downcore (Fig. 2). Hg concentration values range from 21 to 59, 39 to 62 and 41 to 63 µg kg−1 for cores 90R, 109R and 134R respectively (Fig. 2). The Hg values decrease downcore and reach natural background level at 8.5 cm in 109R and at 7.25 cm in 134R. Core 90R is problematic as Hg values increase again from 7.25 cm downwards. Consequently, the Hg-based age constraint in this section of the core is uncertain. The ∼1900 marker is thus placed at 8.5 cm and 7.25 cm for cores 109R and 134R respectively. 241Am and 137Cs values first appear at 4.25, 3.25 and 5.25 cm in cores 90R, 109R and 134R respectively; this is marked as 1954 (Fig. 2).
Assuming a constant sedimentation rate between markers (2017, 1954 and 1900), the age model indicates that in the upper part of the cores, the sedimentation rate is 0.05 cm yr−1 (upper 3.25 cm), 0.05 cm yr−1 (upper 3.25 cm) and 0.08 cm yr−1 (upper 5.25 cm) in 134R, 109R and 90R respectively. Below these levels, the sedimentation rate is 0.05 cm yr−1 (134R) and 0.1 cm yr−1 (109R).
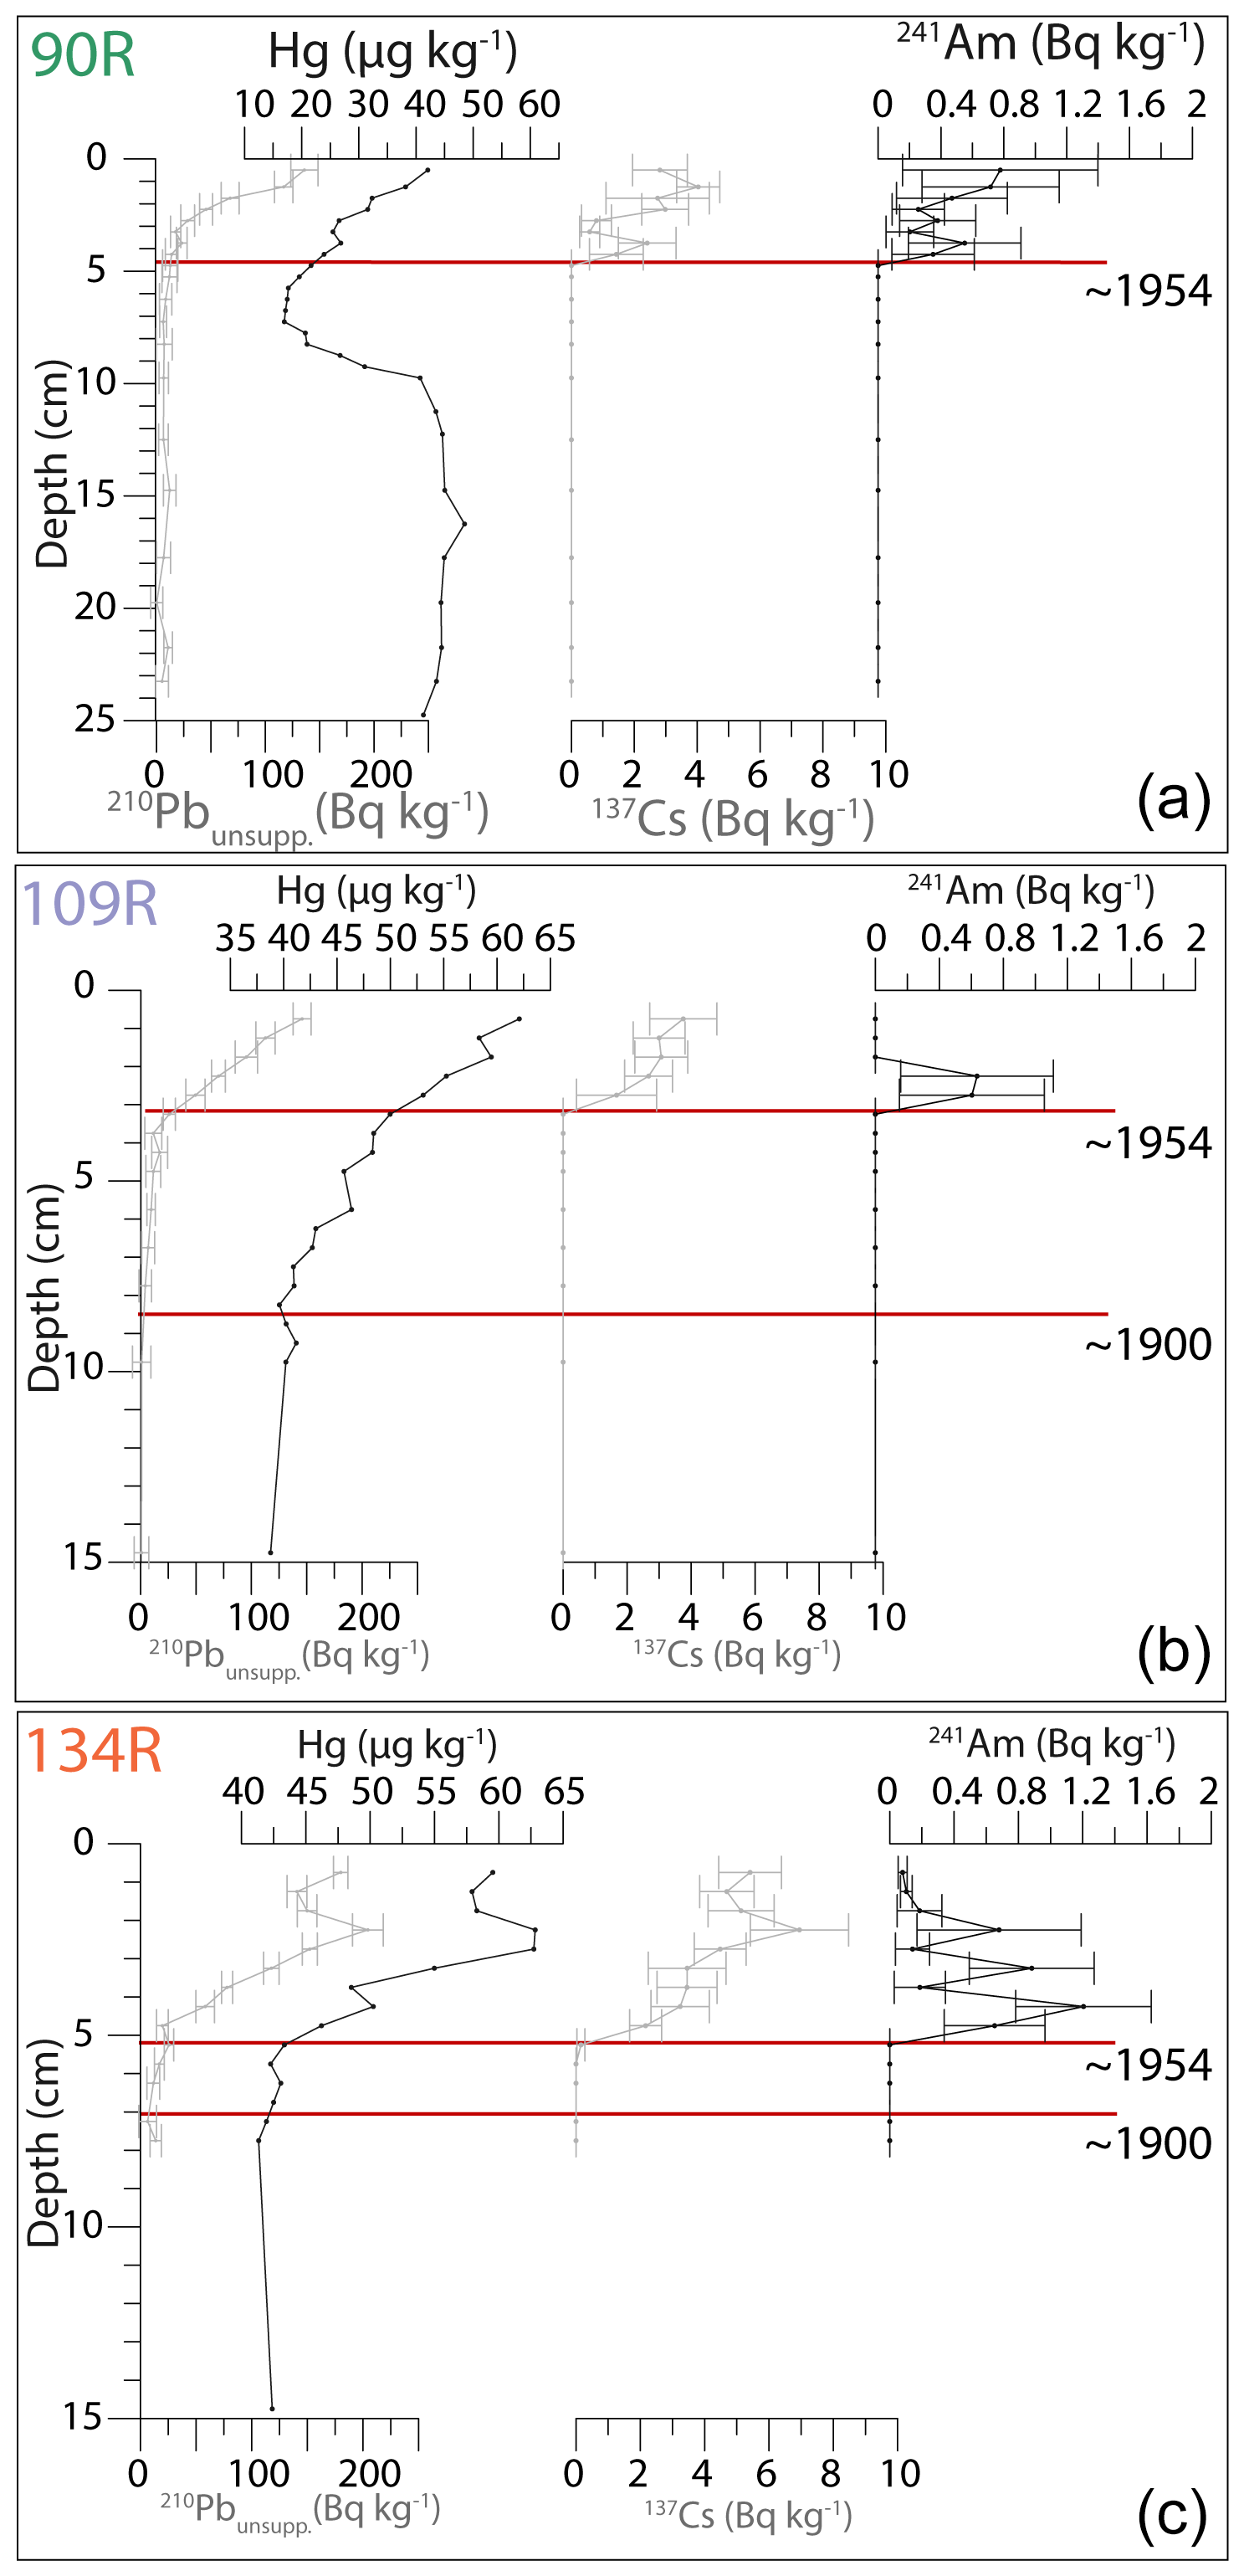
Figure 2Downcore profiles of 210Pbunsupp., Hg, 137Cs and 241Am, including error ranges, for cores 90R (a), 109R (b) and 134R (c); the colour of the core name refers to the colour of the star for the site in Fig. 1. Approximate markers (1900 and 1954) are shown with red lines.
4.2 Biomarkers
IP25 concentrations vary between 90R, 109R and 134R, with average core values of 0.19, 0.11 and 0.06 µg g−1 TOC respectively (Fig. 3). Patterns are similar for IP25 concentrations normalised to TOC and dry-sediment weight respectively (Fig. 3). IP25 is present in low concentrations in the lower parts of 90R and 109R and completely absent below 6 cm depth in 134R. Concentrations begin to increase at 7.75 cm in 90R and at 9.5 cm in 109R and increase gradually towards the uppermost part of the cores, with a slight decrease in the upper 1 cm. There is a peak in IP25 at 5.75 cm in 134R, and concentrations increase from 4 cm towards the top of the core, again with a slight decrease in the uppermost section (Fig. 3).
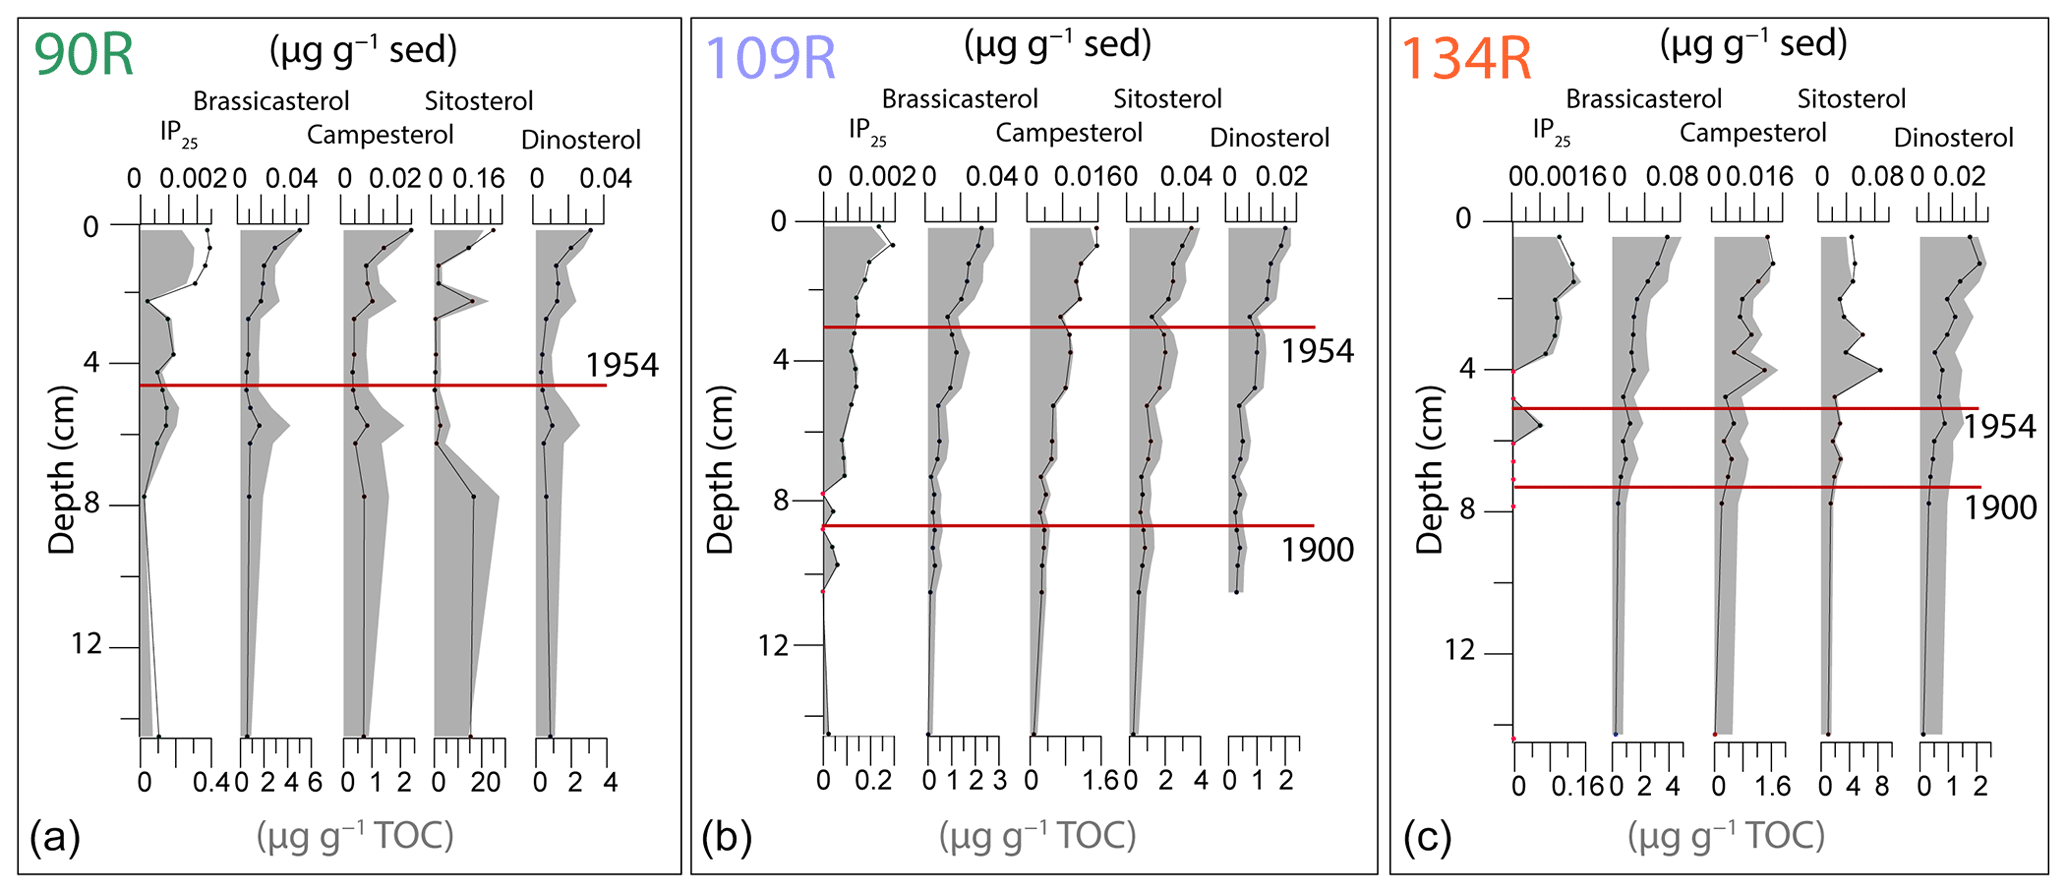
Figure 3Concentrations of biomarkers, IP25 and sterols (brassicasterol, campesterol, sitosterol and dinosterol) for 90R (a), 109R (b) and 134 (c) shown on depth. Red dots on the IP25 curve indicate samples where IP25 was present but was too low to quantify. Concentrations are normalised using the dry-sediment weight (dark-coloured lines) and TOC (grey-shaded area). The age markers (1900 and 1954) are shown for each core (red line).
In core 90R, concentrations of brassicasterol, campesterol and dinosterol are relatively low before concentrations increase from 2.25 cm towards the uppermost part of the core (Fig. 3). There is a noticeable peak in the same three sterols at 5.75 cm. Sitosterol concentrations are slightly higher in the lower two samples of the core, with low concentrations between 6.25 cm and a slight increase from 1.25 cm towards the top of the core (Fig. 3). The concentrations of all sterols in 109R are low but increase steadily upwards through the core, with the highest concentrations in the surface sediments. The patterns of sterol concentrations in core 134R are similar to those of 109R, with a gradual increase towards the top of the core. The exception is sitosterol, which fluctuates between 4 and 0 cm, with no clear increase. Concentrations of sterols normalised using TOC and dry-sediment weight show a similar pattern for all cores (Fig. 3).
Correlation plots (Fig. 4) show that there is a significant (p<0.05) positive correlation between brassicasterol and IP25 in cores 90R, 109R and 134R with R values of 0.62, 0.90 and 0.78 respectively. The exceptions are samples where the IP25 concentrations were too low to be quantified. Dinosterol and IP25 are also significantly correlated (p<0.05) for all three cores, with R values of 0.56, 0.88 and 0.82 for 90R, 109R and 134R respectively; 134R has the lowest IP25 concentrations, with the values in 109R and 134R being more similar (Fig. 4).
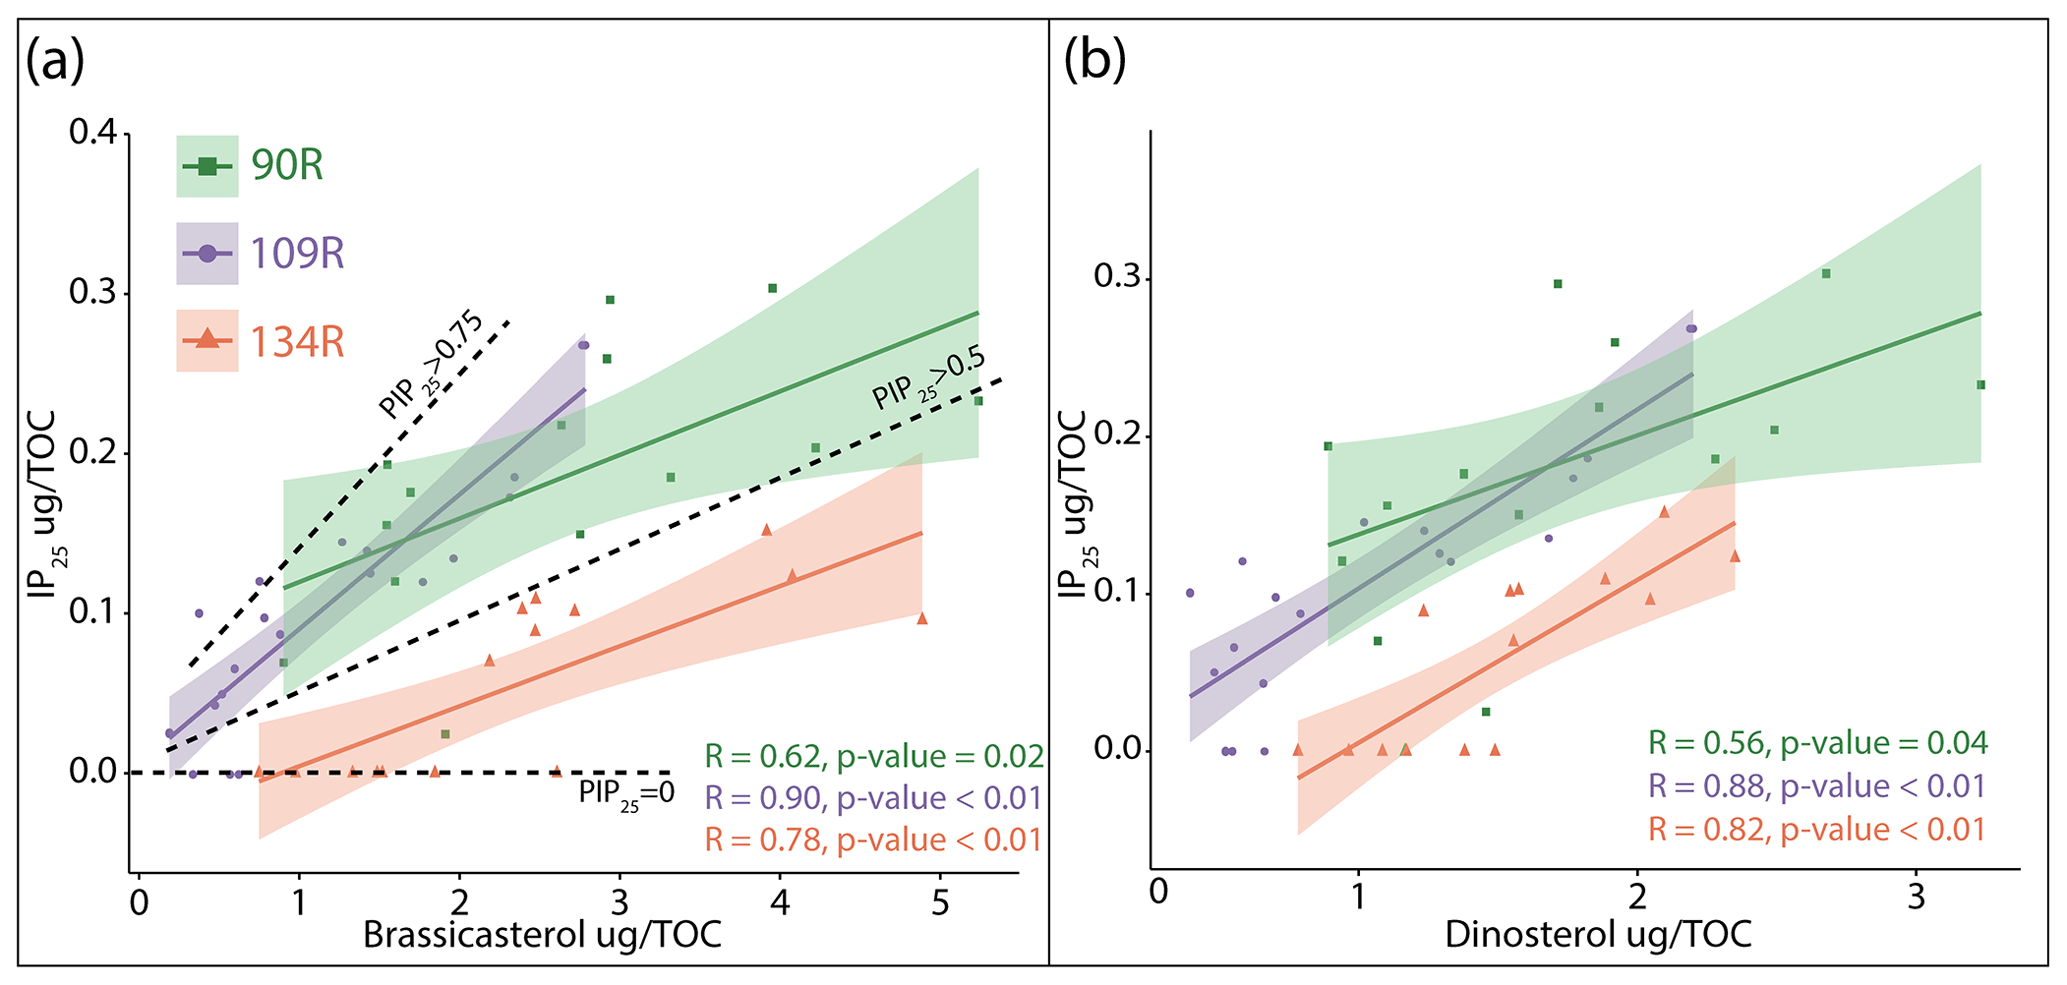
Figure 4Correlations of (a) brassicasterol and IP25 and (b) dinosterol and IP25 for all sediment cores: 90R (green), 109R (purple) and 134R (orange). IP25 is normalised with TOC. The R values are listed for each core (bottom right) together with the p values. Dashed black lines are used to separate samples based on PIP25 values (0.75, >0.5 and =0).
4.3 Ratio of epibrassicasterol and 24-methylenecholesterol (Bra 24-Me)
In sediment core 90R, the ratio of Bra 24-Me (Fig. 5) gradually increases from 7.75 to 3.75 cm, before declining towards the top of the core. The ratio of Bra 24-Me fluctuates in the lower part of core 109R. Values gradually decrease towards the top of the core, from 4.5 cm; this corresponds to a general gradual increase in IP25 concentrations (Fig. 5). The ratio of Bra 24-Me is high in the lower part of core 134R (from 8 cm), before values decrease and remain relatively low towards the sediment surface (Fig. 5). This corresponds with a general increase in IP25 values upwards in the core, before a general decline at the top of the core.
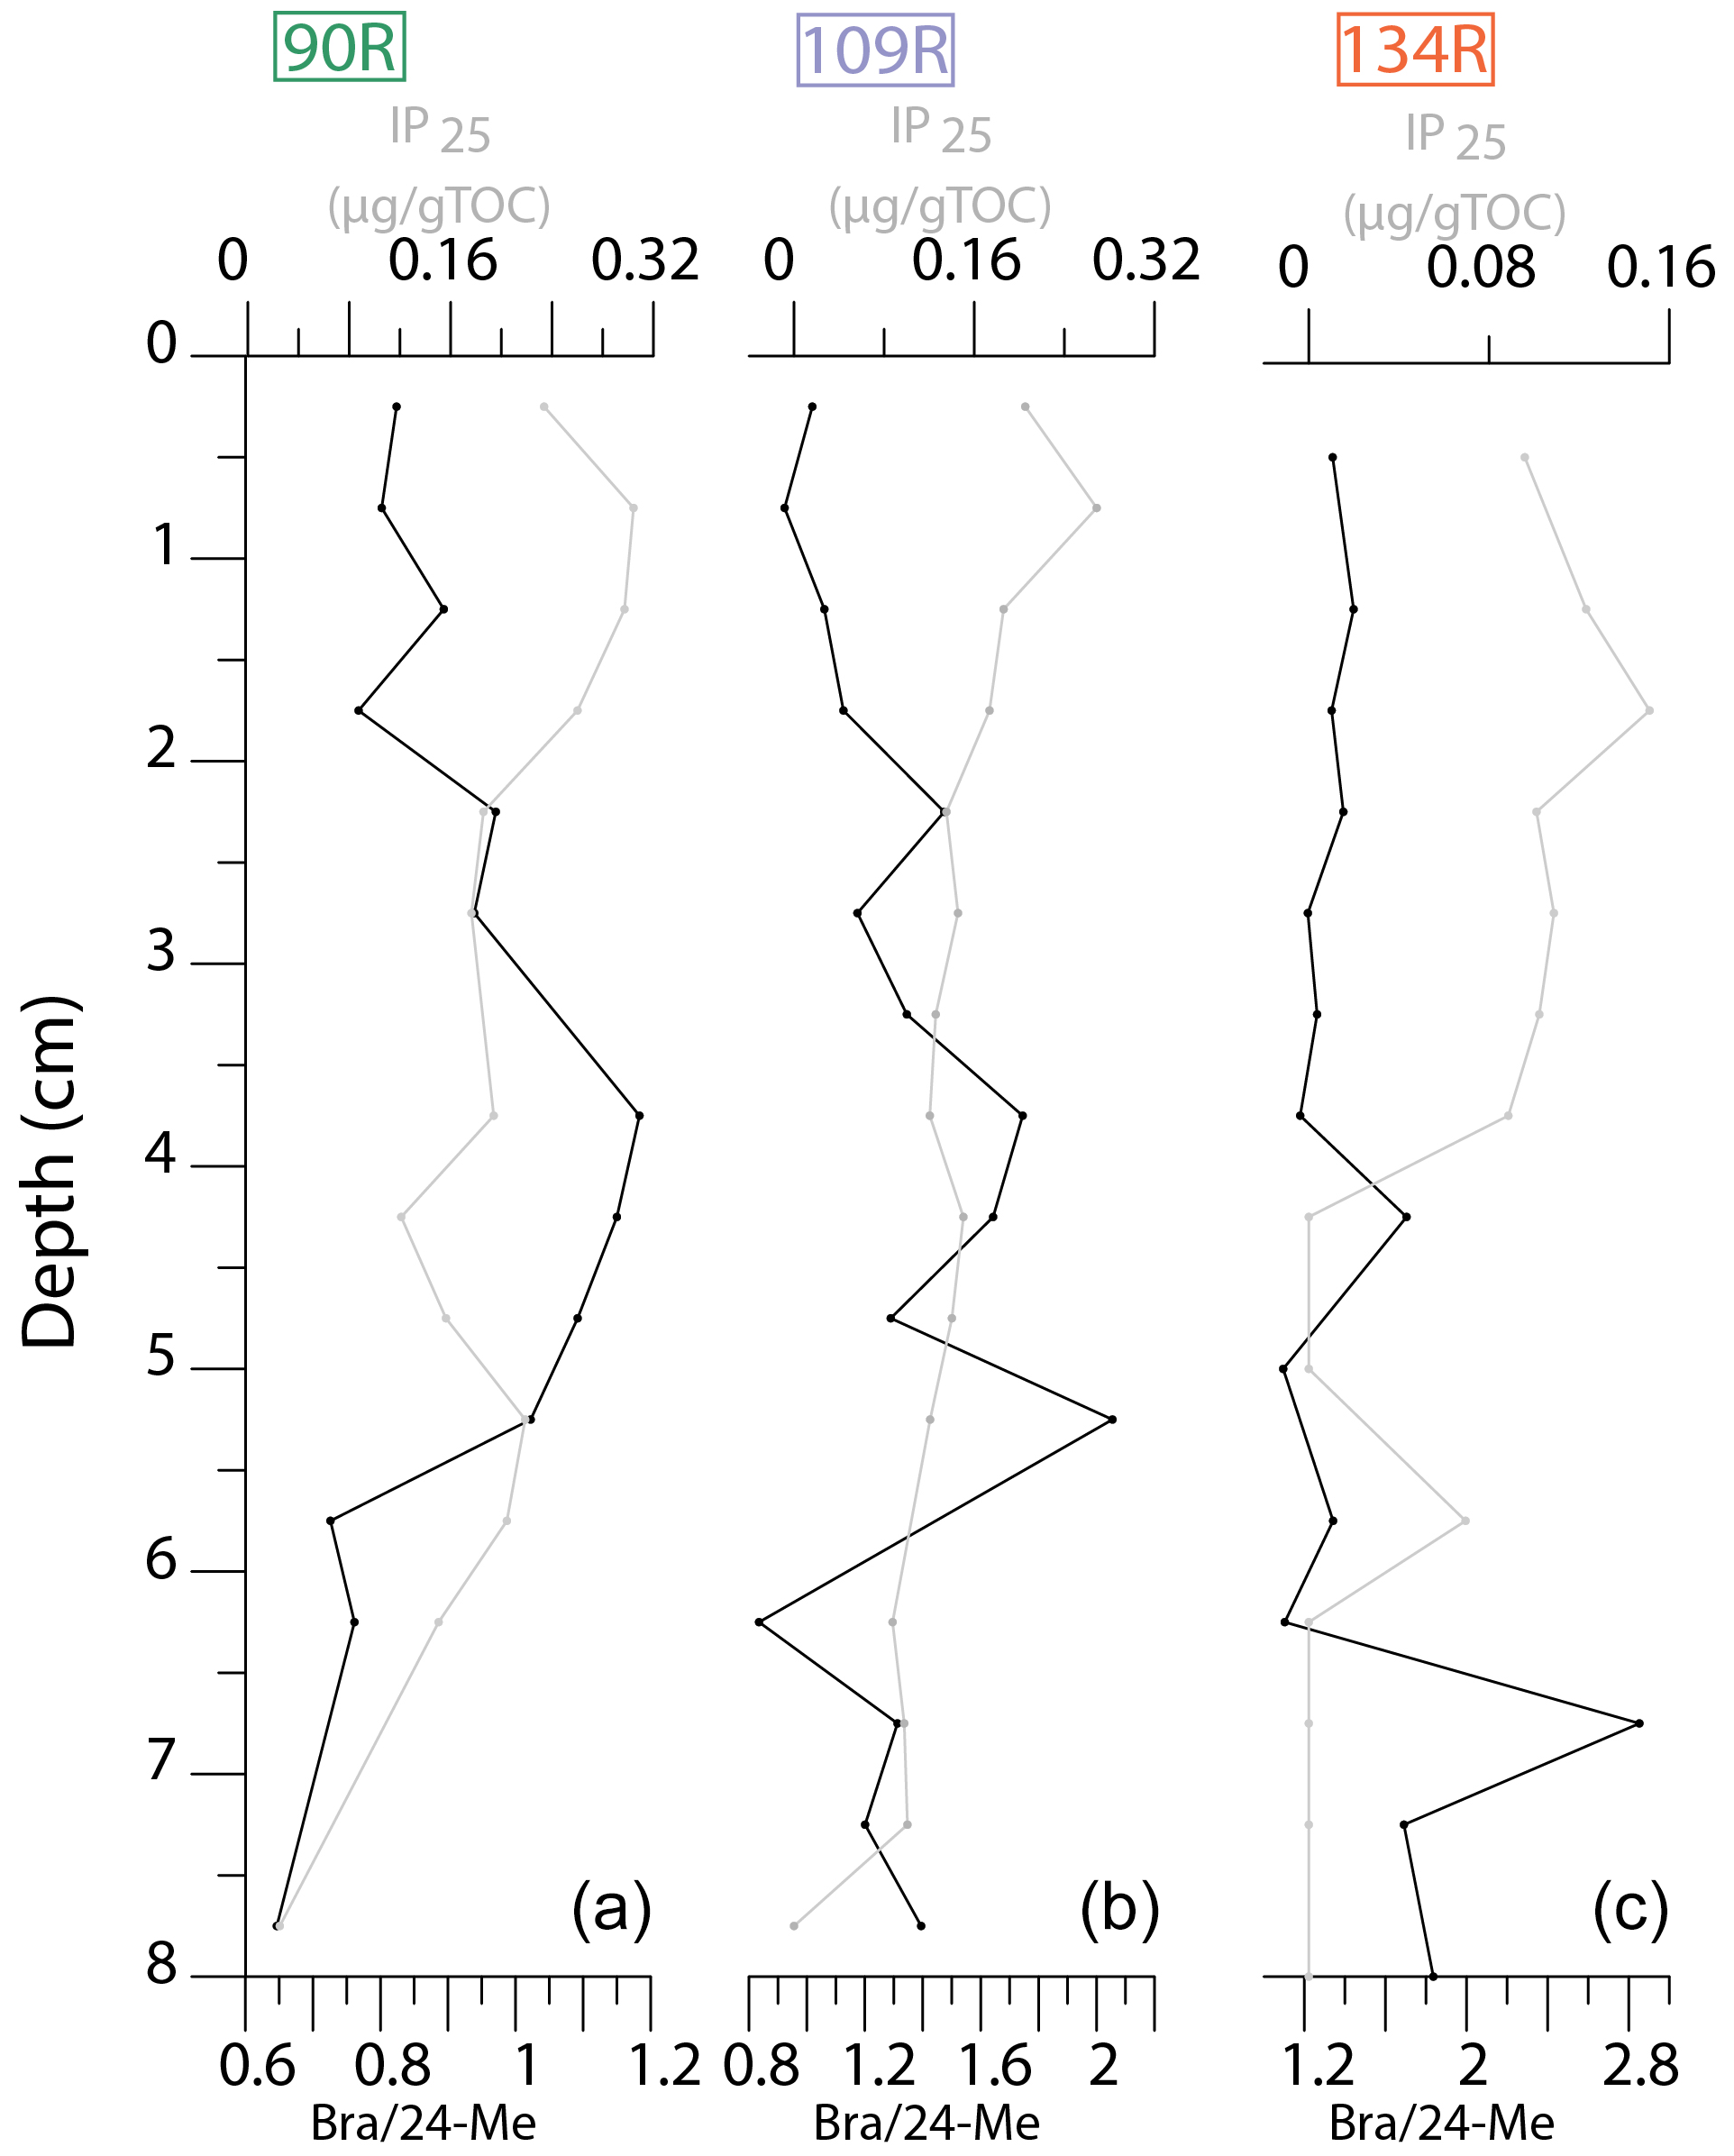
Figure 5Downcore plots (upper 8 cm) of IP25 concentrations (grey) and the epibrassicasterol / 24-methylenecholesterol (Bra 24-Me) ratio (black) for 90R (a), 109R (b) and 134R (c).
4.4 Degradation products of IP25
The degradation products of IP25 2,6,10,14-tetramethyl-9-(3-methylpent-4-enyl)-pentadecan-2-ol (degradation product a) and 2,6,10,14-tetramethyl-7-(3-methylpent-4-enyl)-pentadecan-2-ol (degradation product b) are presented in Fig. 6. In general, values of degradation products a and b follow similar patterns in all cores. Degradation products gradually increase from 8 cm in core 90R, before peaking at 3.75 cm and generally declining thereafter. In core 109R, the values of the degradation products fluctuate throughout the core. In core 134R, degradation products a and b peak at 7.25 cm. Following this, values are relatively stable, before gradually declining towards the top of the core.
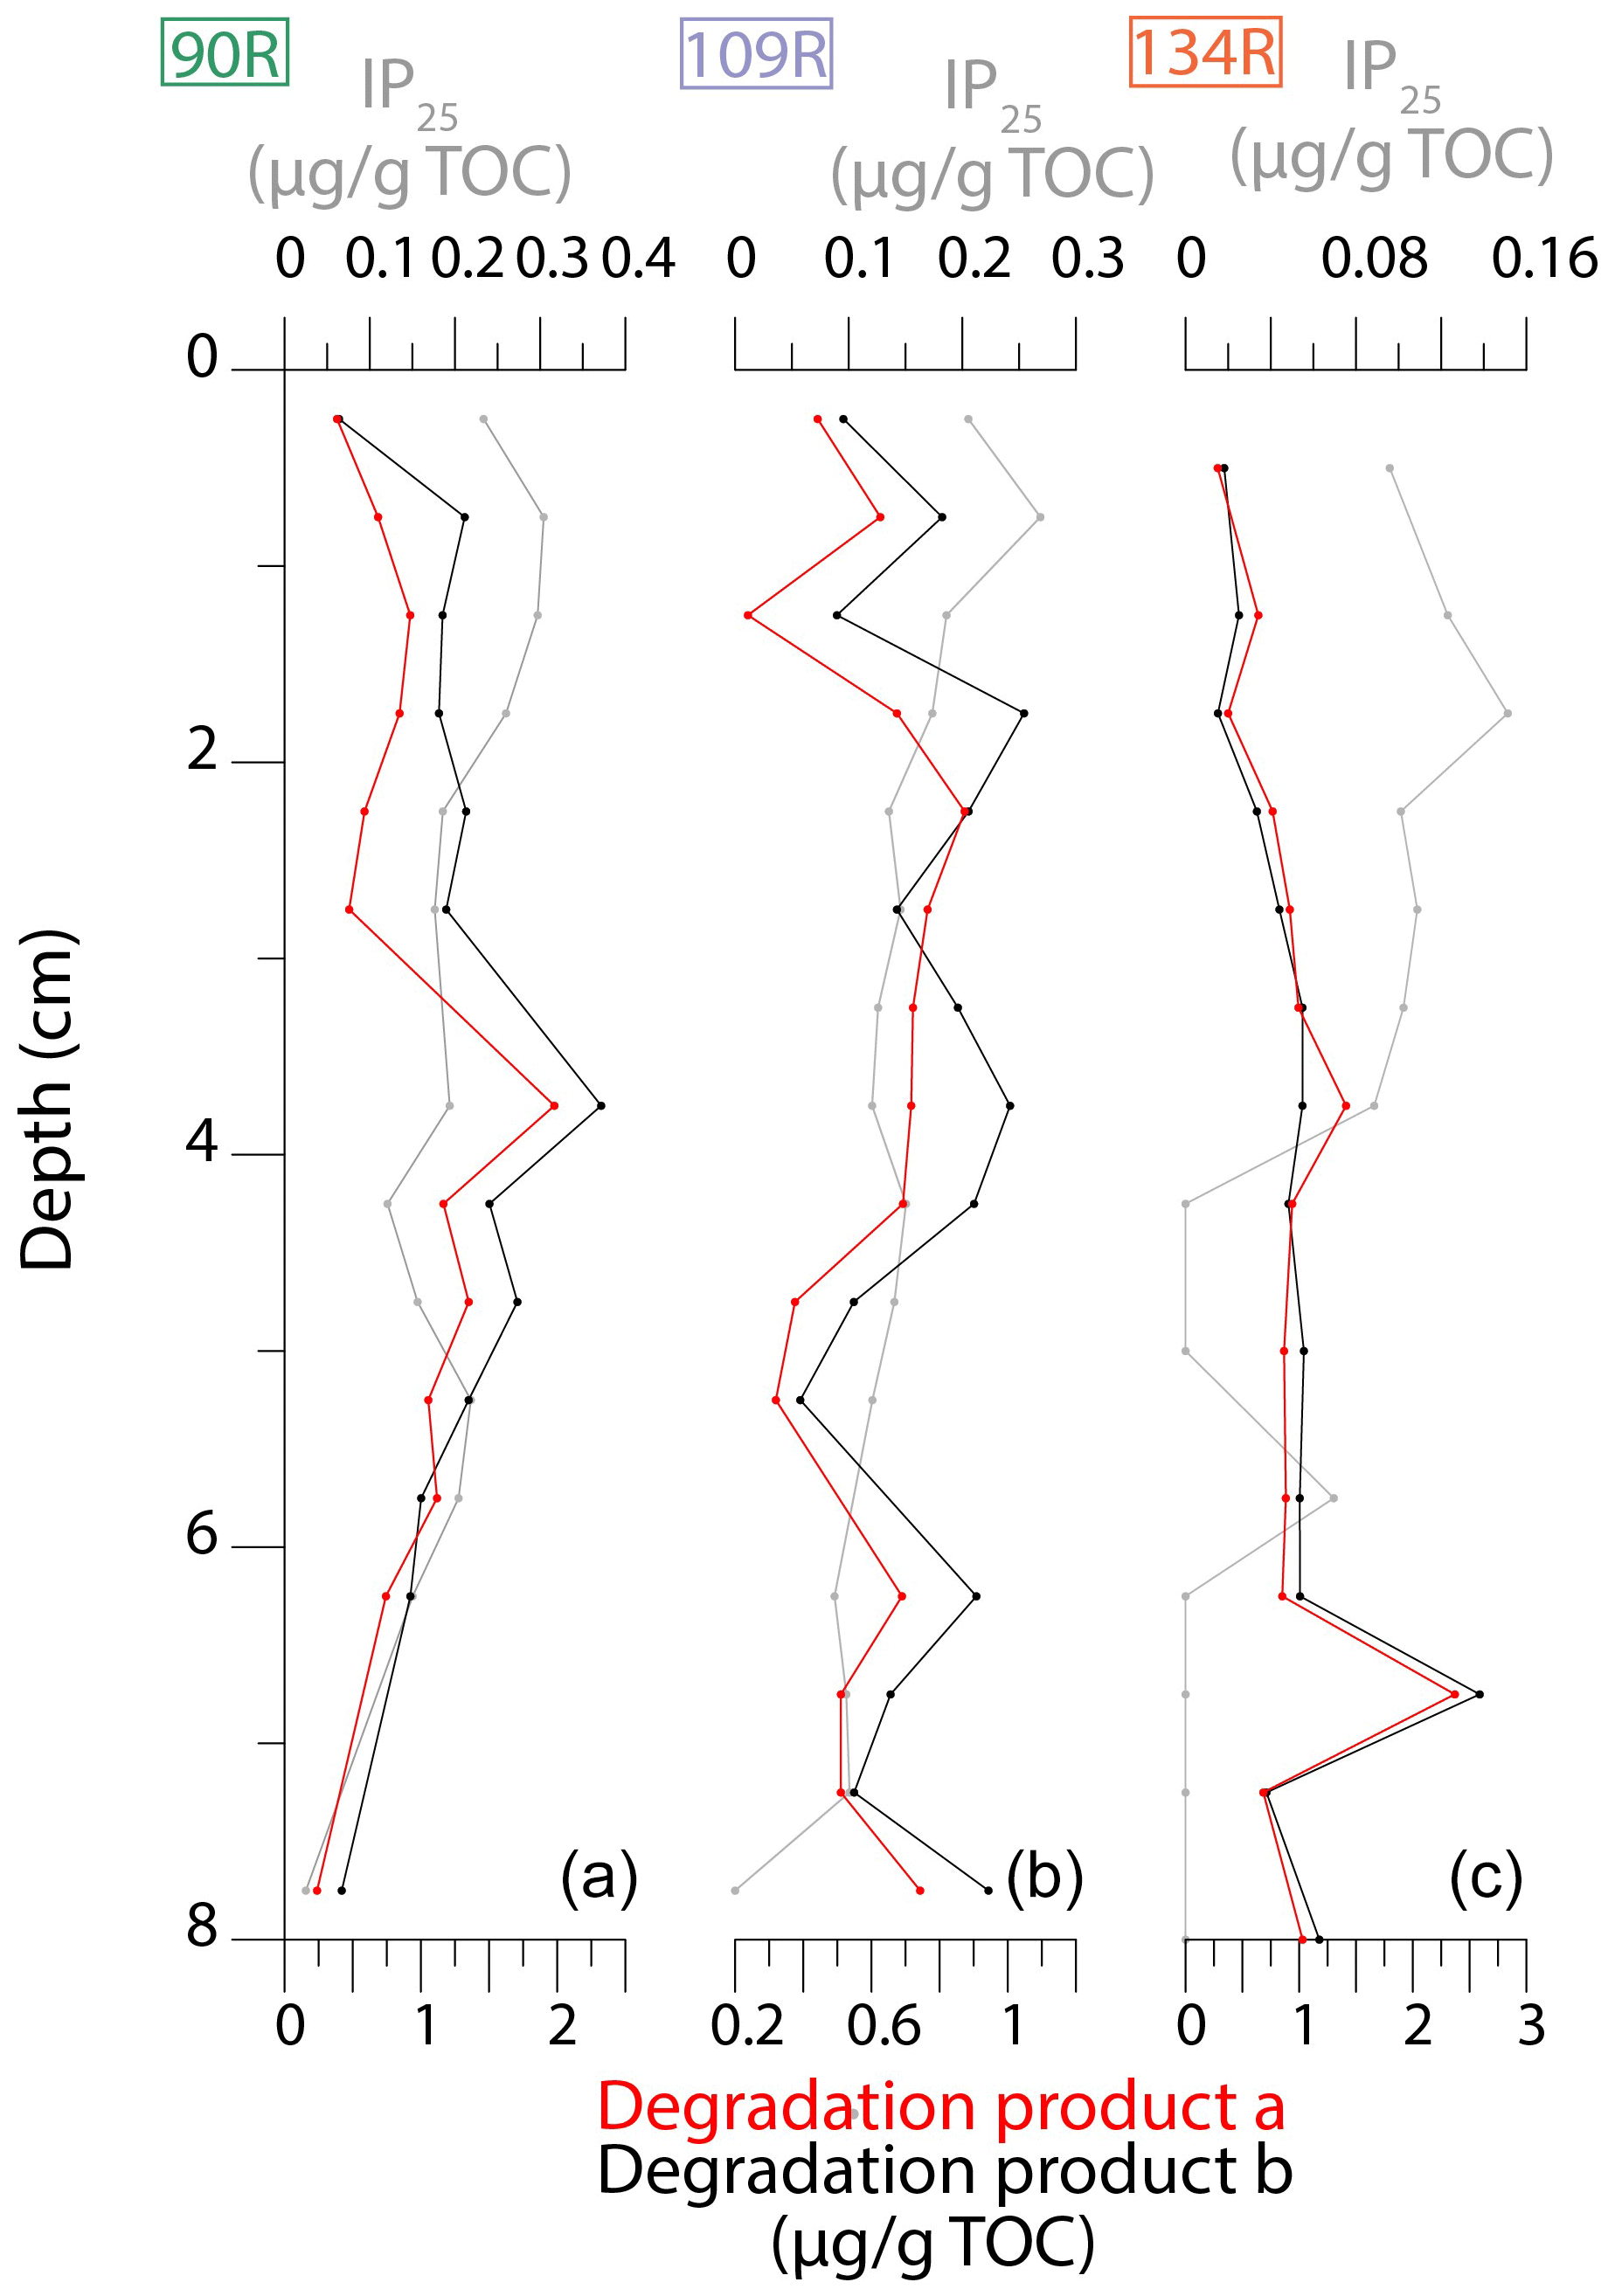
Figure 6Downcore (upper 8 cm) plots of IP25 concentrations (grey) and degradation products of IP25: product a (2,6,10,14-tetramethyl-9-(3-methylpent-4-enyl)-pentadecan-2-ol; red) and product b (2,6,10,14-tetramethyl-7-(3-methylpent-4-enyl)-pentadecan-2-ol; black) for 90R (a), 109R (b) and 134R (c).
4.5 Sea-ice concentration observational record
The sea-ice record between 1880 and 2017 CE, based on satellite data and historical observations, provides an overview of sea-ice concentrations at sites 90R, 109R and 134R (Fig. 7; Walsh et al., 2019, 2017). Throughout the entire records, site 134R is consistently characterised by the lowest September sea-ice concentration (56 % on average), while 90R has the most extensive sea-ice concentration (87 % on average), with the sea-ice concentration at 109R of intermediate values (76 % on average).
Change-point analysis, undertaken on the sea-ice concentration data at sites 90R, 109R and 134R, reveals key changes to sea ice throughout the time period (Fig. 7). The main change is identified using this analysis and visual interpretation of the September sea-ice concentration data and the number of years when the monthly sea-ice concentration is >25 %. This occurs at ∼1970 (sites 90R and 109R) and ∼1985 (134R). Between 1900 and 1970 the average September sea-ice concentration at sites 90R and 109R is 91 % and 82 % respectively. Between 1970 and 2017 the average sea-ice concentration is 87 % and 64 % at the same sites. The sea-ice concentration at site 134R is 63 % between 1850 and 1985 and 36 % from 1985 onwards.
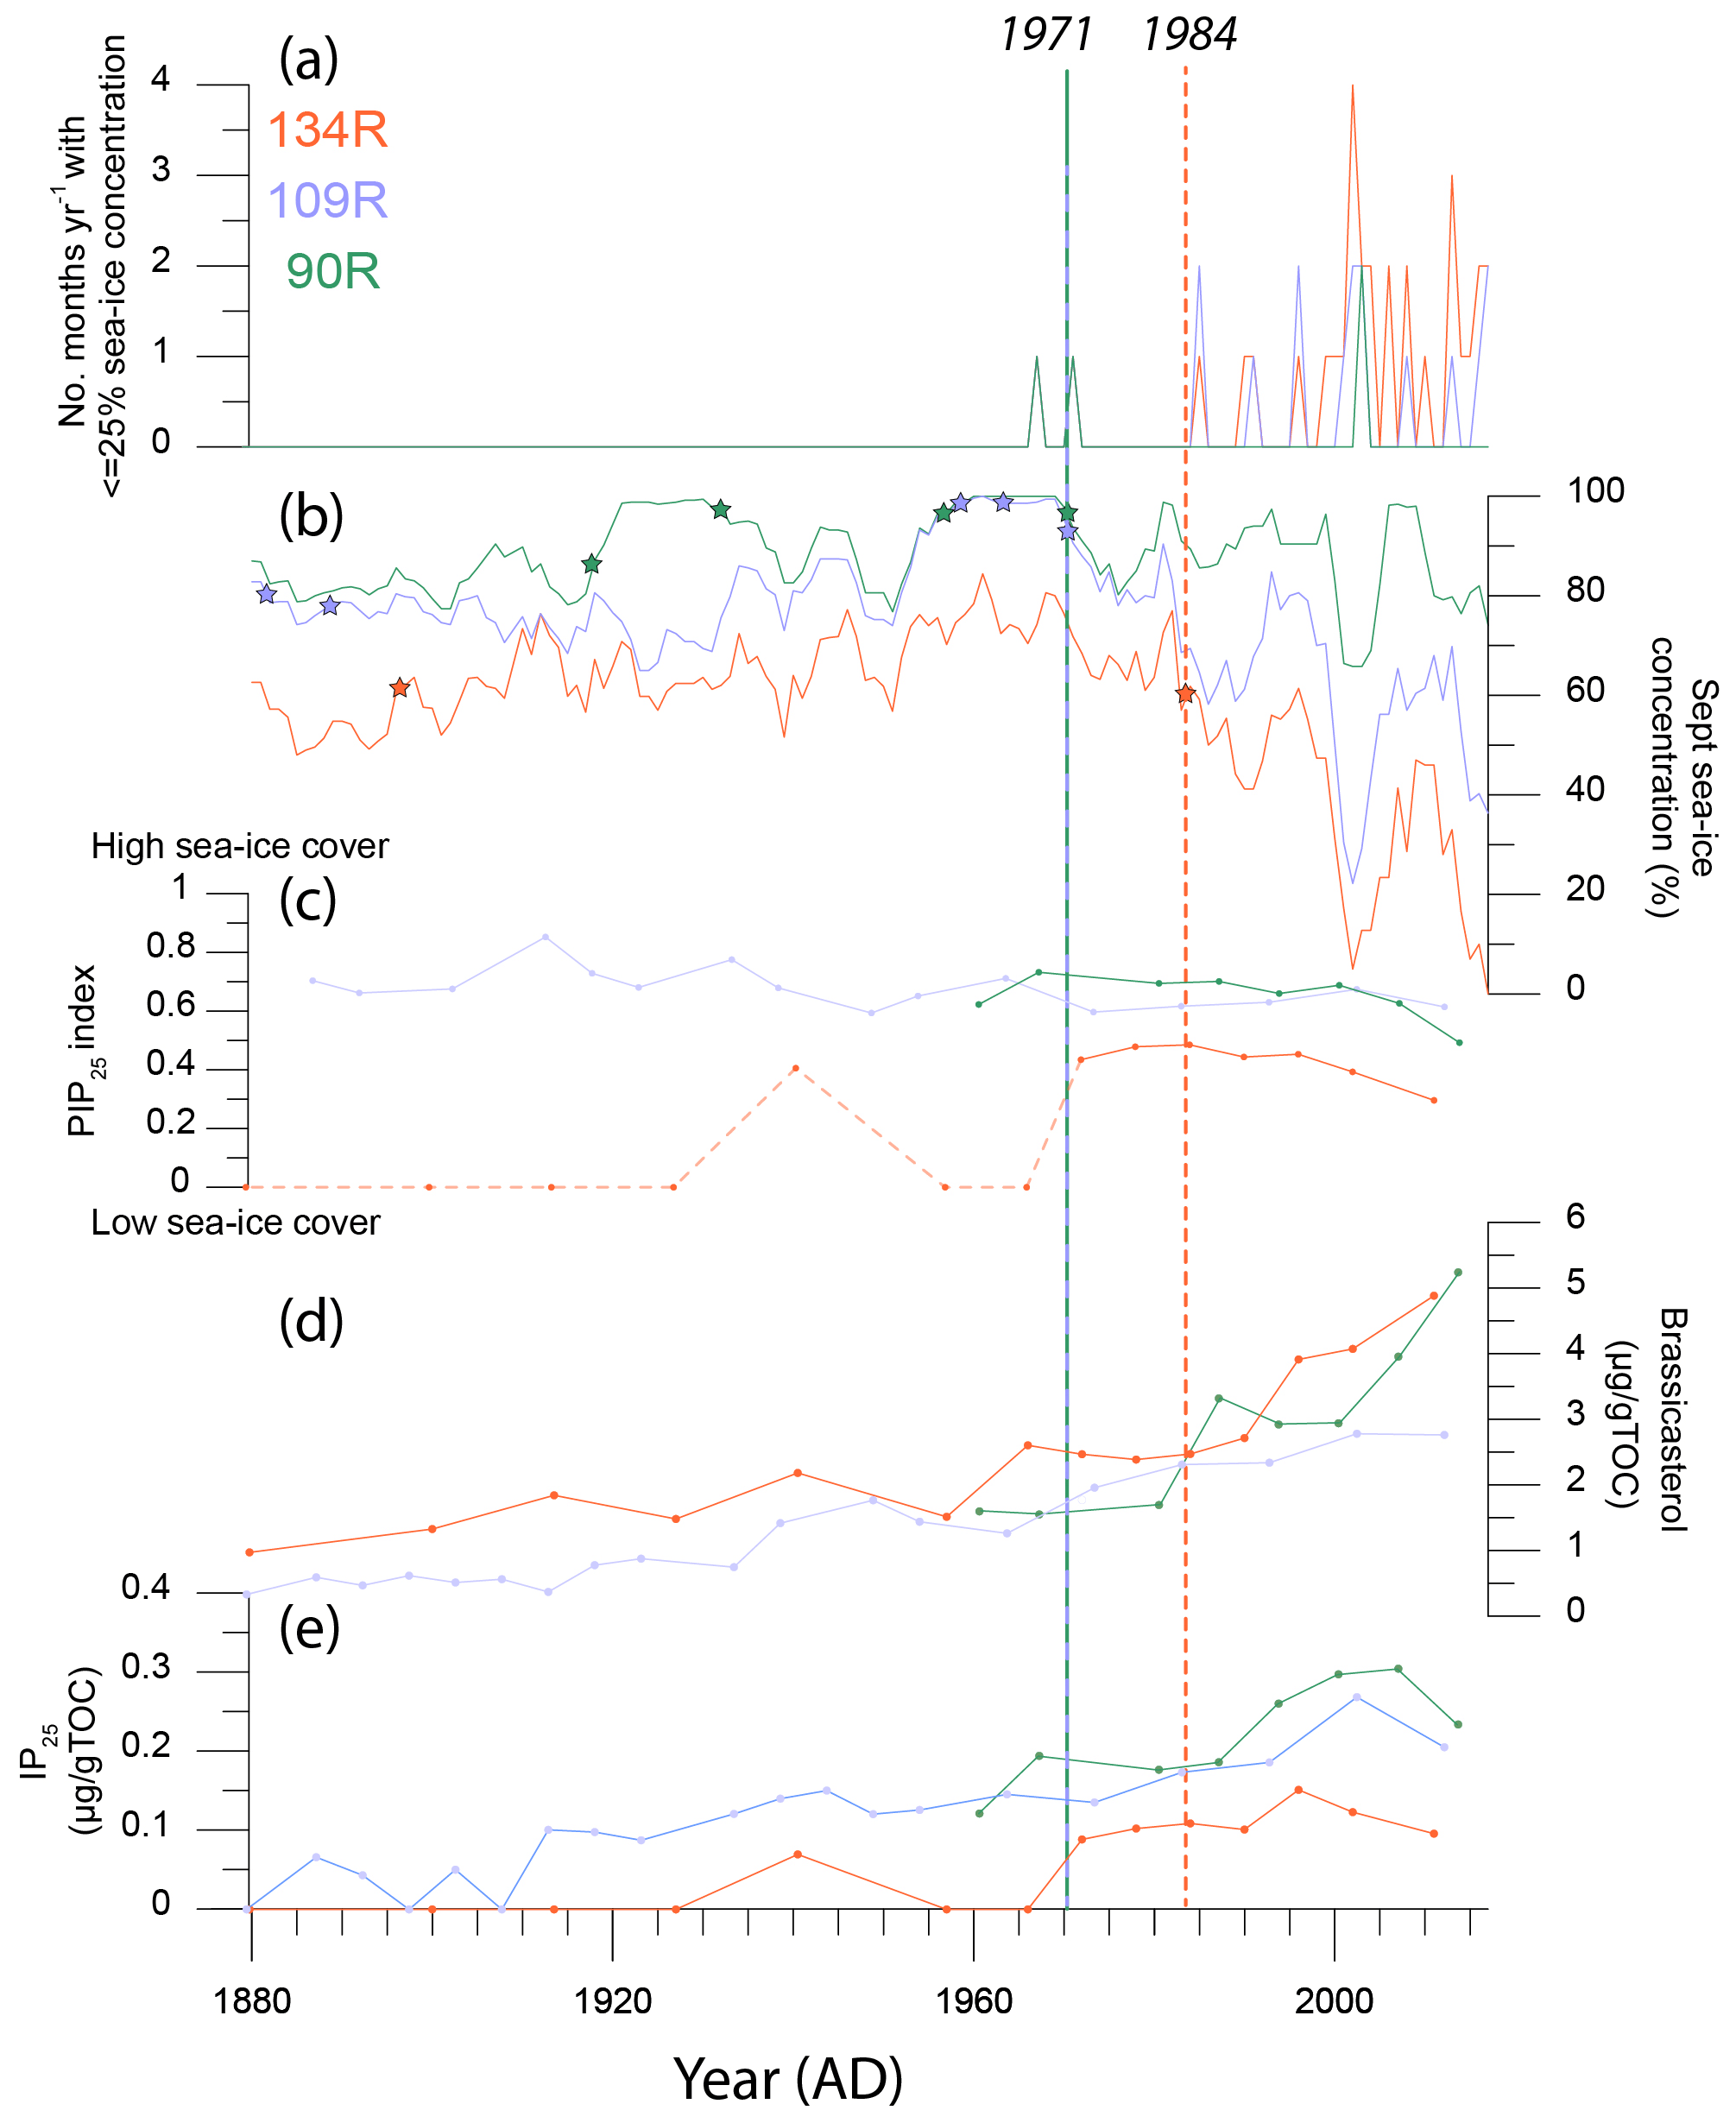
Figure 7Sea-ice data from instrumental and historical records (a–b) and biomarker data (c–e) for cores 90R (green), 109R (purple) and 134R (orange). (a) The number of months with sea-ice concentration ≦25 % for all three core sites. (b) The average September sea-ice concentration for all three sites, with a 5-year running mean applied for each site. All instrumental and historical data (a, b) are extracted from Walsh et al. (2019). (c) The PIP25 index values for all three cores. The early part of the PIP25 record for 134R is marked with a dotted line, as IP25 was absent or too low to be detected. (d) Brassicasterol concentrations and (e) IP25 concentrations. Biomarkers are normalised using total organic carbon (TOC). Due to uncertainty in the age model, biomarker data for core 90R are not included pre-1954 (c–e). Changes in sea-ice concentration, identified using change-point analysis marked with stars for cores 90R (green star), 109R (purple star) and 134R (orange star). Key changes in sea-ice concentration, identified using the change-point analyses and visual interpretation of sea-ice data (a, b), are marked with a dashed vertical line and labelled for sites 90R (green), 109R (purple) and 134R (orange).
5.1 Record uncertainty
Prior to the discussion of biomarker-based sea-ice reconstructions of the Northeast Greenland continental shelf area, it is necessary to assess uncertainty within these records; specifically, issues relating to age constraint, bioturbation and reworking of material, and the degradation of biomarkers in the redox sedimentary boundary layer.
5.1.1 Chronology
Sedimentation rates from the upper sediments of nearby cores, which are located in or in close proximity to our transect in the Belgica Trough are as follows: 0.004 cm yr−1 (Lloyd et al., 2023), 0.05 cm yr−1 (Syring et al., 2020a) and 0.009 yr−1 (Davies et al., 2022). Sedimentation rates in cores 90R, 109R and 134R are within the same range as these cores, but generally higher: ranging from 0.04–0.08, 0.05–0.1 and around 0.05 cm yr−1 respectively. The relatively slow sedimentation rates at these sites mean that each sediment sample encapsulates more than 1 year of sea-ice cover: in the upper sediments, the sampling resolution of 0.5 cm corresponds to between 6 and 10 years per sample. Thus, the changes in biomarker and sterol data will not directly reflect high-resolution patterns captured in the instrumental data.
Whilst CT scans from nearby gravity core DA17-ST0-092G (Davies et al., 2022) and other cores from the Belgica Trough (López-Quirós et al., 2024) reveal bioturbation in the upper sediments, the steady decline in 210PbCs and Hg in sediment cores 109R and 134R suggests that reworking is not affecting the chronology to a large extent. However, there is a reversal of the otherwise steady downwards decline in Hg concentrations in core 90R at around 7.25 cm, where concentrations rise again. This is potentially caused by reworking or input of terrigenous material, which could also explain the peaks in some sterol biomarkers, including terrestrially sourced sterols (sitosterol and campesterol). At this depth, the fine-grained sediments and water content decrease, as the sand content increases (Fig. S2).
Uncertainty within the age models of these cores also stems from the fact that each is based on only two (90R: 2017 and 1954) or three tie points (109R and 134R: 2017, 1954 and 1900). This means that a direct comparison with instrumental data may represent different time periods. Thus, only the general trends are considered.
5.1.2 Degradation of biomarkers
The relative stability of IP25, compared to other phytoplanktonic lipids, makes it an attractive proxy for sea-ice reconstructions on longer timescales (Clotten et al., 2019, 2018; Detlef et al., 2023, 2021; Rahaman et al., 2020; Stein et al., 2016), as it most likely reflects sea-ice signals rather than degradation activity (Rontani et al., 2014, 2011). However, near-surface sediment studies often span the redox sedimentary boundary, making diagenetic transformations in these sections more likely (Rontani et al., 2018). Unfortunately, in the Arctic, the core depth levels of biomarkers preserved in the upper sediments frequently coincide with dramatic, either anthropogenically driven changes in sea-ice cover, visible in instrumental data (Meier and Stroeve, 2022), or naturally driven climate-related changes in sea-ice cover (Xiao et al., 2015b). As a result, disentangling diagenetic signals and those driven by anthropogenically and/or naturally driven changes in sea-ice cover are of upmost importance in such studies.
The decline in IP25 downcore in a short record from the Chukchi–Alaskan margin was attributed, in part, to diagenesis (Polyak et al., 2016). However, in many areas the general agreement between short core biomarker records and historical sea-ice data is good, with some sites even showing increases of IP25 with depth (Alonso-García et al., 2013; Andrews et al., 2009; Cormier et al., 2016; Vare et al., 2010), suggesting that preservation here is not an issue. Additionally, whilst IP25 oxidation products were found from cores in the Barrow Strait and Amundsen Gulf in Arctic Canada, indicating some degradation, a negative trend in IP25 concentrations was not visible, implying a dominant sea-ice signal rather than diagenetic transformation (Rontani et al., 2018). This evidence indicates that whilst caution should be applied in short-core studies, near-surface changes in IP25 concentrations do, most likely, reflect sea-ice cover in many instances.
Whilst the general trends of IP25 and brassicasterol in our cores from Northeast Greenland (90R, 109R and 134R) are declining downcore from the surface sediment, there is some evidence that suggests sea-ice cover is driving this pattern, rather than diagenesis. Firstly, there is an increase in IP25 concentrations from the surface sample downcore (in the upper few centimetres) in core 134R and 90R, contrary to a purely degradation-driven signal. Furthermore, a comparison with biomarker data and instrumental records shows a generally good agreement, providing a strong argument against the significant impact of degradation. However, to ascertain these conclusions, we examine other degradation markers, namely the ratio of epibrassicasterol and 24-methylenecholesterol and two autoxidation products of IP25: 2,6,10,14-tetramethyl-9-(3-methylpent-4-enyl)-pentadecan-2-ol (degradation product a) and 2,6,10,14-tetramethyl-7-(3-methylpent-4-enyl)-pentadecan-2-ol (degradation product b).
An increase in the ratio of epibrassicasterol and 24-methylenecholesterol (Bra 24-Me), together with a decreasing IP25 concentrations downcore, has previously been used to identify autoxidation processes, which cause the degradation of IP25 in near-surface sediments (Rontani et al., 2018). From the sediment surface, there is a general decline in the concentration of IP25 downcore in 90R, 109R and 134R. At the same time, the ratio of Bra 24-Me increases slightly in 90R but stays relatively stable in 134R. In contrast, the Bra 24-Me ratio generally increases downcore in 109R (0.25 to 3.75 cm; Fig. 5). This suggests that degradation processes may be contributing to the decline in IP25 downcore in 109R, yet it is unlikely in 90R and 134R. Collectively, we argue that this evidence indicates that sea-ice cover is the primary driver of changes in IP25 concentrations in cores 90R and 134R from Northeast Greenland. However, oxidation processes may be contributing to the decline in IP25 from the sediment surface in core 109R. Similarly, comparison between IP25 concentrations and the autoxidation products of IP25 does not suggest that degradation is affecting the sediment cores significantly in cores 134R and 90R.
5.2 Sea-ice conditions
5.2.1 Northwest to southeast transect
Surface sample concentrations of IP25 are 0.233, 0.205 and 0.096 µg g−1 TOC (or 0.0024, 0.002 and 0.0013 µg g−1 sediment) for 90R, 109R and 134R respectively. This reflects the current sea-ice conditions in the region, with more extensive sea ice located at the inner shelf (90R) and reduced ice cover at the outer shelf (134R). Overall, these are much lower than seen in previous surface sample measurements, using the same internal standards, from the Belgica Trough, which vary from 3.31 to 23.44 µg g−1 TOC (or 0.016 to 0.043 µg g−1 sediment) (Kolling et al., 2020). We argue that this may be attributed to the storage of sediments (e.g. frozen vs. cooled), where biomarkers may have degraded over time in our sediment samples stored in the refrigerator. It is also possible that the very upper sediments were disturbed or missing, despite an intact surface being visible at the time of collection. However, the pattern is still similar to our sites, with lower values generally located on the outer shelf and higher values at the coastal sites (Kolling et al., 2020). Concentrations of brassicasterol in the surface samples from this study are 5.23, 2.77 and 4.89 µg g−1 TOC (or are 0.053, 0.032 and 0.065 µg g−1 sediment) for 90R, 109R and 134R. Brassicasterol concentrations from samples located nearby are much higher, with values ranging from 10.81 to 68.88 µg g−1 TOC (or 0.094 to 0.34 µg g−1 sediment), and the higher values are generally located on the outer shelf (Kolling et al., 2020). Again, the differences may be attributed to the storage of sediments after collection.
The PIP25 values for site 134R are lower than 90R and 109R throughout the entire study period. This broadly aligns with observational sea-ice records, which indicate less extensive sea-ice cover at this site from 1880 to 2017 compared to more coastal locations. The PIP25 values for 90R and 109R are, on the other hand, more similar, despite observational data showing that sea-ice cover is generally lower at 109R.
Whilst the PIP25 index provides a useful way to assess see-ice cover, it is important to consider individual biomarkers as well; thus, we examine the biplots of IP25 and sterols (Fig. 4). The positive correlations between IP25 and brassicasterol and between IP25 and dinosterol at all three sites (Fig. 4) can best be explained by the fact that under more extreme sea-ice conditions, both biomarkers show low values but with decreasing sea ice, indicating more open-water and ice-edge conditions. Furthermore, both biomarker concentrations increase as open-water production and sea-ice-algae production increase, implying a decrease in sea-ice cover.
Early in the 90R record (5.75 cm core depth; sometime before 1954 as the age constraint is uncertain here), there is a peak in brassicasterol, dinosterol and campesterol, together with a slightly higher IP25 concentration. However, uncertainty in the age constraint in this section of the core should be considered; this is discussed in detail in Sect. 5.1.1. The high sterol concentrations in the lower part of 90R suggest that the inner Belgica Trough may have been characterised by open-water conditions with some seasonal sea-ice cover. Such elevated concentrations of IP25 and the open-water phytoplankton biomarkers are typical of polynya situations (see Stein et al., 2017; Syring et al., 2020a). In contrast, at site 109R, all sterol and IP25 concentrations are lower during this period, resulting in a higher PIP25 index value. The evidence that IP25 and the open-water phytoplankton biomarkers are very low or absent suggests more extensive to permanent sea-ice cover in this area (cf. Müller et al., 2011). Considering these results, we suggest the presence of a regional polynya-like feature in the innermost Belgica Trough (90R), sometime before 1954. Such findings are not visible in the historical data during this period. As these data come from historical records and use spatial analogue gap filling (Walsh et al., 2019), it is unlikely that such a feature would be captured this early within the observational record.
Well-defined polynyas, or areas of open water, are common features in the transitional ice zone between the landfast sea ice and the pack ice (Pedersen et al., 2010). Several polynyas are currently forming along the coast of Northeast Greenland: the NEW polynya, the Sirius Water polynya, the Scoresby Sund water polynya, the Store Koldewey polynya, and a polynya located south of Île-de-France (Sørensen, 2012). These polynyas are formed by the presence of landfast sea ice, together with ocean currents and katabatic winds (Schneider and Budéus, 1994; Pedersen et al., 2010). Biomarker evidence from 90R, together with existing polynyas along the east coast of Greenland, suggests that a polynya-like feature could have formed to the east of Norske Øer, which has also been proposed in a Holocene sea-ice biomarker record obtained from nearby core PS93/025 (Syring et al., 2020a; for core location, see Fig. 1).
5.2.2 Temporal changes in sea-ice conditions
The presence of IP25 in most of the samples in 90R and 109R suggests that areas of open water have been present, during at least part of the year, for the last ∼130 years in the coastal and mid-part of the Belgica Trough. In the early part of the record, the concentration of IP25 and brassicasterol is generally stable, with some small fluctuations. This aligns with the observational record, which shows a similar pattern.
IP25 is absent or only present in very low concentrations in the lower part of 134R. Together with the presence of brassicasterol, this results in low PIP25 values and indicates the absence of periods of open water. This differs from the observational and instrumental data for sea-ice concentrations in this region, with an average of 59 %, during the same time period (1880–1920). However, it should also be noted that the absence of IP25 may be a result of other factors: (1) lack of or only few diatoms in the sea ice, (2) removal of algae in the water column by grazing, and (3) degradation in the water column and sediments (Belt, 2018). Thus, one of the aforementioned reasons may be the reason behind the discrepancy between instrumental data and our reconstructions in the earlier parts of the record in core 134R.
The general increase in IP25 and brassicasterol at sites 109R and 90R from ∼1970 suggests a shift towards more seasonal sea-ice cover and open-water conditions. This aligns with results from the change-point analysis of observational data; ∼1970 represents a significant change in sea-ice cover at site 90R with values generally declining from 0.7 (1967) to 0.5 (2014) and a noticeably steeper decline from 1994. Change-point analysis for sea-ice cover at site 134R reveals a slightly later change in ∼1985. From ∼1985, the decline in sea-ice cover reconstructed using the PIP25 index for 134R aligns with the patterns in instrumental records; values decline from 0.65 (∼1985) to 0.4 (∼2010). The PIP25 values during this period are more stable at 109R, not reflecting the observational record.
The declining sea-ice concentrations since the 1970–1980 period, found in our data from sites 90R, 109R and 134R, are likely linked to the ongoing Atlantification, characterised as significant warming (1 °C) and shoaling of Atlantic Water. This has been observed across the Northeast Greenland continental shelf in recent decades (Gjelstrup et al., 2022). In the Belgica Trough, CTD records indicate a warming of 0.5 °C of Atlantic Waters between 2000 and 2016, relative to 1979–1999 (Schaffer et al., 2017). This has implications for both marine-terminating glaciers (Wekerle et al., 2024) and sea ice, including the NØIB, via enhanced melting from below (Gjelstrup et al., 2022; Sneed and Hamilton, 2016). Observations suggest that there was more summer sea ice melt in the 2000s compared to the 1990s, leading to the freshening of surface waters (Gjelstrup et al., 2022).
High-resolution biomarker data (IP25, PIP25, brassicasterol and Bra 24-Me) from three marine sediment cores collected from a transect, spanning the inner to outer Belgica Trough on the Northeast Greenland continental shelf, together with instrumental and historical sea-ice cover data, provide the following conclusions:
-
Uncertainty in the chronological constraint of sediment cores 90R, 109R and 134R, based on 210Pb, 137Cs and Hg concentration data, stems from the limited number of age markers (2–3 points). This makes a direct and statistical comparison with instrumental data difficult; rather, the general trends are assessed. For cores 109R and 134R, the age model is reliable for the time period after 1900, where the earliest age marker is found (210Pb reaches base level). The age constraint prior to 1954 in core 90R is uncertain, due to the increasing concentration of Hg downcore. This is attributed to material reworking or the presence of a turbidite.
-
Degradation of biomarkers is often an issue in the redox sedimentary boundary layer. However, biomarker evidence, specifically the decline in IP25 in the surface sediments and peaks in IP25 in lower parts of the record in 134R, suggests it is less affecting the results here. Furthermore, evidence from the Bra 24-Me ratio and oxidation products of IP25 suggests degradation has not been affecting the biomarkers in the upper sediments in core 90R and 134R; it may have affected 109R to some extent.
-
Historical and satellite data of sea-ice concentration show that site 134R (outer shelf) has been characterised by the lowest September sea-ice concentration, while site 90R (coast proximal) has had the highest sea-ice concentration throughout the entire period covered by these data (1880–2017). In accordance with this, site 90R has been characterised by the highest IP25 values and site 134R with the lowest values throughout our record. This again results in the lowest PIP25 values (least sea ice) at site 134R, with higher values at 90R and 109R (most sea ice) respectively, thus aligning with the observational record from this region throughout this entire period.
-
A decline in sea-ice concentration, visible in the instrumental record, and identified using change-point analysis, begins in about 1970 at sites 109R and 90R. This aligns with increasing brassicasterol and IP25 concentrations in these sediment cores, suggesting a shift to more seasonal sea-ice cover and open-water conditions after ca. 1970. This change occurs later in the outer shelf site of core 134R (1984); this aligns with the sharp increase in brassicasterol and decline in the PIP25 index at this time. This change is likely linked to the ongoing Atlantification and warming of surface waters that have been observed in recent decades.
Data are included in the Supplement and will also be available on PANGAEA.
The supplement related to this article is available online at: https://doi.org/10.5194/tc-18-3415-2024-supplement.
JD, MSS and CP designed this experiment, with the help of RS, KF and HD. MSS led the NorthGreen2017 Expedition. JD carried out formal analysis for sea-ice biomarkers with the help of KF. Funding was acquired by MSS and CP. ACC undertook statistical analysis. MM undertook the analysis for the chronological constraint of all sediment cores. JD prepared the manuscript with valuable contributions from all co-authors.
The contact author has declared that none of the authors has any competing interests.
Publisher’s note: Copernicus Publications remains neutral with regard to jurisdictional claims made in the text, published maps, institutional affiliations, or any other geographical representation in this paper. While Copernicus Publications makes every effort to include appropriate place names, the final responsibility lies with the authors.
We thank the captain, crew and scientists on board the NorthGreen2017 Expedition on RV Dana. We thank Anne de Vernal for help acquiring funding for the NorthGreen2017 Expedition. Particular thanks also go to Walter Luttmer for his expertise and assistance in the biomarker laboratory at Alfred Wegener Institute. Thanks go to Simon Belt and colleagues (Biogeochemistry Research Centre, University of Plymouth, UK) for providing the internal standard for IP25 analysis. We acknowledge the use of imagery from the NASA Worldview application (https://worldview.earthdata.nasa.gov/, last access: 14 June 2023), part of the NASA Earth Observing System Data and Information System (EOSDIS).
The NorthGreen2017 Expedition was funded by the Danish Centre for Marine Research (to Marit-Solveig Seidenkrantz) and the Natural Science and Engineering Research Council of Canada (to Anne de Vernal, Université du Québec à Montréal, Canada). The research was funded by the Independent Research Fund Denmark (grant nos. 7014-00113B (G-Ice) and 0135-00165B (GreenShelf) to Marit-Solveig Seidenkrantz) and by the iClimate Centre of Aarhus University, with additional funding from the European Union's Horizon 2020 research and innovation programme (grant no. 869383) (ECOTIP) and the Horizon Europe research and innovation programme (grant no. 101136380) (SEA-Quester).
This paper was edited by Sebastian Gerland and reviewed by Florence Fetterer and one anonymous referee.
Alonso-García, M., Andrews, J. T., Belt, S. T., Cabedo-Sanz, P., Darby, D., and Jaeger, J.: A comparison between multiproxy and historical data (ad 1990–1840) of drift ice conditions on the East Greenland Shelf (∼ 66° N), Holocene, 23, 1672–1683, https://doi.org/10.1177/0959683613505343, 2013.
AMAP: Snow, water, ice and permafrost in the Arctic (SWIPA): Climate change and the cryosphere. Scientific report, Arctic Monitoring and Assessment Programme (AMAP), Gaustadalleen 21, N-0349 Oslo, Norway, https://www.amap.no (last access: 12 June 2024), 2011.
Andreasen, N., Jackson, R., Rudra, A., Nøhr-Hansen, H., Sanei, H., Bojesen-Koefoed, J., Seidenkrantz, M.-S., Pearce, C., Thibault, N., and Ribeiro, S.: From land to sea: provenance, composition, and preservation of organic matter in a marine sediment record from the North-East Greenland shelf spanning the Younger Dryas–Holocene, Boreas, 52, 459–475, https://doi.org/10.1111/bor.12630, 2023.
Andrews, J. T., Darby, D., Eberle, D., Jennings, A. E., Moros, M., and Ogilvie, A.: A robust, multisite Holocene history of drift ice off northern Iceland: implications for North Atlantic climate, Holocene, 19, 71–77, https://doi.org/10.1177/0959683608098953, 2009.
Årthun, M., Onarheim, I. H., Dörr, J., and Eldevik, T.: The Seasonal and Regional Transition to an Ice-Free Arctic, Geophys. Res. Lett., 48, e2020GL090825, https://doi.org/10.1029/2020GL090825, 2021.
Belt, S. T.: Source-specific biomarkers as proxies for Arctic and Antarctic sea ice, Org. Geochem., 125, 277–298, https://doi.org/10.1016/j.orggeochem.2018.10.002, 2018.
Belt, S. T.: What do IP25 and related biomarkers really reveal about sea ice change?, Quaternary Sci. Rev., 204, 216–219, https://doi.org/10.1016/j.quascirev.2018.11.025, 2019.
Belt, S. T. and Müller, J.: The Arctic sea ice biomarker IP25: a review of current understanding, recommendations for future research and applications in palaeo sea ice reconstructions, Quaternary Sci. Rev., 79, 9–25, https://doi.org/10.1016/j.quascirev.2012.12.001, 2013.
Belt, S. T., Massé, G., Rowland, S. J., Poulin, M., Michel, C., and LeBlanc, B.: A novel chemical fossil of palaeo sea ice: IP25, Org. Geochem., 38, 16–27, https://doi.org/10.1016/j.orggeochem.2006.09.013, 2007.
Belt, S. T., Brown, T. A., Ringrose, A. E., Cabedo-Sanz, P., Mundy, C. J., Gosselin, M., and Poulin, M.: Quantitative measurement of the sea ice diatom biomarker IP25 and sterols in Arctic sea ice and underlying sediments: Further considerations for palaeo sea ice reconstruction, Org. Geochem., 62, 33–45, https://doi.org/10.1016/j.orggeochem.2013.07.002, 2013.
Belt, S. T., Cabedo-Sanz, P., Smik, L., Navarro-Rodriguez, A., Berben, S. M. P., Knies, J., and Husum, K.: Identification of paleo Arctic winter sea ice limits and the marginal ice zone: Optimised biomarker-based reconstructions of late Quaternary Arctic sea ice, Earth Planet. Sc. Lett., 431, 127–139, https://doi.org/10.1016/j.epsl.2015.09.020, 2015.
Boon, J. J., Rijpstra, W. I. C., De Lange, F., De Leeuw, J. W., Yoshioka, M., and Shimizu, Y.: Black Sea sterol–a molecular fossil for dinoflagellate blooms, Nature, 277, 125–127, https://doi.org/10.1038/277125a0, 1979.
Clotten, C., Stein, R., Fahl, K., and De Schepper, S.: Seasonal sea ice cover during the warm Pliocene: Evidence from the Iceland Sea (ODP Site 907), Earth Planet. Sc. Lett., 481, 61–72, https://doi.org/10.1016/j.epsl.2017.10.011, 2018.
Clotten, C., Stein, R., Fahl, K., Schreck, M., Risebrobakken, B., and De Schepper, S.: On the causes of Arctic sea ice in the warm Early Pliocene, Sci. Rep., 9, 989, https://doi.org/10.1038/s41598-018-37047-y, 2019.
Cormier, M.-A., Rochon, A., de Vernal, A., and Gélinas, Y.: Multi-proxy study of primary production and paleoceanographical conditions in northern Baffin Bay during the last centuries, Mar. Micropaleontol., 127, 1–10, https://doi.org/10.1016/j.marmicro.2016.07.001, 2016.
Davies, J., Mathiasen, A. M., Kristiansen, K., Hansen, K. E., Wacker, L., Alstrup, A. K. O., Munk, O. L., Pearce, C., and Seidenkrantz, M.-S.: Linkages between ocean circulation and the Northeast Greenland Ice Stream in the Early Holocene, Quaternary Sci. Rev., 286, 107530, https://doi.org/10.1016/j.quascirev.2022.107530, 2022.
Detlef, H., Reilly, B., Jennings, A., Mørk Jensen, M., O'Regan, M., Glasius, M., Olsen, J., Jakobsson, M., and Pearce, C.: Holocene sea-ice dynamics in Petermann Fjord in relation to ice tongue stability and Nares Strait ice arch formation, The Cryosphere, 15, 4357–4380, https://doi.org/10.5194/tc-15-4357-2021, 2021.
Detlef, H., O'Regan, M., Stranne, C., Jensen, M. M., Glasius, M., Cronin, T. M., Jakobsson, M., and Pearce, C.: Seasonal sea-ice in the Arctic's last ice area during the Early Holocene, Commun. Earth Environ., 4, 1–11, https://doi.org/10.1038/s43247-023-00720-w, 2023.
de Vernal, A., Gersonde, R., Goosse, H., Seidenkrantz, M.-S., and Wolff, E. W.: Sea ice in the paleoclimate system: the challenge of reconstructing sea ice from proxies – an introduction, Quaternary Sci. Rev., 79, 1–8, https://doi.org/10.1016/j.quascirev.2013.08.009, 2013.
Divine, D. V. and Dick, C.: Historical variability of sea ice edge position in the Nordic Seas, J. Geophys. Res.-Oceans, 111, 1–14, https://doi.org/10.1029/2004JC002851, 2006.
Fahl, K. and Stein, R.: Modern seasonal variability and deglacial/Holocene change of central Arctic Ocean sea-ice cover: New insights from biomarker proxy records, Earth Planet. Sc. Lett., 351–352, 123–133, https://doi.org/10.1016/j.epsl.2012.07.009, 2012.
Fahnestock, M., Abdalati, W., Joughin, I., Brozena, J., and Gogineni, P.: High Geothermal Heat Flow, Basal Melt, and the Origin of Rapid Ice Flow in Central Greenland, Science, 294, 2338–2342, https://doi.org/10.1126/science.1065370, 2001.
Georgiadis, E., Giraudeau, J., Jennings, A., Limoges, A., Jackson, R., Ribeiro, S., and Massé, G.: Local and regional controls on Holocene sea ice dynamics and oceanography in Nares Strait, Northwest Greenland, Mar. Geol., 422, 106115, https://doi.org/10.1016/j.margeo.2020.106115, 2020.
Gjelstrup, C. V. B., Sejr, M. K., de Steur, L., Christiansen, J. S., Granskog, M. A., Koch, B. P., Møller, E. F., Winding, M. H. S., and Stedmon, C. A.: Vertical redistribution of principle water masses on the Northeast Greenland Shelf, Nat. Commun., 13, 7660, https://doi.org/10.1038/s41467-022-35413-z, 2022.
Higgins, A. K.: North Greenland ice islands, Polar Record, 25, 207–212, https://doi.org/10.1017/S0032247400010809, 1989.
Huang, W.-Y. and Meinschein, W. G.: Sterols as ecological indicators, Geochim. Cosmochim. Ac., 43, 739–745, https://doi.org/10.1016/0016-7037(79)90257-6, 1979.
Hughes, N. E., Wilkinson, J. P., and Wadhams, P.: Multi-satellite sensor analysis of fast-ice development in the Norske Øer Ice Barrier, northeast Greenland, Ann. Glaciol., 52, 151–160, https://doi.org/10.3189/172756411795931633, 2011.
Hvidberg, C. S., Grinsted, A., Dahl-Jensen, D., Khan, S. A., Kusk, A., Andersen, J. K., Neckel, N., Solgaard, A., Karlsson, N. B., Kjær, H. A., and Vallelonga, P.: Surface velocity of the Northeast Greenland Ice Stream (NEGIS): assessment of interior velocities derived from satellite data by GPS, The Cryosphere, 14, 3487–3502, https://doi.org/10.5194/tc-14-3487-2020, 2020.
Jackson, R., Kvorning, A. B., Limoges, A., Georgiadis, E., Olsen, S. M., Tallberg, P., Andersen, T. J., Mikkelsen, N., Giraudeau, J., Massé, G., Wacker, L., and Ribeiro, S.: Holocene polynya dynamics and their interaction with oceanic heat transport in northernmost Baffin Bay, Sci. Rep., 11, 10095, https://doi.org/10.1038/s41598-021-88517-9, 2021.
Kapsch, M.-L., Graversen, R. G., Tjernström, M., and Bintanja, R.: The Effect of Downwelling Longwave and Shortwave Radiation on Arctic Summer Sea Ice, J. Climate, 29, 1143–1159, https://doi.org/10.1175/JCLI-D-15-0238.1, 2016.
Khan, S. A., Kjær, K. H., Bevis, M., Bamber, J. L., Wahr, J., Kjeldsen, K. K., Bjørk, A. A., Korsgaard, N. J., Stearns, L. A., van den Broeke, M. R., Liu, L., Larsen, N. K., and Muresan, I. S.: Sustained mass loss of the northeast Greenland ice sheet triggered by regional warming, Nat. Clim. Change, 4, 292–299, https://doi.org/10.1038/nclimate2161, 2014.
Khan, S. A., Choi, Y., Morlighem, M., Rignot, E., Helm, V., Humbert, A., Mouginot, J., Millan, R., Kjær, K. H., and Bjørk, A. A.: Extensive inland thinning and speed-up of Northeast Greenland Ice Stream, Nature, 611, 727–732, https://doi.org/10.1038/s41586-022-05301-z, 2022.
Killick, R., Beaulieu, C., Taylor, S., and Hullait, H.: Envcpt: Detection of structural changes in climate and environment time series, r package version 1.1.3., https://cran.r-project.org/web/packages/EnvCpt/index.html (last access: 16 August 2023), 2021.
Kim, J.-H., Gal, J.-K., Jun, S.-Y., Smik, L., Kim, D., Belt, S. T., Park, K., Shin, K.-H., and Nam, S.-I.: Reconstructing spring sea ice concentration in the Chukchi Sea over recent centuries: insights into the application of the PIP25 index, Environ. Res. Lett., 14, 125004, https://doi.org/10.1088/1748-9326/ab4b6e, 2019.
Koch, L.: The East Greenland Ice, C. A. Reitzel, 373 pp., 1945.
Kolling, H. M., Stein, R., Fahl, K., Perner, K., and Moros, M.: Short-term variability in late Holocene sea ice cover on the East Greenland Shelf and its driving mechanisms, Palaeogeogr. Palaeocl., 485, 336–350, https://doi.org/10.1016/j.palaeo.2017.06.024, 2017.
Kolling, H. M., Stein, R., Fahl, K., Sadatzki, H., de Vernal, A., and Xiao, X.: Biomarker Distributions in (Sub)-Arctic Surface Sediments and Their Potential for Sea Ice Reconstructions, Geochem. Geophy. Geosy., 21, e2019GC008629, https://doi.org/10.1029/2019GC008629, 2020.
Lloyd, J. M., Ribeiro, S., Weckström, K., Callard, L., Ó Cofaigh, C., Leng, M. J., Gulliver, P., and Roberts, D. H.: Ice-ocean interactions at the Northeast Greenland Ice stream (NEGIS) over the past 11,000 years, Quaternary Sci. Rev., 308, 108068, https://doi.org/10.1016/j.quascirev.2023.108068, 2023.
López-Quirós, A., Junna, T., Davies, J., Andresen, K. J., Nielsen, T., Haghipour, N., Wacker, L., Olsen Alstrup, A. K., Munk, O. L., Rasmussen, T. L., Pearce, C., and Seidenkrantz, M.-S.: Retreat patterns and dynamics of the former Norske Trough ice stream (NE Greenland): An integrated geomorphological and sedimentological approach, Quaternary Sci. Rev., 325, 108477, https://doi.org/10.1016/j.quascirev.2023.108477, 2024.
Massé, G., Rowland, S. J., Sicre, M.-A., Jacob, J., Jansen, E., and Belt, S. T.: Abrupt climate changes for Iceland during the last millennium: Evidence from high resolution sea ice reconstructions, Earth Planet. Sc. Lett., 269, 565–569, https://doi.org/10.1016/j.epsl.2008.03.017, 2008.
Mayer, C., Schaffer, J., Hattermann, T., Floricioiu, D., Krieger, L., Dodd, P. A., Kanzow, T., Licciulli, C., and Schannwell, C.: Large ice loss variability at Nioghalvfjerdsfjorden Glacier, Northeast-Greenland, Nat. Commun., 9, 2768, https://doi.org/10.1038/s41467-018-05180-x, 2018.
Meier, W. N. and Stroeve, J.: An Updated Assessment of the Changing Arctic Sea Ice Cover, Oceanography, 35, 10–19, 2022.
Moros, M., Andersen, T. J., Schulz-Bull, D., Häusler, K., Bunke, D., Snowball, I., Kotilainen, A., Zillén, L., Jensen, J. B., Kabel, K., Hand, I., Leipe, T., Lougheed, B. C., Wagner, B., and Arz, H. W.: Towards an event stratigraphy for Baltic Sea sediments deposited since AD 1900: approaches and challenges, Boreas, 46, 129–142, https://doi.org/10.1111/bor.12193, 2017.
Mouginot, J., Rignot, E., Scheuchl, B., Fenty, I., Khazendar, A., Morlighem, M., Buzzi, A., and Paden, J.: Fast retreat of Zachariæ Isstrøm, northeast Greenland, Science, 350, 1357–1361, https://doi.org/10.1126/science.aac7111, 2015.
Müller, J., Wagner, A., Fahl, K., Stein, R., Prange, M., and Lohmann, G.: Towards quantitative sea ice reconstructions in the northern North Atlantic: A combined biomarker and numerical modelling approach, Earth Planet. Sc. Lett., 306, 137–148, https://doi.org/10.1016/j.epsl.2011.04.011, 2011.
Müller, J., Werner, K., Stein, R., Fahl, K., Moros, M., and Jansen, E.: Holocene cooling culminates in sea ice oscillations in Fram Strait, Quaternary Sci. Rev., 47, 1–14, https://doi.org/10.1016/j.quascirev.2012.04.024, 2012.
Nagler, T., Rott, H., Hetzenecker, M., Wuite, J., and Potin, P.: The Sentinel-1 Mission: New Opportunities for Ice Sheet Observations, Remote Sens., 7, 9371–9389, https://doi.org/10.3390/rs70709371, 2015.
Navarro-Rodriguez, A., Belt, S. T., Knies, J., and Brown, T. A.: Mapping recent sea ice conditions in the Barents Sea using the proxy biomarker IP25: implications for palaeo sea ice reconstructions, Quaternary Sci. Rev., 79, 26–39, https://doi.org/10.1016/j.quascirev.2012.11.025, 2013.
Nghiem, S. V., Rigor, I. G., Perovich, D. K., Clemente-Colón, P., Weatherly, J. W., and Neumann, G.: Rapid reduction of Arctic perennial sea ice, Geophys. Res. Lett., 34, 1–6, https://doi.org/10.1029/2007GL031138, 2007.
Ogi, M., Yamazaki, K., and Wallace, J. M.: Influence of winter and summer surface wind anomalies on summer Arctic sea ice extent, Geophys. Res. Lett., 37, 1–5, https://doi.org/10.1029/2009GL042356, 2010.
Onarheim, I. H., Eldevik, T., Smedsrud, L. H., and Stroeve, J. C.: Seasonal and Regional Manifestation of Arctic Sea Ice Loss, J. Climate, 31, 4917–4932, https://doi.org/10.1175/JCLI-D-17-0427.1, 2018.
Pedersen, J. B. T., Kaufmann, L. H., Kroon, A., and Jakobsen, B. H.: The Northeast Greenland Sirius Water Polynya dynamics and variability inferred from satellite imagery, Geogr. Tidsskr.-De., 110, 131–142, https://doi.org/10.1080/00167223.2010.10669503, 2010.
Perner, K., Moros, M., Lloyd, J. M., Jansen, E., and Stein, R.: Mid to late Holocene strengthening of the East Greenland Current linked to warm subsurface Atlantic water, Quaternary Sci. Rev., 129, 296–307, https://doi.org/10.1016/j.quascirev.2015.10.007, 2015.
Perner, K., Moros, M., Jansen, E., Kuijpers, A., Troelstra, S. R., and Prins, M. A.: Subarctic Front migration at the Reykjanes Ridge during the mid- to late Holocene: evidence from planktic foraminifera, Boreas, 47, 175–188, https://doi.org/10.1111/bor.12263, 2018.
Perner, K., Moros, M., Otterå, O. H., Blanz, T., Schneider, R. R., and Jansen, E.: An oceanic perspective on Greenland's recent freshwater discharge since 1850, Sci. Rep., 9, 17680, https://doi.org/10.1038/s41598-019-53723-z, 2019.
Perovich, D., Meier, W., Tschudi, M., Hendricks, S., Petty, A. A., Divine, D., Farrell, S., Gerland, S., Haas, C., Kaleschke, L., Pavlova, O., Ricker, R., Tian-Kunze, X., Wood, K., and Webster, M.: Arctic Report Card 2020: Sea Ice, United States, National Oceanic and Atmospheric Administration. Office of Oceanic and Atmospheric Research, Physical Sciences Laboratory (U.S.), Cooperative Institute for Research in the Atmosphere (Fort Collins, Colo.), https://doi.org/10.25923/N170-9H57, 2020.
Pieńkowski, A. J., Gill, N. K., Furze, M. F., Mugo, S. M., Marret, F., and Perreaux, A.: Arctic sea-ice proxies: Comparisons between biogeochemical and micropalaeontological reconstructions in a sediment archive from Arctic Canada, Holocene, 27, 665–682, https://doi.org/10.1177/0959683616670466, 2017.
Polyak, L., Belt, S. T., Cabedo-Sanz, P., Yamamoto, M., and Park, Y.-H.: Holocene sea-ice conditions and circulation at the Chukchi-Alaskan margin, Arctic Ocean, inferred from biomarker proxies, Holocene, 26, 1810–1821, https://doi.org/10.1177/0959683616645939, 2016.
Polyakov, I. V., Alexeev, V. A., Ashik, I. M., Bacon, S., Beszczynska-Möller, A., Carmack, E. C., Dmitrenko, I. A., Fortier, L., Gascard, J.-C., Hansen, E., Hölemann, J., Ivanov, V. V., Kikuchi, T., Kirillov, S., Lenn, Y.-D., McLaughlin, F. A., Piechura, J., Repina, I., Timokhov, L. A., Walczowski, W., and Woodgate, R.: Fate of Early 2000s Arctic Warm Water Pulse, B. Am. Meteor. Soc., 92, 561–566, https://doi.org/10.1175/2010BAMS2921.1, 2011.
Rahaman, W., Smik, L., Köseoğlu, D., N, L., Tarique, M., Thamban, M., Haywood, A., Belt, S. T., and Knies, J.: Reduced Arctic sea ice extent during the mid-Pliocene Warm Period concurrent with increased Atlantic-climate regime, Earth Planet. Sc. Lett., 550, 116535, https://doi.org/10.1016/j.epsl.2020.116535, 2020.
Reeh, N., Thomsen, H. H., Higgins, A. K., and Weidick, A.: Sea ice and the stability of north and northeast Greenland floating glaciers, Ann. Glaciol., 33, 474–480, https://doi.org/10.3189/172756401781818554, 2001.
Rontani, J.-F., Belt, S. T., Vaultier, F., and Brown, T. A.: Visible light induced photo-oxidation of highly branched isoprenoid (HBI) alkenes: Significant dependence on the number and nature of double bonds, Org. Geochem., 42, 812–822, https://doi.org/10.1016/j.orggeochem.2011.04.013, 2011.
Rontani, J.-F., Belt, S. T., Vaultier, F., Brown, T. A., and Massé, G.: Autoxidative and Photooxidative Reactivity of Highly Branched Isoprenoid (HBI) Alkenes, Lipids, 49, 481–494, https://doi.org/10.1007/s11745-014-3891-x, 2014.
Rontani, J.-F., Belt, S. T., and Amiraux, R.: Biotic and abiotic degradation of the sea ice diatom biomarker IP25 and selected algal sterols in near-surface Arctic sediments, Org. Geochem., 118, 73–88, https://doi.org/10.1016/j.orggeochem.2018.01.003, 2018.
Schaffer, J., Appen, W.-J. von, Dodd, P. A., Hofstede, C., Mayer, C., de Steur, L., and Kanzow, T.: Warm water pathways toward Nioghalvfjerdsfjorden Glacier, Northeast Greenland, J. Geophys. Res.-Oceans, 122, 4004–4020, https://doi.org/10.1002/2016JC012462, 2017.
Schneider, W. and Budéus, G.: The North East Water polynya (Greenland Sea), Polar Biol., 14, 1–9, https://doi.org/10.1007/BF00240265, 1994.
Seidenkrantz, M.-S., Andersen, J. R., Andresen, K., J., Bendtsen, J., Brice, C., Ellegaard, M., Eriksen, L. N., Gariboldi, K., Le Duc, C., Mathiasen, A. M., Nielsen, T., Ofstad, S., Pearce, C., Rasmussen, T., L., Ribeiro, S., Rysgaard, S., Røy, H., Scholze, C., Schultz, M., and Wagner, D. J.: NorthGreen2017 – a Marine Research Expedition to NE Greenland Onboard “R/V 1029 Dana” September 17 to October 1, Cruise Report, Aarhus University, 2018.
Sévellec, F., Fedorov, A. V., and Liu, W.: Arctic sea-ice decline weakens the Atlantic Meridional Overturning Circulation, Nat. Clim. Change, 7, 604–610, https://doi.org/10.1038/nclimate3353, 2017.
Sørensen, M.: Walrus Island – A pivotal place for High Arctic Palaeo-Eskimo societies in Northeast Greenland, etudinuit, 36, 183–205, https://doi.org/10.7202/1015959ar, 2012.
Sneed, W. A. and Hamilton, G. S.: Recent changes in the Norske Øer Ice Barrier, coastal Northeast Greenland, Ann. Glaciol., 57, 47–55, https://doi.org/10.1017/aog.2016.21, 2016.
Stein, R., Fahl, K., and Müller, J.: Proxy reconstruction of Arctic Ocean sea ice history – From IRD to IP25, Polarforschung, Polarforschung, 82, 37–71, 2012.
Stein, R., Fahl, K., Schreck, M., Knorr, G., Niessen, F., Forwick, M., Gebhardt, C., Jensen, L., Kaminski, M., Kopf, A., Matthiessen, J., Jokat, W., and Lohmann, G.: Evidence for ice-free summers in the late Miocene central Arctic Ocean, Nat. Commun., 7, 11148, https://doi.org/10.1038/ncomms11148, 2016.
Stein, R., Fahl, K., Gierz, P., Niessen, F., and Lohmann, G.: Arctic Ocean sea ice cover during the penultimate glacial and the last interglacial, Nat. Commun., 8, 373, https://doi.org/10.1038/s41467-017-00552-1, 2017.
Syring, N., Stein, R., Fahl, K., Vahlenkamp, M., Zehnich, M., Spielhagen, R. F., and Niessen, F.: Holocene changes in sea-ice cover and polynya formation along the eastern North Greenland shelf: New insights from biomarker records, Quaternary Sci. Rev., 231, 106173, https://doi.org/10.1016/j.quascirev.2020.106173, 2020a.
Syring, N., Lloyd, J. M., Stein, R., Fahl, K., Roberts, D. H., Callard, L., and O'Cofaigh, C.: Holocene Interactions Between Glacier Retreat, Sea Ice Formation, and Atlantic Water Advection at the Inner Northeast Greenland Continental Shelf, Paleoceanogr. Paleocl., 35, e2020PA004019, https://doi.org/10.1029/2020PA004019, 2020b.
Thomas, D. N.: Sea Ice, John Wiley & Sons, 666 pp., 2017.
Vare, L. L., Massé, G., and Belt, S. T.: A biomarker-based reconstruction of sea ice conditions for the Barents Sea in recent centuries, Holocene, 20, 637–643, https://doi.org/10.1177/0959683609355179, 2010.
Volkman, J. K.: A review of sterol markers for marine and terrigenous organic matter, Org. Geochem., 9, 83–99, https://doi.org/10.1016/0146-6380(86)90089-6, 1986.
Wadhams, P.: The ice cover in the Greenland and Norwegian seas, Rev. Geophys., 19, 345–393, https://doi.org/10.1029/RG019i003p00345, 1981.
Walsh, J. E., Fetterer, F., Scott stewart, J., and Chapman, W. L.: A database for depicting Arctic sea ice variations back to 1850, Geogr. Rev., 107, 89–107, https://doi.org/10.1111/j.1931-0846.2016.12195.x, 2017.
Walsh, J. E., Chapman, W. L., Fetterer, F., and Stewart, S.: Gridded Monthly Sea Ice Extent and Concentration, 1850 Onward, Version 2, Boulder, Colorado USA. NSIDC: National Snow and Ice Data Center [data set], https://doi.org/10.7265/jj4s-tq79, 2019.
Wang, C., Negrel, J., Gerland, S., Divine, D. V., Dodd, P., and Granskog, M. A.: Thermodynamics of Fast Ice off the Northeast Coast of Greenland (79° N) Over a Full Year (2012–2013), J. Geophys. Res.-Oceans, 125, e2019JC015823, https://doi.org/10.1029/2019JC015823, 2020.
Wang, X., Liu, Y., Key, J. R., and Dworak, R.: A New Perspective on Four Decades of Changes in Arctic Sea Ice from Satellite Observations, Remote Sens., 14, 1846, https://doi.org/10.3390/rs14081846, 2022.
Weckström, K., Massé, G., Collins, L. G., Hanhijärvi, S., Bouloubassi, I., Sicre, M.-A., Seidenkrantz, M.-S., Schmidt, S., Andersen, T. J., Andersen, M. L., Hill, B., and Kuijpers, A.: Evaluation of the sea ice proxy IP25 against observational and diatom proxy data in the SW Labrador Sea, Quaternary Sci. Rev., 79, 53–62, https://doi.org/10.1016/j.quascirev.2013.02.012, 2013.
Wekerle, C., McPherson, R., von Appen, W.-J., Wang, Q., Timmermann, R., Scholz, P., Danilov, S., Shu, Q., and Kanzow, T.: Atlantic Water warming increases melt below Northeast Greenland's last floating ice tongue, Nat. Commun., 15, 1336, https://doi.org/10.1038/s41467-024-45650-z, 2024.
Xiao, X., Stein, R., and Fahl, K.: MIS 3 to MIS 1 temporal and LGM spatial variability in Arctic Ocean sea ice cover: Reconstruction from biomarkers, Paleoceanography, 30, 969–983, https://doi.org/10.1002/2015PA002814, 2015a.
Xiao, X., Fahl, K., Müller, J., and Stein, R.: Sea-ice distribution in the modern Arctic Ocean: Biomarker records from trans-Arctic Ocean surface sediments, Geochim. Cosmochim. Ac., 155, 16–29, https://doi.org/10.1016/j.gca.2015.01.029, 2015b.