the Creative Commons Attribution 4.0 License.
the Creative Commons Attribution 4.0 License.
 | 21 Jun 2024
The importance of cloud properties when assessing surface melting in an offline-coupled firn model over Ross Ice shelf, West Antarctica
Andrew Orr
Fredrik Boberg
Thomas J. Bracegirdle
Ella Gilbert
Peter L. Langen
Matthew A. Lazzara
Ruth Mottram
Tony Phillips
Ruth Price
Sebastian B. Simonsen
Stuart Webster
The Ross Ice Shelf, West Antarctica, experienced an extensive melt event in January 2016. We examine the representation of this event by the HIRHAM5 and MetUM high-resolution regional atmospheric models, as well as a sophisticated offline-coupled firn model forced with their outputs. The model results are compared with satellite-based estimates of melt days. The firn model estimates of the number of melt days are in good agreement with the observations over the eastern and central sectors of the ice shelf, while the HIRHAM5 and MetUM estimates based on their own surface schemes are considerably underestimated, possibly due to deficiencies in these schemes and an absence of spin-up. However, the firn model simulates sustained melting over the western sector of the ice shelf, in disagreement with the observations that show this region as being a melt-free area. This is attributed to deficiencies in the HIRHAM5 and MetUM output and particularly a likely overestimation of night-time net surface radiative flux. This occurs in response to an increase in night-time downwelling longwave flux from around 180–200 to 280 W m−2 over the course of a few days, leading to an excessive amount of energy at the surface available for melt. Satellite-based observations show that this change coincides with a transition from clear-sky to cloudy conditions, with clouds containing both liquid water and ice water. The models capture the initial clear-sky conditions but seemingly struggle to correctly represent cloud properties associated with the cloudy conditions, which we suggest is responsible for the radiative flux errors.
- Article
(20558 KB) - Full-text XML
- BibTeX
- EndNote


Intense and/or prolonged atmospheric-induced melting can result in widespread surface meltwater ponds over Antarctic ice shelves (Kingslake et al., 2017; Stokes et al., 2019). This can lead to ice shelves thinning and even potentially collapsing if the meltwater enters the ice and results in enough pressure to cause hydrofracturing (Scambos et al., 2000, 2009; Kuipers Munneke et al., 2014), resulting in an increase in the discharge of grounded ice into the ocean and thus enhanced global sea level rise (Dupont and Alley, 2005; Pritchard et al., 2012; Shepherd et al., 2018; Otosaka et al., 2023). Surface melting of ice shelves occurs when the upper surface temperature is greater than the freezing point of ice or snow at 0 °C and at sub-freezing temperatures (<0 °C) if the snowpack consists of larger snow grains (Nicolas et al., 2017; Jakobs et al., 2021; Orr et al., 2023).
The relatively high temperatures that are associated with Antarctic ice shelf melting are usually driven by local and mesoscale circulations such as barrier winds, katabatic winds, and foehn winds (Orr et al., 2004, 2023; Coggins et al., 2014; Lenaerts et al., 2017a; Heinemann et al., 2019; Zou et al., 2021, 2023; Gilbert et al., 2022), as well as synoptic-scale circulation patterns that facilitate the incursion of warm maritime air masses, such as atmospheric rivers (Nicolas and Bromwich, 2011; Nicolas et al., 2017; Bozkurt et al., 2018; Scott et al., 2019; Wille et al., 2019, 2022; Turner et al., 2022). Therefore, to realistically capture local climate variability and simulate ice shelf melt patterns, it is essential to utilize regional atmospheric models at high spatial resolution, i.e. grid box of ∼ 10 km or less. High-resolution simulations significantly enhance the representation of crucial local-scale atmospheric processes and phenomena, particularly the complex forcing that characterizes the Antarctic coastal margins, and better resolve small ice shelves at spatial scales of 10–100 km (Owinoh et al., 2005; Orr et al., 2005, 2014, 2023; Deb et al., 2018; Lenaerts et al., 2017b).
An additional challenge faced by regional atmospheric models is to realistically represent the surface melting in response to atmospheric-induced warming and the resulting changes of snow and firn properties in the upper part of the ice shelf (Firn Symposium team, 2024). This includes aspects such as meltwater production and ponding on the surface, snowmelt–albedo feedback, and meltwater retention and refreezing in the firn layer (Best et al., 2011; Trusel et al., 2015; van Wessem et al., 2018; Walters et al., 2019; Jakobs et al., 2021; Keenan et al., 2021). The ability and sophistication of land surface and subsurface snow schemes in regional atmospheric models to represent these effects varies considerably, with the choice of spin-up time selected to simulate the evolution of the snow and firn layer also affecting the model performance (van Wessem et al., 2018; Carter et al., 2022). Dedicated and sophisticated offline-coupled firn models serve as valuable tools to address these deficiencies (Langen et al., 2017; Keenan et al., 2021).
The representation of cloud properties, particularly cloud phase and microphysics, are also a major challenge for regional atmospheric models (Bodas-Salcedo et al., 2012; Abel et al., 2017; Hyder et al., 2018; Gilbert et al., 2020). For example, processes occurring at sub-grid scale, such as vapour deposition and turbulence, can influence the partitioning of available water vapour between the solid and liquid phase, with consequent impacts on the radiative properties of the cloud (Furtado et al., 2016; Kim et al., 2020; Kretzschmar et al., 2020). Poor representation of these processes by the single-moment cloud microphysics scheme used by the UK Met Office Unified Model (MetUM) has led to clouds containing too much ice water content and not enough liquid water content (Abel et al., 2017), leading to considerable biases in surface energy balance (SEB) as clouds with larger quantities of liquid water (relative to ice) are associated with higher downwelling longwave (LW) fluxes reaching the surface, while clouds containing more ice (relative to liquid) are associated with higher downwelling shortwave (SW) fluxes reaching the surface (Zhang et al., 1996). Such biases in SEB are therefore also associated with errors in surface melting in Antarctica (King et al., 2015; Gilbert et al., 2020). Properties such as cloud height, temperature, and droplet or crystal size can also impact the radiative effect of the cloud, often in complex and contrasting ways (Lawson and Gettelman, 2014; Barrett et al., 2017; Gilbert et al., 2020). Errors with respect to the vertical distribution of liquid and ice, and especially the representation of thin supercooled liquid layers within mixed-phase clouds can induce radiative biases (Gilbert et al., 2020; Vignon et al., 2021; Inoue et al., 2021). In addition to microphysics, model cloud macrophysical parameterizations, especially relating to cloud fraction (horizontal and vertical), may impact cloud radiative effects (Van Weverberg et al., 2023; McCusker et al., 2023).
Here we investigate the benefits of applying the sophisticated offline-coupled firn model described by Langen et al. (2017), which represents key aspects such as the melt–albedo feedback, to improve regional atmospheric model simulations of a prolonged and extensive episode of surface melt that occurred during January 2016 over the Ross Ice Shelf (RIS), West Antarctica. This ice shelf frequently experiences major surface melt events due to both synoptic- and local-scale processes (Nicolas et al., 2017; Zou et al., 2021; Li et al., 2023; Orr et al., 2023). In particular, the January 2016 melt event is attributed to an influx of warm and moist marine air, likely linked to a concurrent strong El Niño episode (Nicolas et al., 2017).
Assessing the ability of models to estimate surface melt on Antarctic ice shelves is important for identifying deficiencies and aspects of the models that require further improvements. Studies show that summertime surface melting of Antarctic ice shelves will likely increase considerably in the future (Trusel et al., 2015; Kittel et al., 2021; Feron et al., 2021; Gilbert and Kittel, 2021; Boberg et al., 2022; van Wessem et al., 2023). Trusel et al. (2015) suggests that scenario-independent doubling of Antarctic-wide melt will occur by 2050 and also that surface melt on several ice shelves under the high greenhouse gas emissions scenario (RCP 8.5) will approach the levels that contributed to the recent collapse of Larsen A and B ice shelves on the northern Antarctic Peninsula by 2100. Thus, improving the representation of surface melting (and hence surface mass balance) and using this as an indicator for possible ice shelf collapse (Kuipers Munneke et al., 2014) or accelerations of outlet glaciers (Tuckett et al., 2019) is essential for generating more accurate projections of future Antarctic ice sheet stability and estimate its contribution to sea level rise (Fox-Kemper et al., 2021).
2.1 Models
The regional atmospheric model simulations examined were initially produced for Antarctic CORDEX (Antarctic COordinated Regional Downscaling EXperiment), and are based on HIRHAM version 5 (HIRHAM5) and MetUM version 11.1 (Orr et al., 2023). The HIRHAM5 model combines the physics of the ECHAM5 general circulation model and the hydrostatic dynamical core of the HIRLAM7 numerical weather prediction model (Christensen et al., 2007). The model uses a single-moment microphysics scheme described by Sundqvist (1978). Furthermore, HIRHAM5 incorporates a five-layer snow scheme (extending to a depth of 10 m water equivalent) described by Langen et al. (2015), which calculates surface melt and the associated retention and refreezing of liquid water in the firn layer. The scheme also represents the dependence of snow albedo on temperature by linearly varying the albedo between 0.85 (dry fresh snow at temperatures below −5 °C) and 0.65 (for wet snow at temperatures of 0 °C). The MetUM version 11.1 model uses the Global Atmosphere 6.0 configuration (Walters et al., 2017, GA6), designed for grid scales of 10 km or coarser. This includes the ENDGame (Even Newer Dynamics for General atmospheric modelling of the environment) dynamical core, which solves equations for a non-hydrostatic, fully compressible, deep atmosphere. The model uses a single-moment cloud microphysics scheme based on Wilson and Ballard (1999). For simulating the thermal storage of snow it utilizes a “zero-layer” snow scheme described by Best et al. (2011), which employs a composite snow and soil layer and does not account for firn processes.
The physically based multi-layer offline-coupled firn model (hereafter referred to as the firn model) is based on the version implemented in HIRHAM5 (Langen et al., 2015) but heavily updated by Langen et al. (2017) to include 32 vertical layers (extending to a depth of 60 m water equivalent) and a sophisticated firn scheme. The model includes processes such as densification, snow grain growth, irreducible water saturation, impermeable ice layers, and snow-state-dependent hydraulic conductivity. This enables a much more detailed representation of retention and refreezing of liquid water within the firn and thus an improved representation of vertical water flow and refreezing. The version used here is identical to that previously applied to Antarctica by Hansen et al. (2021), which was based on the version optimized for Greenland (Langen et al., 2017; Mottram et al., 2017).
The HIRHAM5 and MetUM simulations were run over the standard Antarctic CORDEX domain (see Fig. 1) at a grid spacing of 0.11° (equivalent to 12 km) from 1979 to 2019, although in this study only output for January 2016 is examined. Lateral- and surface-boundary conditions for both simulations were provided by ERA-Interim reanalysis data (Dee et al., 2011). The HIRHAM5 simulation employed 31 vertical levels in the atmosphere (up to a height of 12.5 hPa), while the MetUM employed 70 vertical levels (up to a height of 80 km). Additionally, while the HIRHAM5 simulation uses a long-term continuous integration approach, the MetUM simulation uses a frequent re-initialization approach (Lo et al., 2008). This consists of a series of twice-daily 24 h forecasts (at 00:00 and 12:00 UTC), with output at T+12, T+15, T+18, and T+21 h from each of the forecasts concatenated together to form a seamless series of 3-hourly model outputs, with the output before T+12 h discarded as spin-up. The five-layer snow scheme used by HIRHAM5 was simply initialized and not spun up. The zero-layer snow scheme used by the MetUM cannot be spun up as it does not account for firn processes (Best et al., 2011). In any case, the frequent re-initialization approach used to produce the MetUM simulations would prevent the evolution of any internal snow and firn conditions. The setup for both models is identical to that described in Orr et al. (2023).
The firn model is subsequently driven by atmospheric forcing from the HIRHAM5 and MetUM simulations for the January 2016 period. This consists of 6-hourly averaged values of solid precipitation, liquid precipitation, surface evaporation, surface sublimation, surface downwelling SW radiative flux, surface downwelling LW radiative flux, sensible heat flux, and latent heat flux, which the firn model subsequently interpolates to hourly values before using them as forcing, by performing a linear interpolation in time between the two nearest 6-hourly files. Prior to the simulations of the January 2016 period the firn model is spun up for a period of 250 years using HIRHAM5 forcing (by repeating the same 1980s decade 25 times) to ensure a more realistic representation of the snow and firn properties. Following this, the firn model forced with MetUM output is spun up for an additional 150 years using MetUM output (by repeating the same 1980s decade 15 times) to ensure that the firn pack has a memory of MetUM forcing.
The native surface melt output from the HIRHAM5 and MetUM simulations, as well as output from the HIRHAM5- and MetUM-forced firn model simulations, are used to calculate patterns of daily melt extent during the January 2016 event. Here, melt days are defined as days with at least 3 mm (water equivalent) of melt occurring. Note that we found that the modelled patterns of daily melt extent were broadly similar for melt thresholds of 1, 3, and 5 mm d−1 (not shown), but we selected 3 mm d−1 as this is the same threshold used by Lenaerts et al. (2017b); Deb et al. (2018); Donat-Magnin et al. (2020). For all snow and firn models, the energy flux used to melt the surface is calculated as the residual in the SEB whenever the surface temperature exceeds 0 °C, after which it is reset to 0 °C (Best et al., 2011; Langen et al., 2015, 2017).
2.2 Observations
The modelled patterns of daily melt extent are compared with daily melt extent estimates derived from satellite passive microwave observations of brightness temperature. Microwave remote sensing is particularly suited to detecting surface meltwater over ice shelves because (i) the appearance of liquid water causes an abrupt increase in brightness temperatures and (ii) the observations can be acquired during daytime and night-time and clear and cloudy conditions (Picard et al., 2007; Nicolas et al., 2017; Johnson et al., 2020, 2022; Mousavi et al., 2022; de Roda Husman et al., 2024). Here, we use a gridded daily surface melting dataset based on Special Sensor Microwave Imager Sounder (SSMIS) satellite-based observations, which uses horizontally polarized brightness temperatures at 19 GHz to identify surface melt. See Nicolas et al. (2017) for further details on the melt detection method. This dataset is available at a spatial resolution of 25 × 25 km, with each grid point classified as either 1 (meaning melt was detected during the corresponding day) or 0 (melt not detected). We also use measurements of near-surface air temperatures from four automatic weather stations (AWSs) situated on the western sector of the RIS (Lazzara et al., 2012) to further determine the occurrence of melt and assess the HIRHAM5 and MetUM models. These stations are referred to as Sabrina, Elaine, Schwerdtfeger, and Marilyn (see Fig. 1 for AWS locations). A temperature threshold of −2 °C is chosen for melting to occur, as suggested by Nicolas et al. (2017).
Satellite data are used to understand the characteristics and properties of clouds during the melt event, whether they were important, and how well they were represented by the HIRHAM5 and MetUM models. We use low-level cloud cover from Moderate Resolution Imaging Spectroradiometer (MODIS) satellite-based imagery at a grid spacing of 10 km (Platnick et al., 2015), which agrees broadly with the grid spacing of the HIRHAM5 and MetUM models. However, as no direct observations were available at 12:00 UTC (over the western region of the RIS), a pseudo-image for this time was calculated by averaging two MODIS images that corresponded to satellite ground tracks passing over the western sector of the RIS at around 06:00 UTC (from the Aqua satellite) and 18:00 UTC (from the Terra satellite). To examine the phase of clouds during the event, along-track vertical profiles of ice and liquid clouds are obtained from two orbits of the satellite-based Cloud-Aerosol Lidar and Infrared Pathfinder Satellite Observation (CALIPSO) mission on 14 and 17 January (see Fig. 1 for ground tracks). These observations use differences in the polarization properties of light backscattered from non-spherical ice particles and spherical water droplets to determine important information on the cloud phase (Hu et al., 2009). Finally, we also use cloud liquid and ice water paths from Clouds and the Earth's Radiant Energy System (CERES) satellite-based observations (Wielicki et al., 1996; Loeb et al., 2018), which have a grid spacing of 1°. We use the CERES SYN1deg 3-hourly dataset edition 4.1, which consists of data from multiple geostationary and polar-orbiting satellites (CERES, 2017).
Unfortunately, the RIS lacks ground observations to offer additional information on the SEB for January 2016, and although the Atmospheric Radiation Measurement (ARM) West Antarctic Radiation Experiment (AWARE) provides valuable SW and LW data at a station on the West Antarctic Ice Sheet, this is too distant from our area of interest to be useful. Additionally, CERES surface fluxes are not utilized in this study due to uncertainties arising from the degradation of Terra water vapour channels after 2008 and potential inaccuracies when clear-sky fluxes are employed in the calculation (CERES, 2017). Moreover, Hinkelman and Marchand (2020) suggested a potential positive bias in SW radiation and a negative bias in LW radiation over the Southern Ocean.
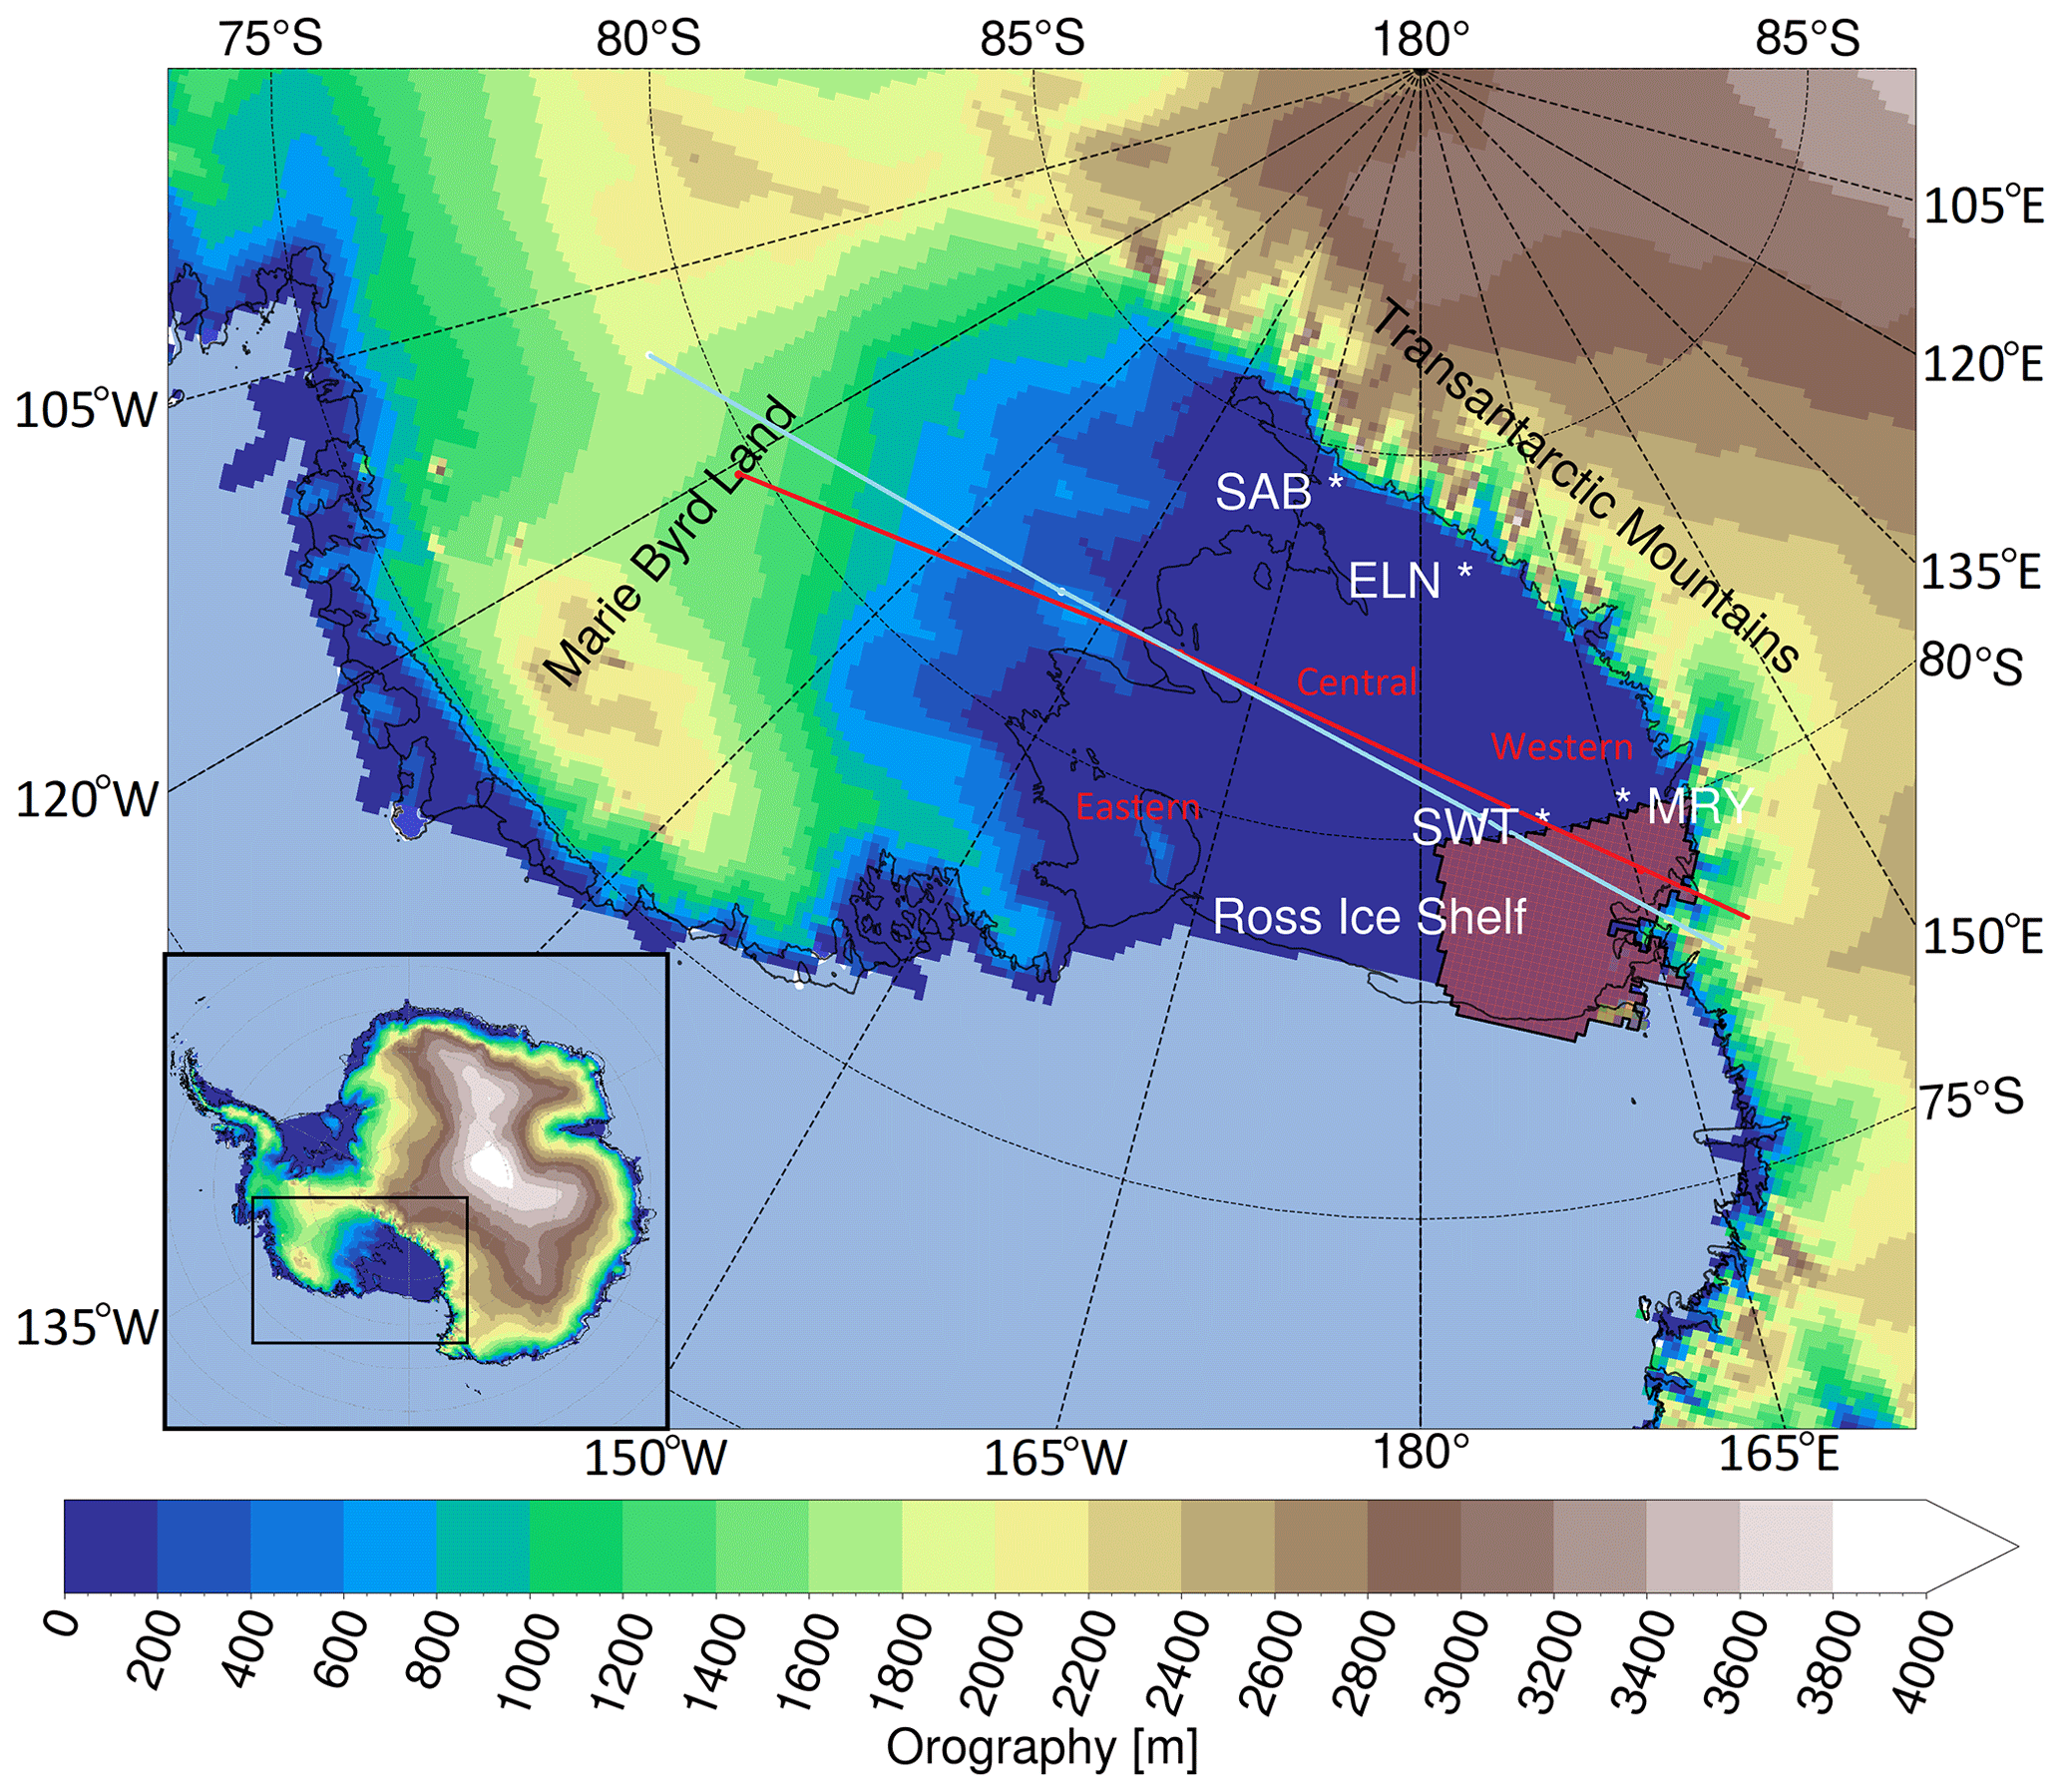
Figure 1Map of West Antarctica showing the location of the Ross Ice Shelf, Marie Byrd Land, and the Transantarctic Mountains. Also labelled are the eastern, central, and western sectors of the ice shelf, with the eastern sector bordered by Marie Byrd Land, while the western sector is bordered by the Transantarctic Mountains. The orography (shading) and coastline (solid black line) are from the HIRHAM5 model. Also shown are the locations of Sabrina, Elaine, Schwerdtfeger, and Marilyn AWS (labelled SAB, ELN, SWT, and MRY, respectively), which are situated on the western sector of the ice shelf. The area over the western sector of the ice shelf that is investigated in depth is highlighted by the burgundy shading. The two solid lines crossing the ice shelf show the ground tracks of the CALIPSO satellite on the 14 (turquoise) and the 17 (red) January 2016. The inset map shows the full model domain used for the HIRHAM5 and MetUM simulations.
Figure 2 shows that extensive surface melting occurred over much of the central and eastern sectors of the RIS during January 2016, with the total number of satellite-observed melt days for this period approaching up to 15 in these locations. Examination of the observed melt pattern for individual days showed that this period occurred roughly from 11 to 25 January (not shown). Much fewer melt days are observed over the western sector of the RIS during this period, with the transition between the high-melt regime to the east and the low-melt regime to the west abruptly occurring around 180° W, as also shown by Nicolas et al. (2017). Figure 2 also shows a considerable underestimation in the total number of melt days calculated from the native melt output from HIRHAM5 and MetUM. This is especially apparent for HIRHAM5, which simulates only a few melt days over the eastern sector of the RIS and no melt days over the central sector (Fig. 2b). The MetUM performance is slightly better in terms of both the number (up to 10) and pattern of the melt days, with the latter broadly agreeing with the observations (Fig. 2c). However, there is a considerable increase in the number of melt days calculated from melt output from the firn model forced by HIRHAM5 and MetUM, with up to 20 melt days simulated over the entire RIS (Fig. 2d, e). Although the firn model results are in better agreement with the observations over the eastern and central sectors of the RIS (although they now slightly overestimate the number of melt days in these areas), they erroneously simulate a much higher number of melt days (up to 20) over the western sector of the RIS compared to the satellite-based observations.
To investigate further the discrepancies between the number of melt days estimated from the firn model and the observations, Fig. 3 compares model and satellite-based maps of daily melt area from 13 to 18 January. These 6 d were selected out of all of January because they (i) coincided with the main period of surface melting that occurred and (ii) showed the largest differences between the observations and firn model results, especially over the western RIS sector. The satellite-based observations show a distinct melt-free region over the western sector of the RIS on each of these 6 d compared to the central and eastern sectors that show melt (i.e. broadly consistent with the observed surface melt pattern shown in Fig. 2a for all of January). This pattern is largely well simulated by the firn model from 13 to 15 January (Fig. 3g–i, m–o). However, from 16 to 18 January (Fig. 3j–l, p–r) the firn model results erroneously show a much smaller melt-free region over the western sector of the RIS compared to the observations, which gets progressively smaller each day. By 17 and 18 January any melt-free area over the RIS is non-existent in the HIRHAM5-forced results and limited to the extreme western margins of the RIS in the MetUM-forced results.
The AWS-measured near-surface air temperatures from 13 to 18 January (Fig. 4) are consistent with the satellite-based melt patterns (Fig. 3). For example, the Sabrina and Elaine AWSs both show temperatures above the −2 °C threshold for melt during this period (Fig. 4a, b), consistent with both sites being located in a region where the satellite-based measurements show melting. By contrast, the Schwerdtfeger and Marilyn AWSs both show temperatures that are either around or below this threshold (Fig. 4c, d), consistent with both sites being located in the western sector of the RIS that the satellite identifies as being a melt-free area during this period. Moreover, the erroneous regions of melt over the western RIS simulated by the firn model during this period are consistent with near-surface air temperatures simulated by HIRHAM5 and MetUM being higher than the temperatures observed by the Schwerdtfeger and Marilyn AWSs (Fig. 4c, d). In particular, at these two stations the HIRHAM5 near-surface temperatures are consistently above −2 °C from 16 to 18 January.
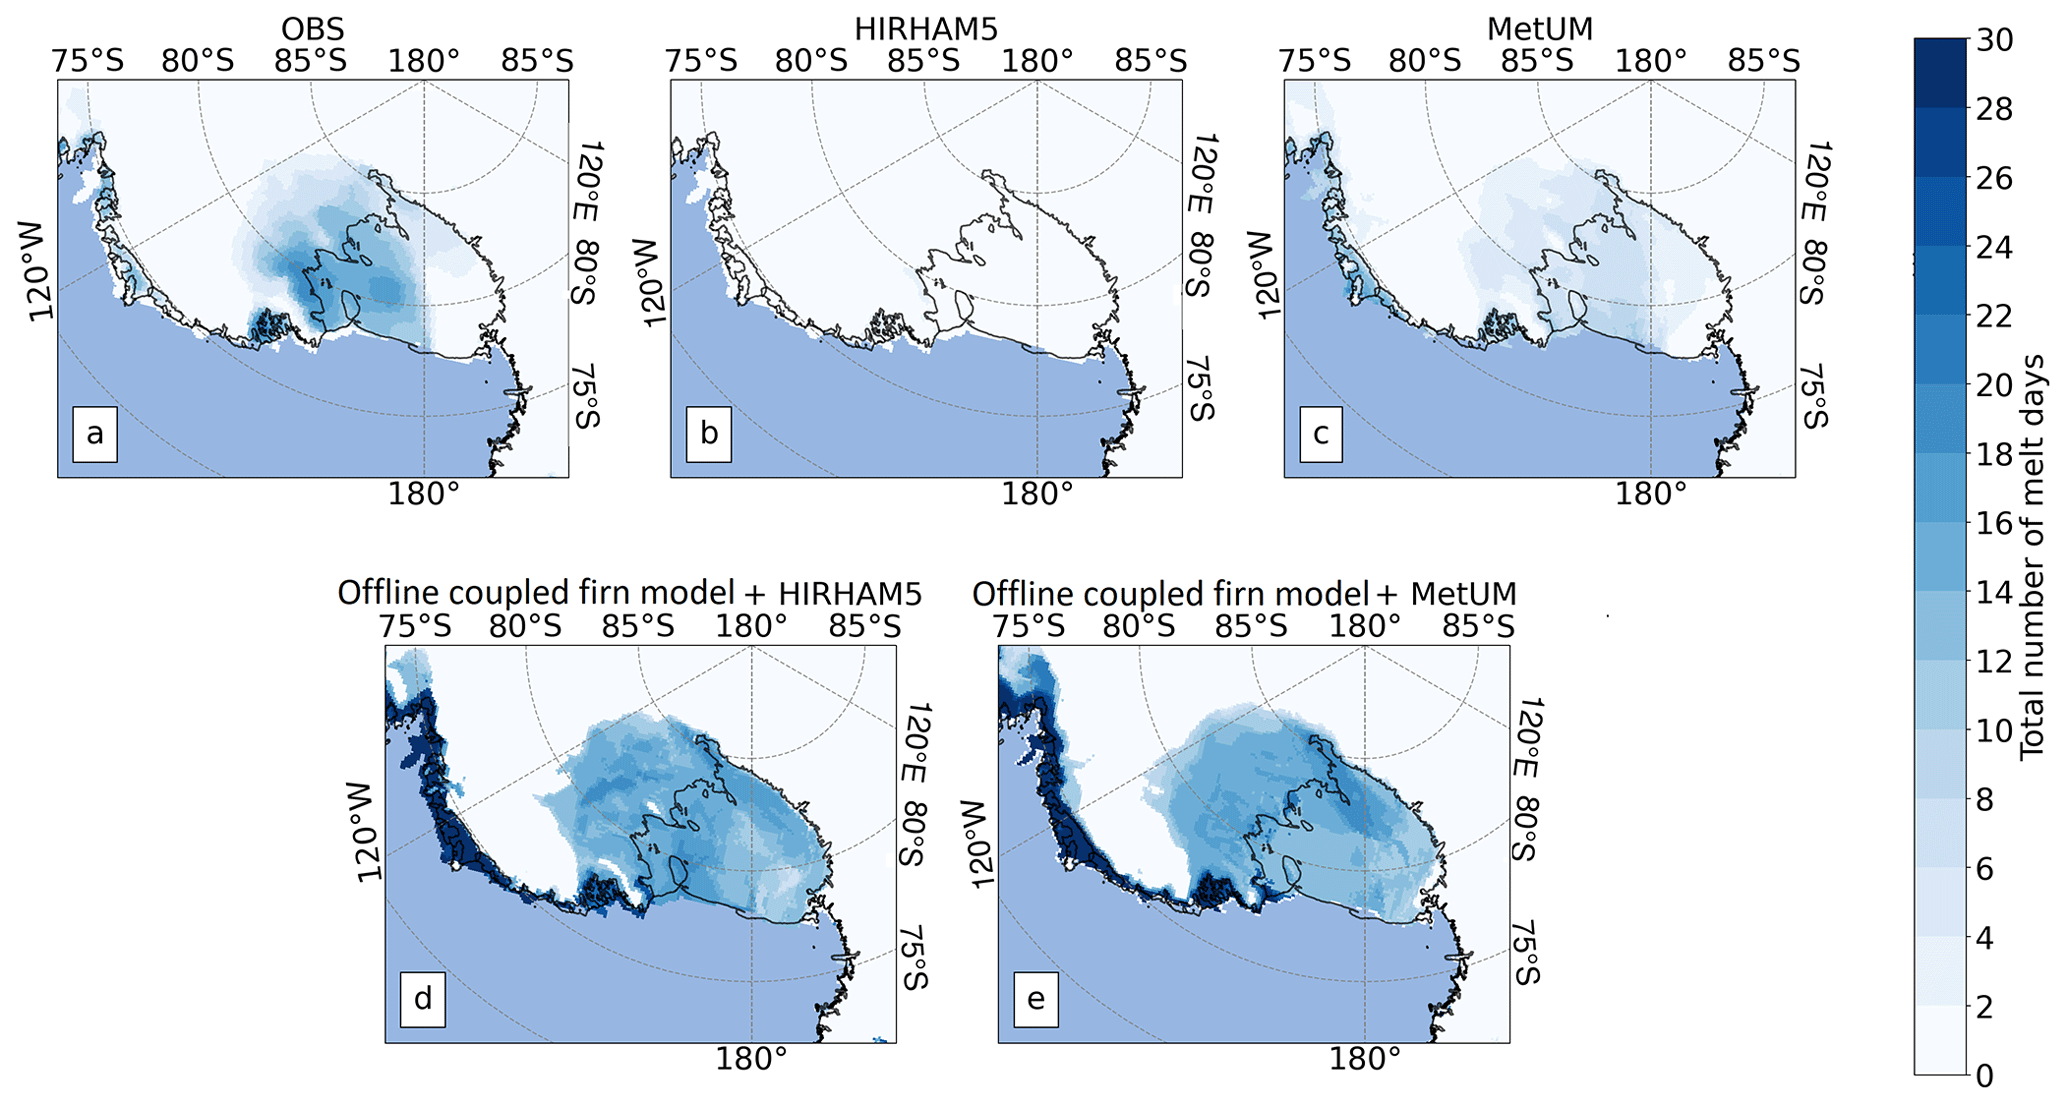
Figure 2Maps of West Antarctica showing the total number of melt days (shading) during January 2016 from (a) satellite passive microwave measurements, (b) native melt output from HIRHAM5, (c) native melt output from MetUM, (d) melt output from the offline-coupled firn model forced by HIRHAM5 output, and (e) melt output from the offline-coupled firn model forced by MetUM output.
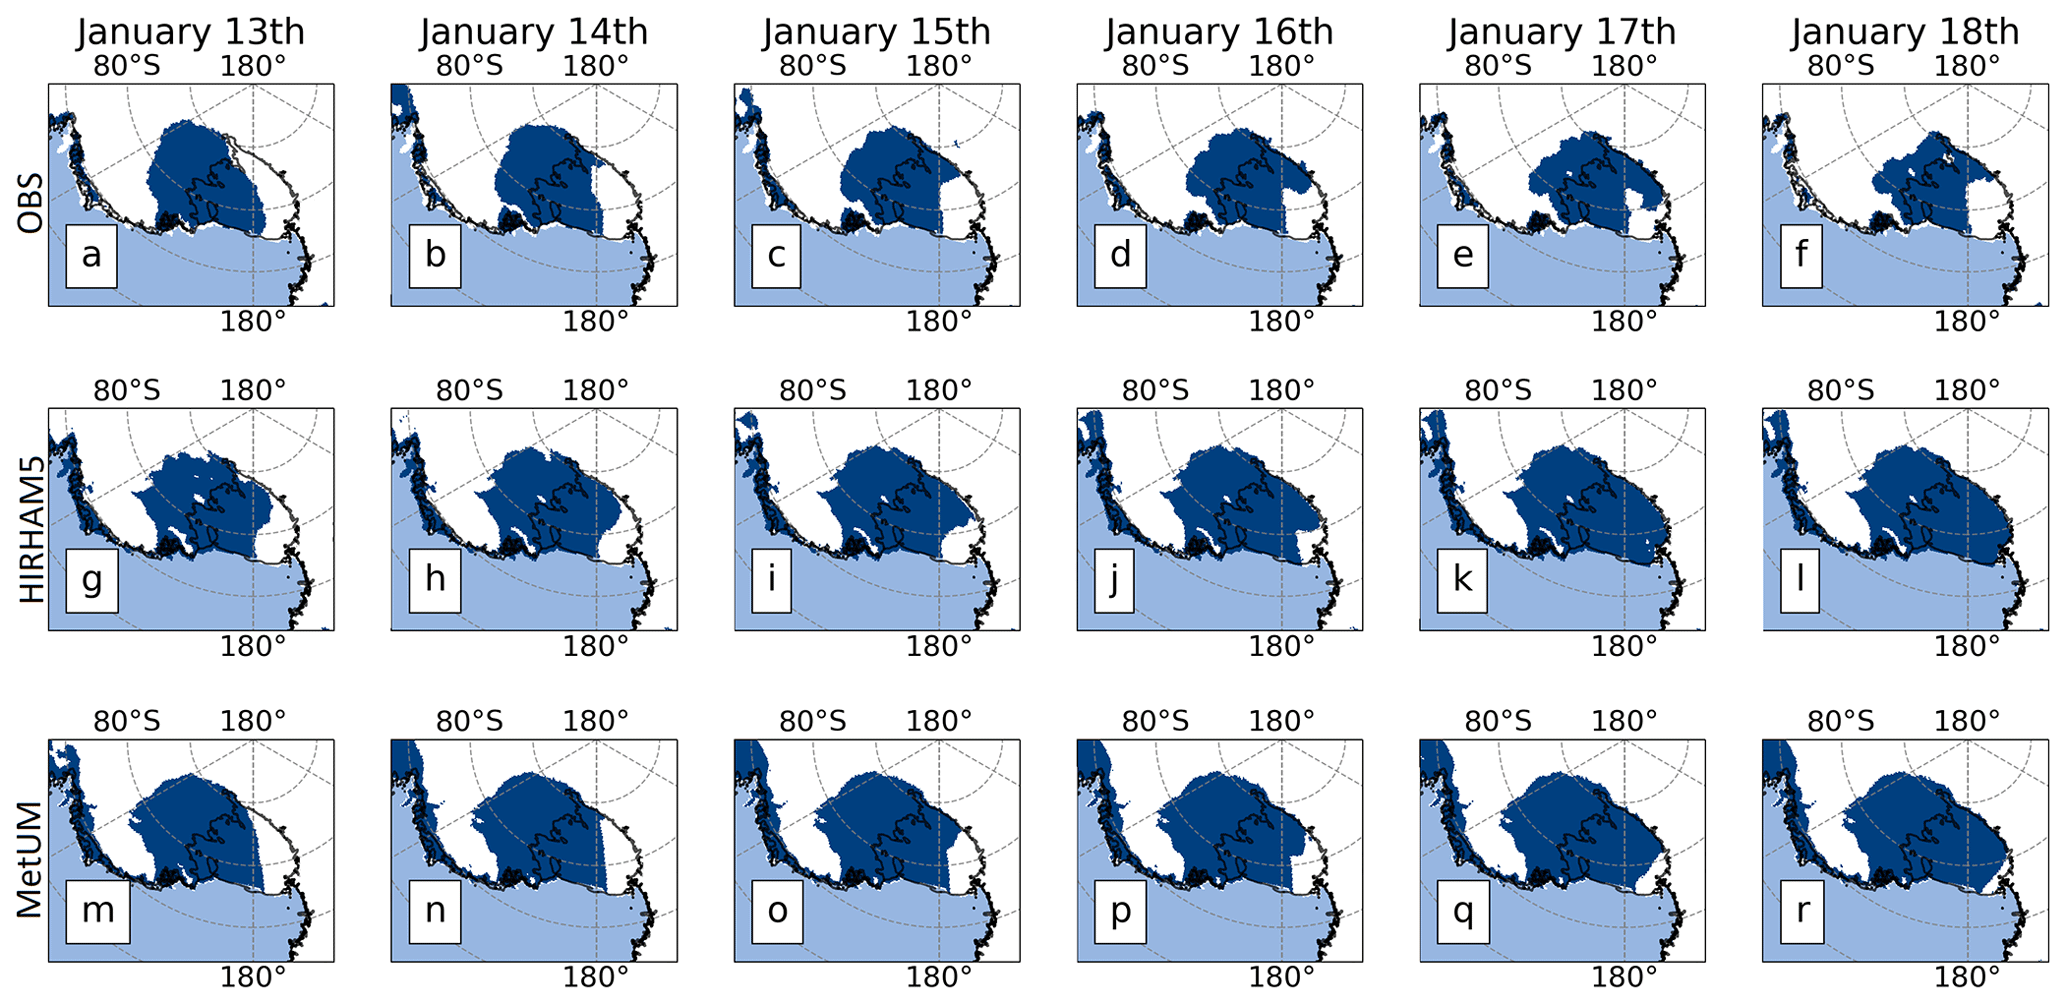
Figure 3Maps of West Antarctica showing the daily melt area from the 13 to 18 (from left to right) January 2016 from (top row; a–f) satellite passive microwave measurements, (middle row; g–l) the offline-coupled firn model forced by HIRHAM5 output, and (bottom row; m–r) the offline-coupled firn model forced by MetUM output. Melt areas are indicated by the dark shading, while melt-free regions are shown as white.
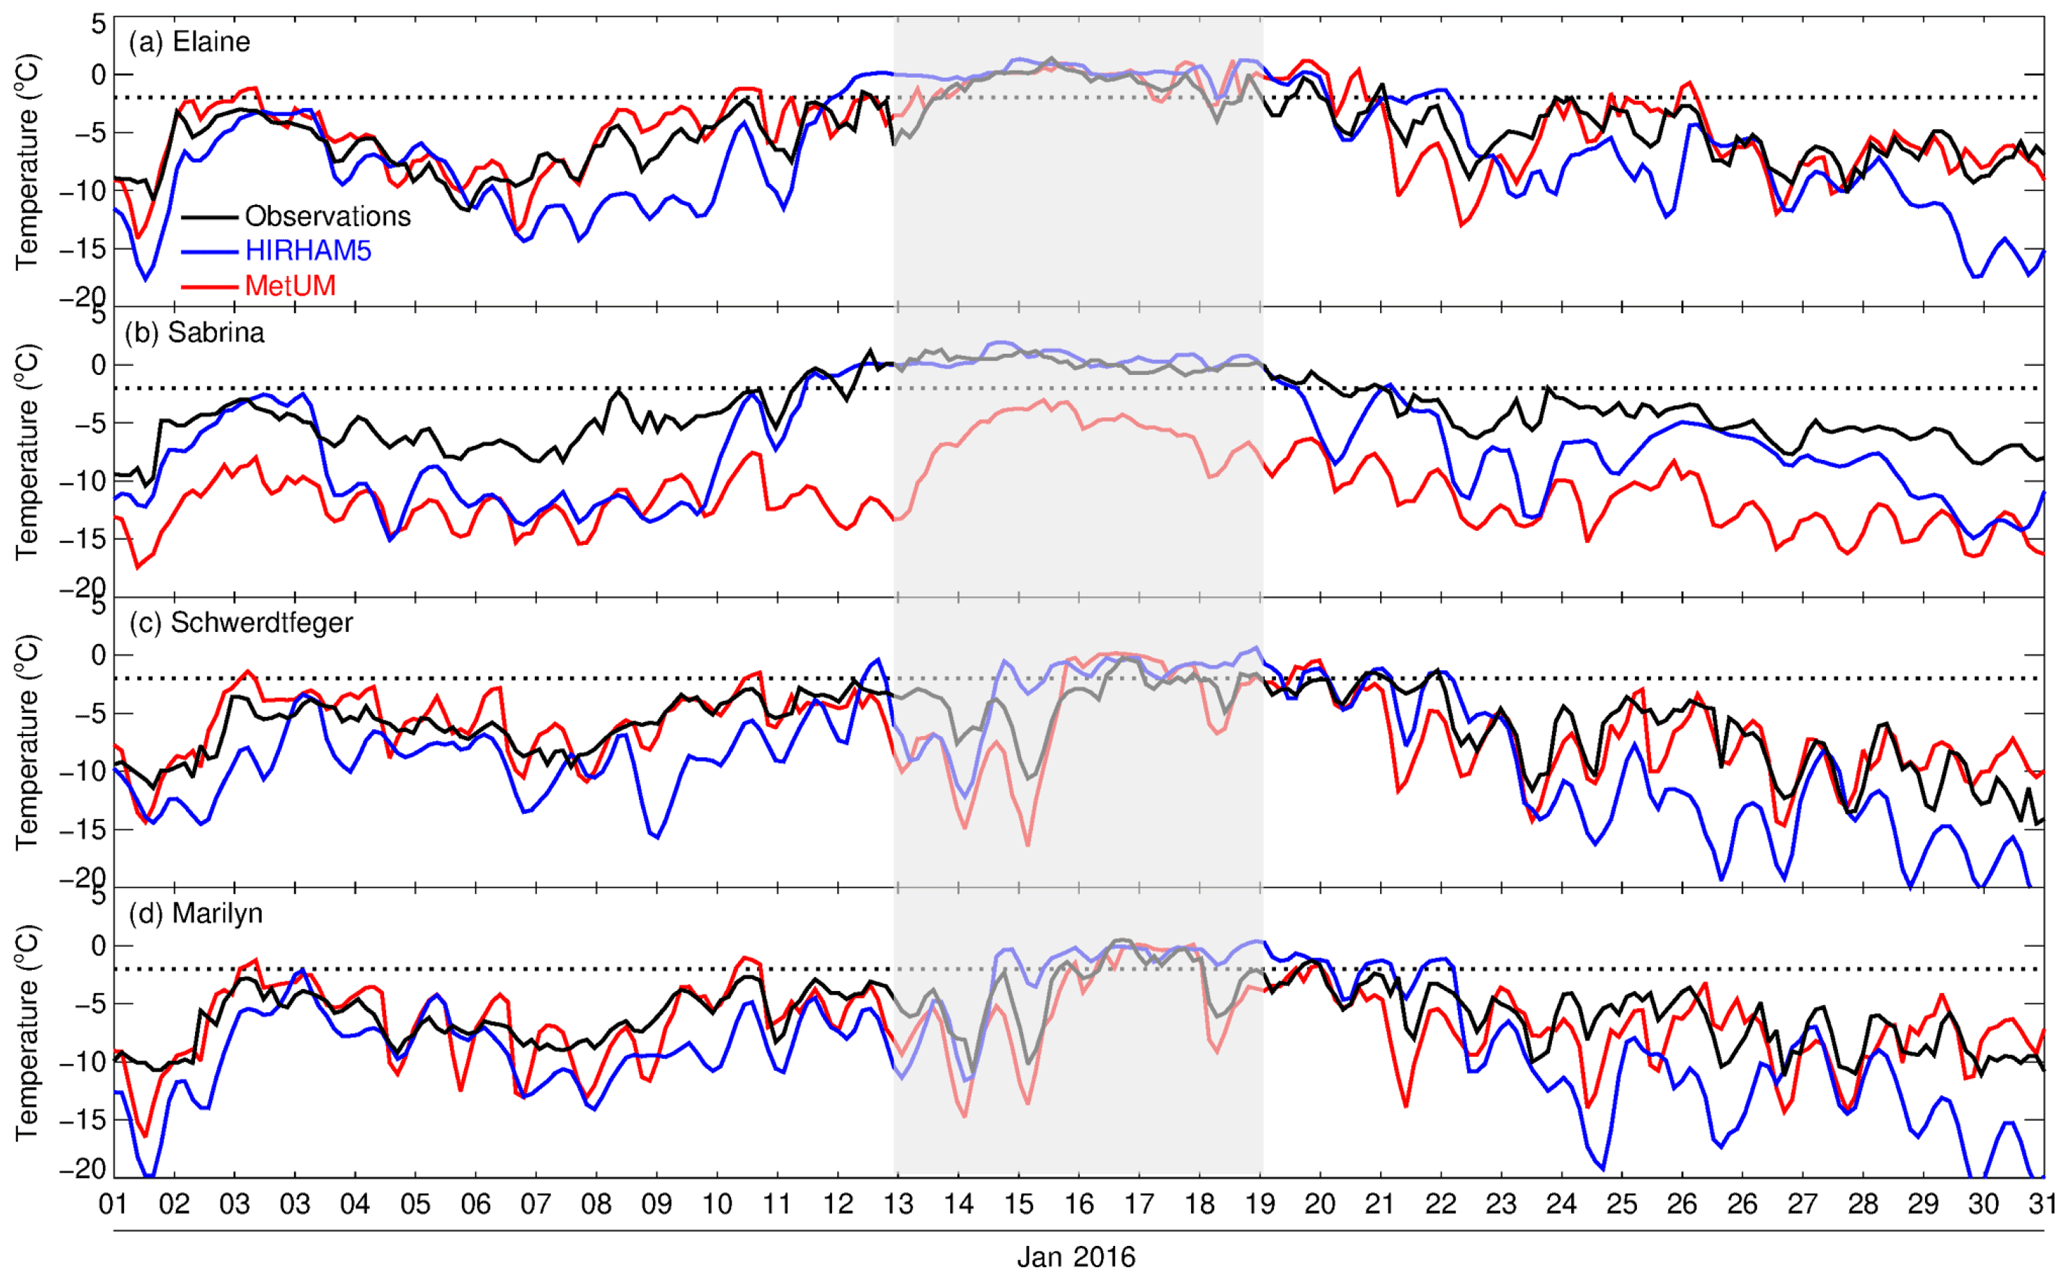
Figure 4Time series of near-surface air temperature (°C) from the 1 to 31 January 2016 from AWS measurements (black line), HIRHAM5 output (blue line), and MetUM output (red line) at (a) Elaine, (b) Sabrina, (c) Schwerdtfeger, and (d) Marilyn. The period of special interest from 13 to 18 January is highlighted by the semi-transparent shaded region. The date shown is in UTC, with local time for the Ross Ice Shelf 12 h ahead of UTC. The horizontal dotted line shows temperatures at −2 °C, which Nicolas et al. (2017) suggests is the threshold for melting for this particular event.
The firn model simulation of daily melt extent over the western sector of the RIS is broadly in agreement with the satellite-based observations from 13 to 15 January and then in disagreement from 16 to 18 January (Fig. 3). To investigate this, Fig. 5 compares the time series of surface radiative fluxes for this period that are spatially averaged over the western sector of the RIS (region highlighted in Fig. 1) from HIRHAM5 and MetUM. From 13 to 14 January, the diurnal cycle of net surface radiative flux shows negative values during night-time ranging from −20 to −40 W m−2 for HIRHAM5 and around −20 W m−2 for MetUM, which are broadly consistent with freezing conditions and thus with the firn models correctly simulating this region as being melt-free. Note that the models also show positive net surface radiation values during daytime, suggesting a daily freeze–thaw cycle. However, from 15 to 18 January the models simulate a transition towards values of night-time and minimum net surface radiation flux of around zero, which is broadly consistent with an absence of freezing, and the firn models (erroneously) simulating surface melt. It is also apparent that although the minimum net surface radiation is broadly similar for both models, the daytime maximum net surface radiation values are larger for HIRHAM5 compared to MetUM, e.g. for 16, 17, and 18 January the HIRHAM5 values are around 50, 10, and 20 W m−2 larger than those of MetUM, respectively. This is possibly consistent with the HIRHAM5-forced firn model estimate of melt extent being more extensive over the western RIS compared to the MetUM-forced estimate (Fig. 3), as well as with HIRHAM5 simulating warmer near-surface temperatures over this region than MetUM (Fig. 4). Note that the diurnal cycle of modelled SEB broadly follows the net surface radiative flux cycle. For example, the night-time and minimum modelled SEB shows negative values for the initial part of the time series until 16 January and zero or positive values after that. This suggests that the primary energy source responsible for the transition from negative to positive SEB is from radiative fluxes and not sensible or latent heat fluxes (Nicolas et al., 2017).
Examination of the time series of net surface SW and net surface LW fluxes from HIRHAM5 and MetUM in Fig. 5 suggests that the radiative fluxes are finely balanced with respect to surface melt. In particular, the transition from negative values of night-time and minimum net surface radiation flux to zero or positive values is mainly due to net surface LW values becoming less negative. For example, values of net surface LW flux change from −90 to −100 W m−2 on 14 and 15 January to around −20 W m−2 on 17 and 18 January. By contrast, the net surface SW values show little change in either direction at night, i.e. they are unable to offset the changes in net surface LW flux. Figure 5 further shows that the changes in net surface LW values are due to a marked increase in surface downwelling LW flux, which increases from around 180 to 200 W m−2 on 14 and 15 January to around 280 W m−2 on 17 and 18 January.
To further understand the discrepancies in melt area over the western RIS region, Figs. 6, 7, and 8 show the spatial distributions of net surface radiative flux, net surface LW flux, and surface downwelling LW flux, respectively, from HIRHAM5 and MetUM, at 12:00 UTC on 14 January and 12:00 UTC on 17 January, i.e. representative of night-time conditions, as the local time for the Ross Ice Shelf is 12 h ahead of UTC. Figure 6 shows that the negative net surface radiative flux values simulated by HIRHAM5 and MetUM over the western RIS during night-time on 14 January are actually largely constrained to this region and do not extend over the rest of the RIS. Over this region the values are around −35 W m−2 for HIRHAM5 and slightly smaller for MetUM (see Fig. 5). By contrast, over the central and eastern sectors of the RIS the simulated values of net surface radiative flux are mostly positive, i.e. consistent with the firn model simulating melting, in agreement with the observations. Figure 6 also shows that the region of weakly positive net surface radiative values (around zero) simulated by the models during night-time on 17 January (cf. Fig. 5) actually extends over the entire western sector of the RIS, i.e. the sector bordering the entire length of the Transantarctic Mountains. By contrast, the simulated net surface radiative values over the eastern and central sectors of the ice shelf are largely negative during night-time on 17 January.
Figure 7 shows that the large negative net surface LW fluxes of up to −100 W m−2 simulated by HIRHAM5 and MetUM over the western sector of the RIS during night-time on 14 January are also largely constrained to this region (cf. Fig. 5), with the negative values over the central and eastern sectors of the ice shelf considerably smaller compared to the western region. The results also confirm the transition to much smaller negative values of net surface LW fluxes during night-time from 14 to 17 January over this region (cf. Fig. 5). However, over the central and eastern sectors of the RIS during night-time on 17 January, the simulated negative net surface LW fluxes are markedly larger than the values over the western sector.
The marked increase in surface downwelling LW flux simulated by the models over the western sector of the RIS during night-time is confirmed in Fig. 8, with values around 200 W m−2 on 14 January and around 280 W m−2 on 17 January (cf. Fig. 5). Also apparent is that the surface downwelling LW flux over the central and eastern sectors of the RIS during night-time on 14 January is considerably larger compared to the western sector, which is consistent with Fig. 7. Note that examination of the net surface SW flux simulated by the models showed broadly similar values on 14 and 17 January over the western RIS during night-time (not shown).
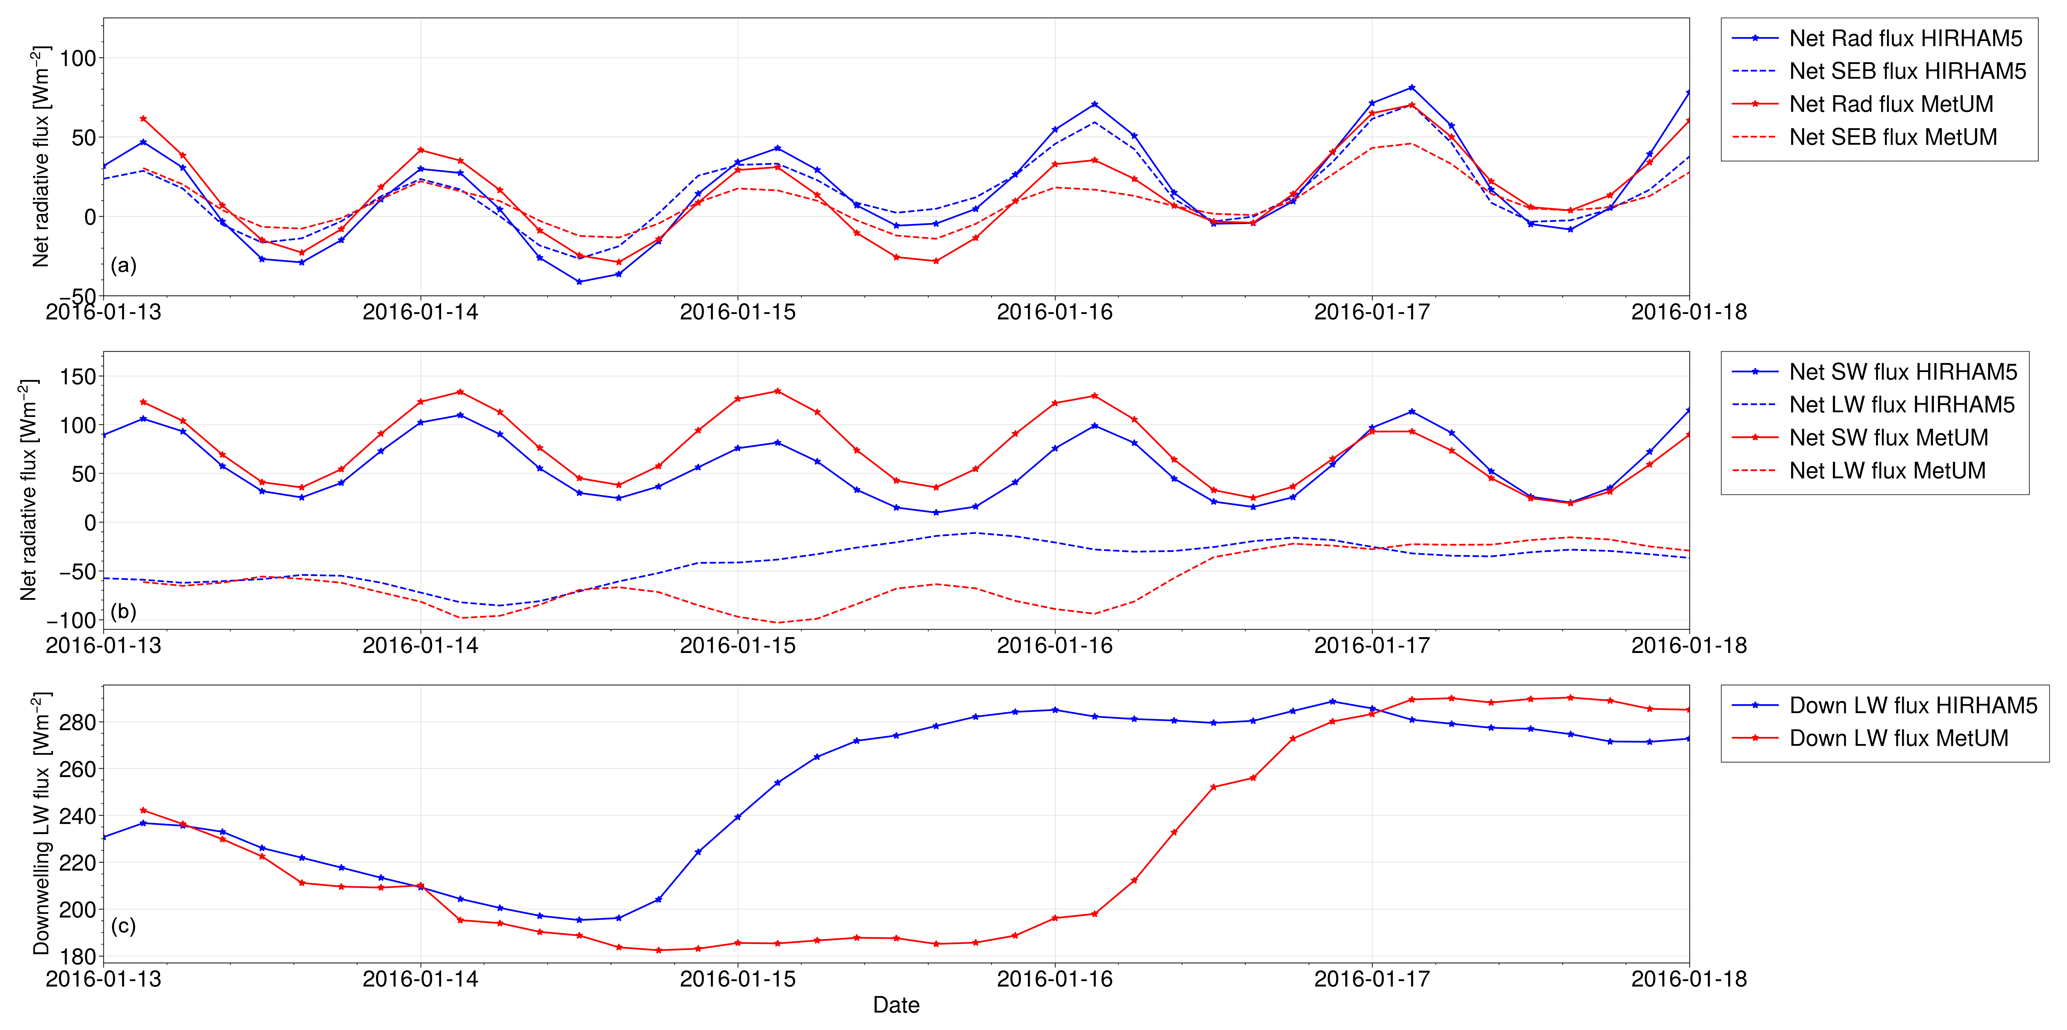
Figure 5Time series of surface radiative fluxes from 13 to 18 January 2016 that are spatially averaged over the western sector of the RIS (region highlighted in Fig. 1) from HIRHAM5 and MetUM simulations (W m−2). Panel (a) shows the net surface radiative fluxes and SEB. Panel (b) shows the net surface LW and SW fluxes. Panel (c) shows the surface downwelling LW fluxes. The date shown is in UTC, with local time for the Ross Ice Shelf 12 h ahead of UTC.
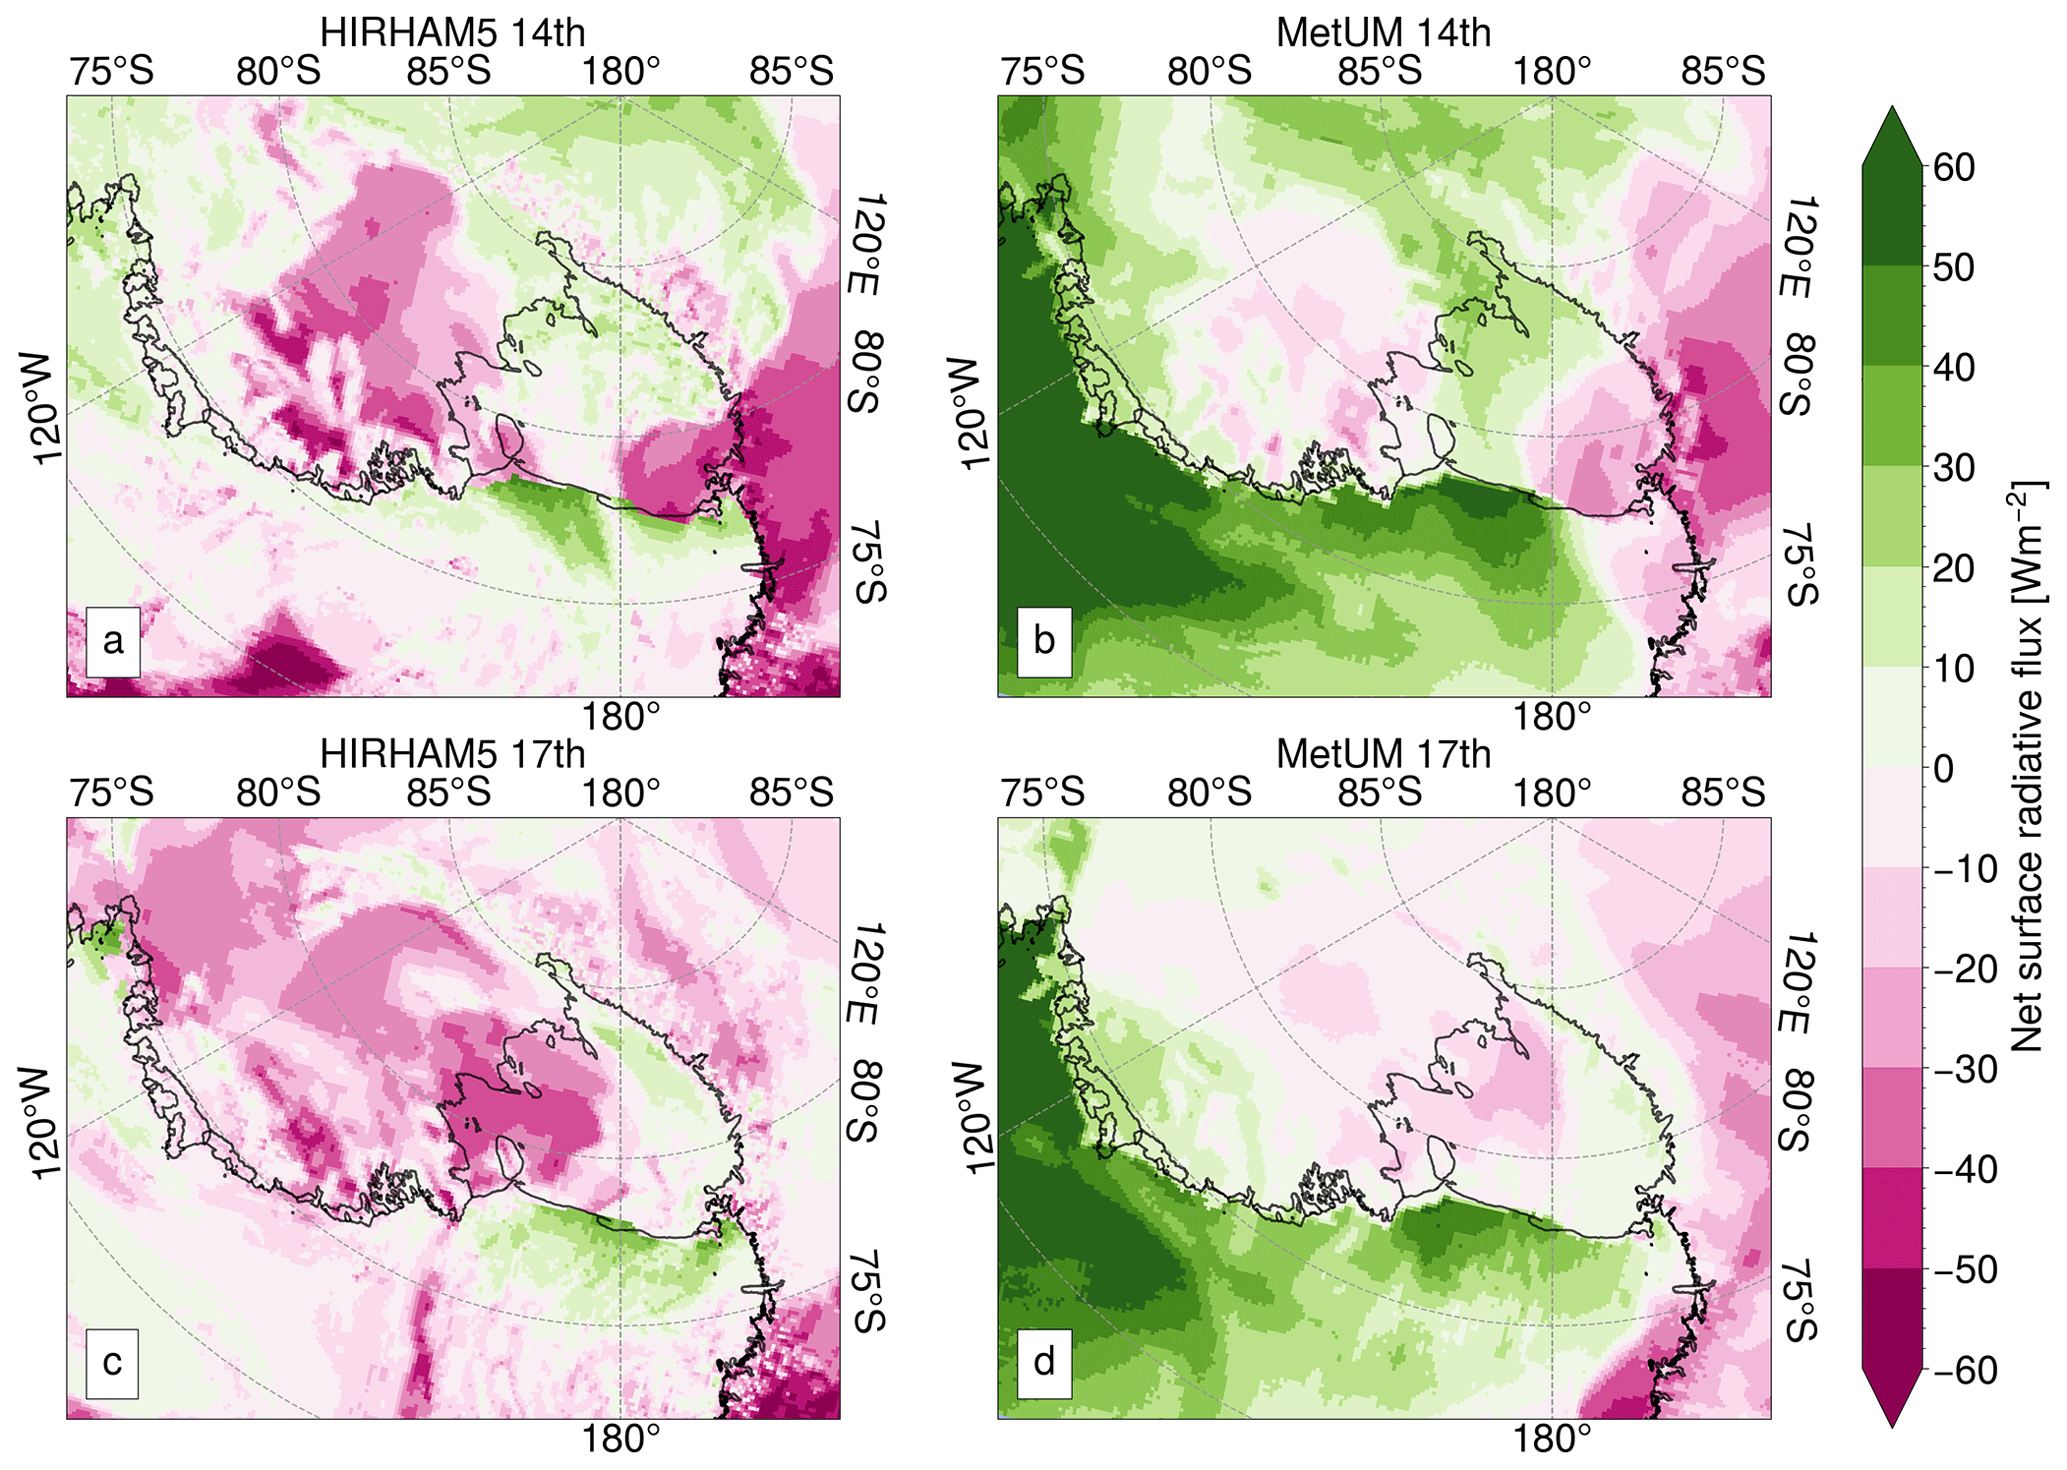
Figure 6Maps of West Antarctica showing 3-hourly averaged net surface radiative fluxes (W m−2) at 12:00 UTC on 14 January 2016 (top row; a, b) and 12:00 UTC on 17 January 2016 (bottom row; c, d) from HIRHAM5 (left column; a, c) and MetUM (right column; b, d). Downward fluxes are positive. Note that 12:00 UTC is equivalent to 00:00 LT over the Ross Ice Shelf.
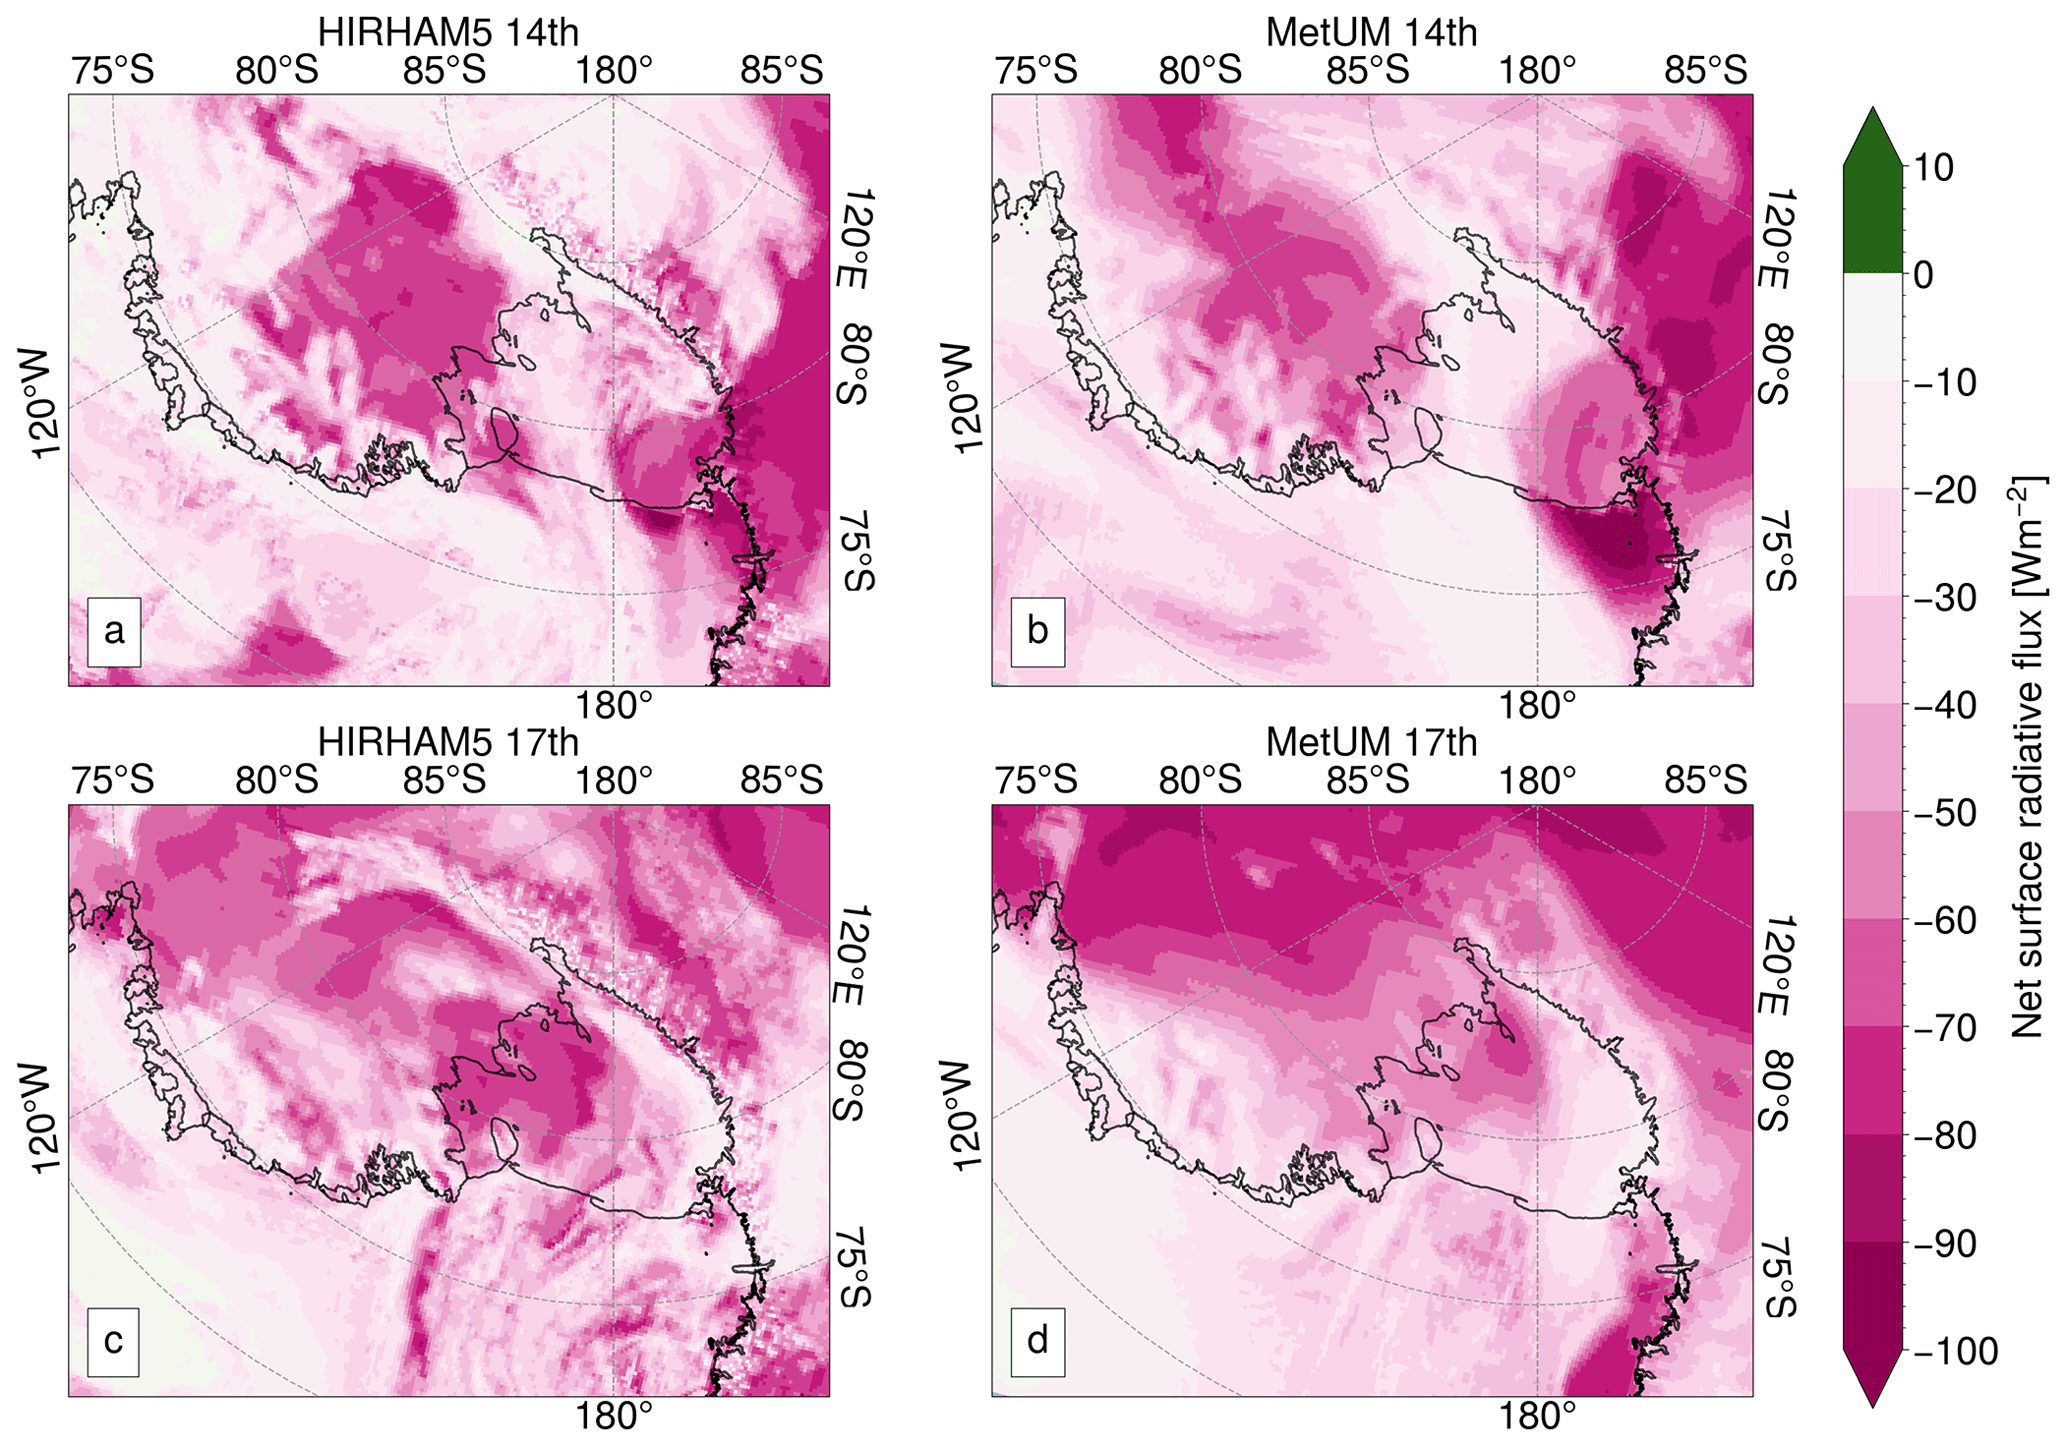
Figure 7Maps of West Antarctica showing 3-hourly averaged net surface LW fluxes (W m−2) at 12:00 UTC on 14 January 2016 (top row; a, b) and 12:00 UTC on 17 January 2016 (bottom row; c, d) from HIRHAM5 (left column; a, c) and MetUM (right column; b, d). Downward fluxes are positive. Note that 12:00 UTC is equivalent to 00:00 LT over the Ross Ice Shelf.
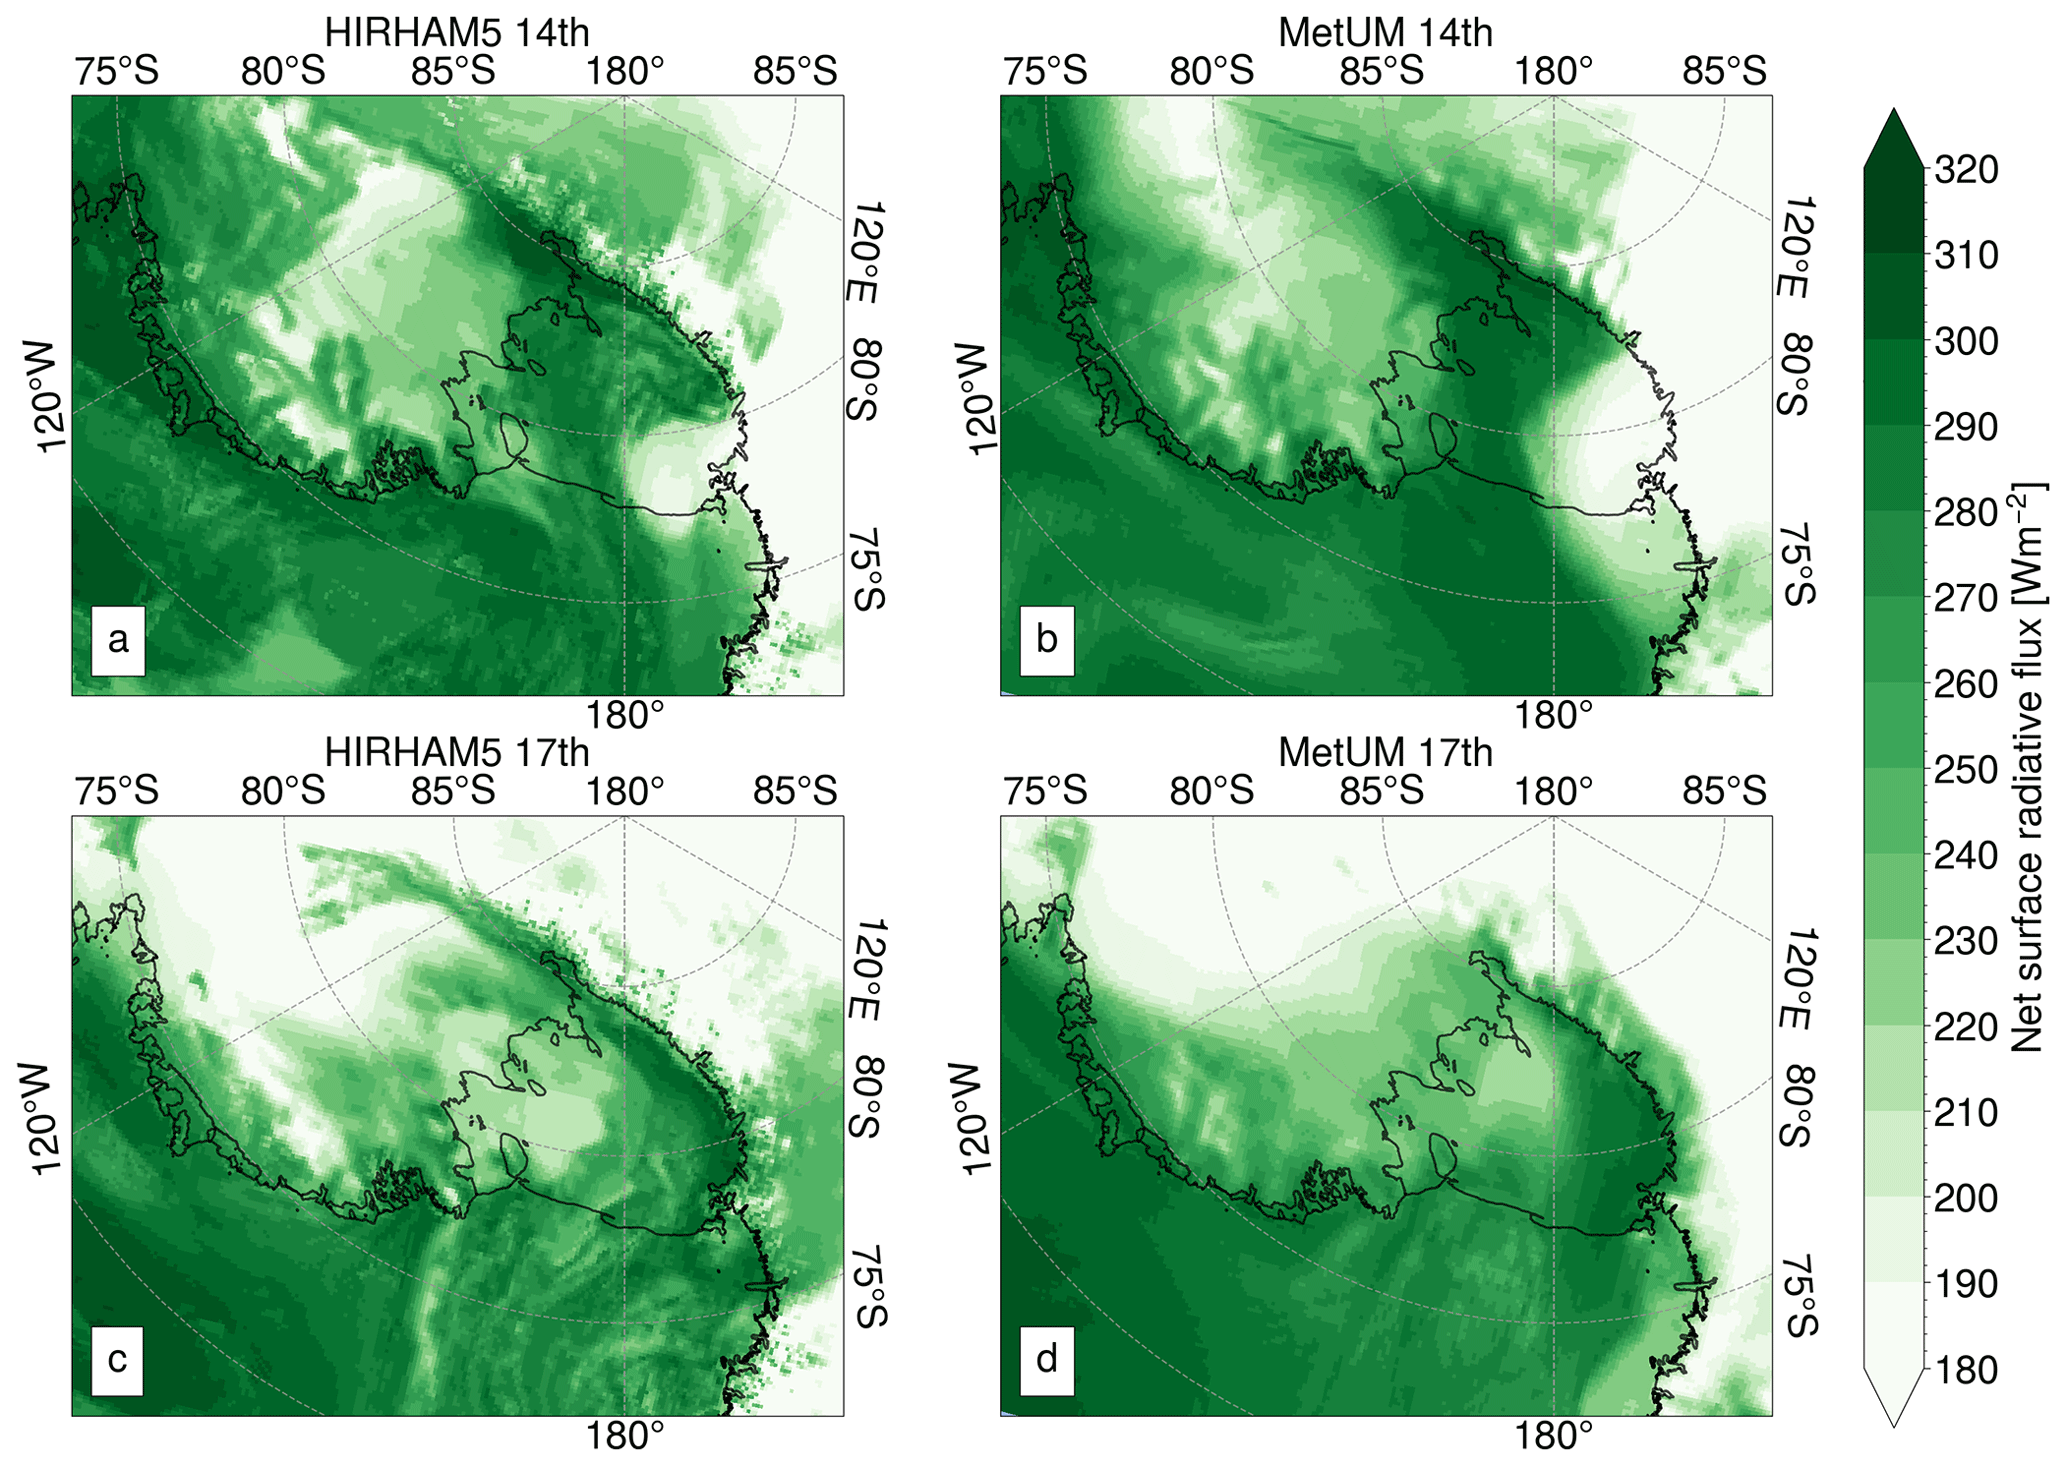
Figure 8Maps of West Antarctica showing 3-hourly averaged surface downwelling LW fluxes (W m−2) at 12:00 UTC on 14 January 2016 (top row; a, b) and 12:00 UTC on 17 January 2016 (bottom row; c, d) from HIRHAM5 (left column; a, c) and MetUM (right column; b, d). Downward fluxes are positive. Note that 12:00 UTC is equivalent to 00:00 LT over the Ross Ice Shelf.
Figures 9 to 12 compare cloud properties between the 14 and the 17 January to help explain the differences in radiative fluxes (Figs. 5 to 8) over the western sector of the RIS. Figure 9 shows the low-level cloud fraction from HIRHAM5 and MetUM at 12:00 UTC on 14 January and 12:00 UTC on 17 January, i.e. the same times as examined in Figs. 6 to 8. Also shown are MODIS observations at these times. On the 14 January, the models show largely cloud-free conditions over the western RIS region (0 %), in contrast to extensive cloud over the melting areas of the eastern and central sectors of the RIS (>80 %) (Fig. 9). However, on 17 January the simulations show extensive cloud cover over the western and central sectors of the RIS and more cloud-free conditions over the eastern sector. Note that the HIRHAM5- and MetUM-simulated medium- and upper-level cloud fractions showed cloud-free conditions during these times (not shown). The model estimates of cloud cover on both 14 and 17 January are largely in agreement with the MODIS imagery, especially over the western RIS region – although MODIS shows a slightly smaller cloud-free area over this region on 14 January compared to the models (Fig. 9).
The good agreement between simulated and observed cloud cover over the western RIS (Fig. 9) suggests that the errors in surface melting, which we attribute to the potential misrepresentation of net surface LW and surface downwelling LW fluxes may stem from factors beyond simple cloud cover to other processes such as cloud microphysics. This is examined by Fig. 10, which shows the vertical profile of cloud phases and their respective heights retrieved by CALIPSO during its passage over the western RIS at around 06:00 UTC on 14 and 17 January – note that the difference in times compared to Fig. 9 makes a direct comparison difficult. Nevertheless, CALIPSO detected mostly liquid-based clouds between 2–4 km above the RIS on 14 January, including this western sector (Fig. 10a). Although it is worth pointing out that over the western sector of the RIS on 14 January the MODIS imagery shows cloudy conditions at 06:00 UTC (not shown) and largely cloud-free conditions at 12:00 UTC (Fig. 9c). More noteworthy is that CALIPSO shows liquid water and ice water clouds extending up to 7 km above the surface of the western sector of the RIS on 17 January (Fig. 10b), i.e. over the same region where models show the (erroneous) spike in melt. Additionally, the occurrence of liquid-based clouds on 14 and 17 January in the CALIPSO observations over the eastern and central sectors of the RIS is consistent with the satellite-based measurements showing melting (Fig. 3).
As shown by Fig. 11, the MetUM simulates negligible values of cloud liquid and ice water content over the western sector of the RIS on 14 January at 12:00 UTC, consistent with the cloud-free conditions also simulated over this area at this time (Fig. 9). Figure 12 shows equivalent results for CERES, which also indicates negligible values of cloud ice and liquid water path at 12:00 UTC on 14 January over the western sector of the RIS. On 17 January at 12:00 UTC the MetUM simulates much higher amounts of cloud ice-water over the western sector of the RIS compared to cloud liquid water, with a maximum cloud ice water path of around 0.5 kg m−2. However, CERES suggests that clouds with high ice and liquid water content occur at 12:00 UTC on 17 January over this region, with a cloud ice water path comparable to the MetUM (up to 0.5 kg m−2) but with cloud liquid water path up to 1 kg m−2, i.e. 2 orders of magnitude larger than that simulated by the MetUM. During this time, CALIPSO also observed liquid water and ice water clouds over the western region of the RIS (Fig. 10b), which supports the CERES results.
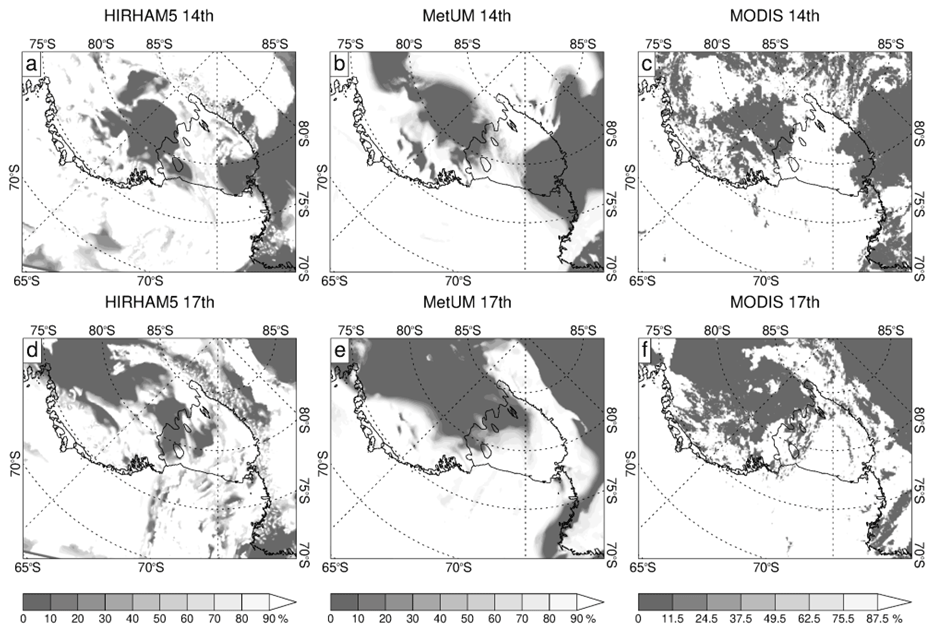
Figure 9Maps of West Antarctica showing cloud cover (%) at 12:00 UTC on 14 January 2016 (top row; a–c) and 12:00 UTC on 17 January 2016 (bottom row; d–f) from HIRHAM5 (left column; a, d), MetUM (middle column; b, e), and MODIS (right column; c, f). The model results are based on 6-hourly averages of low-level cloud fraction. For MODIS, a pseudo-image at 12:00 UTC was calculated by averaging two MODIS images that corresponded to satellite ground tracks over the western sector of the RIS at around 06:00 and 18:00 UTC.
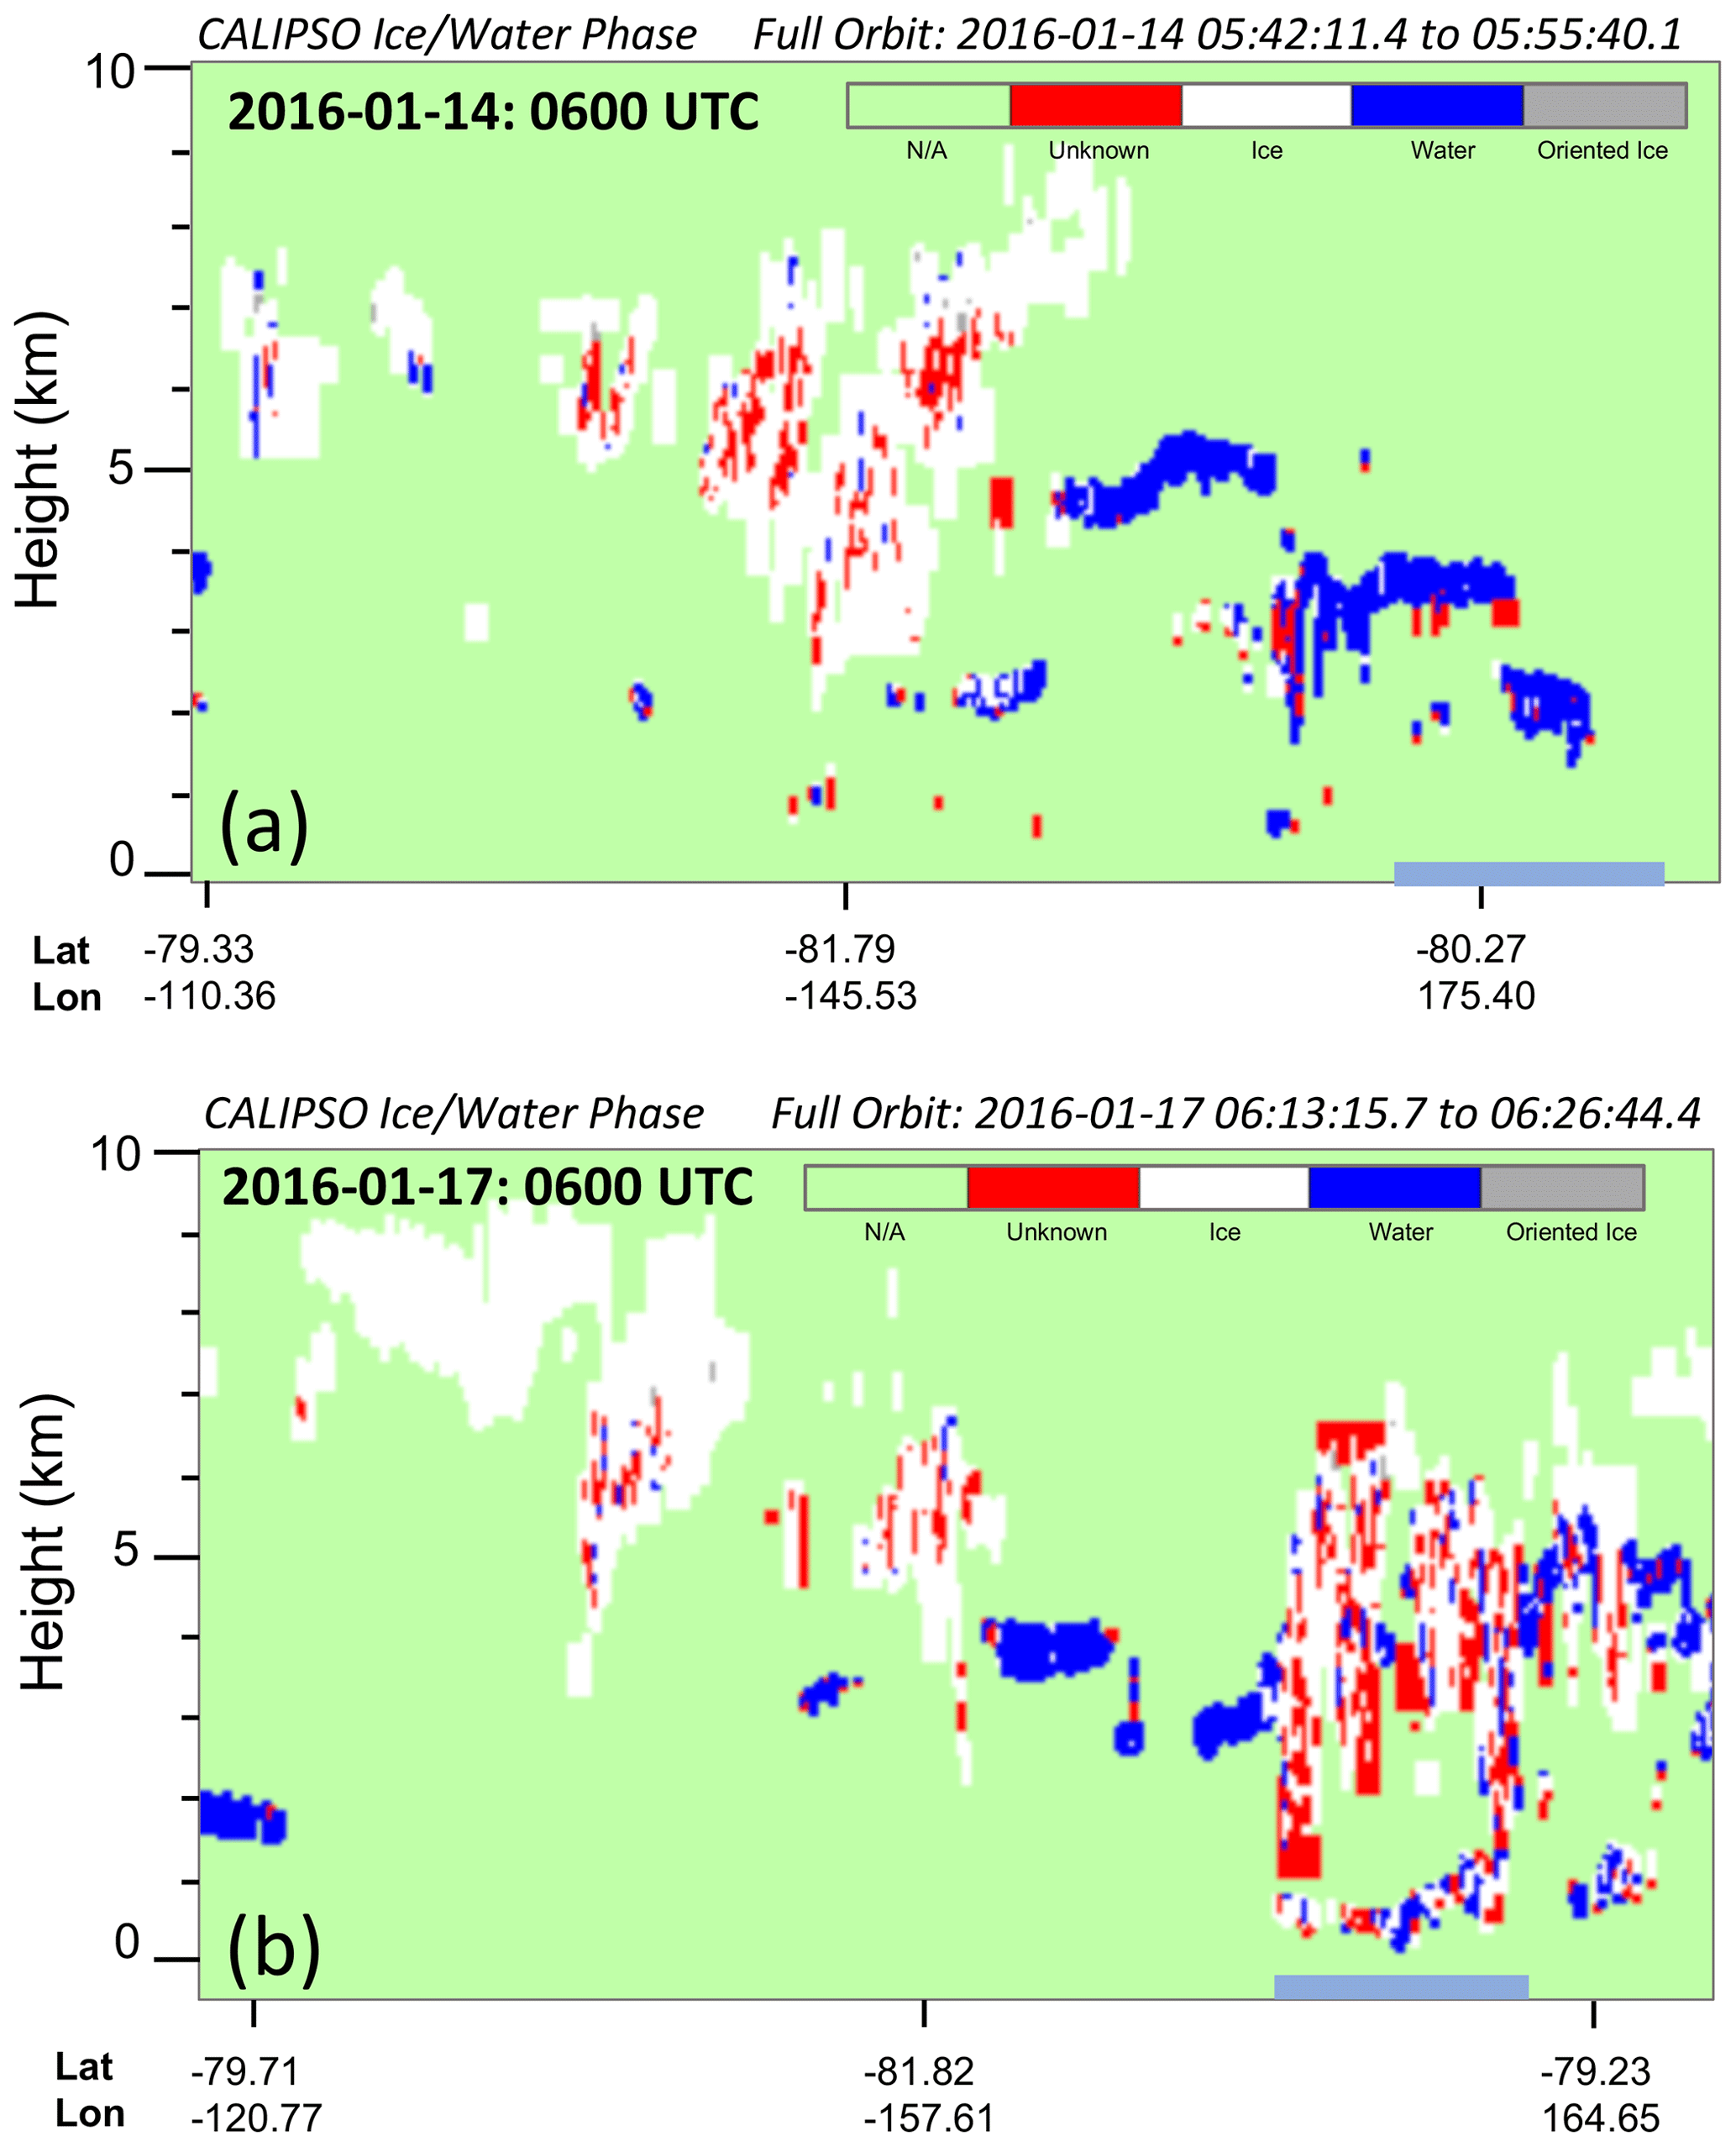
Figure 10Observed vertical profile of cloud phase from the CALIPSO satellite over the RIS at around 06:00 UTC on (a) 14 January and (b) 17 January. The light blue bars at the bottom of each panel include the parts of the satellite ground track that overlap with the RIS region highlighted in Fig. 1. Note that 06:00 UTC is equivalent to 18:00 LT over the Ross Ice Shelf.
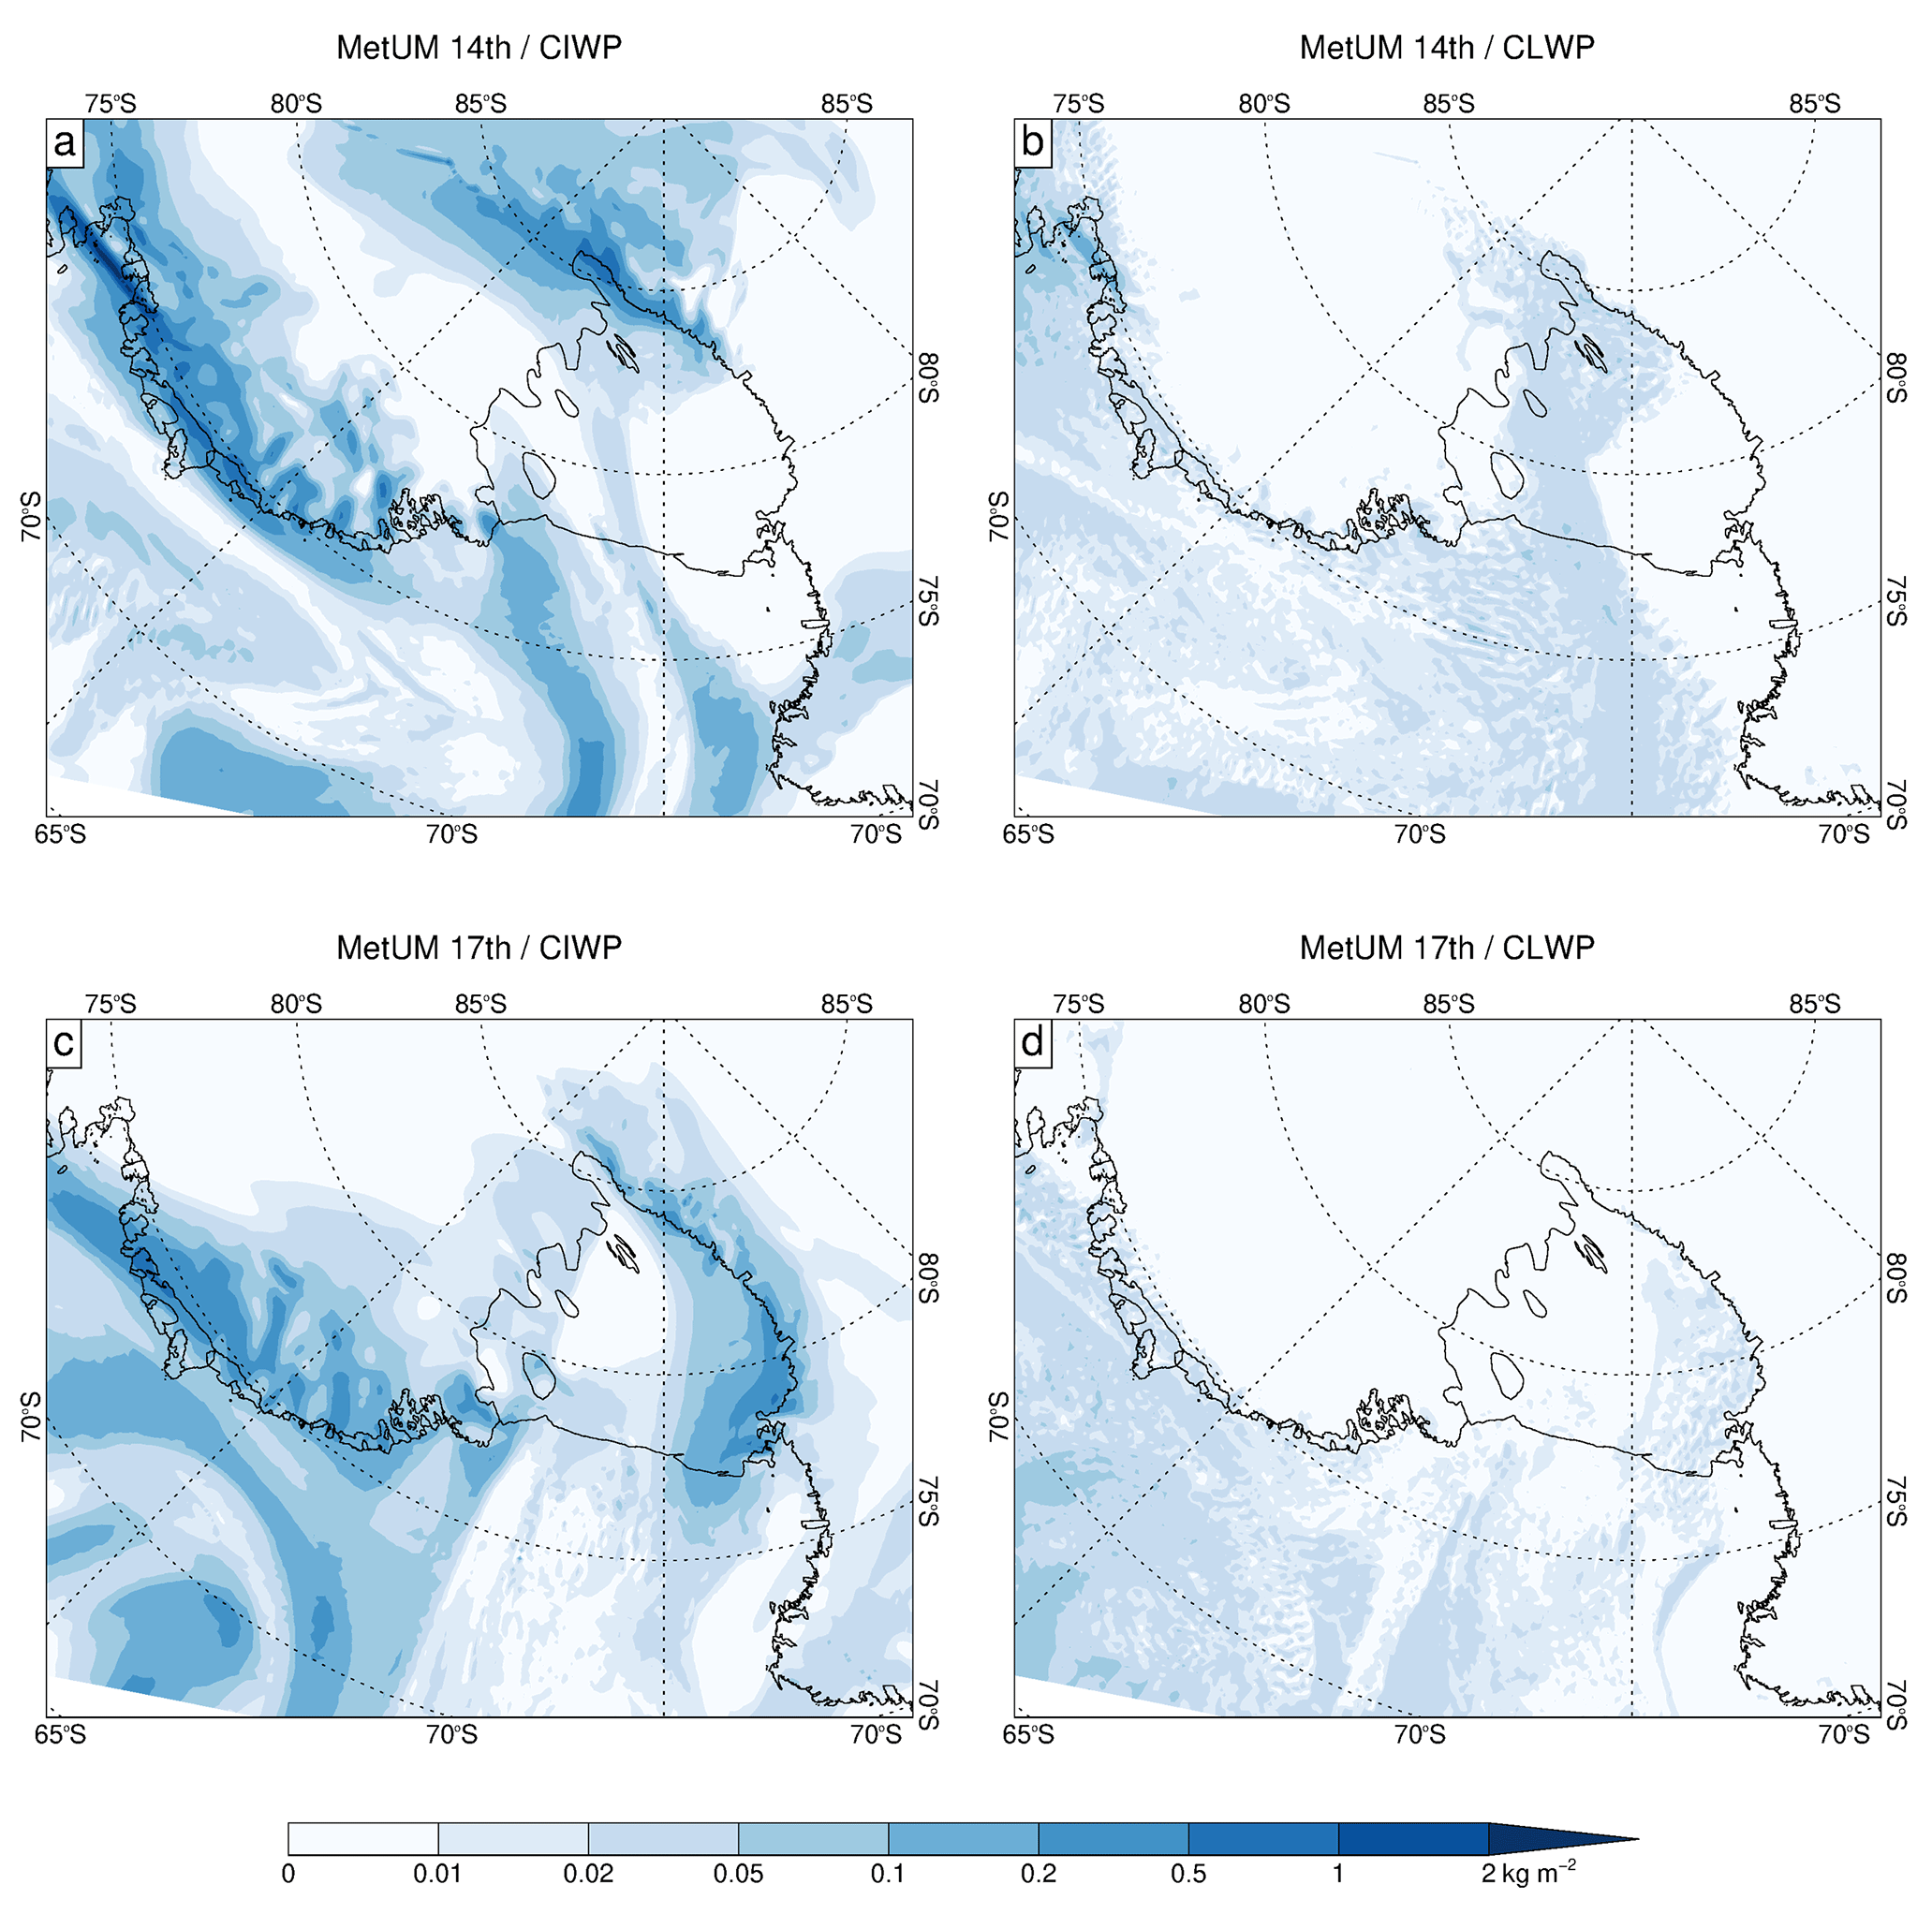
Figure 11Maps of West Antarctica showing the cloud ice water path (CIWP; left column; a, c; kg m−2) and cloud liquid water path (CLWP; right column; b, d; kg m−2) at 12:00 UTC on 14 January 2016 (top row; a, b) and 12:00 UTC on 17 January 2016 (bottom row; c, d) from the MetUM, based on instantaneous values. Note that equivalent cloud ice and liquid water path information from the HIRHAM5 simulation was not available. Note also that 12:00 UTC is equivalent to 00:00 LT over the Ross Ice Shelf.
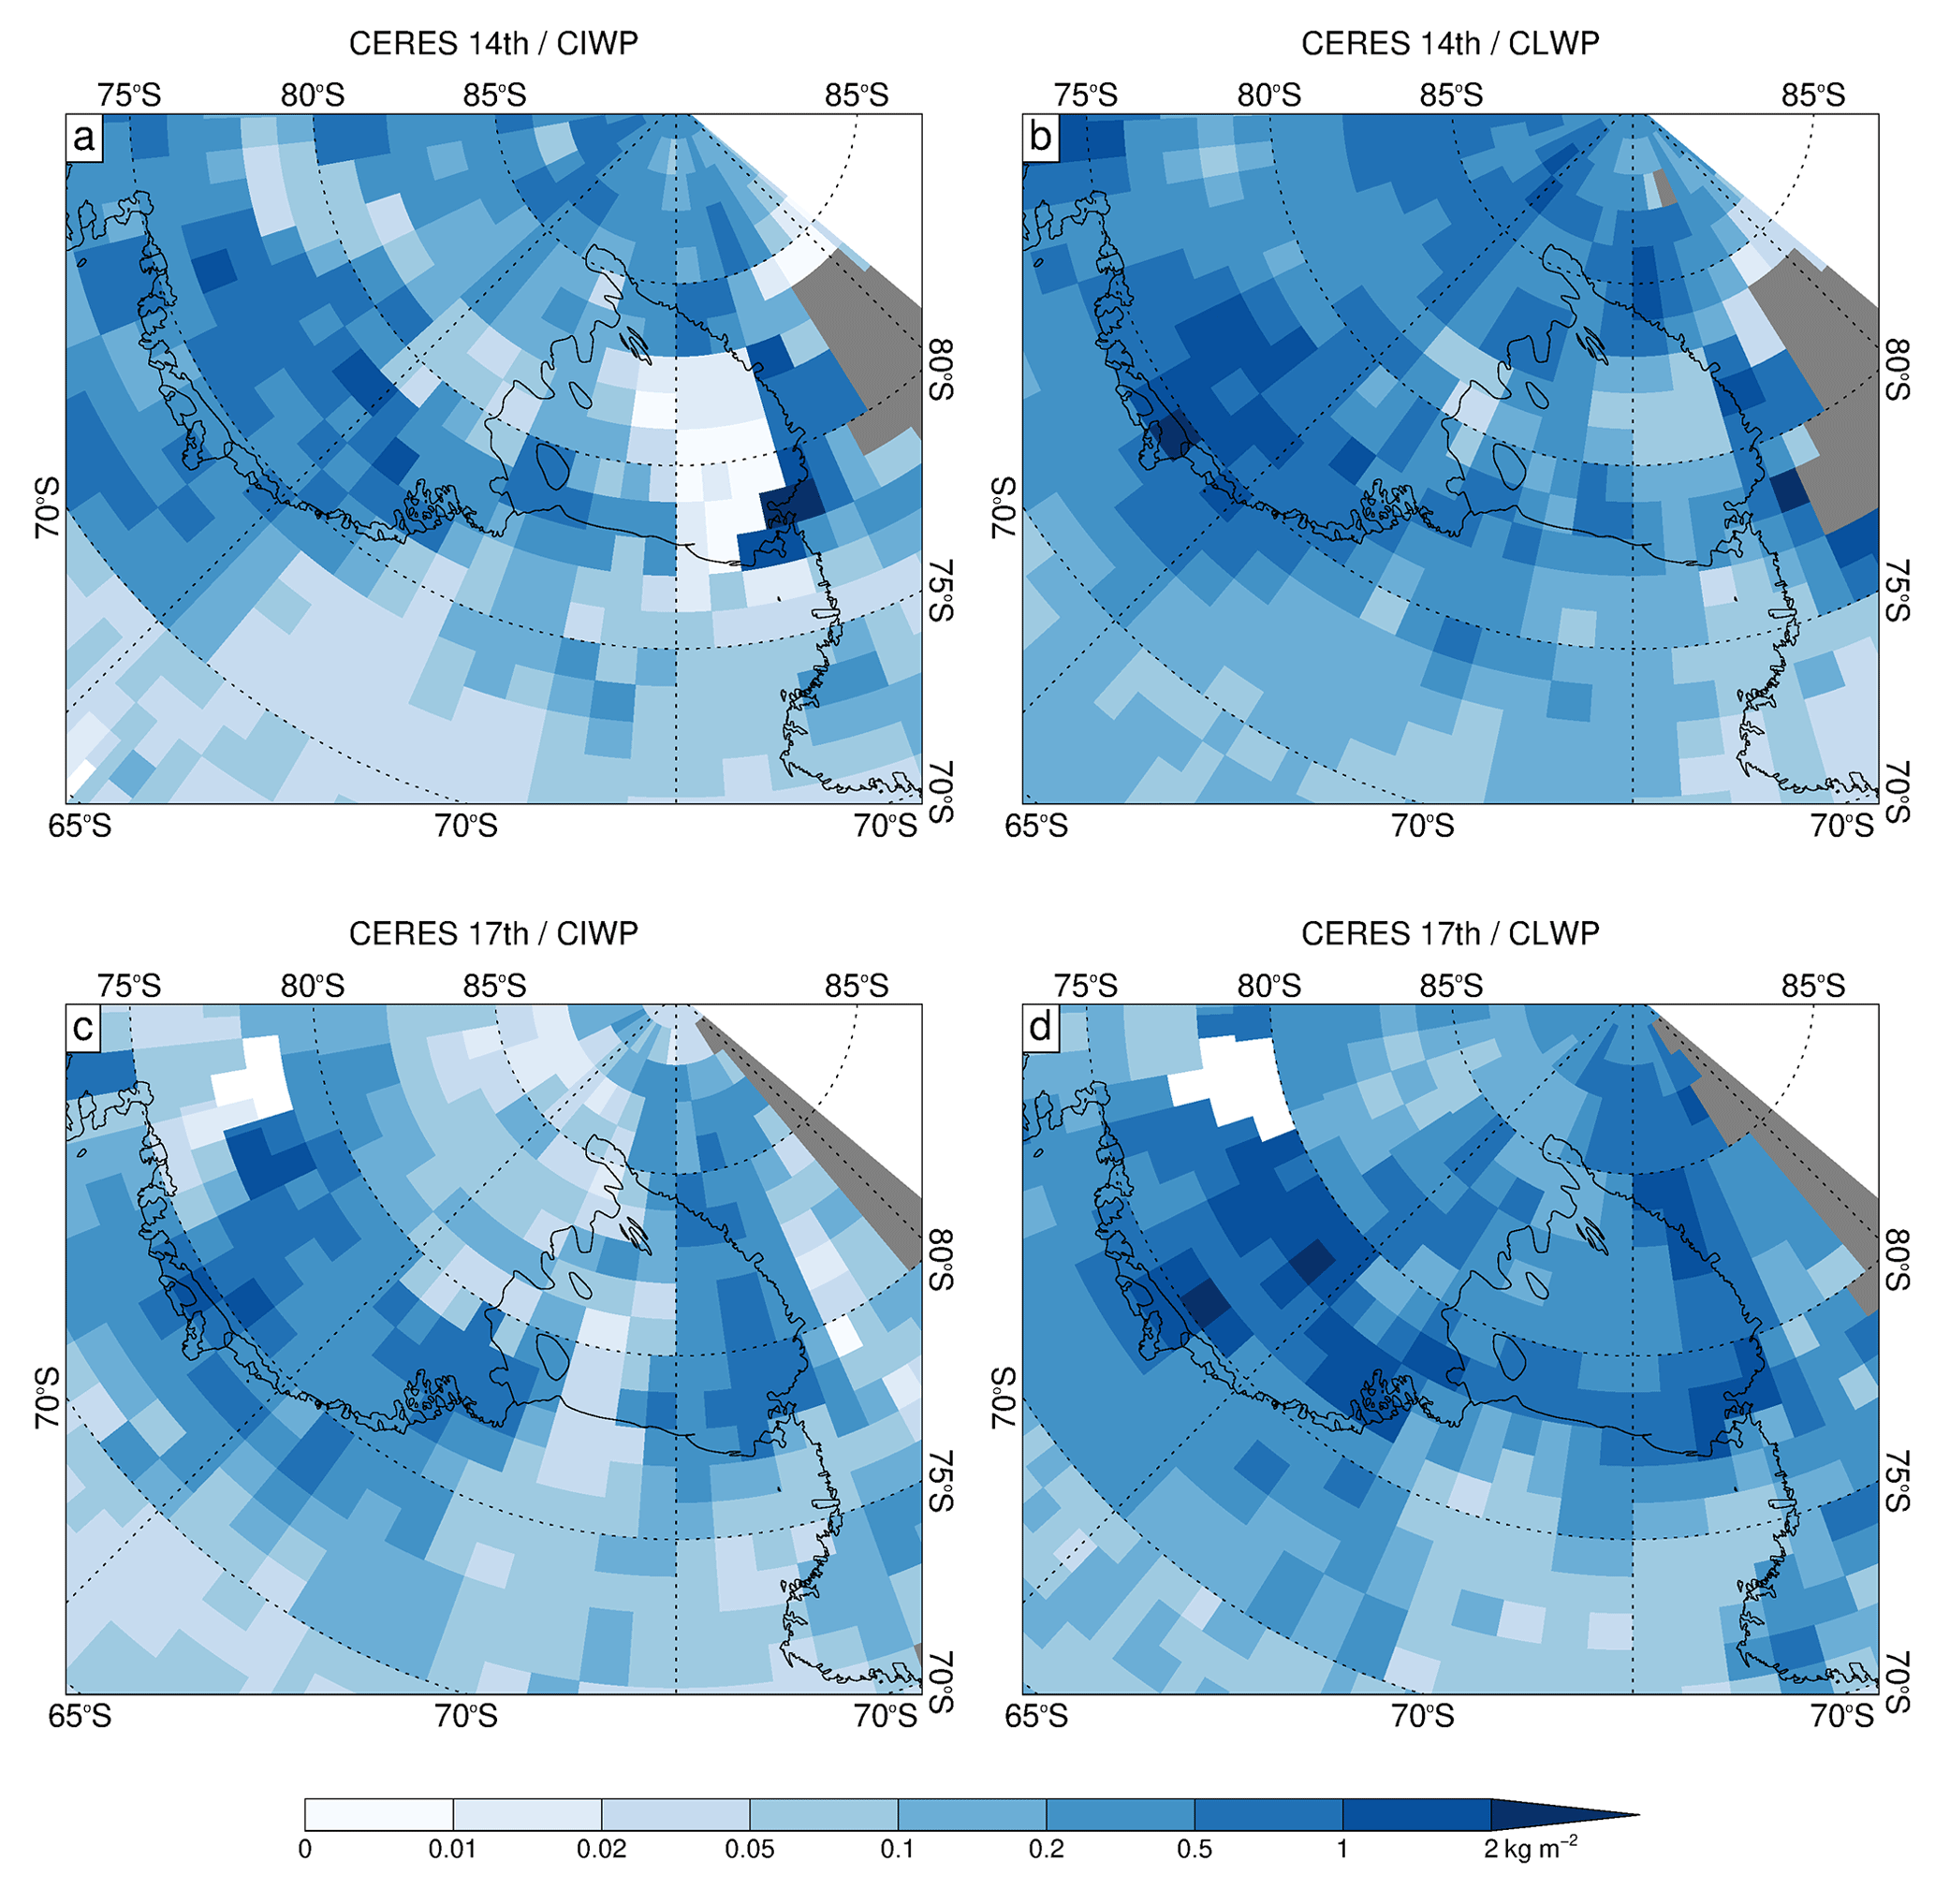
Figure 12Maps of West Antarctica showing the cloud ice water path (CIWP; left column; a, c; kg m−2) and cloud liquid water path (CLWP; right column; b, d; kg m−2) at 12:00 UTC on 14 January 2016 (top row; a, b) and 12:00 UTC on 17 January 2016 (bottom row; c, d) from CERES observations based on 3-hourly averages. Note that 12:00 UTC is equivalent to 00:00 LT over the Ross Ice Shelf.
The distinct melt-free region that is observed over the western sector of the RIS from the 16 to 18 January (Fig. 3) coincides with observations from MODIS showing cloudy conditions (Fig. 9f). Observations from CALIPSO and CERES show that these cloud conditions are characterized by both liquid water and ice water clouds (Figs. 10 and 12). However, the firn models erroneously simulate sustained melting over this region or period, which is attributed to HIRHAM5 and MetUM simulating an excessive increase in night-time downwelling LW flux from around 180–200 to 280 W m−2 over the course of a few days (Fig. 5), leading to an excessive amount of energy at the surface available for melt. Moreover, although both HIRHAM5 and MetUM capture the cloudy conditions over the western sector of the RIS on 17 January, they likely both have deficiencies in the representation of cloud phase (Fig. 11). In particular, for this event the MetUM simulates much higher amounts of cloud ice water over the western sector of the RIS compared to cloud liquid water (Fig. 11), which is in disagreement with both CALIPSO and CERES observations suggesting that both phases are important (Figs. 10 and 12).
Discrepancies in cloud liquid and ice water paths between the satellites and models may arise from uncertainties associated with the observations. For example, two downsides of CERES are its low spatial resolution and that occasionally cloud properties are missing – this is dealt with by interpolating from the nearest time steps (CERES, 2021a). In addition, uncertainties in CALIPSO's cloud phase identification can arise from multiple scattering by water clouds, which results in significant depolarization, and horizontally oriented ice particles that are nearly non-depolarized (Hu et al., 2009). Therefore, CALIPSO may introduce uncertainties to the vertical profile of cloud phases, including the presence of “ice or unknown” phases above the surface melting area over the RIS (Fig. 10b). Similarly, mixed-phase clouds, like those indicated by the CALIPSO measurements for the 16 to 18 January, are notoriously difficult to simulate accurately in climate models (Bodas-Salcedo et al., 2012; Furtado et al., 2016). However, the discrepancies between the CERES and MetUM estimates of cloud liquid water path on 17 January are extremely large (MetUM estimates are 2 orders of magnitude lower than CERES), which suggests that discrepancies result from MetUM severely underestimating cloud liquid water and not from uncertainties in the observations.
However, if the larger amounts of cloud liquid water that are observed by CALIPSO and CERES on 17 January had been simulated by HIRHAM5 and MetUM, then the models would likely be associated with even larger downwelling surface LW fluxes (Zhang et al., 1996). If this was the case, the associated additional surface melting would be inconsistent with the passive microwave measurements, showing that the western portion of the RIS was melt-free during this time. This therefore suggests that other factors, in addition to ice-to-liquid partitioning of cloud water, could be poorly represented by the models and result in an overestimation of night-time net surface radiative flux. For example, issues in simulating cloud microphysics may affect other microphysical and macrophysical properties of the clouds that we have not been able to assess here, such as cloud temperature and altitude, and cloud microphysical properties like the size of water droplets or ice crystals. Unfortunately, neither AWS radiation measurements, satellite cloud products, nor vertically resolved model output fields are available to explicitly assess these errors.
Addressing such deficiencies in cloud schemes will require an increased number of well-instrumented Antarctic stations that are able to comprehensively measure radiation and cloud properties (Lubin et al., 2020; Zhang et al., 2023). Efforts are underway to improve the surface observation network to have full four-component radiation measurements, which will also require maintenance to ensure sufficient measurement quality for use in future studies. A similar study focusing on melt events that include such measurements would be worthwhile. For example, by repeating the MetUM simulations using its recently developed double-moment microphysics scheme, we could examine whether model upgrades could improve the representation of cloud microphysical properties (Field et al., 2023). Additionally, more information on the phase of clouds in Antarctica and their vertical structure using flight campaigns are also required. Novel attempts to measure the amount of cloud liquid water and ice water using radiosondes have recently been developed and are suitable for use in Antarctica (Smith et al., 2019).
Previous studies have already shown that the MetUM has deficiencies in its representation of complex mixed-phase clouds, particularly related to it simulating Antarctic clouds that contain too much ice water content and not enough liquid water content (Gilbert et al., 2020). Other regional atmospheric models also struggle with correctly simulating cloud microphysical processes in such complex regimes (Bodas-Salcedo et al., 2012; Abel et al., 2017; Hyder et al., 2018). Moreover, the representation of cloud properties in general is a long-standing problem in both regional and global atmospheric models despite work to improve parameterizations (van Wessem et al., 2014, 2018; Lenaerts et al., 2017c; Hines et al., 2019). For example, the parameterization of sub-grid-scale cloud processes and cloud phase partitioning is improved by using higher-resolution grids, but significant biases remain in global and regional models that contribute to SEB biases, particularly over the Southern Ocean (Bodas-Salcedo et al., 2014; Schuddeboom and McDonald, 2021) but also over ice shelves (King et al., 2015; Gilbert et al., 2020). Additionally, Gilbert et al. (2020) highlighted the need to improve phase partitioning throughout the vertical profile, as poor representation of cloud layers can also create biases considerable enough to affect surface melting.
The impact of cloud properties on melt has also been studied in Greenland and over Arctic sea ice, where similar biases in atmospheric models have been identified (Van Tricht et al., 2016; Lenaerts et al., 2017a, 2020; Huang et al., 2019). Improving cloud parameterization schemes will therefore likely improve the representation of Arctic as well as Antarctic melt.
This study examines the representation of an extensive melt event that occurred over the RIS during January 2016 by the HIRHAM5 and MetUM high-resolution regional atmospheric models, as well as a physically based, multi-layer, offline-coupled firn model forced by both HIRHAM5 and MetUM output. The results show that both the HIRHAM5 and MetUM simulations considerably underestimated the number of melt days that occurred during the event, which is likely due to both limitations in their own ice and snow surface schemes and an absence of spin-up. However, using HIRHAM5 and MetUM output to force the offline-coupled firn model resulted in a considerable improvement in modelled melt. Although the firn model represents the firn layer in a sophisticated manner, including processes such as meltwater percolation, retention, and refreezing, the considerable improvement in the simulation of the melt event by this model is also likely due to it being adequately spun up to ensure a realistic representation of snow and firn properties. However, despite its sophistication, the offline-coupled firn model was unable to realistically represent the complete melt pattern over the RIS, and in particular the distinct melt-free region that occurs over the western sector of the RIS from the 16 to 18 January.
We speculate that the sustained melting over the western sector of the RIS that is wrongly simulated by the firn model originates from the HIRHAM5 and MetUM output used for forcing. In particular, both models erroneously simulate zero or positive values of night-time and minimum net surface radiation flux (and associated SEB) over the western sector of the RIS during this period, which is broadly consistent with an absence of freezing. This results from models simulating a considerable increase in surface downwelling LW flux from around 180 to 200 W m−2 to around 280 W m−2 over the course of a few days, leading to an excessive amount of energy at the surface available for melt. Our results suggest that deficiencies in cloud properties by HIRHAM5 and MetUM, in addition to ice-to-liquid partitioning of cloud water, are likely to be partly responsible for the misrepresentation of surface downwelling LW flux and surface melting over the western RIS and not deficiencies in their representation of cloud cover. Other possible factors include the misrepresentation of cloud temperature, cloud altitude, and the size of water droplets or ice crystals.
This study emphasizes the complexity of the processes governing ice shelf melt and the need for further detailed in-situ measurements of radiative flux and cloud properties over Antarctic ice shelves to better understand these processes and improve their representation in models. It particularly highlights the urgent need for improvement in the representation of cloud phase partitioning in models.
The satellite-based melt data used in this study are available at the following link: https://doi.org/10.5285/ffd24dd7-e201-4a02-923f-038680bf7bb5 (Nicolas, 2018). The MODIS, CERES, and CALIPSO data are available from NASA (National Aeronautics and Space Administration). The MODIS data are available at the following link: https://doi.org/10.5067/MODIS/MOD06_L2.006 (Platnick et al., 2015). The CERES data are available at the following link: https://ceres-tool.larc.nasa.gov/ord-tool/jsp/SYN1degEd41Selection.jsp (CERES, 2021b). The CALIPSO data are available at the following link: https://doi.org/10.5067/IIR/CALIPSO/CAL_IIR_L2_Swath-Standard-V4-51 (NASA/LARC/SD/ASDC, 2023). The AWS data are available at the following links for (a) Sabrina https://doi.org/10.48567/y3s5-3864 (Antarctic Meteorological Research and Data Center, 2016a); (b) Elaine https://doi.org/10.48567/tytb-dk68 (Antarctic Meteorological Research and Data Center, 2016b); (c) Marilyn https://doi.org/10.48567/kxn6-6246 (Antarctic Meteorological Research and Data Center, 2016c); and (d) Schwerdtfeger https://doi.org/10.48567/96v9-mz68 (Antarctic Meteorological Research and Data Center, 2016d). The model output from the HIRHAM5, MetUM, and offline-coupled firn model simulations are available at the following link: https://doi.org/10.5281/zenodo.8355571 (Hansen et al., 2023).
NH and AO conceived the study. NH, AO, and FB ran the model simulations. NH, AO, XZ, and TP analysed the data. NH, AO, and XZ wrote the initial draft. TJB, EG, PLL, RM, RP, SW, MAL, and SBS contributed to analysis of the results and reviewing the writing.
At least one of the (co-)authors is a member of the editorial board of The Cryosphere. The peer-review process was guided by an independent editor, and the authors also have no other competing interests to declare.
Publisher’s note: Copernicus Publications remains neutral with regard to jurisdictional claims made in the text, published maps, institutional affiliations, or any other geographical representation in this paper. While Copernicus Publications makes every effort to include appropriate place names, the final responsibility lies with the authors.
We are grateful for the expert comments by two anonymous referees, as well as the editor, on an earlier version of this article, which significantly improved it.
Andrew Orr, Ruth Mottram, Ella Gilbert, and Ruth Price received support from the European Union’s Horizon 2020 research and innovation framework programme under grant agreement no. 101003590 (PolarRES). Andrew Orr and Thomas J. Bracegirdle received support from the Natural Environment Research Council (NERC) National Capability International grant SURface FluxEs In AnTarctica (NE/X009319/1). Xun Zou received support from National Science Foundation (NSF) (grant no. 2229392). Peter L. Langen gratefully acknowledges the financial contributions of Aarhus University Interdisciplinary Centre for Climate Change (iClimate, Aarhus University). Matthew A. Lazzara received support from the US National Science Foundation (grant nos. 1924730 and 1951603). Additional work by Nicolaj Hansen and Ruth Mottram is supported by the Danish State through the National Centre for Climate Research (NCKF); furthermore, Nicolaj Hansen has been supported by the Novo Nordisk Foundation project PRECISE (grant no. NNF23OC0081251).
This paper was edited by Brice Noël and reviewed by two anonymous referees.
Abel, S. J., Boutle, I. A., Waite, K., Fox, S., Brown, P. R., Cotton, R., Lloyd, G., Choularton, T. W., and Bower, K. N.: The role of precipitation in controlling the transition from stratocumulus to cumulus clouds in a Northern Hemisphere cold-air outbreak, J. Atmos. Sci., 74, 2293–2314, https://doi.org/10.1175/JAS-D-16-0362.1, 2017. a, b, c
Antarctic Meteorological Research and Data Center: Sabrina Automatic Weather Station, 2016 quality-controlled observational data, AMRDC Data Repository [data set], https://doi.org/10.48567/y3s5-3864, 2016a. a
Antarctic Meteorological Research and Data Center: Elaine Automatic Weather Station, 2016 quality-controlled observational data, AMRDC Data Repository [data set], https://doi.org/10.48567/tytb-dk68, 2016b. a
Antarctic Meteorological Research and Data Center: Marilyn Automatic Weather Station, 2016 quality-controlled observational data, AMRDC Data Repository [data set], https://doi.org/10.48567/kxn6-6246, 2016c. a
Antarctic Meteorological Research and Data Center: Schwerdtfeger Automatic Weather Station, 2016 quality-controlled observational data, AMRDC Data Repository [data set], https://doi.org/10.48567/96v9-mz68, 2016d. a
Barrett, A. I., Hogan, R. J., and Forbes, R. M.: Why are mixed-phase altocumulus clouds poorly predicted by large-scale models? Part 1. Physical processes, J. Geophys. Res.-Atmos., 122, 9903–9926, https://doi.org/10.1002/2016JD026321, 2017. a
Best, M. J., Pryor, M., Clark, D. B., Rooney, G. G., Essery, R. L. H., Ménard, C. B., Edwards, J. M., Hendry, M. A., Porson, A., Gedney, N., Mercado, L. M., Sitch, S., Blyth, E., Boucher, O., Cox, P. M., Grimmond, C. S. B., and Harding, R. J.: The Joint UK Land Environment Simulator (JULES), model description – Part 1: Energy and water fluxes, Geosci. Model Dev., 4, 677–699, https://doi.org/10.5194/gmd-4-677-2011, 2011. a, b, c, d
Boberg, F., Mottram, R., Hansen, N., Yang, S., and Langen, P. L.: Uncertainties in projected surface mass balance over the polar ice sheets from dynamically downscaled EC-Earth models, The Cryosphere, 16, 17–33, https://doi.org/10.5194/tc-16-17-2022, 2022. a
Bodas-Salcedo, A., Williams, K., Field, P., and Lock, A.: The surface downwelling solar radiation surplus over the Southern Ocean in the Met Office model: The role of midlatitude cyclone clouds, J. Climate, 25, 7467–7486, https://doi.org/10.1175/JCLI-D-11-00702.1, 2012. a, b, c
Bodas-Salcedo, A., Williams, K. D., Ringer, M. A., Beau, I., Cole, J. N., Dufresne, J.-L., Koshiro, T., Stevens, B., Wang, Z., and Yokohata, T.: Origins of the solar radiation biases over the Southern Ocean in CFMIP2 models, J. Climate, 27, 41–56, https://doi.org/10.1175/JCLI-D-13-00169.1, 2014. a
Bozkurt, D., Rondanelli, R., Marín, J. C., and Garreaud, R.: Foehn event triggered by an atmospheric river underlies record-setting temperature along continental Antarctica, J. Geophys. Res.-Atmos., 123, 3871–3892, https://doi.org/10.1002/2017JD027796, 2018. a
Carter, J., Leeson, A., Orr, A., Kittel, C., and van Wessem, J. M.: Variability in Antarctic surface climatology across regional climate models and reanalysis datasets, The Cryosphere, 16, 3815–3841, https://doi.org/10.5194/tc-16-3815-2022, 2022. a
CERES: CERES and GEO-Enhanced TOA, Within-Atmosphere and Surface Fluxes, Clouds and Aerosols 3-Hourly Terra-Aqua Edition4A, CERES [data set], https://doi.org/10.5067/TERRA+AQUA/CERES/SYN1DEG-3HOUR_L3.004A, 2017. a, b
CERES: CERES_SYN1deg_Ed4A Data Quality Summary (4/8/2021), https://ceres.larc.nasa.gov/documents/DQ_summaries/CERES_SYN1deg_Ed4A_DQS.pdf (last access: 1 December 2022), 2021a. a
CERES: CERES_SYN1deg_Ed4A Data Quality Summary (4/8/2021), CERES [data set], https://ceres-tool.larc.nasa.gov/ord-tool/jsp/SYN1degEd41Selection.jsp (last access: 1 December 2022), 2021b. a
Christensen, O. B., Drews, M., Christensen, J. H., Dethloff, K., Ketelsen, K., Hebestadt, I., and Rinke, A.: The HIRHAM regional climate model. Version 5 (beta), Technical Report, https://backend.orbit.dtu.dk/ws/portalfiles/portal/51950450/HIRHAM.pdf (last access: June 2023), 2007. a
Coggins, J. H., McDonald, A. J., and Jolly, B.: Synoptic climatology of the Ross Ice Shelf and Ross Sea region of Antarctica: k-means clustering and validation, Int. J. Climatol., 34, 2330–2348, https://doi.org/10.1002/joc.3842, 2014. a
Deb, P., Orr, A., Bromwich, D. H., Nicolas, J. P., Turner, J., and Hosking, J. S.: Summer drivers of atmospheric variability affecting ice shelf thinning in the Amundsen Sea Embayment, West Antarctica, Geophys. Res. Lett., 45, 4124–4133, https://doi.org/10.1029/2018GL077092, 2018. a, b
Dee, D. P., Uppala, S. M., Simmons, A. J., Berrisford, P., Poli, P., Kobayashi, S., Andrae, U., Balmaseda, M. A., Balsamo, G., Bauer, P., Bechtold, P., Beljaars, A. C. M., van de Berg, L., Bidlot, J., Bormann, N., Delsol, C., Dragani, R., Fuentes, M., Geer, A. J., Haimberger, L., Healy, S. B., Hersbach, H., Hólm, E. V., Isaksen, L., Kållberg, P., Köhler, M., Matricardi, M., McNally, A. P., Monge-Sanz, B. M., Morcrette, J.-J., Park, B.-K., Peubey, C., de Rosnay, P., Tavolato, C., Thépaut, J.-N., and Vitart, F.: The ERA-Interim reanalysis: Configuration and performance of the data assimilation system, Q. J. Roy. Meteor. Soc., 137, 553–597, https://doi.org/10.1002/qj.828, 2011. a
de Roda Husman, S., Lhermitte, S., Bolibar, J., Izeboud, M., Hu, Z., Shukla, S., van der Meer, M., Long, D., and Wouters, B.: A high-resolution record of surface melt on Antarctic ice shelves using multi-source remote sensing data and deep learning, Remote Sens. Environ., 301, 113950, https://doi.org/10.1016/j.rse.2023.113950, 2024. a
Donat-Magnin, M., Jourdain, N. C., Gallée, H., Amory, C., Kittel, C., Fettweis, X., Wille, J. D., Favier, V., Drira, A., and Agosta, C.: Interannual variability of summer surface mass balance and surface melting in the Amundsen sector, West Antarctica, The Cryosphere, 14, 229–249, https://doi.org/10.5194/tc-14-229-2020, 2020. a
Dupont, T. and Alley, R.: Assessment of the importance of ice-shelf buttressing to ice-sheet flow, Geophys. Res. Lett., 32, https://doi.org/10.1029/2004GL022024, 2005. a
Feron, S., Cordero, R. R., Damiani, A., Malhotra, A., Seckmeyer, G., and Llanillo, P.: Warming events projected to become more frequent and last longer across Antarctica, Scientific Reports, 11, 19564, https://doi.org/10.1038/s41598-021-98619-z, 2021. a
Field, P. R., Hill, A., Shipway, B., Furtado, K., Wilkinson, J., Miltenberger, A., Gordon, H., Grosvenor, D. P., Stevens, R., and Van Weverberg, K.: Implementation of a double moment cloud microphysics scheme in the UK met office regional numerical weather prediction model, Q. J. Roy. Meteor. Soc., 149, 703–739, https://doi.org/10.1002/qj.4414, 2023. a
Firn Symposium team: Firn on ice sheets, Nature Reviews Earth & Environment, 5, 79–99, https://doi.org/10.1038/s43017-023-00507-9, 2024. a
Fox-Kemper, B., Hewitt, H., C. Xiao, G. A., S.S. Drijfhout, T. E., Golledge, N., M. Hemer, R. K., Krinner, G., Mix, A., Notz, D., Nowicki, S., Nurhati, I., Ruiz, L., Sallée, J.-B., Slangen, A., and Yu, Y.: Ocean, Cryosphere and Sea Level Change. In Climate Change 2021: The Physical Science Basis. Contribution of Working Group I to the Sixth Assessment Report of the Intergovernmental Panel on Climate Change, 1211–1362, https://doi.org/10.1017/9781009157896.011, 2021. a
Furtado, K., Field, P., Boutle, I., Morcrette, C., and Wilkinson, J.: A physically based subgrid parameterization for the production and maintenance of mixed-phase clouds in a general circulation model, Journal of the Atmospheric Sciences, 73, 279–291, https://doi.org/10.1175/JAS-D-15-0021.1, 2016. a, b
Gilbert, E. and Kittel, C.: Surface melt and runoff on Antarctic ice shelves at 1.5 °C, 2 °C, and 4 °C of future warming, Geophys. Res. Lett., 48, e2020GL091733, https://doi.org/10.1029/2020GL091733, 2021. a
Gilbert, E., Orr, A., King, J. C., Renfrew, I., Lachlan-Cope, T., Field, P., and Boutle, I.: Summertime cloud phase strongly influences surface melting on the Larsen C ice shelf, Antarctica, Q. J. Roy. Meteor. Soc., 146, 1575–1589, https://doi.org/10.1002/qj.3753, 2020. a, b, c, d, e, f, g
Gilbert, E., Orr, A., Renfrew, I. A., King, J. C., and Lachlan-Cope, T.: A 20-Year Study of Melt Processes Over Larsen C Ice Shelf Using a High-Resolution Regional Atmospheric Model: 2. Drivers of Surface Melting, J. Geophys. Res.-Atmos., 127, e2021JD036012, https://doi.org/10.1002/essoar.10508261.1, 2022. a
Hansen, N., Langen, P. L., Boberg, F., Forsberg, R., Simonsen, S. B., Thejll, P., Vandecrux, B., and Mottram, R.: Downscaled surface mass balance in Antarctica: impacts of subsurface processes and large-scale atmospheric circulation, The Cryosphere, 15, 4315–4333, https://doi.org/10.5194/tc-15-4315-2021, 2021. a
Hansen, N., Orr, A., Zou, X., Boberg, F., Bracegirdle, T. J., Gilbert, E., Langen, P. L., Lazzara, M. A., Mottram, R., Phillips, T., Price, R., Simonsen, S. B., and Webster, S.: Data for The importance of cloud phase when assessing surface melting in an offline coupled firn model over Ross Ice shelf, West Antarctica, Zenodo [data set], https://doi.org/10.5281/zenodo.8355571, 2023. a
Heinemann, G., Glaw, L., and Willmes, S.: A satellite-based climatology of wind-induced surface temperature anomalies for the Antarctic, Remote Sensing, 11, 1539, https://doi.org/10.3390/rs11131539, 2019. a
Hines, K. M., Bromwich, D. H., Wang, S.-H., Silber, I., Verlinde, J., and Lubin, D.: Microphysics of summer clouds in central West Antarctica simulated by the Polar Weather Research and Forecasting Model (WRF) and the Antarctic Mesoscale Prediction System (AMPS), Atmos. Chem. Phys., 19, 12431–12454, https://doi.org/10.5194/acp-19-12431-2019, 2019. a
Hinkelman, L. M. and Marchand, R.: Evaluation of CERES and CloudSat Surface Radiative Fluxes Over Macquarie Island, the Southern Ocean, Earth Space and Science, 7, e2020EA001224, https://doi.org/10.1029/2020EA001224, 2020. a
Hu, Y., Winker, D., Vaughan, M., Lin, B., Omar, A., Trepte, C., Flittner, D., Yang, P., Nasiri, S. L., Baum, B., Holz, R., Sun, W., Liu, Z., Wang, Z., Young, S., Stamnes, K., Huang, J., and Kuehn, R.: CALIPSO/CALIOP cloud phase discrimination algorithm, J. Atmos. Ocean. Tech., 26, 2293–2309, https://doi.org/10.1175/2009JTECHA1280.1, 2009. a, b
Huang, Y., Dong, X., Bailey, D. A., Holland, M. M., Xi, B., DuVivier, A. K., Kay, J. E., Landrum, L. L., and Deng, Y.: Thicker clouds and accelerated Arctic sea ice decline: The atmosphere-sea ice interactions in spring, Geophys. Res. Lett., 46, 6980–6989, https://doi.org/10.1029/2019GL082791, 2019. a
Hyder, P., Edwards, J. M., Allan, R. P., Hewitt, H. T., Bracegirdle, T. J., Gregory, J. M., Wood, R. A., Meijers, A. J., Mulcahy, J., Field, P., Furtado, K., Bodas-Salcedo, A., Williams, K. D., Copsey, D., Josey, S. A., Liu, C., Roberts, C. D., Sanchez, C., Ridley, J., Thorpe, L., Hardiman, S. C., Mayer, M., Berry, D. I., and Belcher, S. E.: Critical Southern Ocean climate model biases traced to atmospheric model cloud errors, Nat. Commun., 9, 3625, https://doi.org/10.1038/s41467-018-05634-2, 2018. a, b
Inoue, J., Sato, K., Rinke, A., Cassano, J. J., Fettweis, X., Heinemann, G., Matthes, H., Orr, A., Phillips, T., Seefeldt, M., Solomon, A., and Webster, S.: Clouds and radiation processes in regional climate models evaluated using observations over the ice-free Arctic Ocean, J. Geophys. Res.-Atmos., 126, e2020JD033904, https://doi.org/10.1029/2020JD033904, 2021. a
Jakobs, C. L., Reijmer, C. H., van den Broeke, M. R., Van de Berg, W., and Van Wessem, J.: Spatial Variability of the Snowmelt-Albedo Feedback in Antarctica, J. Geophys. Res.-Earth, 126, e2020JF005696, https://doi.org/10.1029/2020JF005696, 2021. a, b
Johnson, A., Fahnestock, M., and Hock, R.: Evaluation of passive microwave melt detection methods on Antarctic Peninsula ice shelves using time series of Sentinel-1 SAR, Remote Sens. Environ., 250, 112044, https://doi.org/10.1016/j.rse.2020.112044, 2020. a
Johnson, A., Hock, R., and Fahnestock, M.: Spatial variability and regional trends of Antarctic ice shelf surface melt duration over 1979–2020 derived from passive microwave data, J. Glaciol., 68, 533–546, https://doi.org/10.1017/jog.2021.112, 2022. a
Keenan, E., Wever, N., Dattler, M., Lenaerts, J. T. M., Medley, B., Kuipers Munneke, P., and Reijmer, C.: Physics-based SNOWPACK model improves representation of near-surface Antarctic snow and firn density, The Cryosphere, 15, 1065–1085, https://doi.org/10.5194/tc-15-1065-2021, 2021. a, b
Kim, S., Park, S., and Shin, J.: Impact of subgrid variation of water vapor on longwave radiation in a general circulation model, J. Adv. Model. Earth Sy., 12, e2019MS001926, https://doi.org/10.1029/2019MS001926, 2020. a
King, J., Gadian, A., Kirchgaessner, A., Kuipers Munneke, P., Lachlan-Cope, T., Orr, A., Reijmer, C., Van Den Broeke, M., Van Wessem, J., and Weeks, M.: Validation of the summertime surface energy budget of Larsen C Ice Shelf (Antarctica) as represented in three high-resolution atmospheric models, J. Geophys. Res.-Atmos., 120, 1335–1347, https://doi.org/10.1002/2014JD022604, 2015. a, b
Kingslake, J., Ely, J. C., Das, I., and Bell, R. E.: Widespread movement of meltwater onto and across Antarctic ice shelves, Nature, 544, 349–352, https://doi.org/10.1038/nature22049, 2017. a
Kittel, C., Amory, C., Agosta, C., Jourdain, N. C., Hofer, S., Delhasse, A., Doutreloup, S., Huot, P.-V., Lang, C., Fichefet, T., and Fettweis, X.: Diverging future surface mass balance between the Antarctic ice shelves and grounded ice sheet, The Cryosphere, 15, 1215–1236, https://doi.org/10.5194/tc-15-1215-2021, 2021. a
Kretzschmar, J., Stapf, J., Klocke, D., Wendisch, M., and Quaas, J.: Employing airborne radiation and cloud microphysics observations to improve cloud representation in ICON at kilometer-scale resolution in the Arctic, Atmos. Chem. Phys., 20, 13145–13165, https://doi.org/10.5194/acp-20-13145-2020, 2020. a
Kuipers Munneke, P., Ligtenberg, S. R., Van Den Broeke, M. R., and Vaughan, D. G.: Firn air depletion as a precursor of Antarctic ice-shelf collapse, J. Glaciol., 60, 205–214, https://doi.org/10.3189/2014JoG13J183, 2014. a, b
Langen, P. L., Mottram, R. H., Christensen, J. H., Boberg, F., Rodehacke, C. B., Stendel, M., van As, D., Ahlstrøm, A. P., Mortensen, J., Rysgaard, S., Petersen, D., Svendsen, K. H., Aðalgeirsdóttir, G., and Cappelen, J.: Quantifying energy and mass fluxes controlling Godthåbsfjord freshwater input in a 5-km simulation (1991–2012), J. Climate, 28, 3694–3713, https://doi.org/10.1175/JCLI-D-14-00271.1, 2015. a, b, c
Langen, P. L., Fausto, R. S., Vandecrux, B., Mottram, R. H., and Box, J. E.: Liquid water flow and retention on the Greenland ice sheet in the regional climate model HIRHAM5: Local and large-scale impacts, Frontiers in Earth Science, 4, 110, https://doi.org/10.3389/feart.2016.00110, 2017. a, b, c, d, e
Lawson, R. P. and Gettelman, A.: Impact of Antarctic mixed-phase clouds on climate, P. Natl. Acad. Sci. USA, 111, 18156–18161, https://doi.org/10.1073/pnas.1418197111, 2014. a
Lazzara, M. A., Weidner, G. A., Keller, L. M., Thom, J. E., and Cassano, J. J.: Antarctic automatic weather station program: 30 years of polar observation, B. Am. Meteorol. Soc., 93, 1519–1537, https://doi.org/10.1175/BAMS-D-11-00015.1, 2012. a
Lenaerts, J. T. M., Lhermitte, S., Drews, R., Ligtenberg, S. R. M., Berger, S., Helm, V., Smeets, C. J. P. P., van den Broeke, M. R., van de Berg, W. J., van Meijgaard, E., Eijkelboom, M., Eisen, O., and Pattyn, F.: Meltwater produced by wind–albedo interaction stored in an East Antarctic ice shelf, Nat. Clim. Change, 7, 58–62, https://doi.org/10.1038/nclimate3180, 2017a. a, b
Lenaerts, J. T., Ligtenberg, S. R., Medley, B., Van de Berg, W. J., Konrad, H., Nicolas, J. P., Van Wessem, J. M., Trusel, L. D., Mulvaney, R., Tuckwell, R. J., Hogg, A. E., and Thomas, E. R.: Climate and surface mass balance of coastal West Antarctica resolved by regional climate modelling, Ann. Glaciol., 59, 29–41, https://doi.org/10.1017/aog.2017.42, 2017b. a, b
Lenaerts, J. T., Van Tricht, K., Lhermitte, S., and L'Ecuyer, T. S.: Polar clouds and radiation in satellite observations, reanalyses, and climate models, Geophys. Res. Lett., 44, 3355–3364, https://doi.org/10.1002/2016GL072242, 2017c. a
Lenaerts, J. T., Gettelman, A., Van Tricht, K., van Kampenhout, L., and Miller, N. B.: Impact of cloud physics on the Greenland ice sheet Near-Surface climate: A study with the Community Atmosphere Model, J. Geophys. Res.-Atmos., 125, e2019JD031470, https://doi.org/10.1029/2019JD031470, 2020. a
Li, W., Wu, Y., and Hu, X.: The Processes-Based Attributes of Four Major Surface Melting Events over the Antarctic Ross Ice Shelf, Adv. Atmos. Sci., 40, 1662–1670, https://doi.org/10.1007/s00376-023-2287-3, 2023. a
Lo, J. C.-F., Yang, Z.-L., and Pielke Sr, R. A.: Assessment of three dynamical climate downscaling methods using the Weather Research and Forecasting (WRF) model, J. Geophys. Res.-Atmos., 113, D09112, https://doi.org/10.1029/2007JD009216, 2008. a
Loeb, N., Su, W., Doelling, D., Wong, T., Minnis, P., Thomas, S., and Miller, W.: 5.03 – Earth’s Top-of-Atmosphere Radiation Budget, in: Comprehensive Remote Sensing, edited by: Liang, S., Elsevier, Oxford, 67–84, ISBN 978-0-12-803221-3, https://doi.org/10.1016/B978-0-12-409548-9.10367-7, 2018. a
Lubin, D., Zhang, D., Silber, I., Scott, R. C., Kalogeras, P., Battaglia, A., Bromwich, D. H., Cadeddu, M., Eloranta, E., Fridlind, A., Frossard, A., Hines, K. M., Kneifel, S., Leaitch, W. R., Lin, W., Nicolas, J., Powers, H., Quinn, P. K., Rowe, P., Russell, L. M., Sharma, S., Verlinde, J., and Vogelmann, A. M.: AWARE: The atmospheric radiation measurement (ARM) west Antarctic radiation experiment, B. Am. Meteorol. Soc., 101, E1069–E1091, https://doi.org/10.1175/BAMS-D-18-0278.1, 2020. a
McCusker, G. Y., Vüllers, J., Achtert, P., Field, P., Day, J. J., Forbes, R., Price, R., O'Connor, E., Tjernström, M., Prytherch, J., Neely III, R., and Brooks, I. M.: Evaluating Arctic clouds modelled with the Unified Model and Integrated Forecasting System, Atmos. Chem. Phys., 23, 4819–4847, https://doi.org/10.5194/acp-23-4819-2023, 2023. a
Mottram, R., Boberg, F., Langen, P., Yang, S., Rodehacke, C., Christensen, J. H., and Madsen, M. S.: Surface mass balance of the Greenland ice sheet in the regional climate model HIRHAM5: Present state and future prospects, Low Temperature Science, 75, 105–115, https://doi.org/10.14943/lowtemsci.75.105, 2017. a
Mousavi, M., Colliander, A., Miller, J. Z., and Kimball, J. S.: A novel approach to map the intensity of surface melting on the Antarctica ice sheet using SMAP L-band microwave radiometry, IEEE J. Sel. Top. Appl., 15, 1724–1743, https://doi.org/10.1109/JSTARS.2022.3147430, 2022. a
NASA/LARC/SD/ASDC: CALIPSO Infrared Imaging Radiometer (IIR) Level 2 Swath, V4-51, NASA Langley Atmospheric Science Data Center DAAC [data set], https://doi.org/10.5067/IIR/CALIPSO/CAL_IIR_L2_Swath-Standard-V4-51, 2023. a
Nicolas, J.: Antarctic daily surface melt data estimated from SMMR, SSM/I, and SSMIS passive microwave observations, 1978–2016, Polar Data Centre, Natural Environment Research Council, UK [data set], https://doi.org/10.5285/ffd24dd7-e201-4a02-923f-038680bf7bb5, 2018. a
Nicolas, J. P. and Bromwich, D. H.: Climate of West Antarctica and influence of marine air intrusions, J. Climate, 24, 49–67, https://doi.org/10.1175/2010JCLI3522.1, 2011. a
Nicolas, J. P., Vogelmann, A. M., Scott, R. C., Wilson, A. B., Cadeddu, M. P., Bromwich, D. H., Verlinde, J., Lubin, D., Russell, L. M., Jenkinson, C., Powers, H. H., Ryczek, M., Stone, G., and Wille, J. D.: January 2016 extensive summer melt in West Antarctica favoured by strong El Niño, Nat. Commun., 8, 15799, https://doi.org/10.1038/ncomms15799, 2017. a, b, c, d, e, f, g, h, i, j
Orr, A., Cresswell, D., Marshall, G. J., Hunt, J. C., Sommeria, J., Wang, C.-G., and Light, M.: A “low-level” explanation for the recent large warming trend over the western Antarctic Peninsula involving blocked winds and changes in zonal circulation, Geophys. Res. Lett., 31, L06204, https://doi.org/10.1029/2003GL019160, 2004. a
Orr, A., Hunt, J. C., Capon, R., Sommeria, J., Cresswell, D., and Owinoh, A.: Coriolis effects on wind jets and cloudiness along coasts, Weather, 60, 291–299, https://doi.org/10.1256/wea.219.04, 2005. a
Orr, A., Phillips, T., Webster, S., Elvidge, A., Weeks, M., Hosking, S., and Turner, J.: Met Office Unified Model high-resolution simulations of a strong wind event in Antarctica, Q. J. Roy. Meteor. Soc., 140, 2287–2297, https://doi.org/10.1002/qj.2296, 2014. a
Orr, A., Deb, P., Clem, K. R., Gilbert, E., Bromwich, D. H., Boberg, F., Colwell, S., Hansen, N., Lazzara, M. A., Mooney, P. A., Mottram, R., Niwano, M., Phillips, T., Pishniak, D., Reijmer, C. H., van de Berg, W. J., Webster, S., and Zou, X.: Characteristics of surface “melt potential” over Antarctic ice shelves based on regional atmospheric model simulations of summer air temperature extremes from 1979/80 to 2018/19, J. Climate, 36, 3357–3383, https://doi.org/10.1175/JCLI-D-22-0386.1, 2023. a, b, c, d, e, f
Otosaka, I. N., Shepherd, A., Ivins, E. R., Schlegel, N.-J., Amory, C., van den Broeke, M. R., Horwath, M., Joughin, I., King, M. D., Krinner, G., Nowicki, S., Payne, A. J., Rignot, E., Scambos, T., Simon, K. M., Smith, B. E., Sørensen, L. S., Velicogna, I., Whitehouse, P. L., A, G., Agosta, C., Ahlstrøm, A. P., Blazquez, A., Colgan, W., Engdahl, M. E., Fettweis, X., Forsberg, R., Gallée, H., Gardner, A., Gilbert, L., Gourmelen, N., Groh, A., Gunter, B. C., Harig, C., Helm, V., Khan, S. A., Kittel, C., Konrad, H., Langen, P. L., Lecavalier, B. S., Liang, C.-C., Loomis, B. D., McMillan, M., Melini, D., Mernild, S. H., Mottram, R., Mouginot, J., Nilsson, J., Noël, B., Pattle, M. E., Peltier, W. R., Pie, N., Roca, M., Sasgen, I., Save, H. V., Seo, K.-W., Scheuchl, B., Schrama, E. J. O., Schröder, L., Simonsen, S. B., Slater, T., Spada, G., Sutterley, T. C., Vishwakarma, B. D., van Wessem, J. M., Wiese, D., van der Wal, W., and Wouters, B.: Mass balance of the Greenland and Antarctic ice sheets from 1992 to 2020, Earth Syst. Sci. Data, 15, 1597–1616, https://doi.org/10.5194/essd-15-1597-2023, 2023. a
Owinoh, A. Z., Hunt, J. C., Orr, A., Clark, P., Klein, R., Fernando, H., and Nieuwstadt, F. T.: Effects of changing surface heat flux on atmospheric boundary-layer flow over flat terrain, Bound.-Lay. Meteorol., 116, 331–361, https://doi.org/10.1007/s10546-004-2819-z, 2005. a
Picard, G., Fily, M., and Gallée, H.: Surface melting derived from microwave radiometers: a climatic indicator in Antarctica, Ann. Glaciol., 46, 29–34, https://doi.org/10.3189/172756407782871684, 2007. a
Platnick, S., Ackerman, S. A., King, M. D., Meyer, K., Menzel, W. P., Holz, R. E., Baum, B. A., and Yang, P.: MODIS atmosphere L2 cloud product (06_L2), NASA MODIS Adaptive Processing System, Goddard Space Flight Center [data set], https://doi.org/10.5067/MODIS/MOD06_L2.006, 2015. a, b
Pritchard, H., Ligtenberg, S. R., Fricker, H. A., Vaughan, D. G., van den Broeke, M. R., and Padman, L.: Antarctic ice-sheet loss driven by basal melting of ice shelves, Nature, 484, 502–505, https://doi.org/10.1038/nature10968, 2012. a
Scambos, T., Fricker, H. A., Liu, C.-C., Bohlander, J., Fastook, J., Sargent, A., Massom, R., and Wu, A.-M.: Ice shelf disintegration by plate bending and hydro-fracture: Satellite observations and model results of the 2008 Wilkins ice shelf break-ups, Earth Planet. Sc. Lett., 280, 51–60, https://doi.org/10.1016/j.epsl.2008.12.027, 2009. a
Scambos, T. A., Hulbe, C., Fahnestock, M., and Bohlander, J.: The link between climate warming and break-up of ice shelves in the Antarctic Peninsula, J. Glaciol., 46, 516–530, https://doi.org/10.3189/172756500781833043, 2000. a
Schuddeboom, A. J. and McDonald, A. J.: The Southern Ocean radiative bias, cloud compensating errors, and equilibrium climate sensitivity in CMIP6 models, J. Geophys. Res.-Atmos., 126, e2021JD035310, https://doi.org/10.1029/2021JD035310, 2021. a
Scott, R. C., Nicolas, J. P., Bromwich, D. H., Norris, J. R., and Lubin, D.: Meteorological drivers and large-scale climate forcing of West Antarctic surface melt, J. Climate, 32, 665–684, https://doi.org/10.1175/JCLI-D-18-0233.1, 2019. a
Shepherd, A., Ivins, E., Rignot, E., Smith, B., Van Den Broeke, M., Velicogna, I., Whitehouse, P., Briggs, K., Joughin, I., Krinner, G., Nowicki, S., Payne, T., Scambos, T., Schlegel, N., Geruo, A., Agosta, C., Ahlstrøm, A., Babonis, G., Barletta, V., Blazquez, A., Bonin, J., Csatho, B., Cullather, R., Felikson, D., Fettweis, X., Forsberg, R., Gallee, H., Gardner, A., Gilbert, L., Groh, A., Gunter, B., Hanna, E., Harig, C., Helm, V., Horvath, A., Horwath, M., Khan, S., Kjeldsen, K. K., Konrad, H., Langen, P., Lecavalier, B., Loomis, B., Luthcke, S., McMillan, M., Melini, D., Mernild, S., Mohajerani, Y., Moore, P., Mouginot, J., Moyano, G., Muir, A., Nagler, T., Nield, G., Nilsson, J., Noel, B., Otosaka, I., Pattle, M. E., Peltier, W. R., Pie, N., Rietbroek, R., Rott, H., Sandberg-Sørensen, L., Sasgen, I., Save, H., Scheuchl, B., Schrama, E., Schröder, L., Seo, K. W., Simonsen, S., Slater, T., Spada, G., Sutterley, T., Talpe, M., Tarasov, L., Van De Berg, W. J., Van Der Wal, W., Van Wessem, M., Vishwakarma, B. D., Wiese, D., and Wouters, B.: Mass balance of the Antarctic Ice Sheet from 1992 to 2017, Nature, 558, 219–222, https://doi.org/10.1038/s41586-018-0179-y, 2018. a
Smith, H. R., Ulanowski, Z., Kaye, P. H., Hirst, E., Stanley, W., Kaye, R., Wieser, A., Stopford, C., Kezoudi, M., Girdwood, J., Greenaway, R., and Mackenzie, R.: The Universal Cloud and Aerosol Sounding System (UCASS): a low-cost miniature optical particle counter for use in dropsonde or balloon-borne sounding systems, Atmos. Meas. Tech., 12, 6579–6599, https://doi.org/10.5194/amt-12-6579-2019, 2019. a
Stokes, C. R., Sanderson, J. E., Miles, B. W., Jamieson, S. S., and Leeson, A. A.: Widespread distribution of supraglacial lakes around the margin of the East Antarctic Ice Sheet, Scientific reports, 9, 13823, https://doi.org/10.1038/s41598-019-50343-5, 2019. a
Sundqvist, H.: A parameterization scheme for non-convective condensation including prediction of cloud water content, Q. J. Roy. Meteor. Soc., 104, 677–690, https://doi.org/10.1002/qj.49710444110, 1978. a
Trusel, L. D., Frey, K. E., Das, S. B., Karnauskas, K. B., Kuipers Munneke, P., Van Meijgaard, E., and Van Den Broeke, M. R.: Divergent trajectories of Antarctic surface melt under two twenty-first-century climate scenarios, Nat. Geosci., 8, 927–932, https://doi.org/10.1038/ngeo2563, 2015. a, b, c
Tuckett, P. A., Ely, J. C., Sole, A. J., Livingstone, S. J., Davison, B. J., Melchior van Wessem, J., and Howard, J.: Rapid accelerations of Antarctic Peninsula outlet glaciers driven by surface melt, Nat. Commun., 10, 4311, https://doi.org/10.1038/s41467-019-12039-2, 2019. a
Turner, J., Lu, H., King, J. C., Carpentier, S., Lazzara, M., Phillips, T., and Wille, J.: An Extreme High Temperature Event in Coastal East Antarctica Associated With an Atmospheric River and Record Summer Downslope Winds, Geophys. Res. Lett., 49, e2021GL097108, https://doi.org/10.1029/2021GL097108, 2022. a
Van Tricht, K., Lhermitte, S., Lenaerts, J. T., Gorodetskaya, I. V., L’Ecuyer, T. S., Noël, B., van den Broeke, M. R., Turner, D. D., and van Lipzig, N. M.: Clouds enhance Greenland ice sheet meltwater runoff, Nat. Commun., 7, 10266, https://doi.org/10.1038/ncomms10266, 2016. a
van Wessem, J. M., Reijmer, C. H., Lenaerts, J. T. M., van de Berg, W. J., van den Broeke, M. R., and van Meijgaard, E.: Updated cloud physics in a regional atmospheric climate model improves the modelled surface energy balance of Antarctica, The Cryosphere, 8, 125–135, https://doi.org/10.5194/tc-8-125-2014, 2014. a
van Wessem, J. M., van de Berg, W. J., Noël, B. P. Y., van Meijgaard, E., Amory, C., Birnbaum, G., Jakobs, C. L., Krüger, K., Lenaerts, J. T. M., Lhermitte, S., Ligtenberg, S. R. M., Medley, B., Reijmer, C. H., van Tricht, K., Trusel, L. D., van Ulft, L. H., Wouters, B., Wuite, J., and van den Broeke, M. R.: Modelling the climate and surface mass balance of polar ice sheets using RACMO2 – Part 2: Antarctica (1979–2016), The Cryosphere, 12, 1479–1498, https://doi.org/10.5194/tc-12-1479-2018, 2018. a, b, c
van Wessem, J. M., van den Broeke, M. R., Wouters, B., and Lhermitte, S.: Variable temperature thresholds of melt pond formation on Antarctic ice shelves, Nat. Clim. Change, 13, 161–166, https://doi.org/10.1038/s41558-022-01577-1, 2023. a
Van Weverberg, K., Giangrande, S., Zhang, D., Morcrette, C., and Field, P.: On the Role of Macrophysics and Microphysics in Km-Scale Simulations of Mixed-Phase Clouds during Cold Air Outbreaks, J. Geophys. Res.-Atmos., 128, e2022JD037854, https://doi.org/10.1029/2022JD037854, 2023. a
Vignon, É., Alexander, S., DeMott, P., Sotiropoulou, G., Gerber, F., Hill, T., Marchand, R., Nenes, A., and Berne, A.: Challenging and improving the simulation of mid-level mixed-phase clouds over the high-latitude Southern Ocean, J. Geophys. Res.-Atmos., 126, e2020JD033490, https://doi.org/10.1029/2020JD033490, 2021. a
Walters, D., Boutle, I., Brooks, M., Melvin, T., Stratton, R., Vosper, S., Wells, H., Williams, K., Wood, N., Allen, T., Bushell, A., Copsey, D., Earnshaw, P., Edwards, J., Gross, M., Hardiman, S., Harris, C., Heming, J., Klingaman, N., Levine, R., Manners, J., Martin, G., Milton, S., Mittermaier, M., Morcrette, C., Riddick, T., Roberts, M., Sanchez, C., Selwood, P., Stirling, A., Smith, C., Suri, D., Tennant, W., Vidale, P. L., Wilkinson, J., Willett, M., Woolnough, S., and Xavier, P.: The Met Office Unified Model Global Atmosphere 6.0/6.1 and JULES Global Land 6.0/6.1 configurations, Geosci. Model Dev., 10, 1487–1520, https://doi.org/10.5194/gmd-10-1487-2017, 2017. a
Walters, D., Baran, A. J., Boutle, I., Brooks, M., Earnshaw, P., Edwards, J., Furtado, K., Hill, P., Lock, A., Manners, J., Morcrette, C., Mulcahy, J., Sanchez, C., Smith, C., Stratton, R., Tennant, W., Tomassini, L., Van Weverberg, K., Vosper, S., Willett, M., Browse, J., Bushell, A., Carslaw, K., Dalvi, M., Essery, R., Gedney, N., Hardiman, S., Johnson, B., Johnson, C., Jones, A., Jones, C., Mann, G., Milton, S., Rumbold, H., Sellar, A., Ujiie, M., Whitall, M., Williams, K., and Zerroukat, M.: The Met Office Unified Model Global Atmosphere 7.0/7.1 and JULES Global Land 7.0 configurations, Geosci. Model Dev., 12, 1909–1963, https://doi.org/10.5194/gmd-12-1909-2019, 2019. a
Wielicki, B. A., Barkstrom, B. R., Harrison, E. F., Lee III, R. B., Smith, G. L., and Cooper, J. E.: Clouds and the Earth's Radiant Energy System (CERES): An earth observing system experiment, B. Am. Meteorol. Soc., 77, 853–868, https://doi.org/10.1175/1520-0477(1996)077<0853:CATERE>2.0.CO;2, 1996. a
Wille, J. D., Favier, V., Dufour, A., Gorodetskaya, I. V., Turner, J., Agosta, C., and Codron, F.: West Antarctic surface melt triggered by atmospheric rivers, Nat. Geosci., 12, 911–916, https://doi.org/10.1038/s41561-019-0460-1, 2019. a
Wille, J. D., Favier, V., Jourdain, N. C., Kittel, C., Turton, J. V., Agosta, C., Gorodetskaya, I. V., Picard, G., Codron, F., Santos, C. L.-D., Amory, C., Fettweis, X., Blanchet, J., Jomelli, V., and Berchet, A.: Intense atmospheric rivers can weaken ice shelf stability at the Antarctic Peninsula, Communications Earth & Environment, 3, 90, https://doi.org/10.1038/s43247-022-00422-9, 2022. a
Wilson, D. R. and Ballard, S. P.: A microphysically based precipitation scheme for the UK Meteorological Office Unified Model, Q. J. Roy. Meteor. Soc., 125, 1607–1636, https://doi.org/10.1002/qj.49712555707, 1999. a
Zhang, M., Xie, S., Liu, X., Zhang, D., Lin, W., Zhang, K., Golaz, J.-C., Zheng, X., and Zhang, Y.: Evaluating EAMv2 Simulated High Latitude Clouds Using ARM Measurements in the Northern and Southern Hemispheres, J. Geophys. Res.-Atmos., 128, e2022JD038364, https://doi.org/10.1029/2022JD038364, 2023. a
Zhang, T., Stamnes, K., and Bowling, S.: Impact of clouds on surface radiative fluxes and snowmelt in the Arctic and subarctic, J. Climate, 9, 2110–2123, https://doi.org/10.1175/1520-0442(1996)009<2110:IOCOSR>2.0.CO;2, 1996. a, b
Zou, X., Bromwich, D. H., Montenegro, A., Wang, S.-H., and Bai, L.: Major surface melting over the Ross Ice Shelf part I: Foehn effect, Q. J. Roy. Meteor. Soc., 147, 2874–2894, https://doi.org/10.1002/qj.4104, 2021. a, b
Zou, X., Rowe, P. M., Gorodetskaya, I., Bromwich, D. H., Lazzara, M. A., Cordero, R. R., Zhang, Z., Kawzenuk, B., Cordeira, J. M., Wille, J. D., Ralph, F. M., and Bai, L.-S.: Strong Warming over the Antarctic Peninsula during Combined Atmospheric River and Foehn Events: Contribution of Shortwave Radiation and Turbulence, J. Geophys. Res.-Atmos., 128, e2022JD038138, https://doi.org/10.1029/2022JD038138, 2023. a