the Creative Commons Attribution 4.0 License.
the Creative Commons Attribution 4.0 License.
 | 13 May 2024
The role of upper-ocean heat content in the regional variability of Arctic sea ice at sub-seasonal timescales
Doroteaciro Iovino
Simona Masina
Stefano Materia
Paolo Ruggieri
In recent decades, the Arctic Ocean has undergone changes associated with enhanced poleward inflow of Atlantic and Pacific waters and increased heat flux exchange with the atmosphere in seasonally ice-free regions. The associated changes in upper-ocean heat content can alter the exchange of energy at the ocean–ice interface. Yet, the role of ocean heat content in modulating Arctic sea ice variability at sub-seasonal timescales is still poorly documented. We analyze ocean heat transports and surface heat fluxes between 1980–2021 using two eddy-permitting global ocean reanalyses, C-GLORSv5 and ORAS5, to assess the surface energy budget of the Arctic Ocean and its regional seas. We then assess the role of upper-ocean heat content, computed in the surface mixed layer (Qml) and in the 0–300 m layer (Q300), as a sub-seasonal precursor of sea ice variability by means of lag correlations. Our results reveal that in the Pacific Arctic regions, sea ice variability in autumn is linked with Qml anomalies leading by 1 to 3 months, and this relationship has strengthened in the Laptev and East Siberian seas during 2001–2021 relative to 1980–2000, primarily due to reduced surface heat loss since the mid-2000s. Q300 anomalies act as a precursor for wintertime sea ice variability in the Barents and Kara seas, with considerable strengthening and expansion of this link from 1980–2000 and 2001–2021 in both reanalyses. Our results highlight the role played by upper-ocean heat content in modulating the interannual variability of Arctic sea ice at sub-seasonal timescales. Heat stored in the ocean has important implications for the predictability of sea ice, calling for improvements in forecast initialization and a focus upon regional predictions in the Arctic region.
- Article
(10235 KB) - Full-text XML
- BibTeX
- EndNote


Satellite observations have documented a rapid decline of Arctic sea ice in all seasons (Simmonds, 2015; Stroeve and Notz, 2018; Onarheim et al., 2018). The mean sea ice state is transitioning to a new regime of thinner, more fractured, and mobile ice (e.g., Graham et al., 2019; Sumata et al., 2023). This results in increased vulnerability to dynamic and thermodynamic forcing mechanisms, including pulses of ocean heat from the lower latitudes (Holland et al., 2006), atmospheric temperature fluctuations (Olonscheck et al., 2019), and enhanced ocean mixing and ocean–ice heat fluxes (e.g., Duarte et al., 2020; Ricker et al., 2021). The interplay between the atmosphere, ocean, and sea ice is central to explaining the pronounced temporal and spatial variability of the Arctic ice cover observed at a range of timescales (e.g., England et al., 2019; Ding et al., 2019). These complex interactions pose a challenge for accurate sea ice predictions, particularly at the regional level.
Sea ice variability in the Arctic is strongly region-dependent (e.g., Onarheim et al., 2018). The Atlantic sector (including the Greenland, Barents, Kara, and Laptev seas) and in particular the Barents Sea have experienced larger sea ice loss than other areas of the Arctic Ocean (Onarheim et al., 2014, 2018; Lind et al., 2018), due to enhanced heat advection by the warm and saline Atlantic Water (AW) entering the basin at intermediate depths (200–800 m; Aagaard, 1989). Heat from the Atlantic Ocean reaches the Arctic through the Barents Sea Opening (Smedsrud et al., 2010) and Fram Strait (Schauer and Beszczynska-Möller, 2009). The combined effects of increased volume inflow (Smedsrud et al., 2022) and warmer temperatures (Wang et al., 2019) of the AW current have been linked to sea ice decline in the Barents Sea (e.g., Årthun et al., 2012; Smedsrud et al., 2013) and more recently in the eastern Eurasian Basin (Polyakov et al., 2020b). In the latter, the interaction between AW and sea ice has also been examined in relation to the weakening of the stratified, cold, halocline layer and consequent increase in vertical heat fluxes towards the surface (Polyakov et al., 2010, 2017). These changes are collectively referred to as the “Atlantification” of the Arctic Ocean (Årthun et al., 2012; Asbjørnsen et al., 2020) and are thought to be the primary cause of thermodynamic ice melt during winter, when incoming solar radiation is absent (Onarheim et al., 2014; Tsubouchi et al., 2021; Ivanov et al., 2012). The expansion of the Barents Sea open water region leads to enhanced heat release from the ocean to the colder atmosphere, a phenomenon known as the “Barents Sea cooling machine” (Skagseth et al., 2020). In this part of the Arctic, complex feedbacks exist between sea ice retreat, anomalous atmospheric circulation, and induced changes in ocean heat transport by wind-driven currents (e.g., Mohamed et al., 2022). Observations over the past 20 years have shown reduced heat loss in ice-free areas of the Barents Sea, which exceeds the increase driven by the sea ice retreat (Skagseth et al., 2020).
The Pacific sector of the Arctic (including the Beaufort, Chukchi, and East Siberian seas) has also been the epicenter of some of the most remarkable episodes of sea ice loss in recent years (Comiso et al., 2017). While small in comparison to the inflow through Fram Strait (about 10 times smaller in volume and with a heat flux that is of the Fram Strait heat flux; Woodgate et al., 2012), the inflow of Pacific Water (PW) through Bering Strait has also shown a warming trend that can accelerate sea ice loss (MacKinnon et al., 2021; Woodgate and Peralta-Ferriz, 2021) and act as a trigger for early melt onset (Woodgate et al., 2010).
Enhanced poleward heat transport from the lower latitudes or reduced ocean heat loss contributes to altering the Arctic’s energy budget, causing the amplification of upper-ocean warming (Shu et al., 2022; Asbjørnsen et al., 2020). Mayer et al. (2019) estimated an energy imbalance of the Arctic Ocean on the order of 1 W m−2 between 2001–2017, with of the accumulated heat going to the sea ice. This finding is corroborated by remarkable upward trends in upper-ocean heat content over the past 4 decades, particularly during summer and autumn (Li et al., 2022). The temperature increase in the Arctic Ocean is at the core of the ice–albedo feedback (Perovich et al., 2007; Perovich and Polashenski, 2012). As more areas of open ocean become exposed to solar radiation due to sea ice break-up and early retreat, the seasonal upper-ocean heat uptake increases and a surplus of energy becomes stored in the surface layers (Stammerjohn et al., 2012; Serreze and Meier, 2019), where it is immediately available to the ice through lateral and bottom melting (e.g., Carmack et al., 2015).
To date, studies addressing oceanic drivers of sea ice variability have mainly focused on quantifying the effect of northward heat transport from the Pacific and Atlantic oceans (e.g., Onarheim et al., 2015; Nummelin et al., 2017; Dörr et al., 2021; Aylmer et al., 2022). This generally entails a focus on interannual timescales of variability, owing to the delayed response of sea ice to heat anomalies that originate from lower latitudes (e.g., Woodgate et al., 2010). In comparison, the role of ocean heat content as a precursor of sea ice anomalies at sub-seasonal timescales has not been sufficiently explored. An improved characterization of the co-variability of sea ice and upper-ocean heat content is of practical value to stakeholder groups, who are primarily interested in short-term predictability. Moreover, the accelerating trends towards a thinner sea ice cover implicate a higher vulnerability to regional-scale forcing (Perovich and Polashenski, 2012).
Additionally, the role of the Arctic surface mixed layer, which represents the link between the ocean, sea ice, and atmosphere (Toole et al., 2010), has received little attention in the literature, despite recent assessments of changes in the thermal state of the upper ocean that have documented warming trends, especially in regions of maximum sea ice retreat (e.g., Polyakov et al., 2020a). While the relative amounts of upper-ocean heat that are lost to the atmosphere and to the overlying sea ice remain hard to quantify, there is evidence that a surplus of energy absorbed by the mixed layer in summer can act to delay autumn ice growth (Perovich et al., 2007; Steele et al., 2008; Ivanov et al., 2016). However, our understanding of the effects of mixed layer heat on sea ice variability is still limited, partly due to the scarcity of sustained subsurface observations (e.g., Yang, 2006).
In this work, we address these gaps by assessing the role of upper-ocean heat content on regional sea ice variability at sub-seasonal timescales, placing our results in the context of recent changes to the Arctic Ocean heat budget. We achieve this by using two eddy-permitting global ocean reanalyses, CMCC C-GLORSv5 and ECMWF ORAS5. Ocean reanalyses provide uniformly gridded reconstructions of the state of the ocean climate by combining ocean models driven by atmospheric forcing and available observational data via advanced data assimilation methods (Balmaseda et al., 2015). While they have become an established tool for a variety of climate services and science-driven studies (Storto et al., 2019), ocean reanalyses are especially valuable for the assessment and monitoring of the state of the Arctic Ocean, where hydrographic observations are severely limited by perennial ice cover (e.g., Uotila et al., 2019). Furthermore, the performance of different reanalysis products in polar regions has been widely evaluated with encouraging results (e.g., Iovino et al., 2022; Lien et al., 2016; Ilıcak et al., 2016). With respect to fully modeled data, errors and uncertainties in the representation of ocean variables in reanalyses are effectively reduced through the assimilation of observational fields. The CMCC C-GLORSv5 and ECMWF ORAS5 products specifically have also been employed in several applications (e.g., Takahashi et al., 2021; Carton et al., 2019), including in polar regions (e.g., Mayer et al., 2019; Shu et al., 2021; Nie et al., 2022). Their extensive temporal coverage (1980–present) and their high horizontal and vertical resolution, which allows for a high level of detail in the surface layers, make these products particularly suited for the study of the polar upper ocean. However, very few studies using ocean reanalyses have investigated changes in pan-Arctic heat budget and ocean heat content, and, to our knowledge, no previous study has explored these aspects in relation to sea ice variability with a regional focus.
The remainder of this article is structured as follows. Sect. 2 introduces the data and methodological approach of the study. Section 3 presents the results, which are further divided into three parts: Sect. 3.1, which provides an overview of the dominant changes in the Arctic Ocean between 1980–2021; Sect. 3.2, where we perform a heat budget analysis to ensure the accuracy of our results; and Sect. 3.3, where we examine the coupling between ocean heat content and sea ice variability in the past 40 years. In Sect. 4, we discuss our findings and their implications for the future climate.
2.1 Sea ice and ocean reanalyses
Monthly means of sea ice concentrations between 1980 and 2021 are derived from the fifth-generation atmospheric global reanalysis of the European Centre for Medium-Range Weather Forecasts (ECMWF ERA5; Hersbach et al., 2020). ERA5 data are available from the Copernicus Climate Change Service (C3S) Data Store (Thépaut et al., 2018) on a regular latitude–longitude grid with 0.25° × 0.25° horizontal resolution, from 1950 to the present day. Sea ice concentration in the ERA5 dataset after 1979 relies on the EUMETSAT Ocean and Sea Ice Satellite Application Facility (OSI-SAF) Climate data Record version 1.2 (OSI-409a) and operational OSI-SAF (OSI-430) products (1979–2007 and 2007–present, respectively), which are based on combined passive microwave observations from the Defense Meteorological Satellite Program (DMSP) Special Sensor Microwave/Imager (SSM/I) and the Special Sensor Microwave Imager/Sounder (SSMIS).
We derive temperature, mixed layer depth (MLD), surface heat fluxes, and velocity fields at monthly resolution between 1980–2021 from the Global Ocean Reanalysis System version 5 from the Euro-Mediterranean Center on Climate Change (CMCC C-GLORSv5; Storto and Masina, 2016a) and the Ocean ReAnalysis System 5 from the European Centre for Medium-Range Weather Forecasts (ECMWF ORAS5; Zuo et al., 2019), which is available for download on the C3S Data Store. An overview of the key product characteristics is provided in Table 1. Both C-GLORSv5 and ORAS5 are produced with the NEMO ocean model (Madec et al., 2017) coupled to the Louvain-la-Neuve sea Ice Model (LIM2; Fichefet and Maqueda, 1997). Both models adopt a tripolar grid at eddy-permitting configuration with 0.25° × 0.25° horizontal resolution. The original vertical resolution is 50 levels and 75 vertical levels for C-GLORSv5 and ORAS5, respectively; however, we adopt a version of C-GLORSv5 with 75 vertical levels (C-GLORSv5e025L75, herein referred to as simply C-GLORSv5). In both reanalyses, the ocean is forced by the ECMWF ERA-Interim atmospheric reanalysis (Dee et al., 2011); in ORAS5, this is replaced by ECMWF operational NWP (numerical weather prediction) after 2015. The two products differ in their assimilation schemes in terms of input observational datasets, frequency of analysis, assimilation time windows, and bias correction schemes. A full description of the assimilated satellite and in situ observations as well as the specifics of data assimilation schemes can be found in the reference papers listed in Table 1.
Storto and Masina (2016a)Zuo et al. (2019)Table 1Overview of Ocean Reanalyses used in this study.
1 up to 2015/after 2015. 2 SST (sea surface temperature) is assimilated from the NOAA SST ° analyses (Reynolds et al., 2007). With respect to sea ice data assimilation, C-GLORSv5 introduces a nudging scheme to weakly constrain sea ice thickness in the Arctic from the Pan-Arctic Ice Ocean Modeling and Assimilation System (PIOMAS; Zhang and Rothrock, 2003). 3 SST is assimilated from HadISSTv2 pentad before 2008 and from OSTIA analysis from 2008. SIC (sea ice coverage) data come from the OSTIA reprocessed analysis before 2008 and OSTIA analysis after.
2.2 Regional and pan-Arctic heat budget
We first estimate the ocean heat budget in the C-GLORSv5 and ORAS5 reanalyses for the whole Arctic and for four subdomains: the Barents-Kara region (BK), the Laptev-East Siberian region (LES), the Chukchi Sea (CHU), and the Beaufort Sea (BEA, Fig. 1). These regional domains are largely consistent with those of previous studies (e.g., Stroeve et al., 2016; Bliss et al., 2019; Lenetsky et al., 2021).
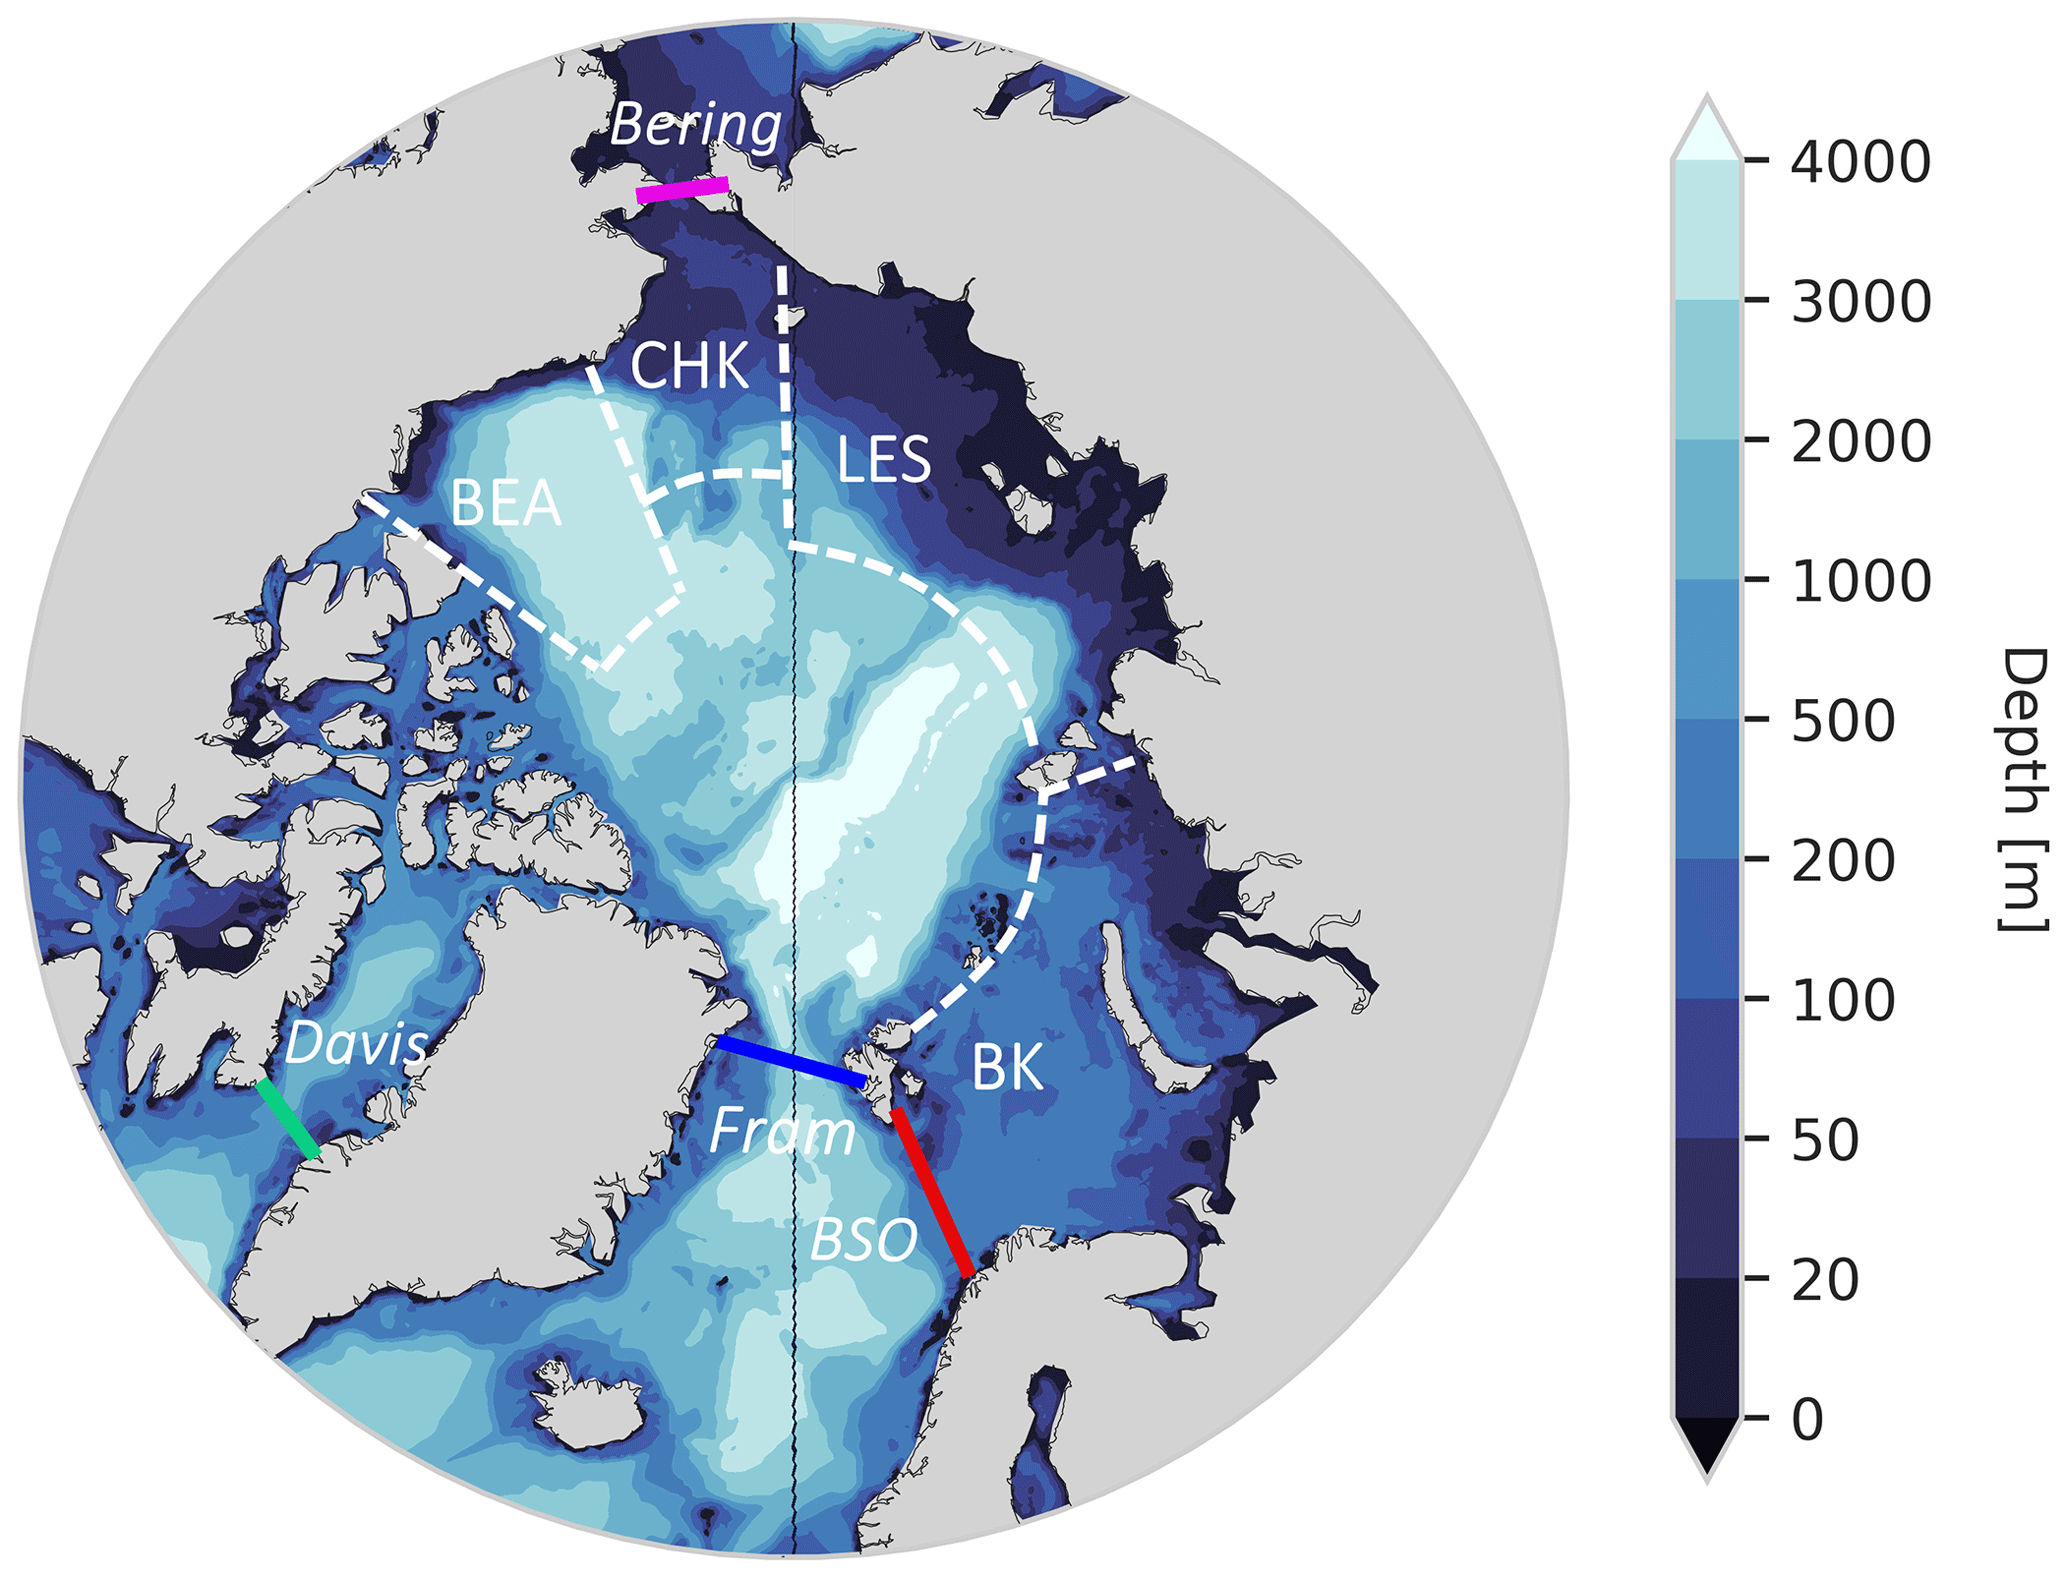
Figure 1Arctic Ocean bathymetry in C-GLORSv5. Dashed lines indicate the boundaries of the regional domains considered in this study (Barents-Kara, BK; Laptev-East Siberian, LES; Chukchi Sea, CHU; and Beaufort Sea, BEA). Solid lines mark the location of the main Arctic gateways: Fram Strait (blue), Barents Sea Opening (BSO; red), Bering Strait (magenta), and Davis Strait (green). Note the irregular depth intervals in the color bar.
Considering a control ocean volume with surface A and vertical section S, where mass and salinity are conserved, the heat budget is given by the balance between advective, vertical and diffusive heat flux terms (Eq. 1):
where Qt is the ocean heat content tendency; OHT represents the advective ocean heat transport through S; the reference density ρ0 (1026 kg m−3) and specific heat capacity Cp (3996 J kg−1 K−1) of sea water are both assumed constant; V and T are the cross-sectional velocity and potential temperature, respectively; SSHF (positive downward) indicates the net sea surface heat flux, Qs, over the surface A; and Qdiff represents the lateral heat diffusion.
We define the pan-Arctic domain as the area enclosed by the four ocean gateways: the Fram, Bering, and Davis straits and the Barents Sea Opening (BSO) (Fig. 1), as in previous observational (e.g., Tsubouchi et al., 2012) and modeling studies (e.g., Lique and Steele, 2013). The net ocean heat transport into the Arctic is computed along each section (on the native grid) at monthly frequency for C-GLORSv5 and ORAS5 (Eq. 2).
where λ1 and λ2 are the coordinates of the section line, Z(λ) is the depth at each section, and T is taken relative to a reference temperature Tref of 0 °C, following previous studies (Årthun et al., 2012; Lique and Steele, 2013). It is widely recognized that heat transports are sensitive to the choice of reference temperatures. Therefore, the reader should note that when considering partial sections the estimated values of OHT are always dependent on the arbitrary choice of Tref, since there is a non-zero net volume flux (i.e., the volume transport across individual sections is not balanced; see Schauer and Beszczynska-Möller, 2009).
We consider the net sea surface heat flux term (SSHF, W m−2) over the box area enclosed by the four gates. SSHF is defined positive downward in both reanalyses and represents the exchange of solar and non-solar fluxes between the ocean and atmosphere. Note that in considering the heat budget components in Eq. (1), we omit the lateral heat diffusion term as this is negligible compared to the advective and surface flux terms (Lique and Steele, 2013). For a detailed analysis of the coupled ocean–ice–atmosphere surface energy budget of the Arctic Ocean, which is beyond the scope of this study, the reader can refer to Mayer et al. (2019). We further compute the same heat budget terms for each individual Arctic sub-region by considering the total advected heat as the sum of net OHT along each section line bounding the given region (solid colored lines and dashed white lines in Fig. 1). Given the full seasonal sea ice coverage (SIC >90 %) in the Laptev-East Siberian and Beaufort regions, we consider the net surface heat flux in each region as the sum of the ocean–ice heat flux (OIHF, W m−2) for the ice-covered fraction and SSHF (W m−2) for the remaining ice-free fraction of each grid cell. The regional heat budget analysis is computed from C-GLORSv5 data only, as the ocean–ice heat flux is not available for download from the ORAS5 reanalysis.
2.3 Ocean heat content
We next estimate ocean heat content per unit area (Q, J m−2) by vertically integrating monthly potential temperature over two target depths: from the surface to the seasonally varying mixed layer depth (Qml), to account for the energy stored at the atmosphere–ice–ocean interface, and the 0–300 m depth layer (Q300), to capture the intermediate depth layer characterized by the greatest AW warming (e.g., Shu et al., 2022) (Eq. 3).
where Tfreeze is the freezing temperature of seawater that is equal to −1.8 °C, and Z represents the maximum depth boundary. Here, we adopt the constant of freezing as reference temperature following previous studies (e.g., Mayer et al., 2019; Korhonen et al., 2013) to obtain the heat available for potential sea ice melt. In calculating Qml, Z corresponds to the time-varying MLD, which is defined with the threshold method where potential density exceeds the surface reference value by 0.01 kg m−3 (Peralta-Ferriz and Woodgate, 2015). The density difference criterion and the 0.01 kg m−3 threshold have been widely tested in the Arctic (e.g., Toole et al., 2010; Gimbert et al., 2012; Timmermans et al., 2012; Thomson and Fine, 2003). We do not find any substantial differences in the spatial distribution and seasonality of MLD when adopting a different density criterion (e.g., 0.03 kg m−3; not shown). In calculating Q300, we consider Z to be fixed at 300 m, or we consider it to be at the ocean bottom if the water column is shallower than 300 m.
Finally, we obtain monthly anomaly time series of SIC, Qml, and Q300 by removing a monthly climatological mean from each time series. To investigate how upper-ocean heat content at both target depths influences sea ice variability on a sub-seasonal timescale, lagged correlations between region-averaged anomalies of Q and SIC are computed for each month, with the ocean leading sea ice by a lead time of 1 to 3 months. The time series used for the lagged correlation analysis are split between an earlier period (1980–2000) and a later period (2001–2021) to assess the role of upper-ocean warming and sea ice loss in recent decades. For comparison, we also show the lagged auto-correlation of SIC anomalies at each month as an indicator of the inherent sea ice predictability and how this varies across the two periods.
3.1 Changes in the Arctic upper ocean between 1980–2021
Figure 2 shows annual mean trends in Arctic Ocean SIC, MLD, Qml, Q300, SSHF, and OIHF between 1980 and 2021 for the C-GLORSv5 reanalysis. Given the strong seasonality of SSHF, trends for this variable are shown separately for the seasons of melt-onset (MJJ) and freeze-onset (OND). Warming of the upper ocean is most evident in the Barents and Kara regions, both in terms of SIC reductions and positive trends in Qml and Q300, especially along the pathways of AW inflow (Fig. 2a, c, d). Increased springtime SSHF (Fig. 2e) is consistent with enhanced solar absorption in regions of reduced ice cover. During the autumn season (OND), the positive SSHF trend in the southern Barents Sea suggests reduced ocean cooling in this part of the region (Fig. 2f). Conversely, ocean heat loss to the atmosphere during autumn has been intensifying in the Chukchi Sea and in large parts of the northern Barents and Kara seas, particularly along the pathway of Fram Strait inflow. These changes suggest that the area of effective cooling in the Barents Sea has expanded towards the northern Barents and Kara seas (Shu et al., 2021). Significant reductions in OIHF are consistent with regions of sea ice loss along coastlines and in the southwest Barents Sea (Fig. 2g). The overall weakening in stratification in the Atlantic Arctic sector (Fig. 2b) is opposed to a modest decrease in MLD in the Canada Basin, as corroborated by recent literature (e.g., Muilwijk et al., 2022).
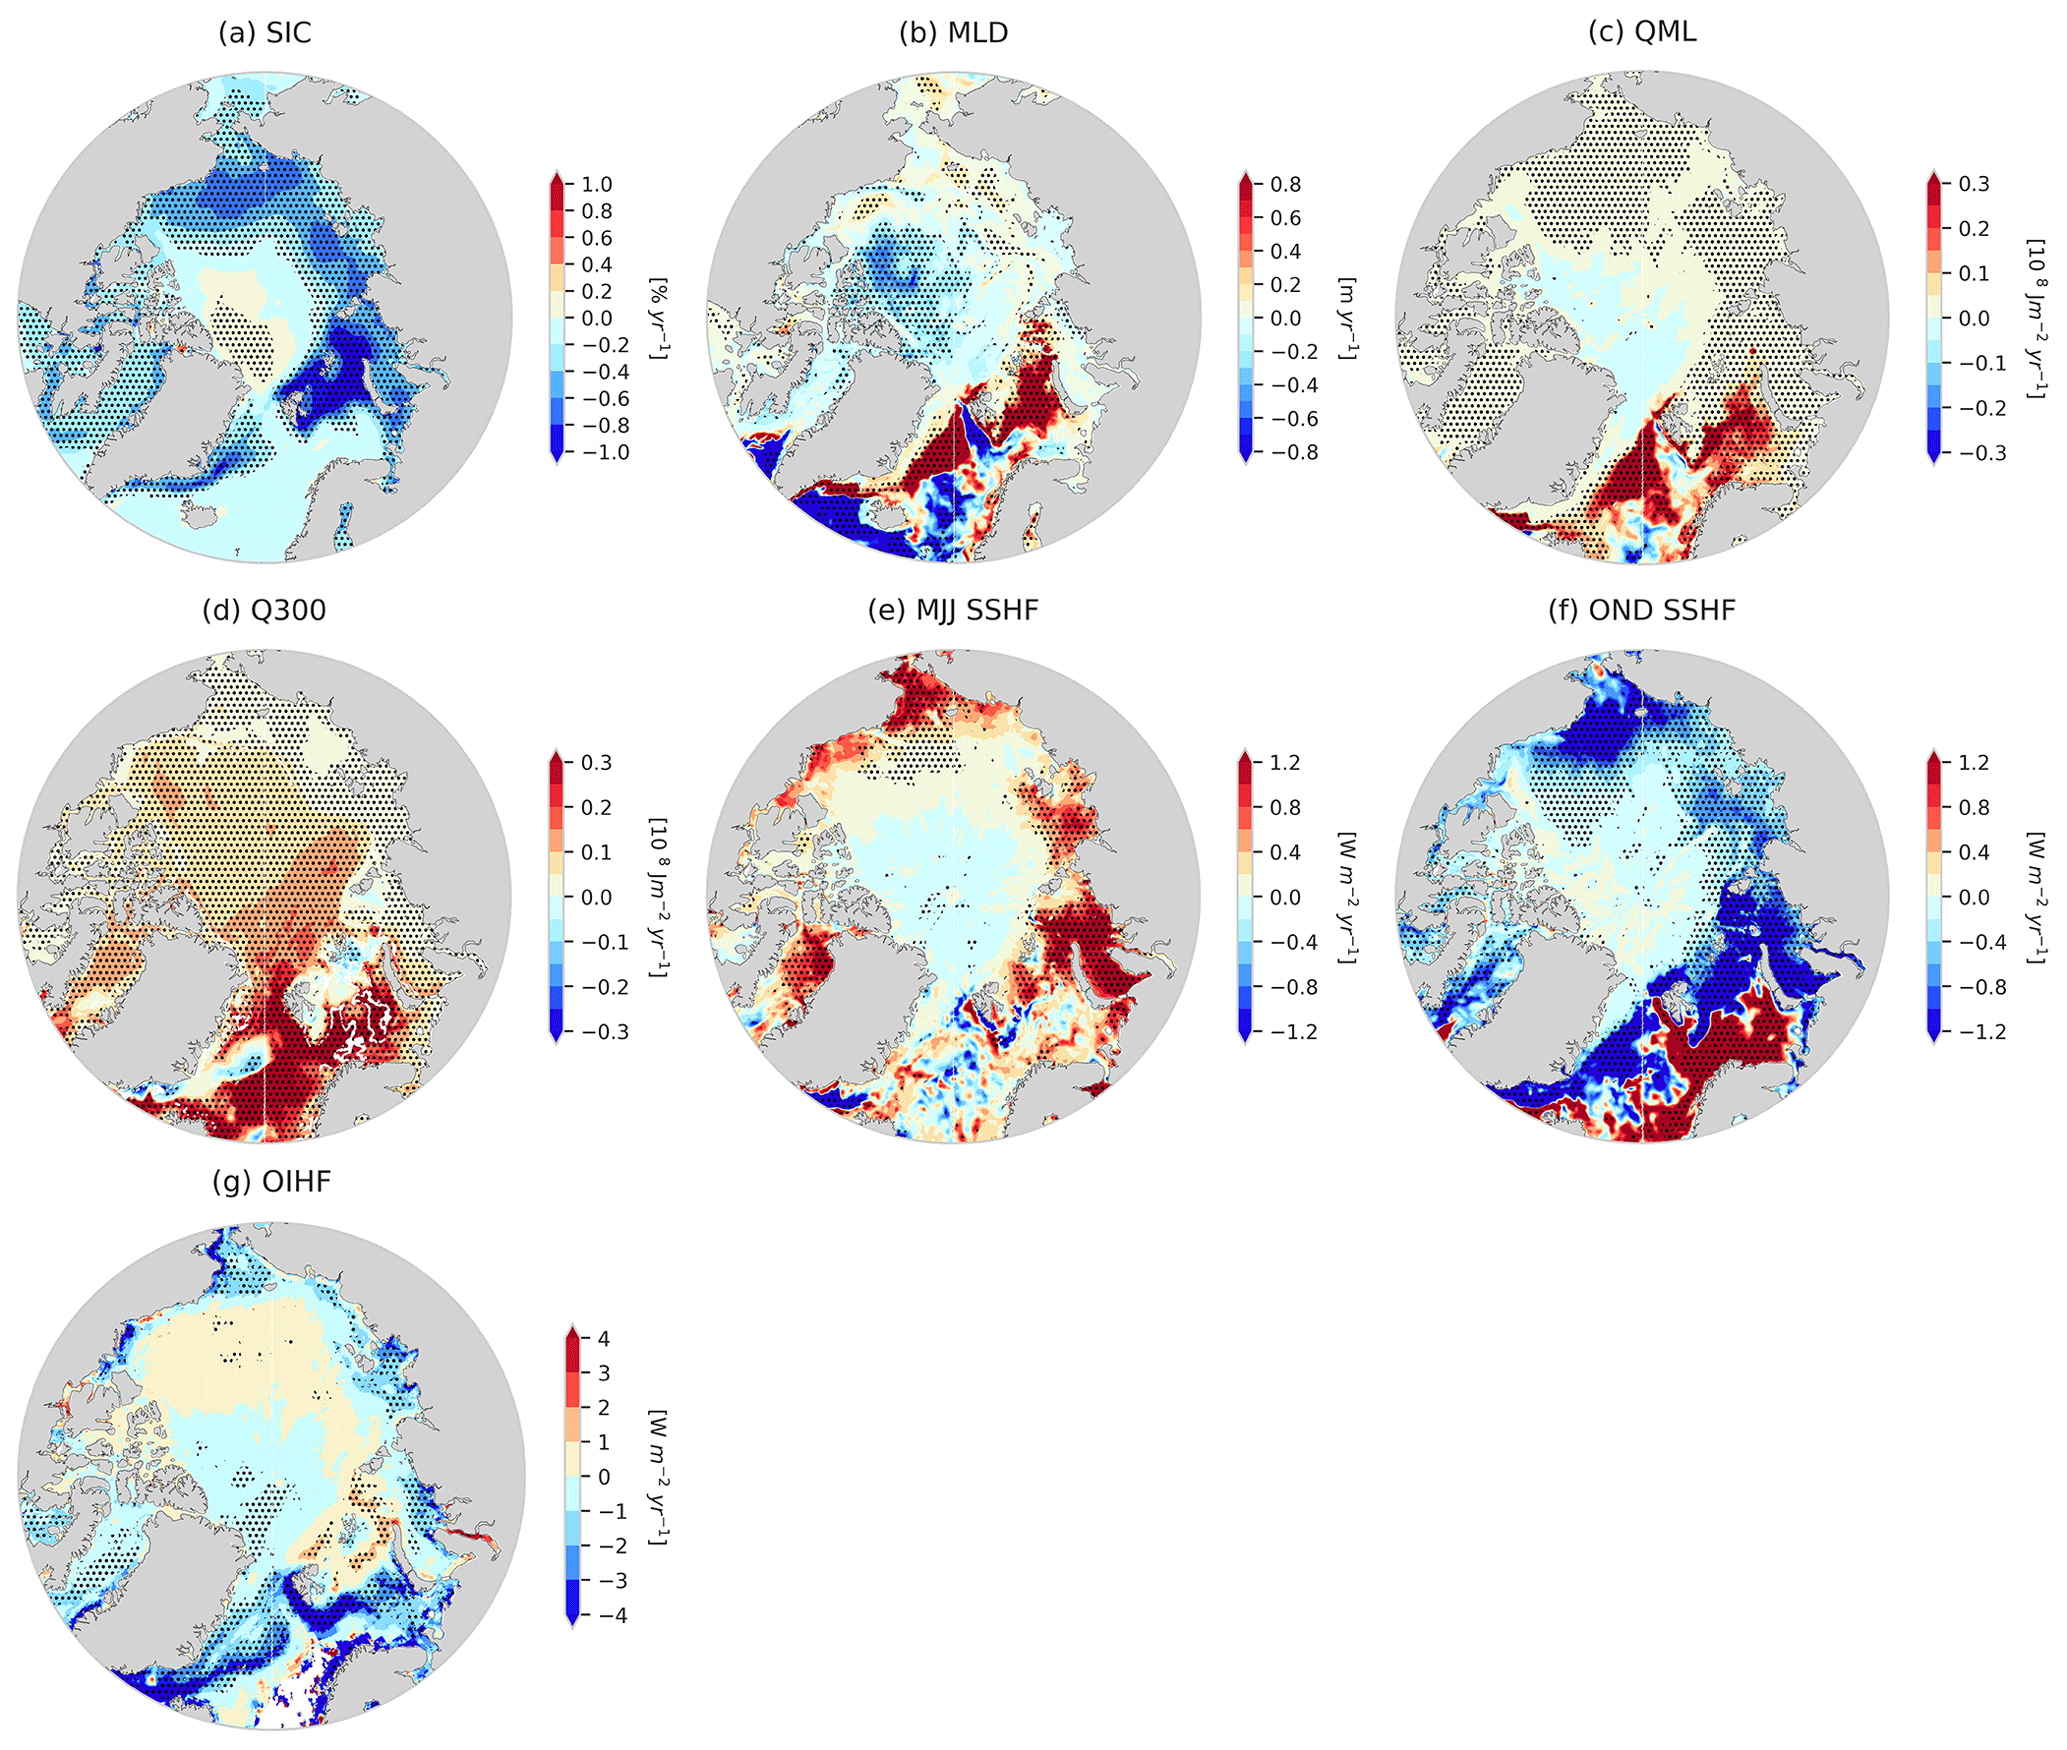
Figure 2Annual trends (1980–2021) in (a) sea ice concentration (SIC, %), (b) mixed layer depth (MLD, m), (c) ocean heat content in the mixed layer and the 0–300 m layer (d) (Qml and Q300, 108 J m−2), (e) sea surface heat flux (SSHF, in May–June–July (MJJ), W m−2) and in (f) October–November–December (OND) and (g) ocean–ice heat flux (OIHF, W m−2) for the C-GLORSv5 ocean reanalysis. SSHF is defined as positive downward. Stippling denotes 99 % significance.
Figure 3 illustrates annual time series of Qml, Q300, and SIC for the four Arctic regional seas and for the pan-Arctic region. The interannual variability of SIC is intrinsically linked with that of Q. Reductions in SIC and an increase in Q300 between 1980–2021 are evident for all regions as well as for the pan-Arctic mean (Fig. 3e), though trends are most pronounced after the early/mid-2000s. Among all sub-regions, the Beaufort Sea presents the weakest decline in SIC, presumably due to stronger upper-ocean stratification. The Barents-Kara region experienced the largest increase in Q300 (0.11/0.15 × 108 J m−2 yr−1 for C-GLORSv5/ORAS5, respectively) and Qml (0.08/0.06 × 108 J m−2 yr−1).
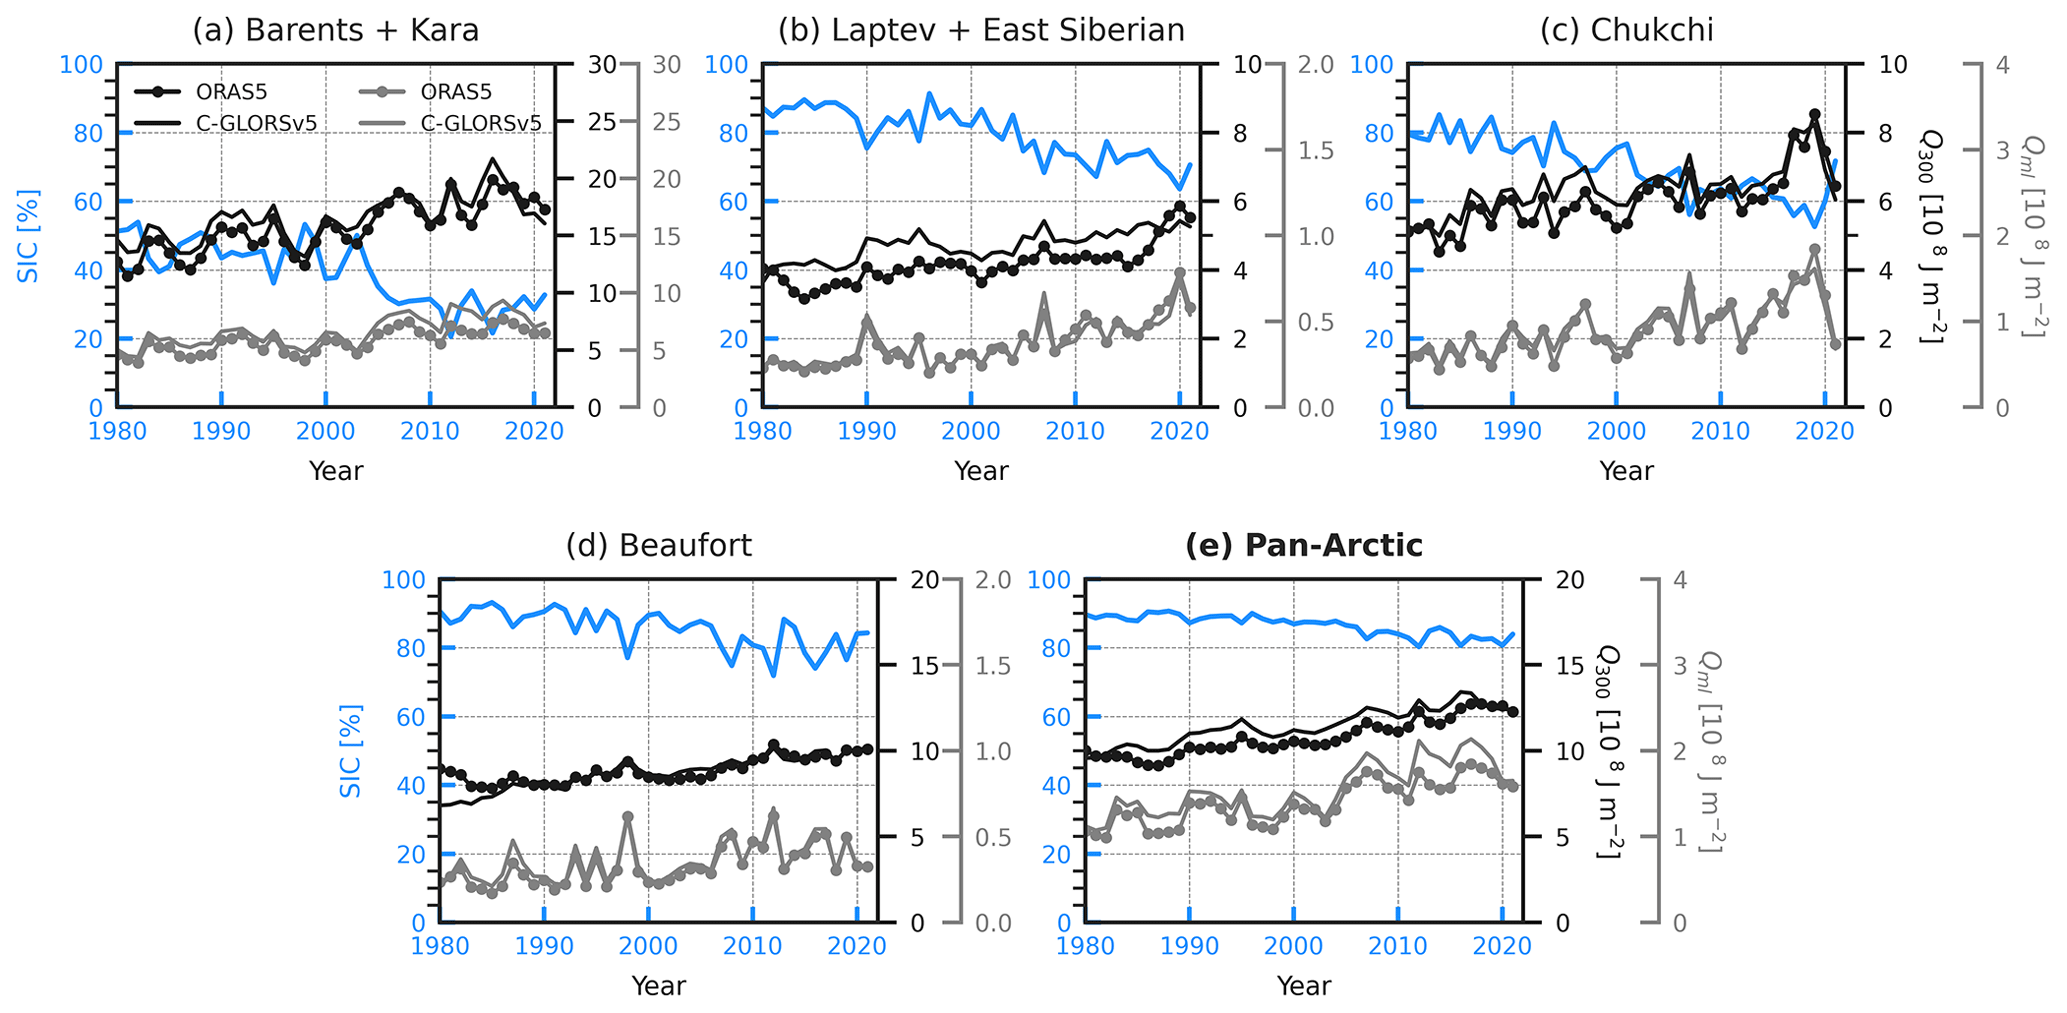
Figure 3Time series of SIC (blue), Q300 (black), and Qml (grey) in C-GLORSv5 and ORAS5 for the Arctic regional seas and for the total Arctic. The pan-Arctic region (e) is defined as the area bounded by the Fram, BSO, Bering, and Davis straits. Note the different y-axis ranges.
Both the trend and variability of Q300 and Qml are comparatively small in the Laptev-East Siberian and Beaufort seas, as these regions are fully ice-covered for most of the year with limited surface mixing. It is worth mentioning the close agreement between the two reanalyses, with an exception for a minor discrepancy in the Laptev-East Siberian Q300, which is greater in C-GLORSv5 than ORAS5.
3.2 Assessment of budget closure
The net annual heat transport through the main Arctic gates is shown in Fig. 4 for C-GLORSv5 and ORAS5 and complemented in Table 2. The largest contribution to the total ocean heat transport into the Arctic comes from the BSO (62–99 TW C-GLORSv5; 57–96 TW ORAS5, with values referring to annual means), followed by Fram Strait (14–47 TW C-GLORSv5; 19–38 TW ORAS5), Davis Strait (8–16 TW C-GLORSv5; 10–19 TW ORAS5), and Bering Strait (4–12 TW C-GLORSv5; 5–14 TW ORAS5). Transports along all sections show an upward trend for both reanalyses except for Davis Strait, where the net transport has been decreasing (−0.29 GW yr−1 in C-GLORSv5 and −0.24 GW yr−1 in ORAS5). While there is a satisfactory agreement between the two reanalyses, C-GLORSv5 generally simulates smaller net transports via the Fram and Davis straits and a larger net transport via the BSO relative to ORAS5. As a result, the total Arctic OHT is slightly lower in C-GLORSv5 than in ORAS5 (99–150 and 103–155 TW, respectively).
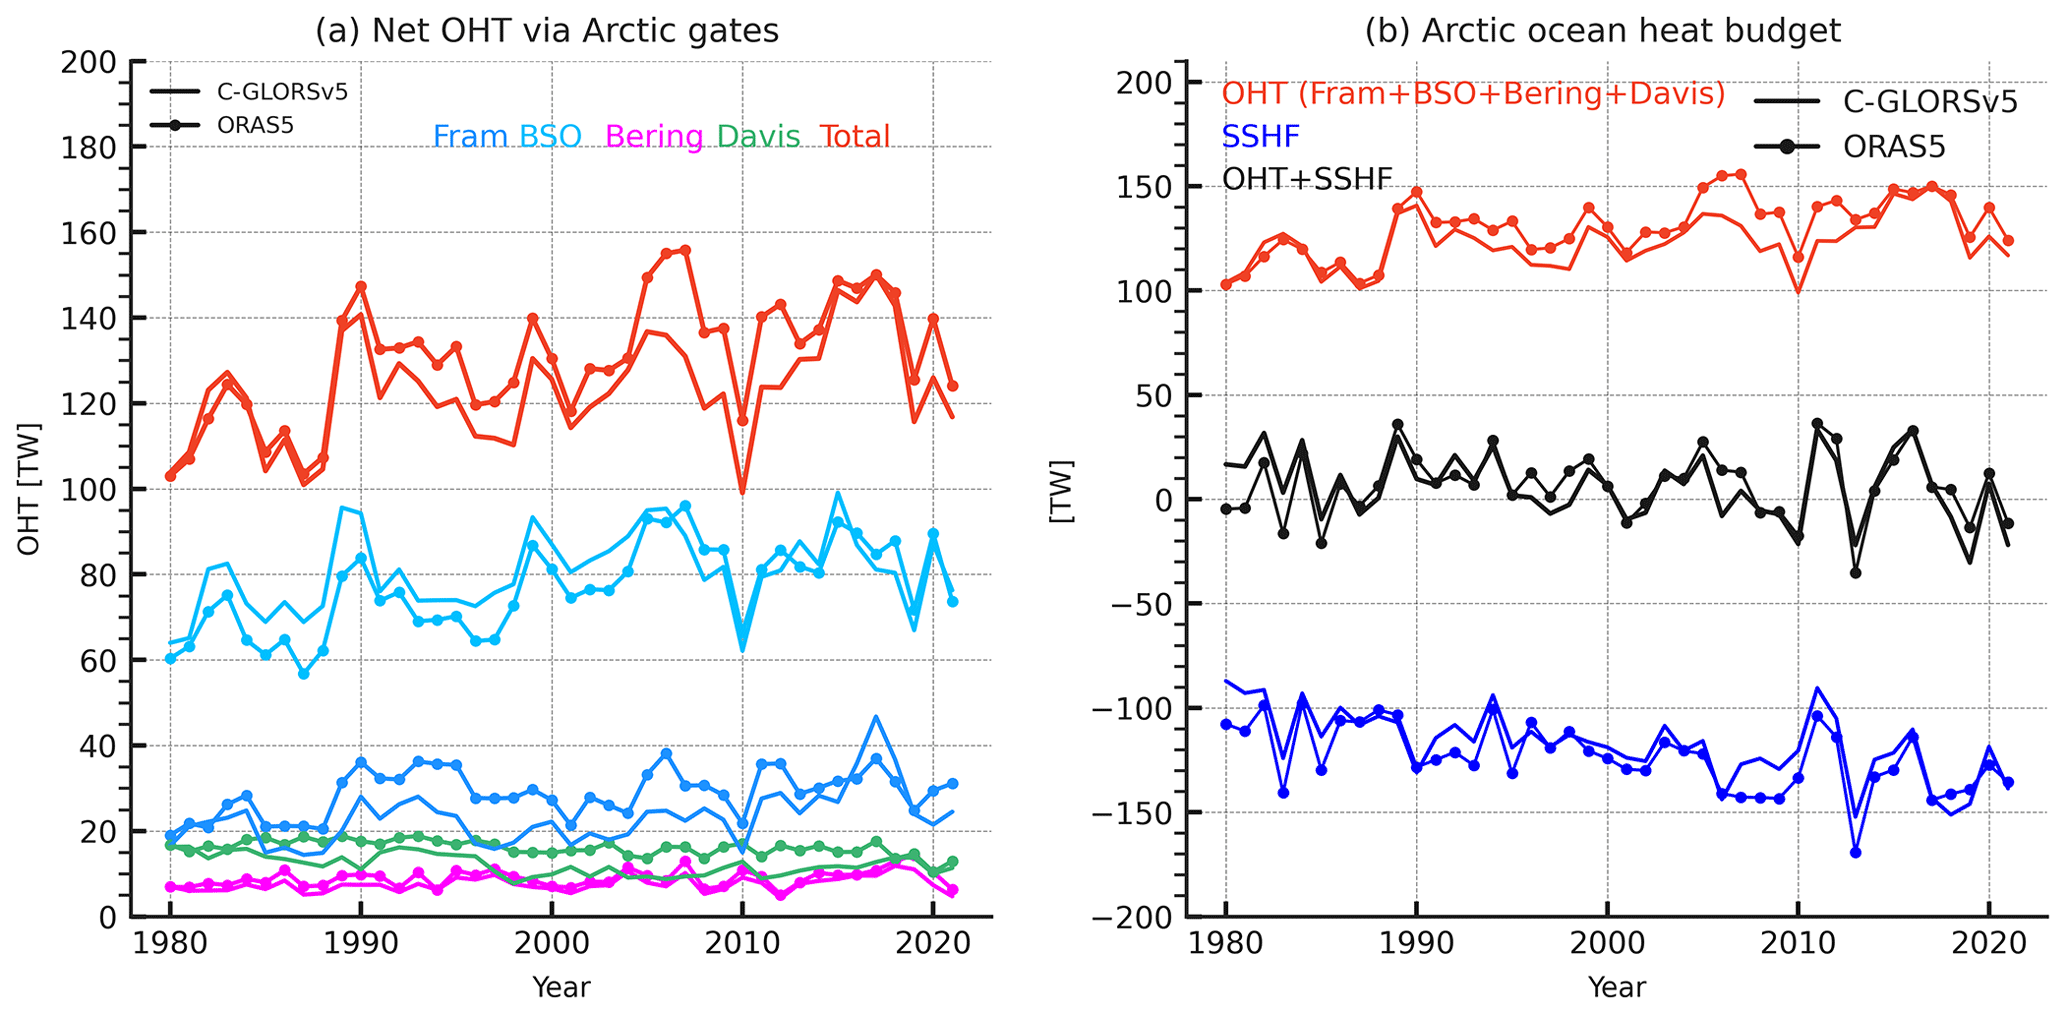
Figure 4Annual time series of (a) ocean heat transport (OHT, TW) via the four main Arctic gates and their sum (red lines) and (b) pan-Arctic heat budget for C-GLORSv5 (solid) and ORAS5 (dot symbols). The locations of the Arctic gates are marked in Fig. 1. Surface heat flux (SSHF) is weighted on the area bounded by the four gates, and the negative sign indicates ocean heat loss. Black lines in panel (b) denote the sum of total ocean heat transport and surface heat flux.
Table 2Average net ocean heat transport (referenced to Tref=0 °C) via Arctic gates [TW] for the C-GLORSv5 and ORAS5 reanalyses and for existing observational and model estimates.a
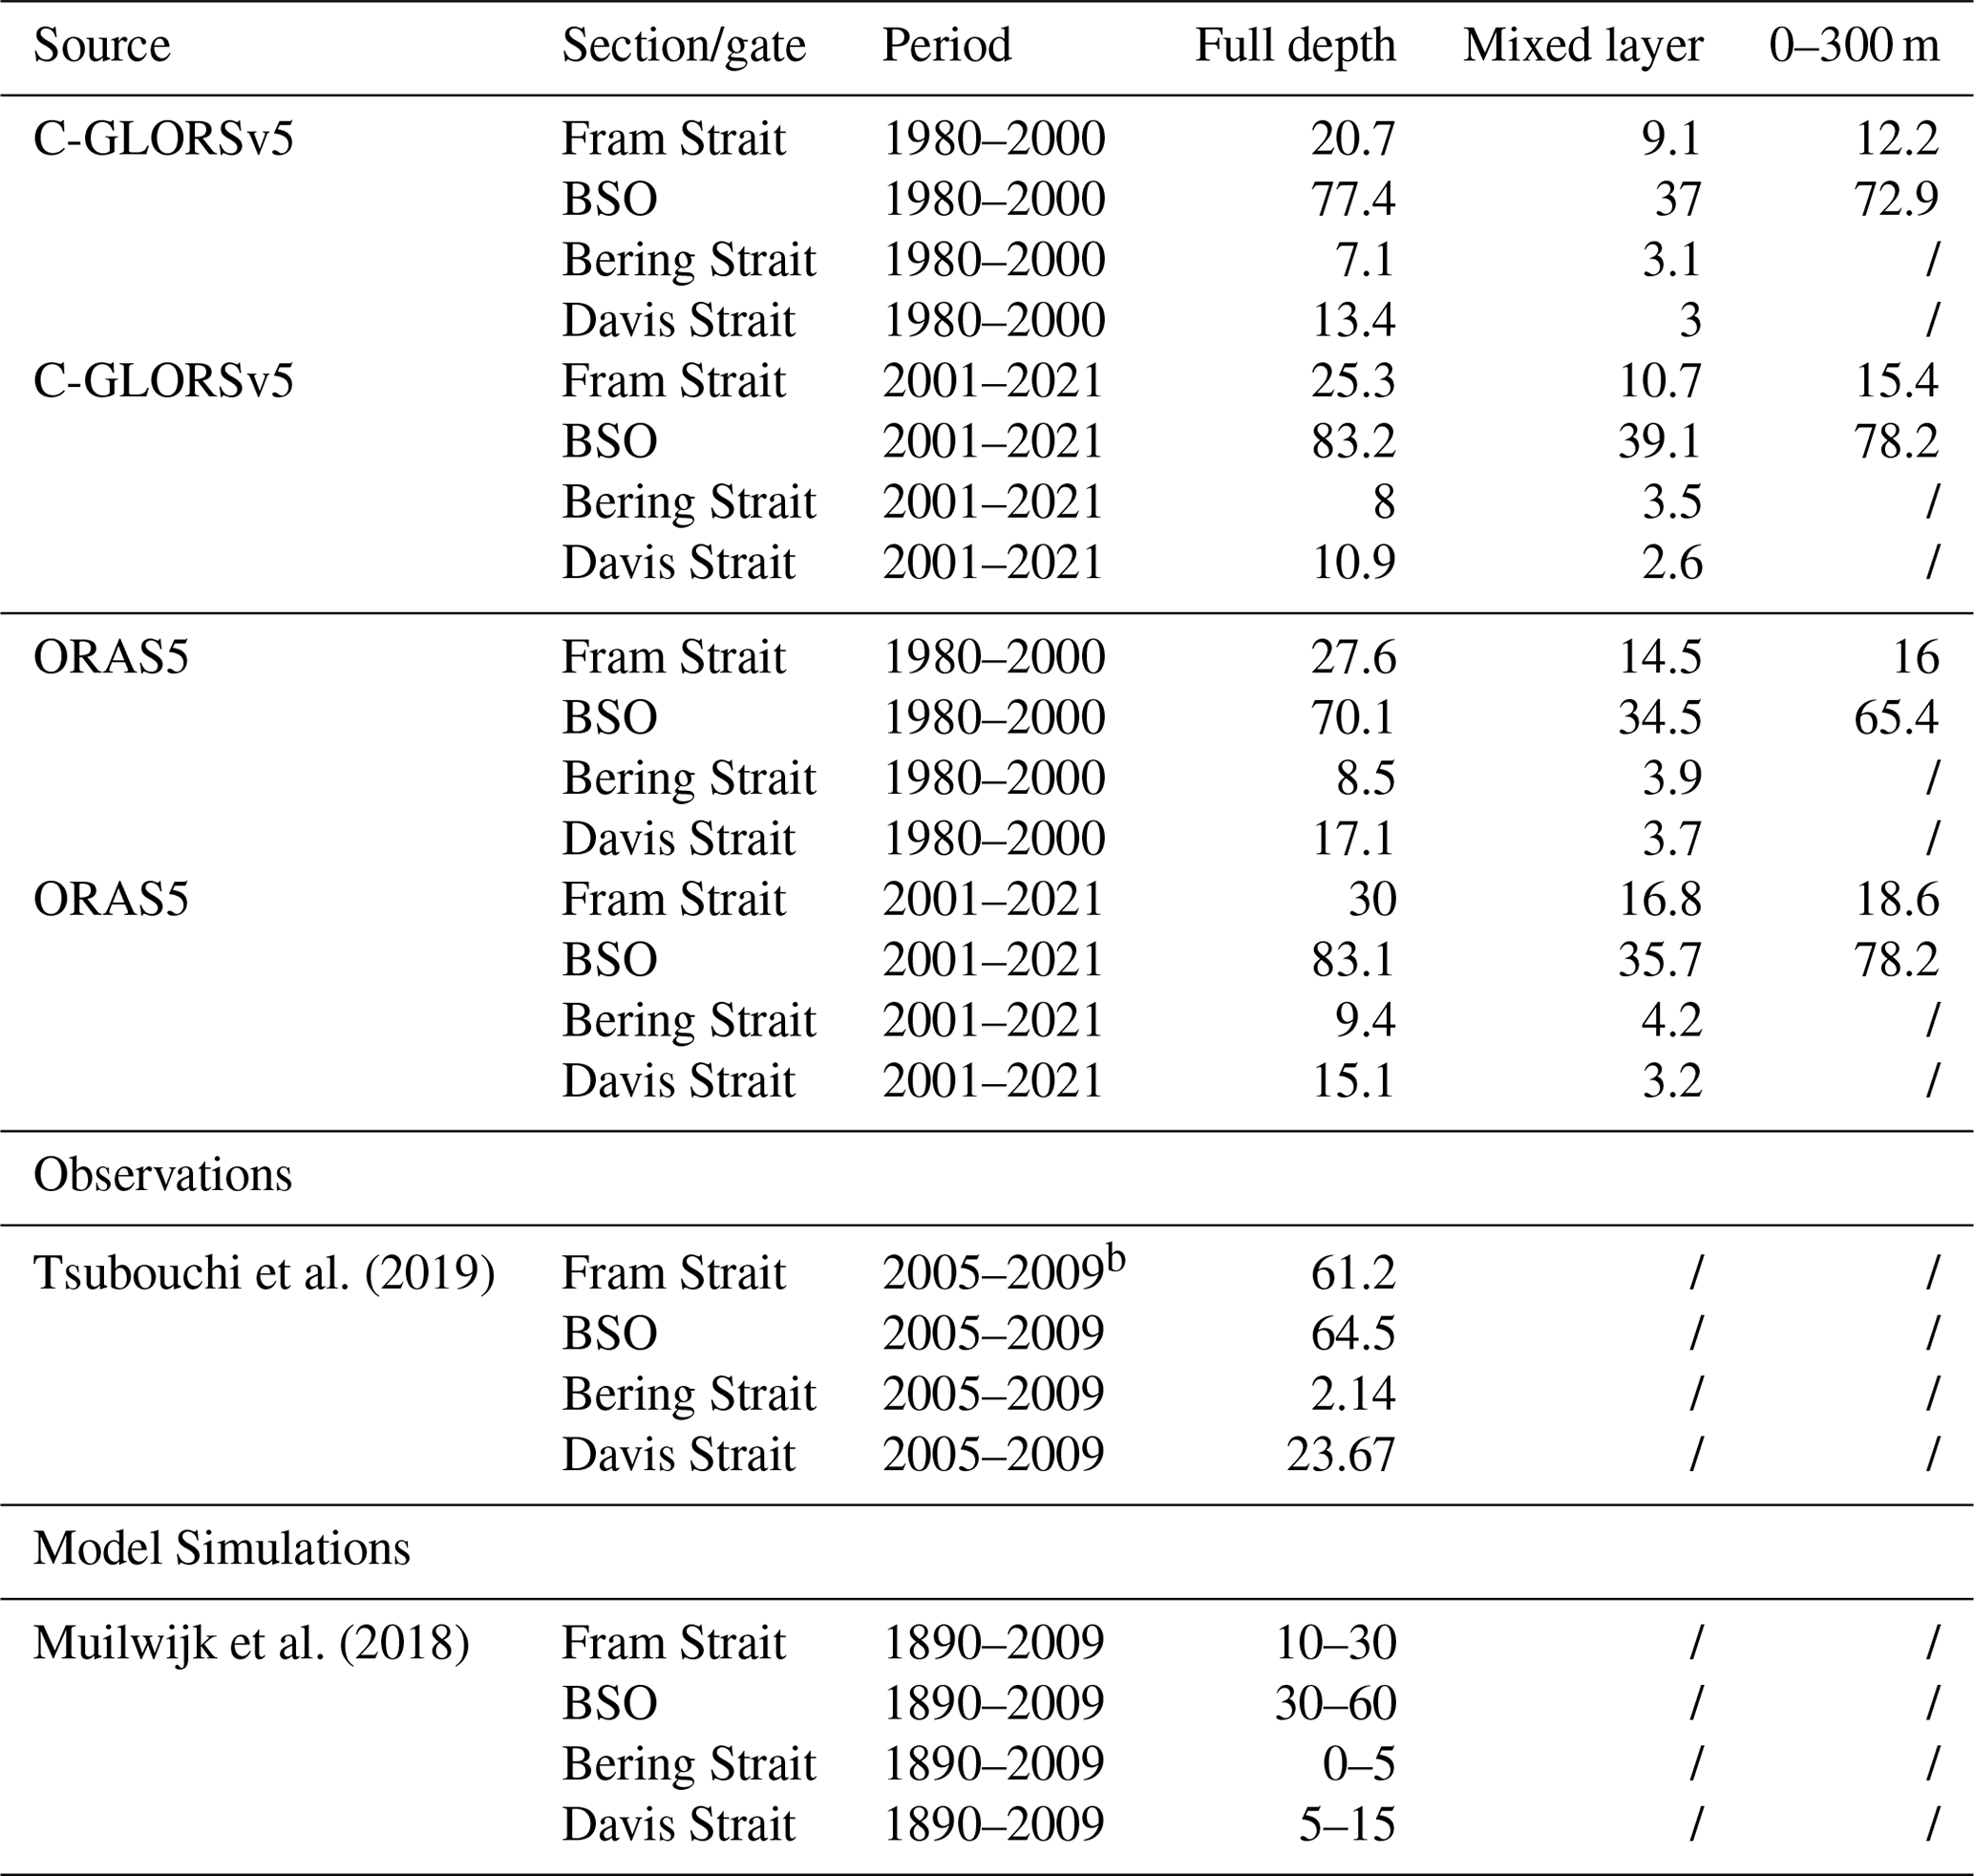
a Averages for C-GLORSv5 and ORAS5 are computed from monthly net heat transports. OHT for the 0–300 m layer is marked as “/” if the section depth is shallower than 300 m and values therefore correspond to the full depth OHT. b Values refer to January 2005–December 2009 averages based on mooring data (details in Tsubouchi et al., 2018).
We find OHT in C-GLORSv5 and ORAS5 to be generally consistent with the existing literature, though a direct comparison with previous studies, especially observational ones, is challenging given the sensitivity of heat transport estimates to AW temperatures, temporal coverage, and chosen reference temperature values (Table 2). Our 1980–2000 estimates for Fram Strait and Davis Strait are in close agreement with the 1948–2007 multimodel mean of 22.9 and 13.4 TW, respectively, in CORE-II models (Ilıcak et al., 2016) and with NorESM model estimates by Muilwijk et al. (2018) (both studies adopt Tref=0 °C). The BSO OHT during 1980–2000 (70.1 and 77.4 TW in ORAS5 and C-GLORSv5, respectively) is larger than the 1948–2007 multimodel mean of 55.96 TW (Ilıcak et al., 2016) and the observed estimate of 64.5 TW for 2005–2009 (Tsubouchi et al., 2019) referenced to 0 °C. Albeit referenced to a different temperature ( °C), we find close agreement with Maslowski et al. (2004), who reported 74 TW through the BSO in the same period (1979–2001).
Between 1980–2021, the total net OHT into the Arctic Ocean shows a positive trend in both reanalyses (1.21 GW yr−1 in C-GLORSv5 and 1.92 GW yr−1 in ORAS5). The increase in heat transport can also be appreciated by comparing monthly OHT estimates via each gateway averaged over the two halves of the time series (1980–2000 and 2001–2021; Table 2). The upward trend in OHT is offset by an overall decline in surface heat fluxes averaged over the pan-Arctic region (SSHF; −2.3 GW yr−1 in C-GLORSv5; −1.95 GW yr−1 in ORAS5), which is associated with enhanced ocean heat release to the atmosphere, owing to sea ice loss (Smedsrud et al., 2022). With the opposing trends of OHT and SSHF, the surface heat budget is closed around zero over the historical time series (Fig. 4b), with good agreement between the two reanalyses.
Annual time series of regional heat budgets (Fig. 5) further demonstrate the realistic representation of ocean heat advection and surface heat fluxes in the C-GLORSv5 reanalysis. Net heat transport into the Barents-Kara region has been increasing at a rate of 0.93 GW yr−1, chiefly due to the upward trend in OHT through the BSO. The increase in OHT to this region is offset by a weak decline in surface heat fluxes (SSHF + OIHF, −0.2 GW yr−1), which is however non-significant and levels off after 2010, indicating a reduction in the overall cooling efficiency of the Barents-Kara region relative to the previous decades. Similarly, in all other regions, the sum of advective and surface heat flux terms after the late 2000s marks a shift towards warmer conditions due to reduced ocean heat loss. We find this to be largely driven by a sharp drop in OIHF in all regions, concurrent with a decline in sea ice concentration (Fig. 5e–h).
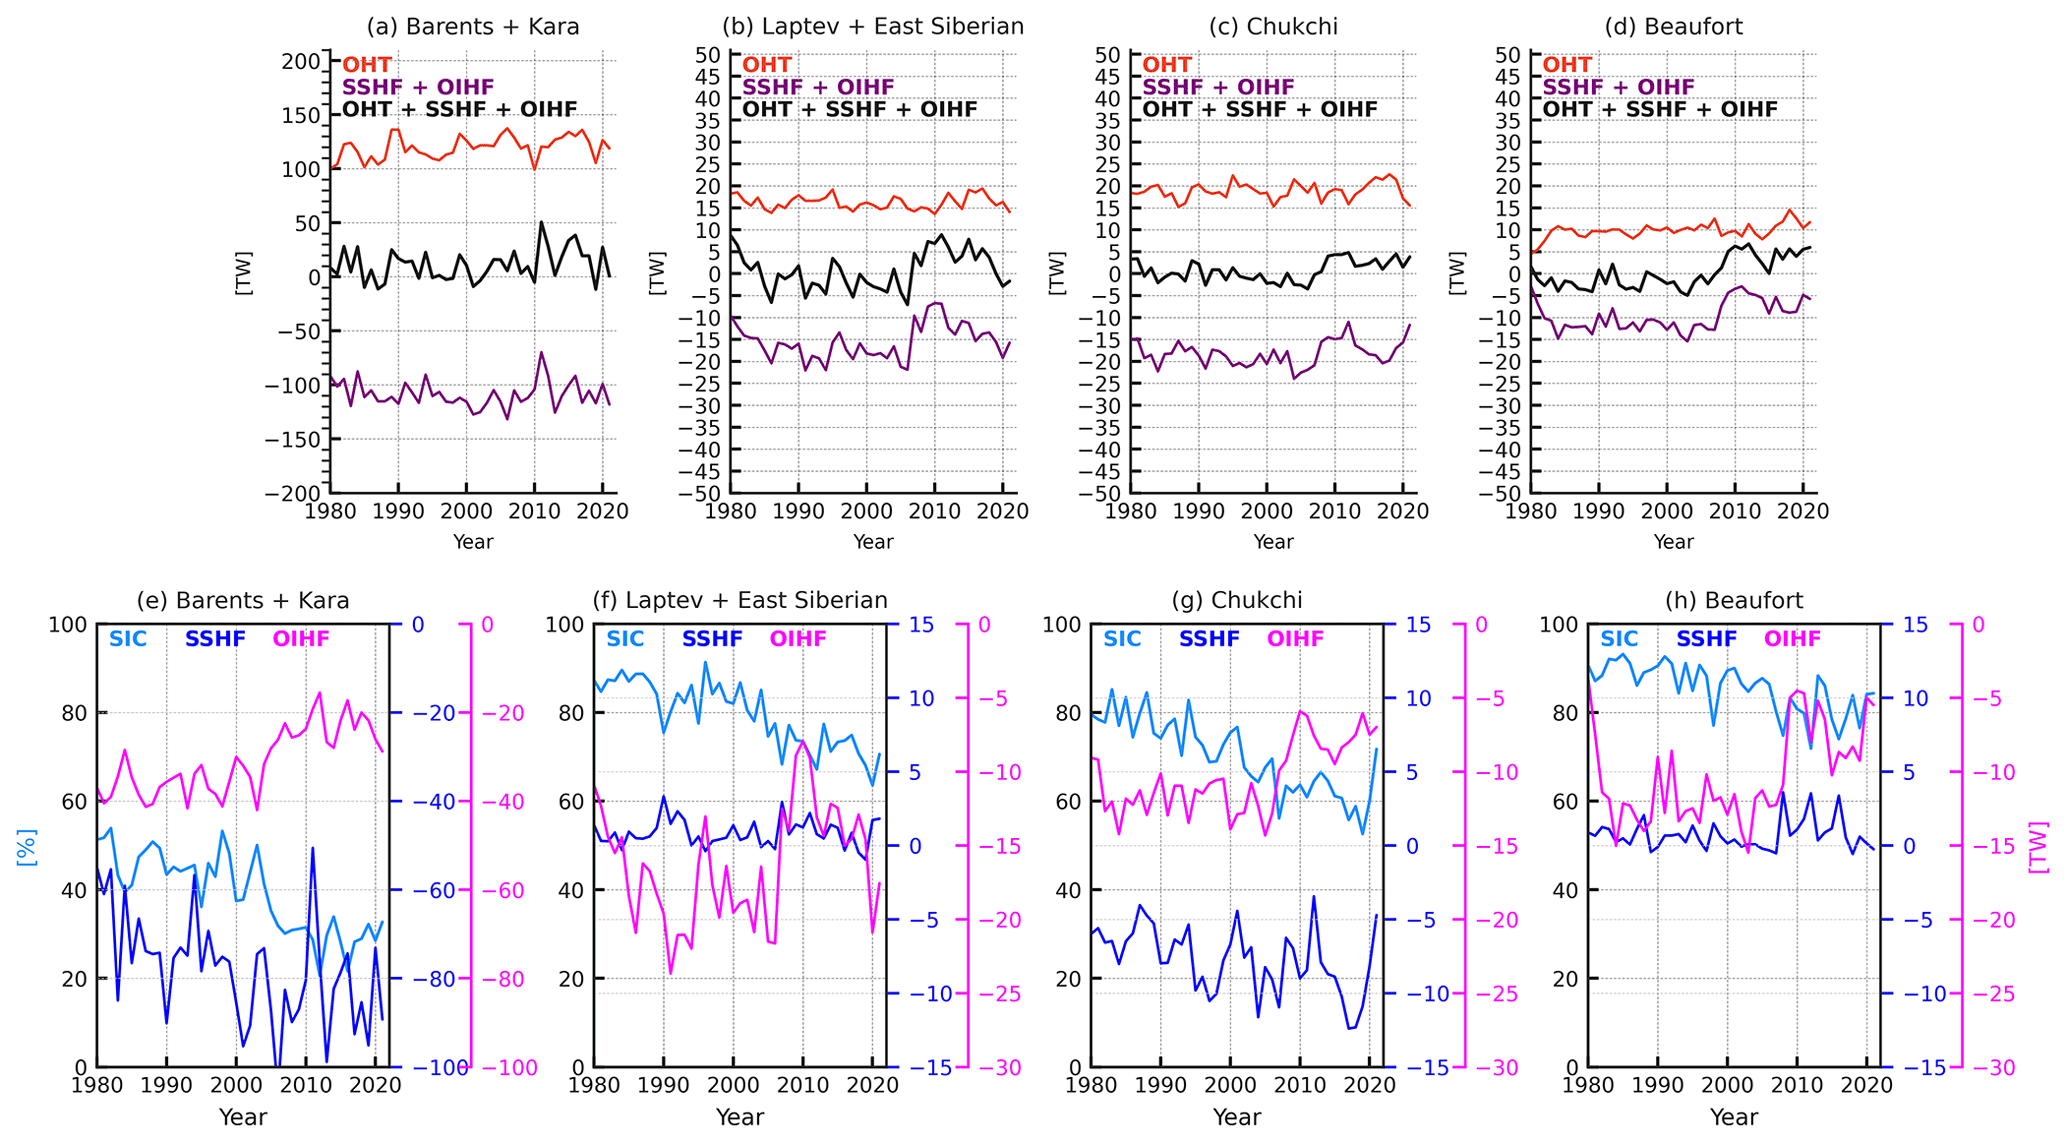
Figure 5Time series of regional ocean heat budgets in the C-GLORSv5 reanalysis. (a–d) Annual time series of ocean heat transport, surface ocean heat fluxes and their sum. Ocean heat transport into a given region is defined as the sum of the net ocean heat transport along each section bounding the region, as marked in Fig. 1. Surface heat fluxes (navy blue lines in a–d) are defined as the sum of net sea surface heat flux (SSHF) for the ice-free fraction of the grid cell and the ocean–ice heat flux (OIHF) for the ice-covered fraction of the grid cell. (e)–(h) shows the individual contribution of SSHF and OIHF in each region. Time series of sea ice concentration are shown in light blue. Note that here the sign of OIHF, which is positive from the ocean to sea ice, is reversed to match SSHF, indicating ocean heat loss.
3.3 Ocean heat content as a precursor of SIC variability
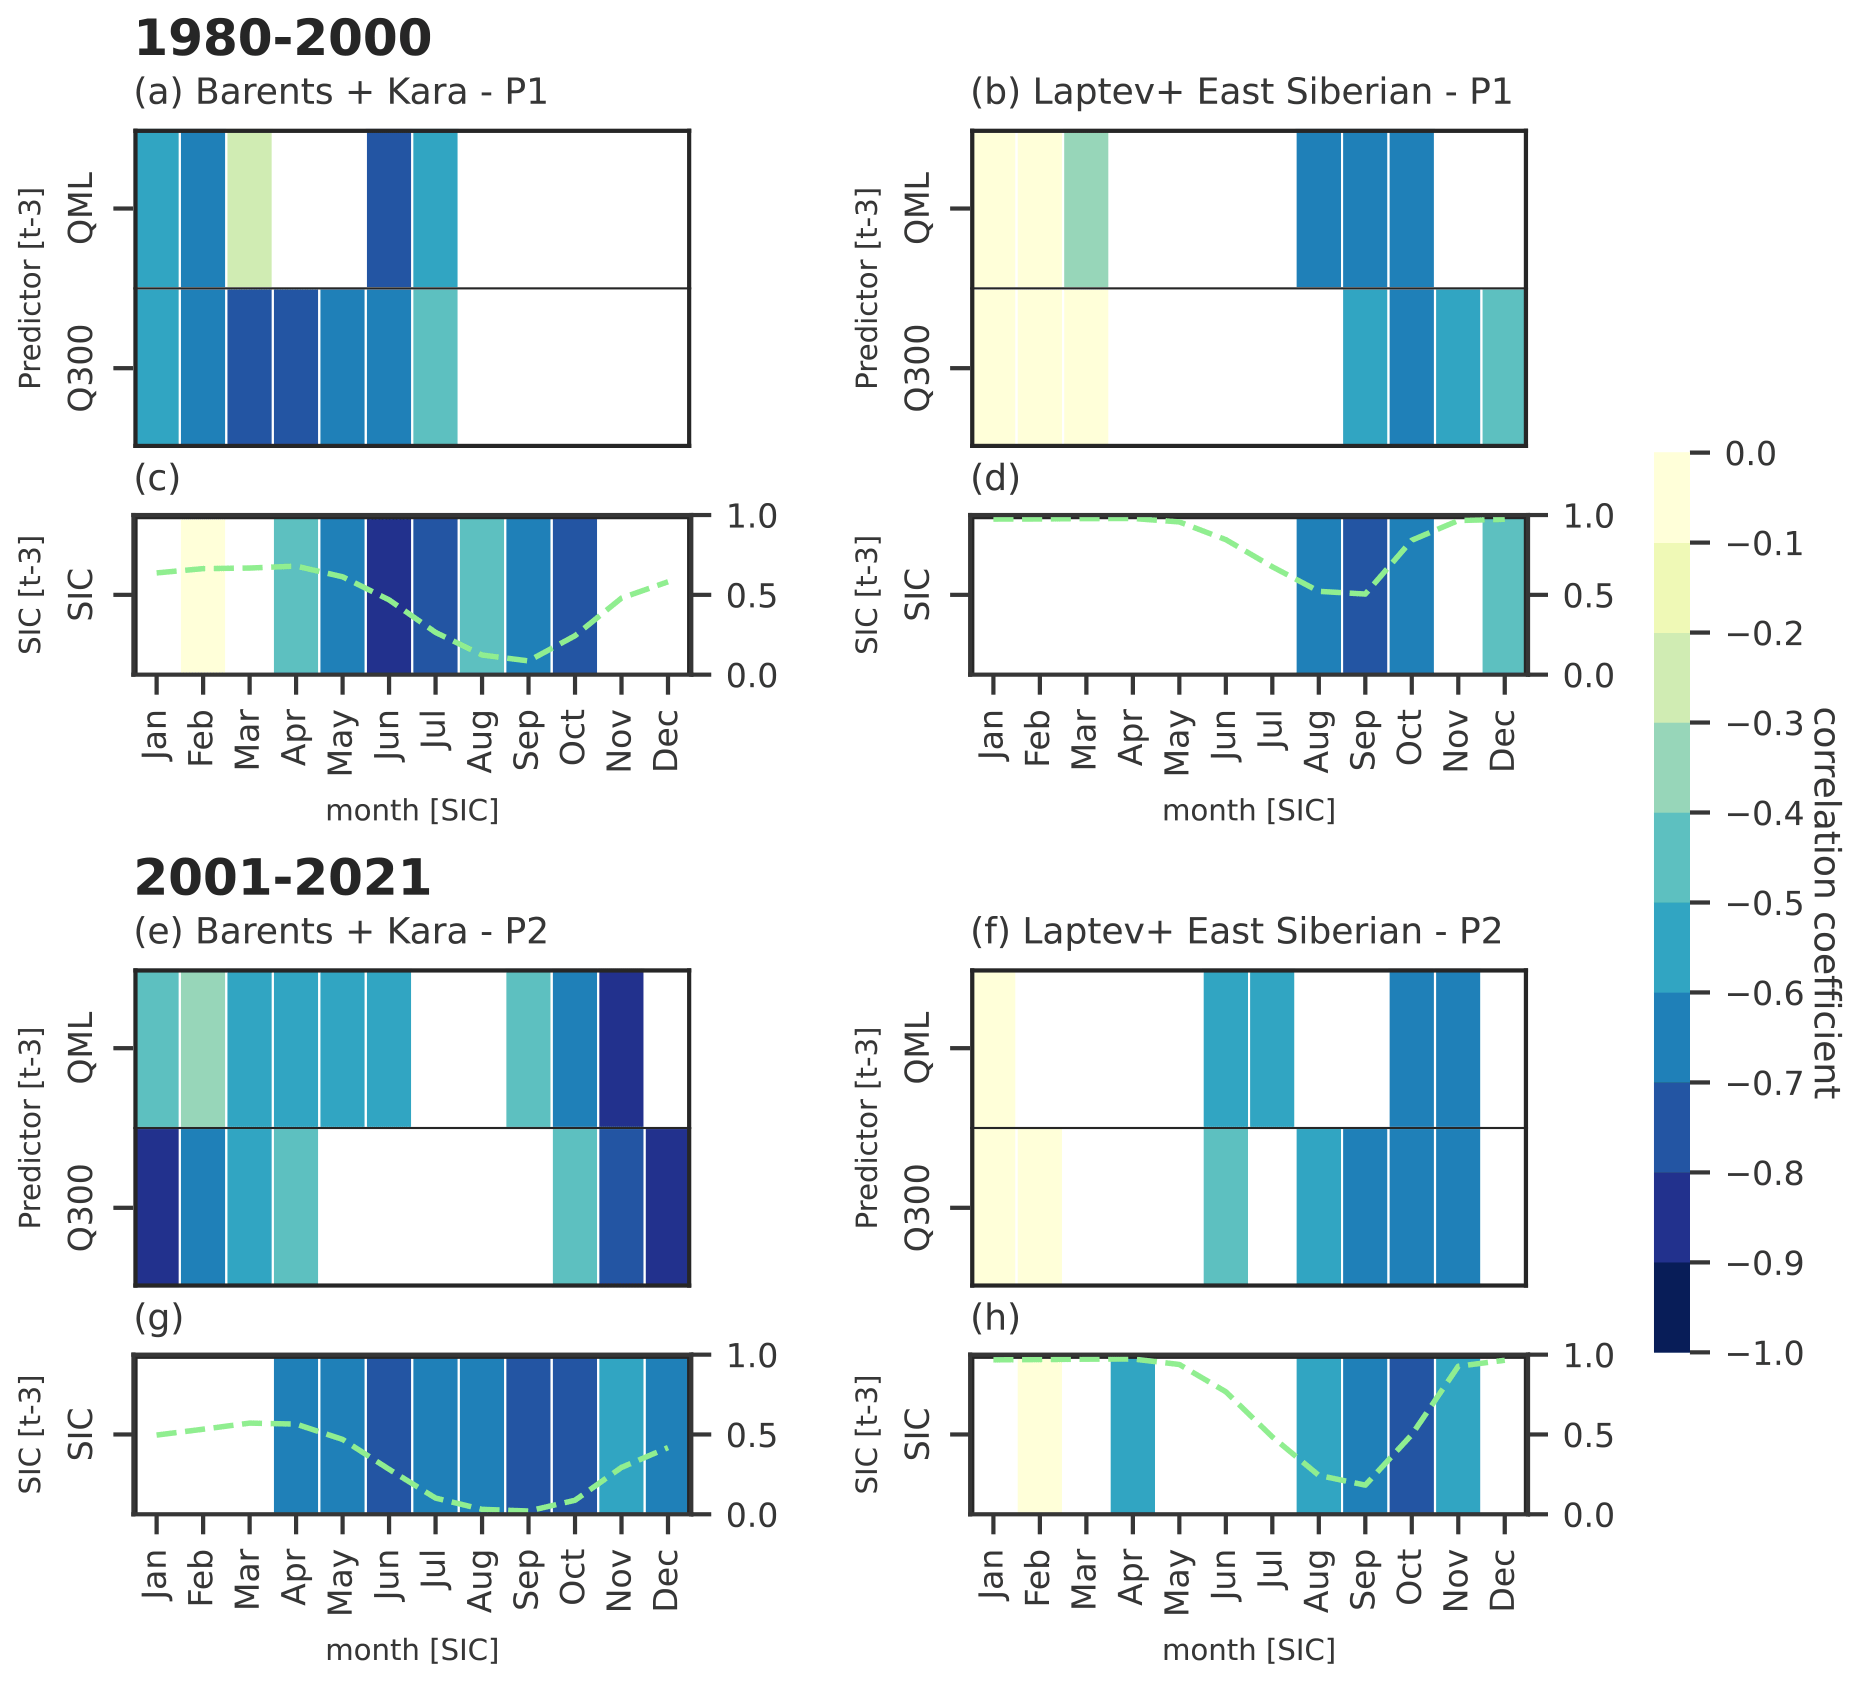
Building on the results of the heat budget analysis, we explore the role of upper-ocean heat content as a precursor of SIC anomalies in the Arctic's regional seas and how this has changed between the first (1980–2000) and second half (2001–2021) of our time series. Figure 6 shows 1-month lag correlations between SIC anomalies at each month and ocean heat content anomalies at both target depths (Q300 and Qml), along with 1-month lag SIC anomaly auto-correlations for the C-GLORSv5 reanalysis. The equivalent figure for ORAS5 is presented in Fig. A1 in Appendix A. We focus on the Barents-Kara and Laptev-East Siberian seas as these regions have undergone the most remarkable changes in the Q–SIC interaction between the two periods. Regional differences in the seasonal patterns of correlations are largely consistent with the seasonal cycle of sea ice in each region (dashed green lines in Fig. 6). In the Barents-Kara region, SIC variability is closely linked to Q300, and the seasonal peak of correlations occurs in the freezing season (January–February), consistent with the timing of strongest AW inflow towards the Arctic (e.g., Beszczynska-Möller et al., 2012).
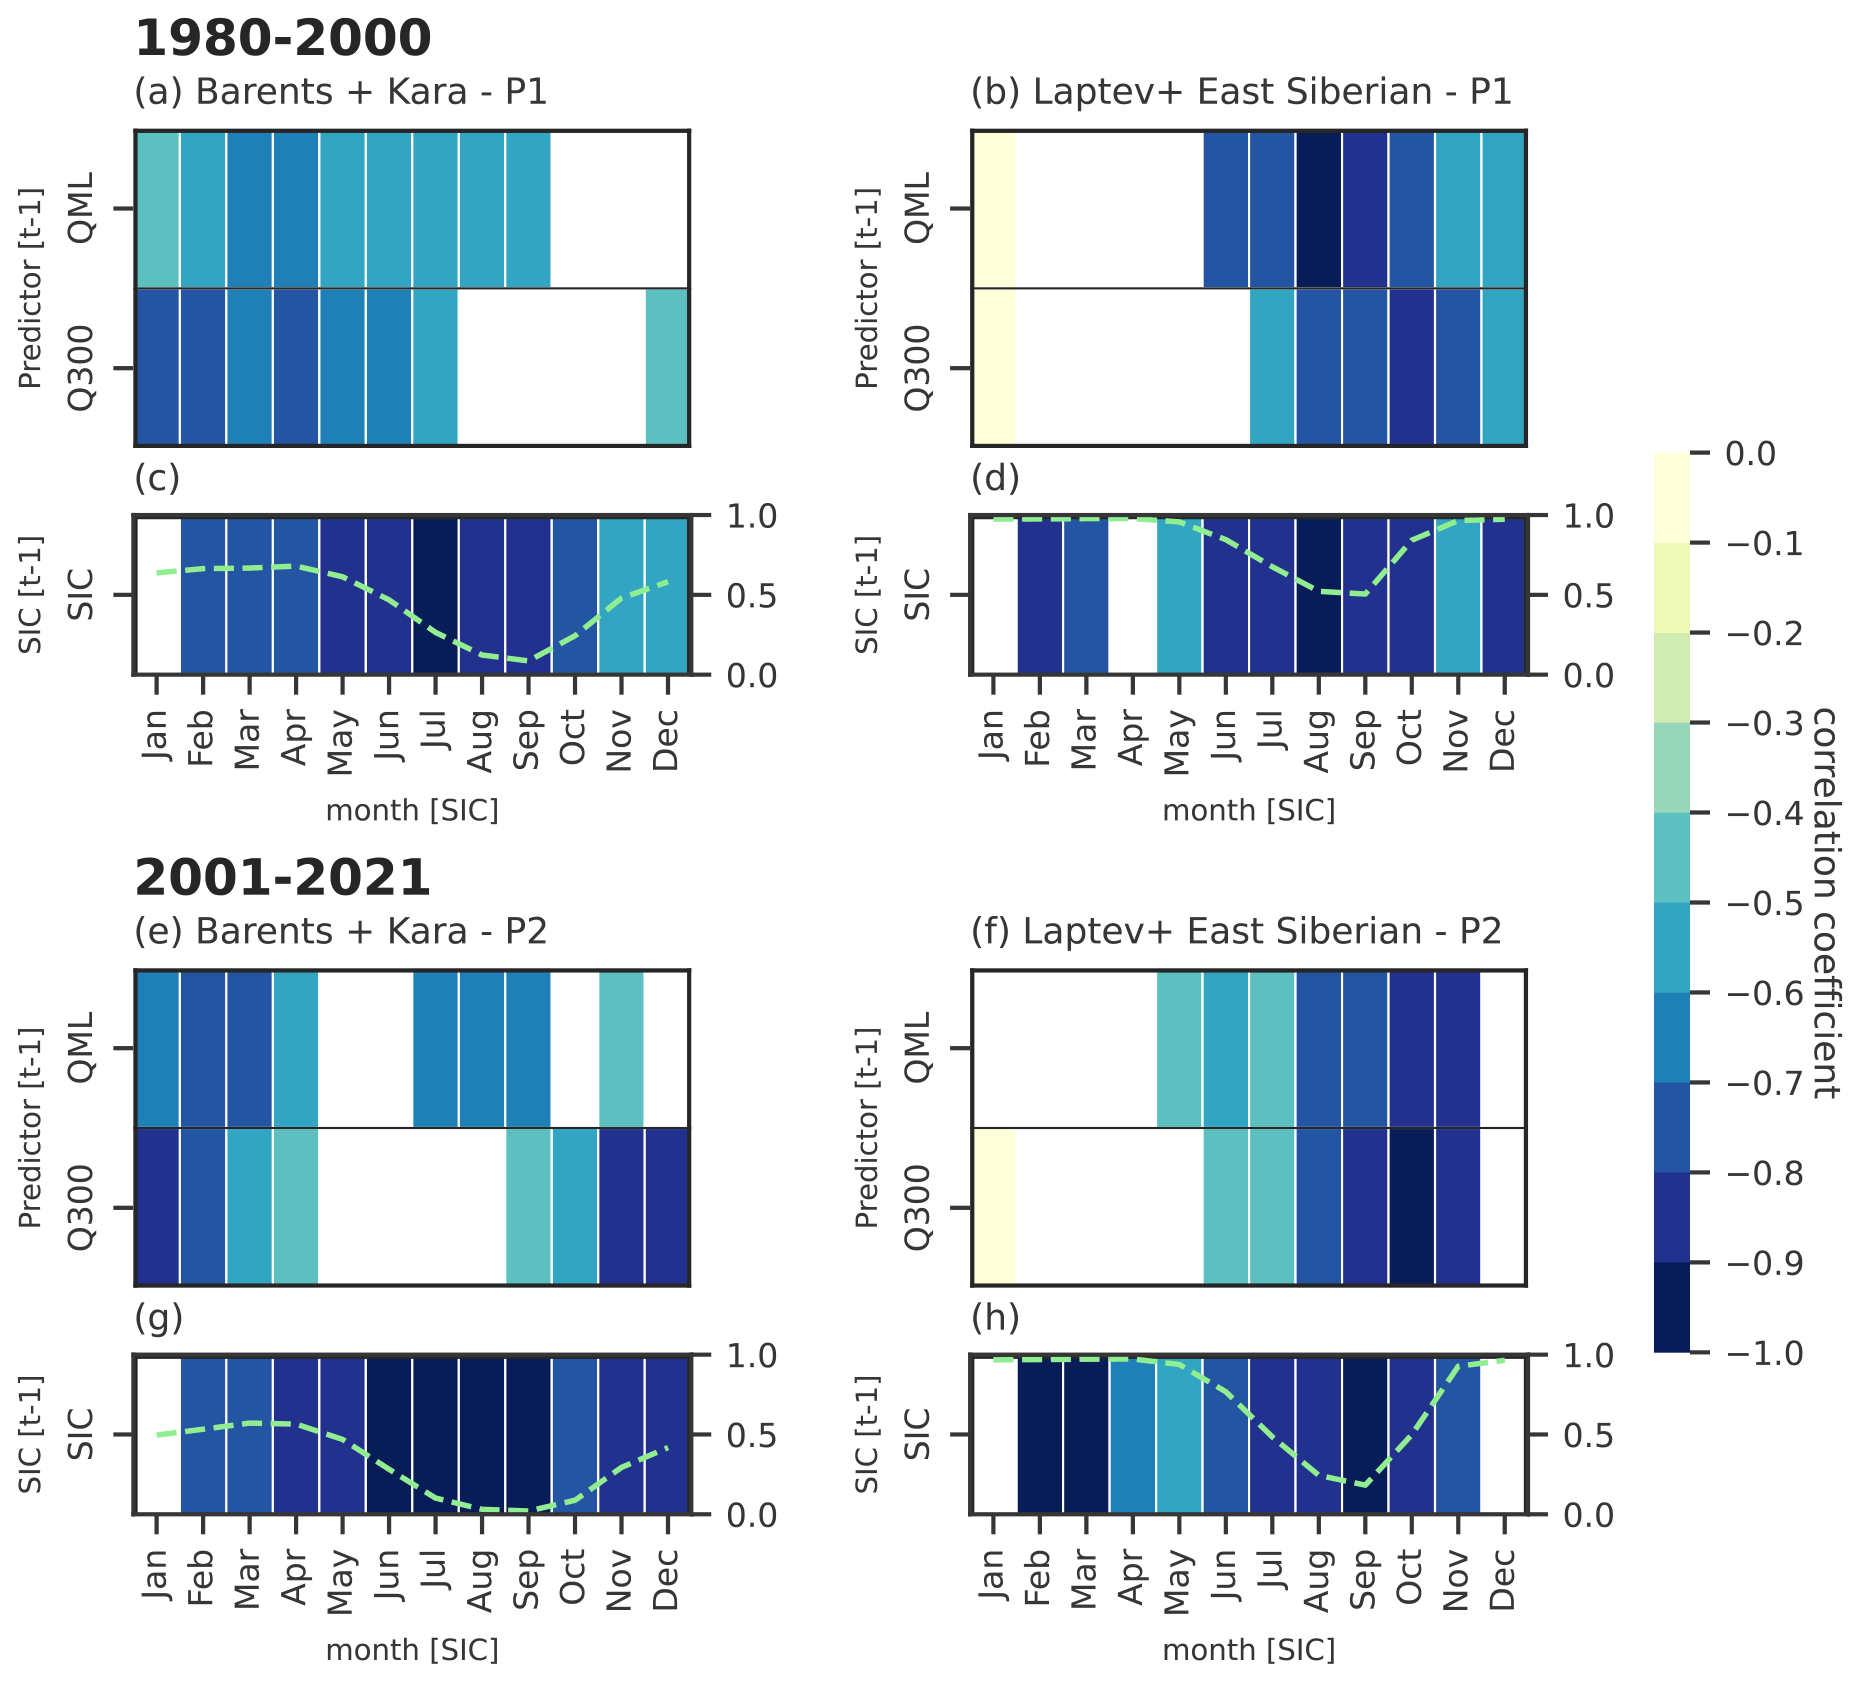
Figure 6One-month lagged correlations between SIC anomalies and ocean heat content anomalies in the 0–300 m layer and in the mixed layer, in the Barents-Kara and Laptev-East Siberian regions for the 1980–2000 (a–b) and 2001–2021 (e–f) periods, with the ocean leading sea ice. The 1-month lag SIC anomaly auto-correlation is shown in the bottom panels for comparison (c–d, g–h). Dashed green lines indicate the SIC seasonal cycle in each region and period. Note that the sign of SIC auto-correlation is inverted. All values shown in color are significant at the 95 % level; empty boxes denote non-significant correlations. For brevity, only C-GLORSv5 is shown. The equivalent figure for ORAS5 is provided in Appendix A.
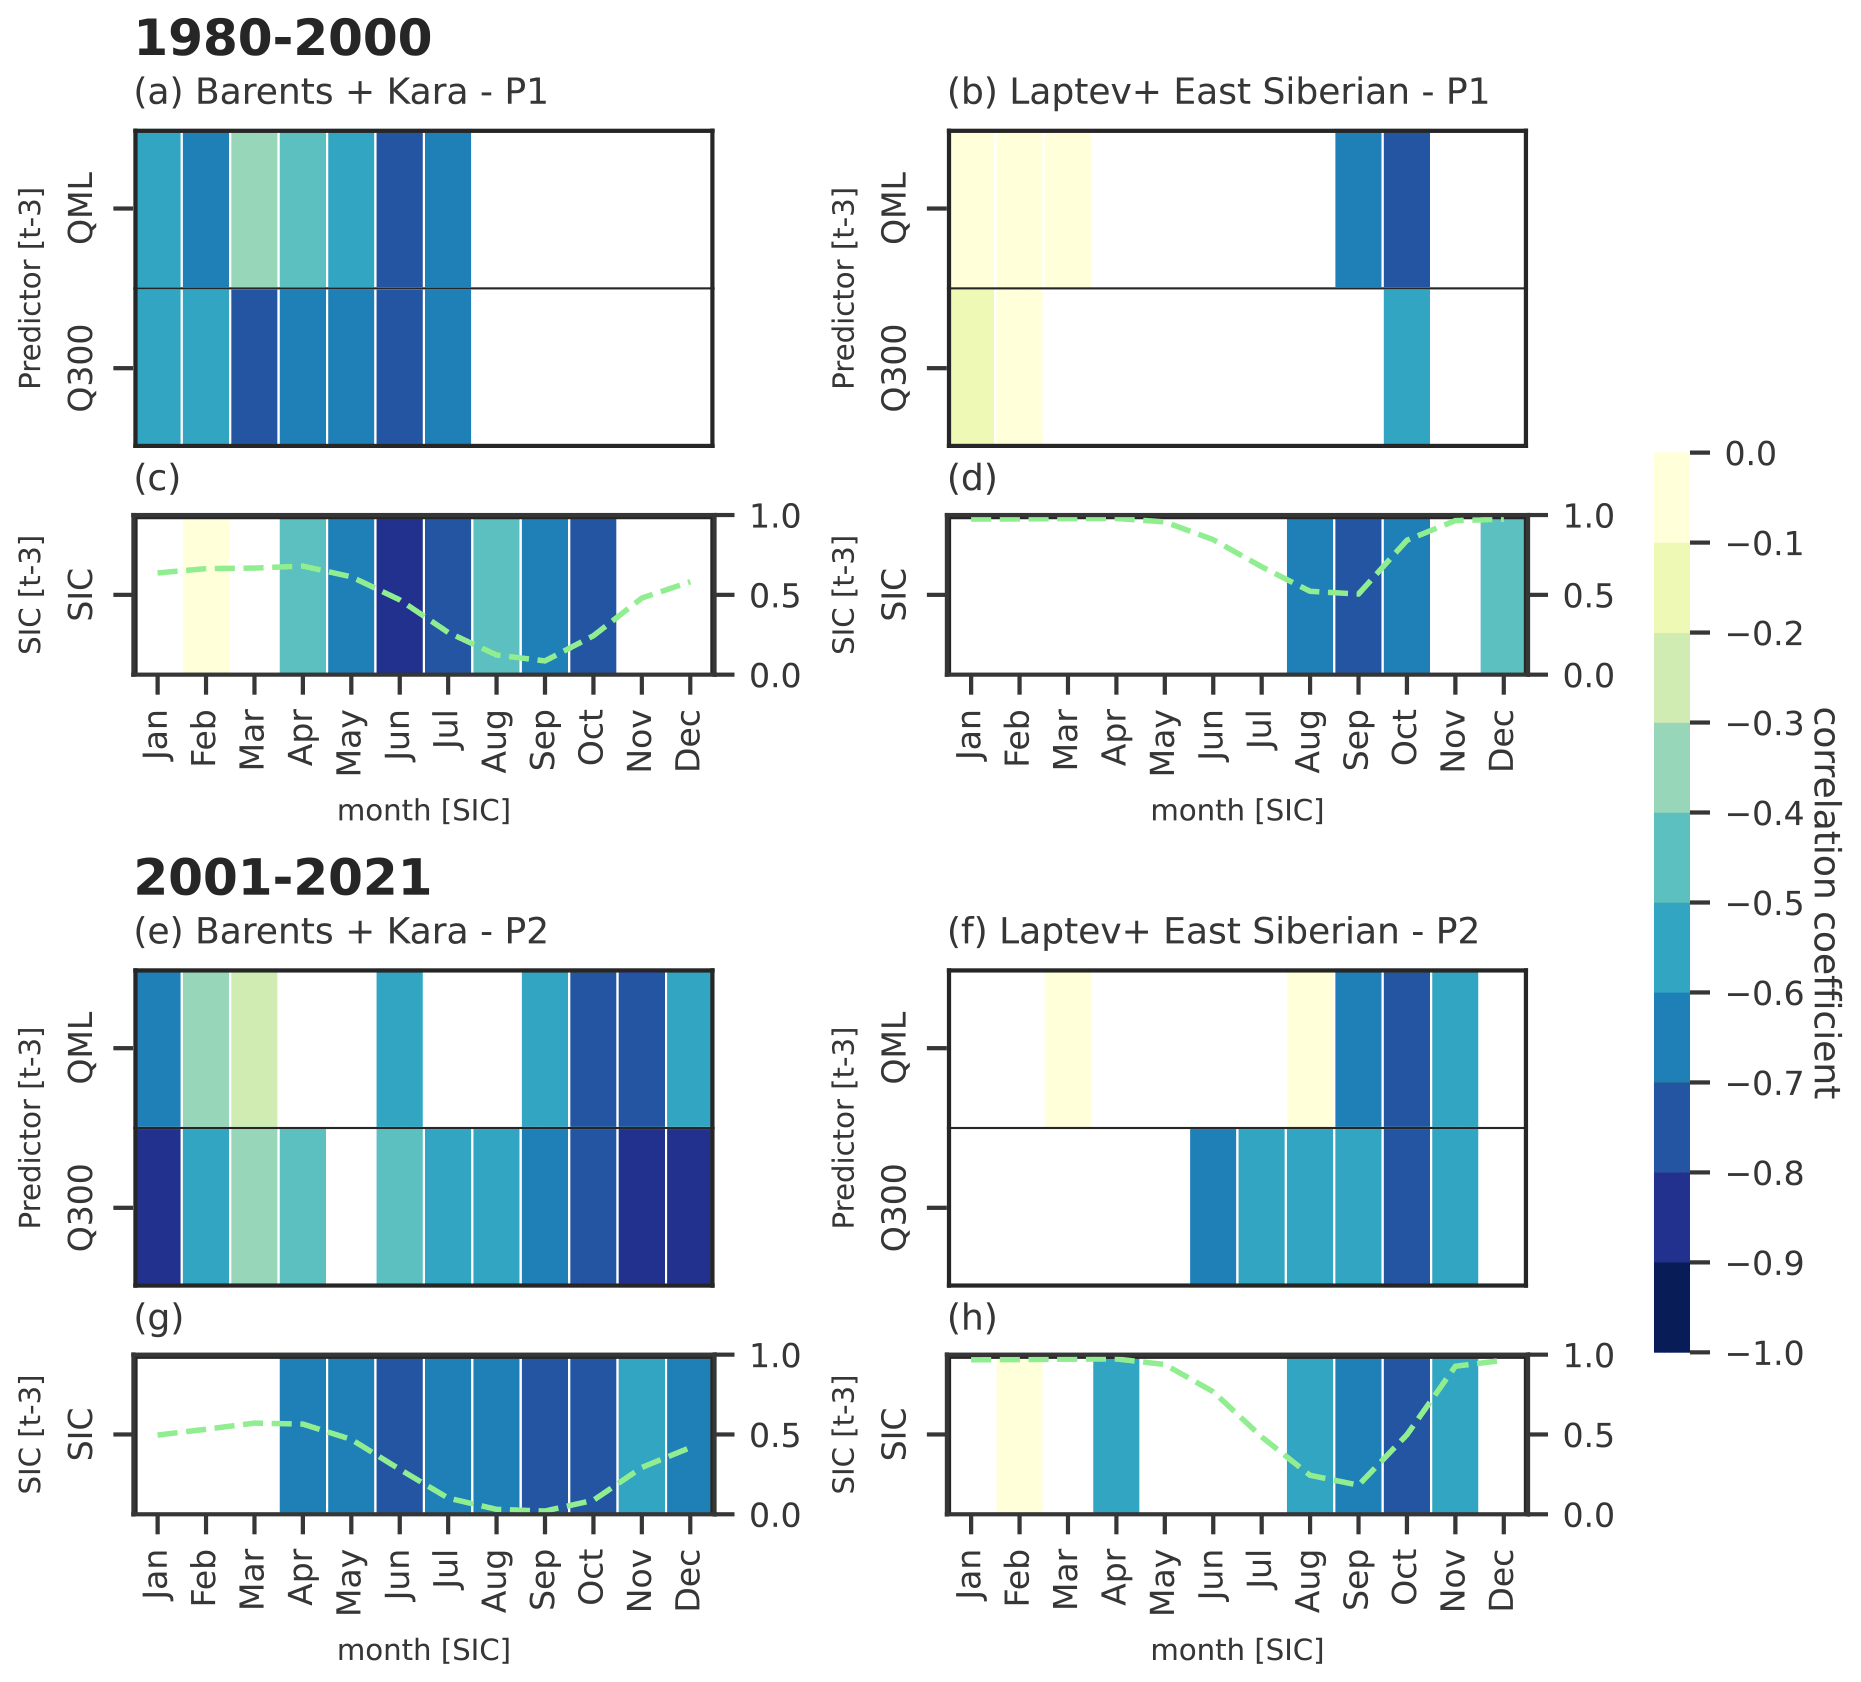
During the second half of the time series (2001–2021, Fig. 6e–h), changes in ocean warming and melt season duration are reflected in SIC predictability. The 1-month lagged Q–SIC correlation is increased, particularly in the autumn (note the shift in the maximum Qml–SIC correlation from August to October–November in the Laptev-East Siberian region). Relative to 1980–2000, the influence of Q300 on SIC variability in the Barents-Kara region during winter (November–January) 2001–2021 is considerably more negative: for instance, the correlation of January SIC to December Q300 increased from in 1980–2000 to in 2001–2021 in C-GLORSv5 (from to in ORAS5), while the December-to-January SIC auto-correlation is not significant in either period. Changes in the intensity and seasonality of the Q–SIC coupling between the two periods are also noticeable in the Chukchi Sea, where the correlation between SIC and Q anomalies at both target depths appears intensified in the autumn months (October–December) during 2001–2021 (not shown). No substantial changes are observed in the Beaufort Sea (not shown). Though with considerable regional differences, correlations between sea ice and ocean heat content anomalies are also significant at 2 months lag (Figs. A2 and A3, which show 2-month lagged Q–SIC correlations for C-GLORSv5 and ORAS5, respectively) and at 3 months lag (Figs. 9 and A4, which show 3-month lagged Q–SIC correlations for C-GLORSv5 and ORAS5, respectively).
Overall, the 1-month lagged SIC auto-correlation also increases in the second half of the time series, particularly in regions that have experienced the largest sea ice loss, i.e., the Barents-Kara region and Chukchi Sea (not shown). In the remainder of this section, we focus on the months where the 1-month lagged Q–SIC correlation is greater than the SIC auto-correlation and thus where the predictive potential of ocean heat content is highest.
3.3.1 Qml and autumn sea ice in the Pacific Arctic
The regional seas of the Pacific Arctic (East Siberian, Chukchi, and Beaufort seas) are characterized by complete or near-complete winter freeze-up and are considered to be areas of greater vulnerability to warming and lengthening of the melt season (Peng and Meier, 2018; Serreze et al., 2016). In these regions, the Qml–SIC anticorrelation maximizes in autumn (sea ice advance, Fig. 7) at 1-month lag time, and correlations are generally significant up to 3 months lag (not shown).
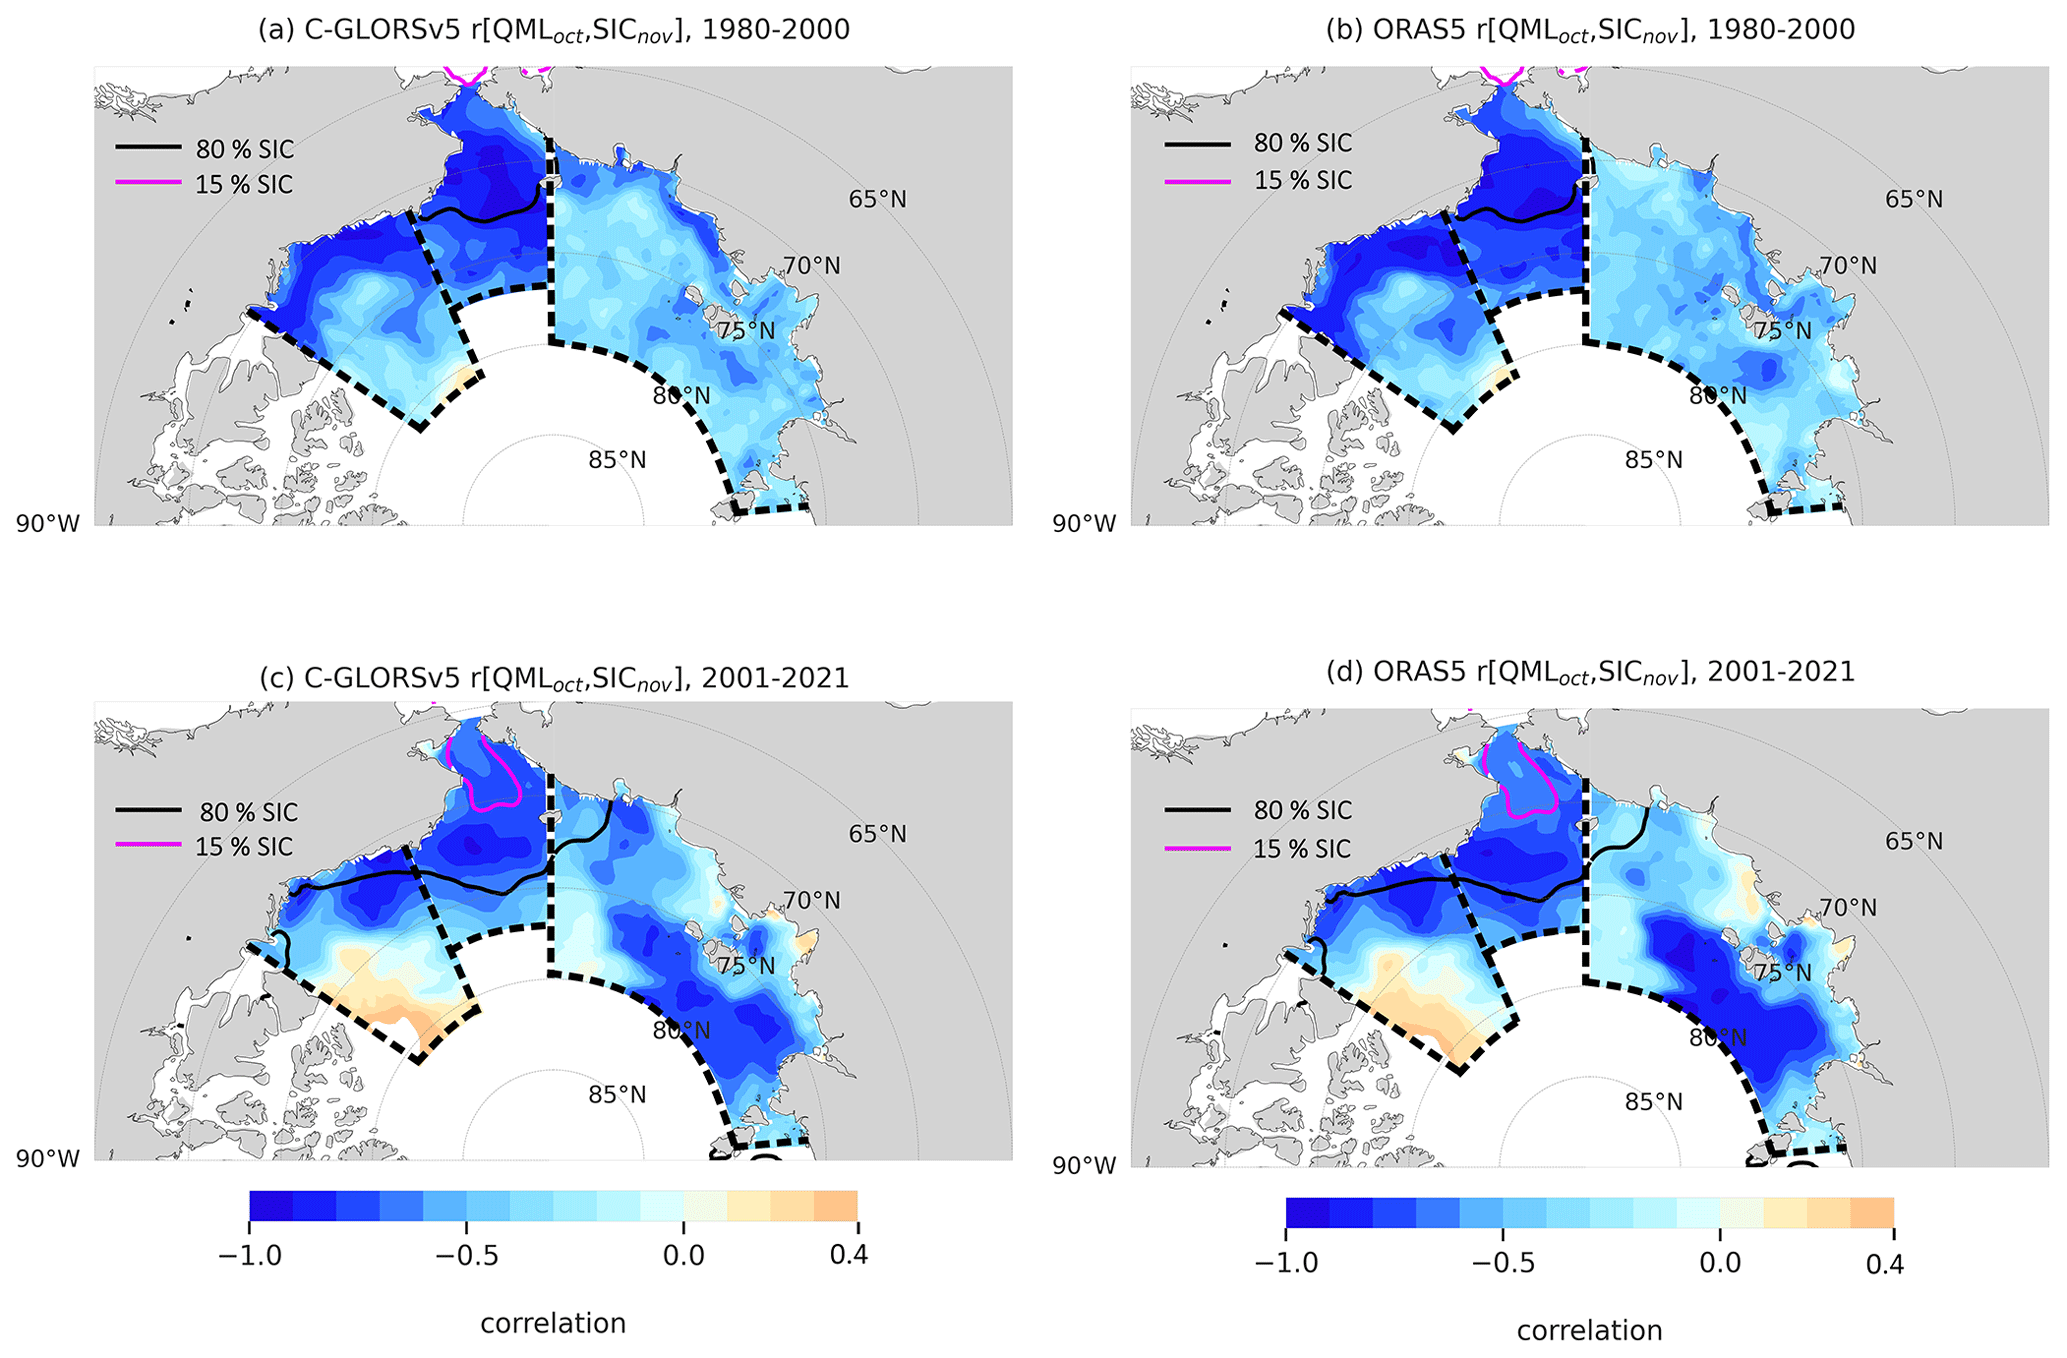
Figure 7Correlation between the region-averaged Qml in October and the grid-point SIC in November for the Laptev-East Siberian, Chukchi and Beaufort regions in 1980–2000 (a, b) and 2001–2021 (c, d) for C-GLORSv5 (a, c) and ORAS5 (b, d). Black and magenta contour lines indicate the November climatological pack ice extension (80 % SIC) and sea ice edge (15 % SIC), respectively, over each period.
Figure 7 shows spatial correlation maps of regionally averaged Qml in October and the grid-point SIC anomaly in November in both reanalyses for 1980–2000 (Fig. 7a, b) and 2001–2021 (Fig. 7c, d). In all three regions, the anticorrelation between October Qml and November SIC is higher than the October-to-November SIC auto-correlation (not shown). While this is true for both periods, there is a noticeable increase in the strength of the correlation in the Laptev-East Siberian region during 2001–2021, consistent with the shift in the timing of maximum ice–ocean coupling from summer to autumn (Fig. 6b–f). Interestingly, the spatial pattern of correlation in the northeastern Beaufort Sea indicates a reduction of the area of SIC prediction skill associated with Qml during 2001–2021 (Fig. 7c, d). This area corresponds to the region of MLD shoaling during 1980–2021 (Fig. 2b).
The negative co-variability of Q and SIC anomalies in the shelf seas of the Pacific Arctic at the time of ice formation is consistent with the influence of the relatively warm summer Pacific water inflow through the shallow (∼ 50 m) and narrow (∼ 85 km) Bering Strait (Rudels, 2015; Koenigk and Brodeau, 2014). However, we find greater difference in the predictability of November SIC between the first and second period in the Laptev-East Siberian region (from to in C-GLORSv5; from to in ORAS5) than in regions of greater PW influence, i.e., the Chukchi Sea (no change in C-GLORsv5; from to in ORAS5). This is consistent with the statistically non-significant OHT trend in the Chukchi Sea (Fig. 5c) and the weak increase in Bering Strait inflow from 1980–2000 to 2001–2021 (Table 2). Furthermore, the time evolution of heat budget components in the Laptev-East Siberian region would suggest that the shift to warmer conditions after the mid-2000s is due to a decrease in ocean–ice fluxes associated with sea ice loss rather than an increase in OHT (Fig. 5f).
3.3.2 Q300 and winter sea ice in the Barents-Kara region
In the Barents-Kara region, SIC and Q exhibit the highest negative correlation in the winter months, in agreement with existing evidence of the link between AW inflow and winter sea ice variability (Årthun et al., 2019). December Qml (not shown) and Q300 anomalies are both strongly anticorrelated with January SIC anomalies, although the correlation is higher for Q300 (Fig. 8). An intensification of the Q300–SIC link emerges in the 2001–2021 period (Fig. 8c, d), with correlations extending further east into the Kara Sea and over large part of the marginal ice zone in proximity of the St. Anna Trough. During 2001–2021, the southern Barents Sea is fully ice-free as the sea ice edge retreats north of 80° N and Atlantic water entering through the BSO is advected a longer distance before encountering sea ice. This change is consistent with the notion that a warming trend in AW inflow leads to less sea ice formation in the cold season (e.g., Long and Perrie, 2017), as previously demonstrated by the link between BSO heat transport and sea ice area (, Shu et al., 2021; , Li et al., 2017).
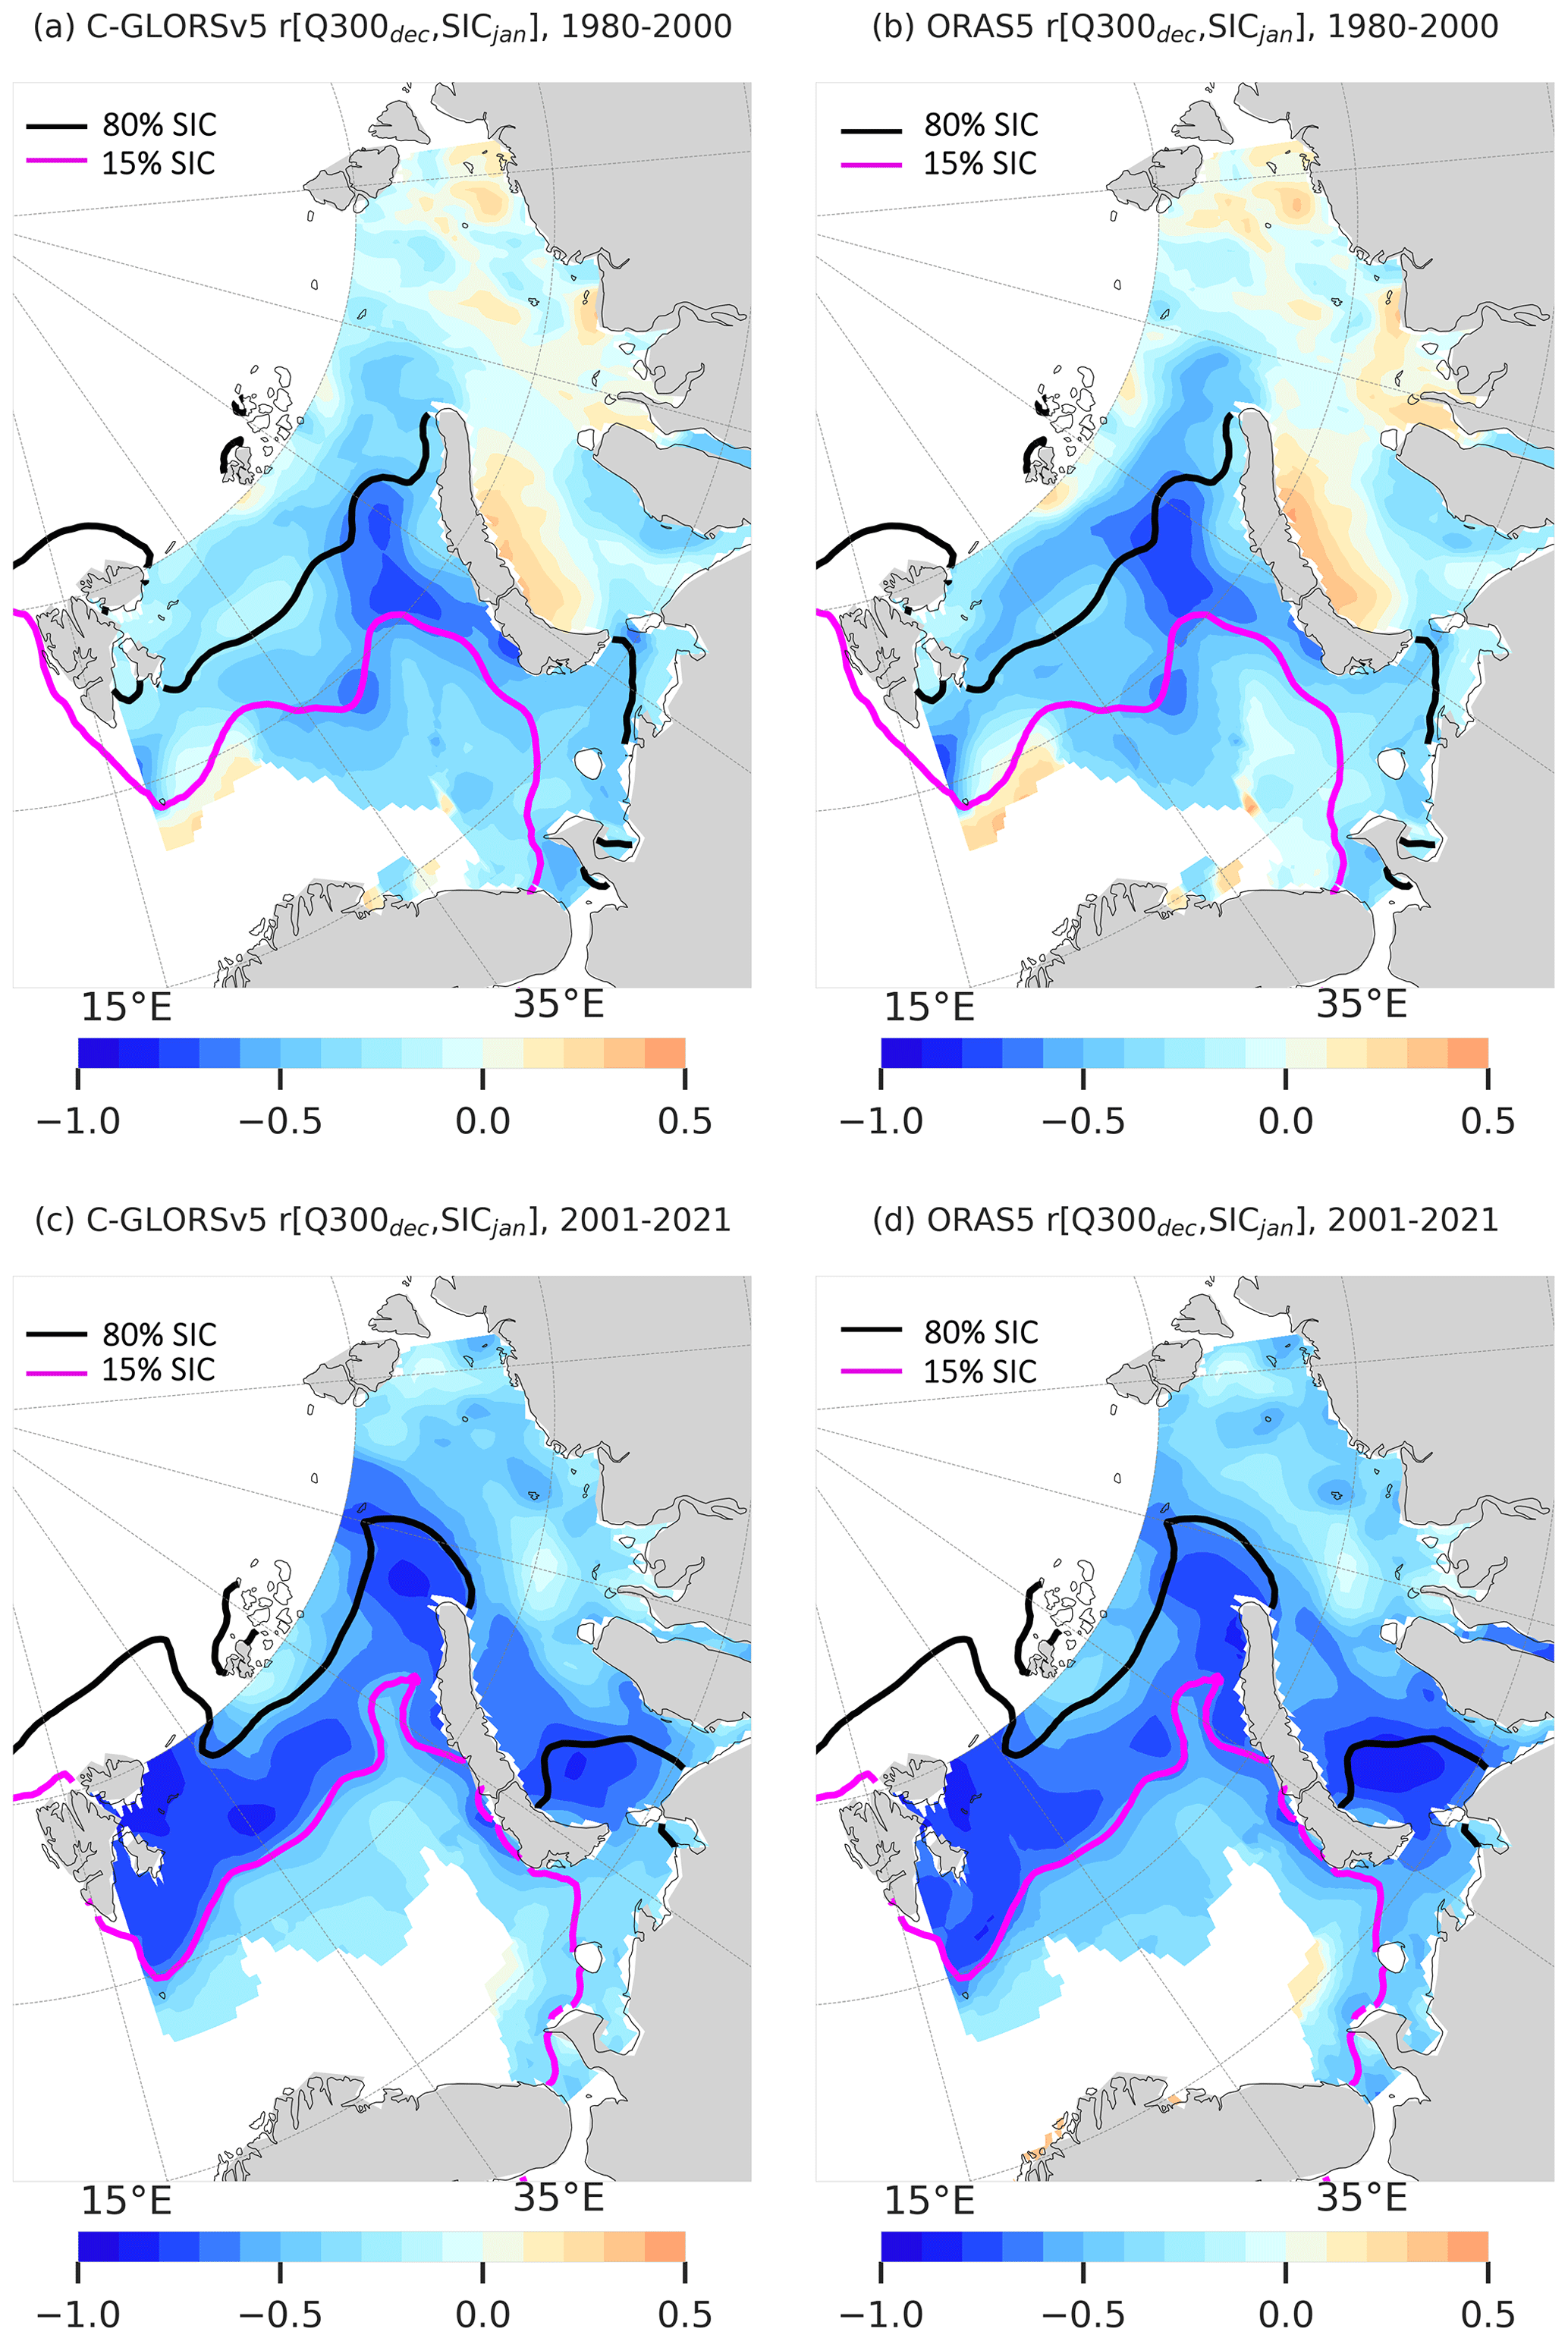
Figure 8As in Fig. 7 but showing the correlation between the region-averaged Q300 in December and the grid-point SIC in January for the Barents-Kara region in 1980–2000 (a, b) and 2001–2021 (c, d) for C-GLORSv5 (a, c) and ORAS5 (b, d). Black and magenta contour lines indicate the January climatological pack ice extension (80 % SIC) and sea ice edge (15 % SIC), respectively, over each period.
The predictability of regionally averaged winter (November–January) SIC associated with Q300 anomalies in the Barents-Kara region is maintained above up to a lead time of 3 months in both reanalyses (Figs. 9a, A4a), highlighting the importance of ocean heat content as a precursor of SIC variability in this region, especially in months with lower or non-significant SIC auto-correlation.
The analysis presented in this study aims to shed light on the implications of upper-ocean warming for regional sea ice variability. We used two eddy-permitting global ocean reanalyses, C-GLORSv5 and ORAS5, to investigate changes in ocean heat transport and surface heat fluxes via a heat budget analysis of the Arctic Ocean and its regional seas. Secondly, we assessed the role of Q anomalies in preconditioning sea ice variability by means of lag correlations. Results showed that while the total OHT into the Arctic has increased substantially between 1980–2021 (1.21 GW yr−1 in C-GLORSv5 and 1.92 GW yr−1 in ORAS5), only the Barents-Kara region is affected by a significant positive trend in ocean heat advection (0.93 GW yr−1), originating from the BSO. In this region, reduced ocean heat loss to the atmosphere after the mid-2000s also contributed to the warming trend (Fig. 5a, e), in agreement with what was found by Asbjørnsen et al. (2020). We have shown that Q anomalies in the Barents–Kara seas, particularly in the 0–300 m layer, act as an important precursor of wintertime sea ice variability on sub-seasonal timescales. Relative to 1980–2000, this link intensified and expanded northwards and eastward during 2001–2021 (Fig. 7c, d), with close agreement between the two reanalyses ( in C-GLORSv5 and −0.86 in ORAS5).
In light of these findings, it becomes apparent that the evolution of sea ice variability in the Atlantic sector will depend on the opposing contribution of poleward heat advection and surface heat loss; in other words, whether the “Barents Sea cooling machine” will gradually lose its efficiency (Skagseth et al., 2020) or rather expand it to accommodate changes in AW inflow. For instance, CMIP6 simulations by Shu et al. (2021) showed that under the RCP8.5 scenario AW warming will increase and trends in winter surface heat loss and sea ice concentration will expand poleward, together with mixed layer deepening in the northern Barents Sea and Kara Sea. According to this scenario, the Q300–SIC coupling in the Kara Sea that emerged from our analysis between 2001–2021 ( in the western Kara Sea; Fig. 8) will likely intensify and expand northward and eastward. This will likely allow for more local heat loss (negative SSHF trend) and enhanced convection as larger areas of open ocean become exposed to heat exchange with the atmosphere. According to Smedsrud et al. (2022), more heat loss will in turn accommodate for larger poleward AW inflow. However, substantial uncertainty remains around future projections of Arctic OHT, partly due to biases in AW representation in coupled climate models (e.g., Heuzé et al., 2023). It remains unclear how changes in large-scale weather patterns, which this study did not address, may have contributed to the observed strengthening of the upper-ocean–sea-ice coupling in the Barents-Kara region. It was previously demonstrated (Sandø et al., 2010) that OHT through the BSO, non-solar heat fluxes (i.e., heat loss to the atmosphere), and ocean heat content in the Barents Sea are all correlated to the North Atlantic Oscillation (NAO). On decadal timescales, variations in the NAO can induce changes in the westerlies and, as a result, oceanic heat transports (Muilwijk et al., 2018). Mikhailova et al. (2021) showed that the correlation between the NAO and winter upper-ocean temperatures in the Barents Sea weakened during 1995–2009; however, there is currently limited data to infer how this link might have evolved during the last decade (2010–present).
In the Laptev-East Siberian, Chukchi, and Beaufort seas, we found no evidence of OHT having a substantial effect on upper-ocean warming (i.e., OHT trends between 1980–2021 are not significant). Regional heat budgets point to a larger contribution of SSHF and OIHF to the overall warming, especially since the mid-2000s (Fig. 5). The variability of SIC during the warmer months is strongly linked to that of Q at 1–3 lead months, particularly Qml. During 2001–2021, the timing of maximum correlation appears shifted from summer to autumn, and the co-variability is heightened in the Laptev-East Siberian region (notably, r[Qml OCT, SICNOV] in this region increased from −0.52 to −0.86 in C-GLORSv5 and from −0.51 to −0.78 in ORAS5). This finding is consistent with recent results by Sumata et al. (2023), who highlight a regime shift after 2007 consisting of a drastic reduction in September SIC in the area of sea ice formation of the Laptev-East Siberian region, with the consequent triggering of a widespread ice–albedo feedback. The timing of the regime shift agrees with the sharp drop in SIC anomaly in 2007 in the Laptev-East Siberian region ( %), concurrent with a shift to positive Q anomalies in both reanalyses (Fig. 3b). Because extra solar heating during summer is absorbed at a higher rate than it can be released, the thermodynamic response of the ice–ocean system to warming is the shift of the ice-free season into autumn (Lebrun et al., 2019). Hence, we conclude that enhanced summer absorption of atmospheric heat associated with sea ice loss and the resulting Qml anomaly contributed to strengthening and delaying the peak of Qml–SIC anticorrelation during 2001–2021. While it is possible that an increase in Bering Strait inflow and the expansion of the Fram Strait influence along the Siberian shelf may have additionally contributed to the stronger coupling, we found no evidence that this is the case.
It is worth noting that despite the long temporal coverage of C-GLORSv5 and ORAS5, the time series analyzed in this study are insufficient to infer patterns of decadal and multi-decadal variability in OHT and SSHF. It has been suggested that the recent increase in AW inflow could be in part associated with multidecadal fluctuations (e.g., Smedsrud et al., 2013), as earlier studies showed a similar warming during the 1930s–1940s (ETCW, early 20th century warming), followed by a period of relative cooling (Polyakov et al., 2004, 2005; Muilwijk et al., 2018). Internal climate variability indeed remains a source of substantial uncertainty for the long-term evolution of sea ice.
Additionally, the limited availability of observational datasets to be used as a benchmark implies that caution should be taken when interpreting the variability and trends of reanalysis data, especially when it comes to ocean–ice heat fluxes, which here could not be compared against other sources. Given the current trends in upper-ocean warming, further work is necessary to better quantify the processes underlying the sea ice response to ocean heat surplus, particularly in regions where sea ice is transitioning to a state of higher vulnerability, i.e., the Kara and Chukchi seas (Bliss et al., 2019). For instance, changes in the strength of stratification and halocline stability, which this study did not address, remain a large source of uncertainty due to substantial regional variability and model spread (e.g., Muilwijk et al., 2022; Pan et al., 2023; Shu et al., 2022). Several physical mechanisms can influence the exchange of heat fluxes between the ocean, atmosphere, and sea ice, including changes in wind forcing (Onarheim et al., 2015; Lien et al., 2017) and freshwater fluxes (Karami et al., 2021). For instance, there is evidence that wind-driven mixing will increase under ice-depleted conditions (Perovich, 2011), which in turn will accelerate sea ice loss (Liang and Losch, 2018). At the same time, the surplus of freshwater associated with sea ice decline is expected to promote stratification, thus leading to limited vertical mixing (Davis et al., 2016). Because of these opposing contributions, predicting changes in the Arctic upper-ocean stratification remains a difficult task.
Despite the aforementioned uncertainties, our results provide clear evidence that recent changes to the Arctic Ocean's surface heat budget have induced a strengthening of upper-ocean–sea-ice interactions in the Arctic regional seas. The strong coupling between ocean heat content and sea ice anomalies that emerged from our analysis has important implications for the sub-seasonal predictability of sea ice, which is of practical value to local communities and stakeholder groups, including for the navigability of Arctic shipping routes such as the Northern Sea Route (e.g., D'Angelo et al., 2021). Given the ongoing transition of the Arctic system to thinner, younger, and more mobile sea ice, it is reasonable to expect increased vulnerability to continued warming of the upper ocean. Among other applications, ocean reanalyses have been successfully employed for the initialization of sea ice and ocean components of seasonal retrospective forecasts (e.g., Johnson et al., 2019; McAdam et al., 2022). Hence, continued efforts in the representation of upper-ocean variables through improved accuracy of ocean models, atmospheric forcing, and data assimilation schemes, together with the current expansion of the observational network (e.g., Tsubouchi et al., 2012), are crucial to help us address open questions while ensuring consistent monitoring of the Arctic Ocean climate.
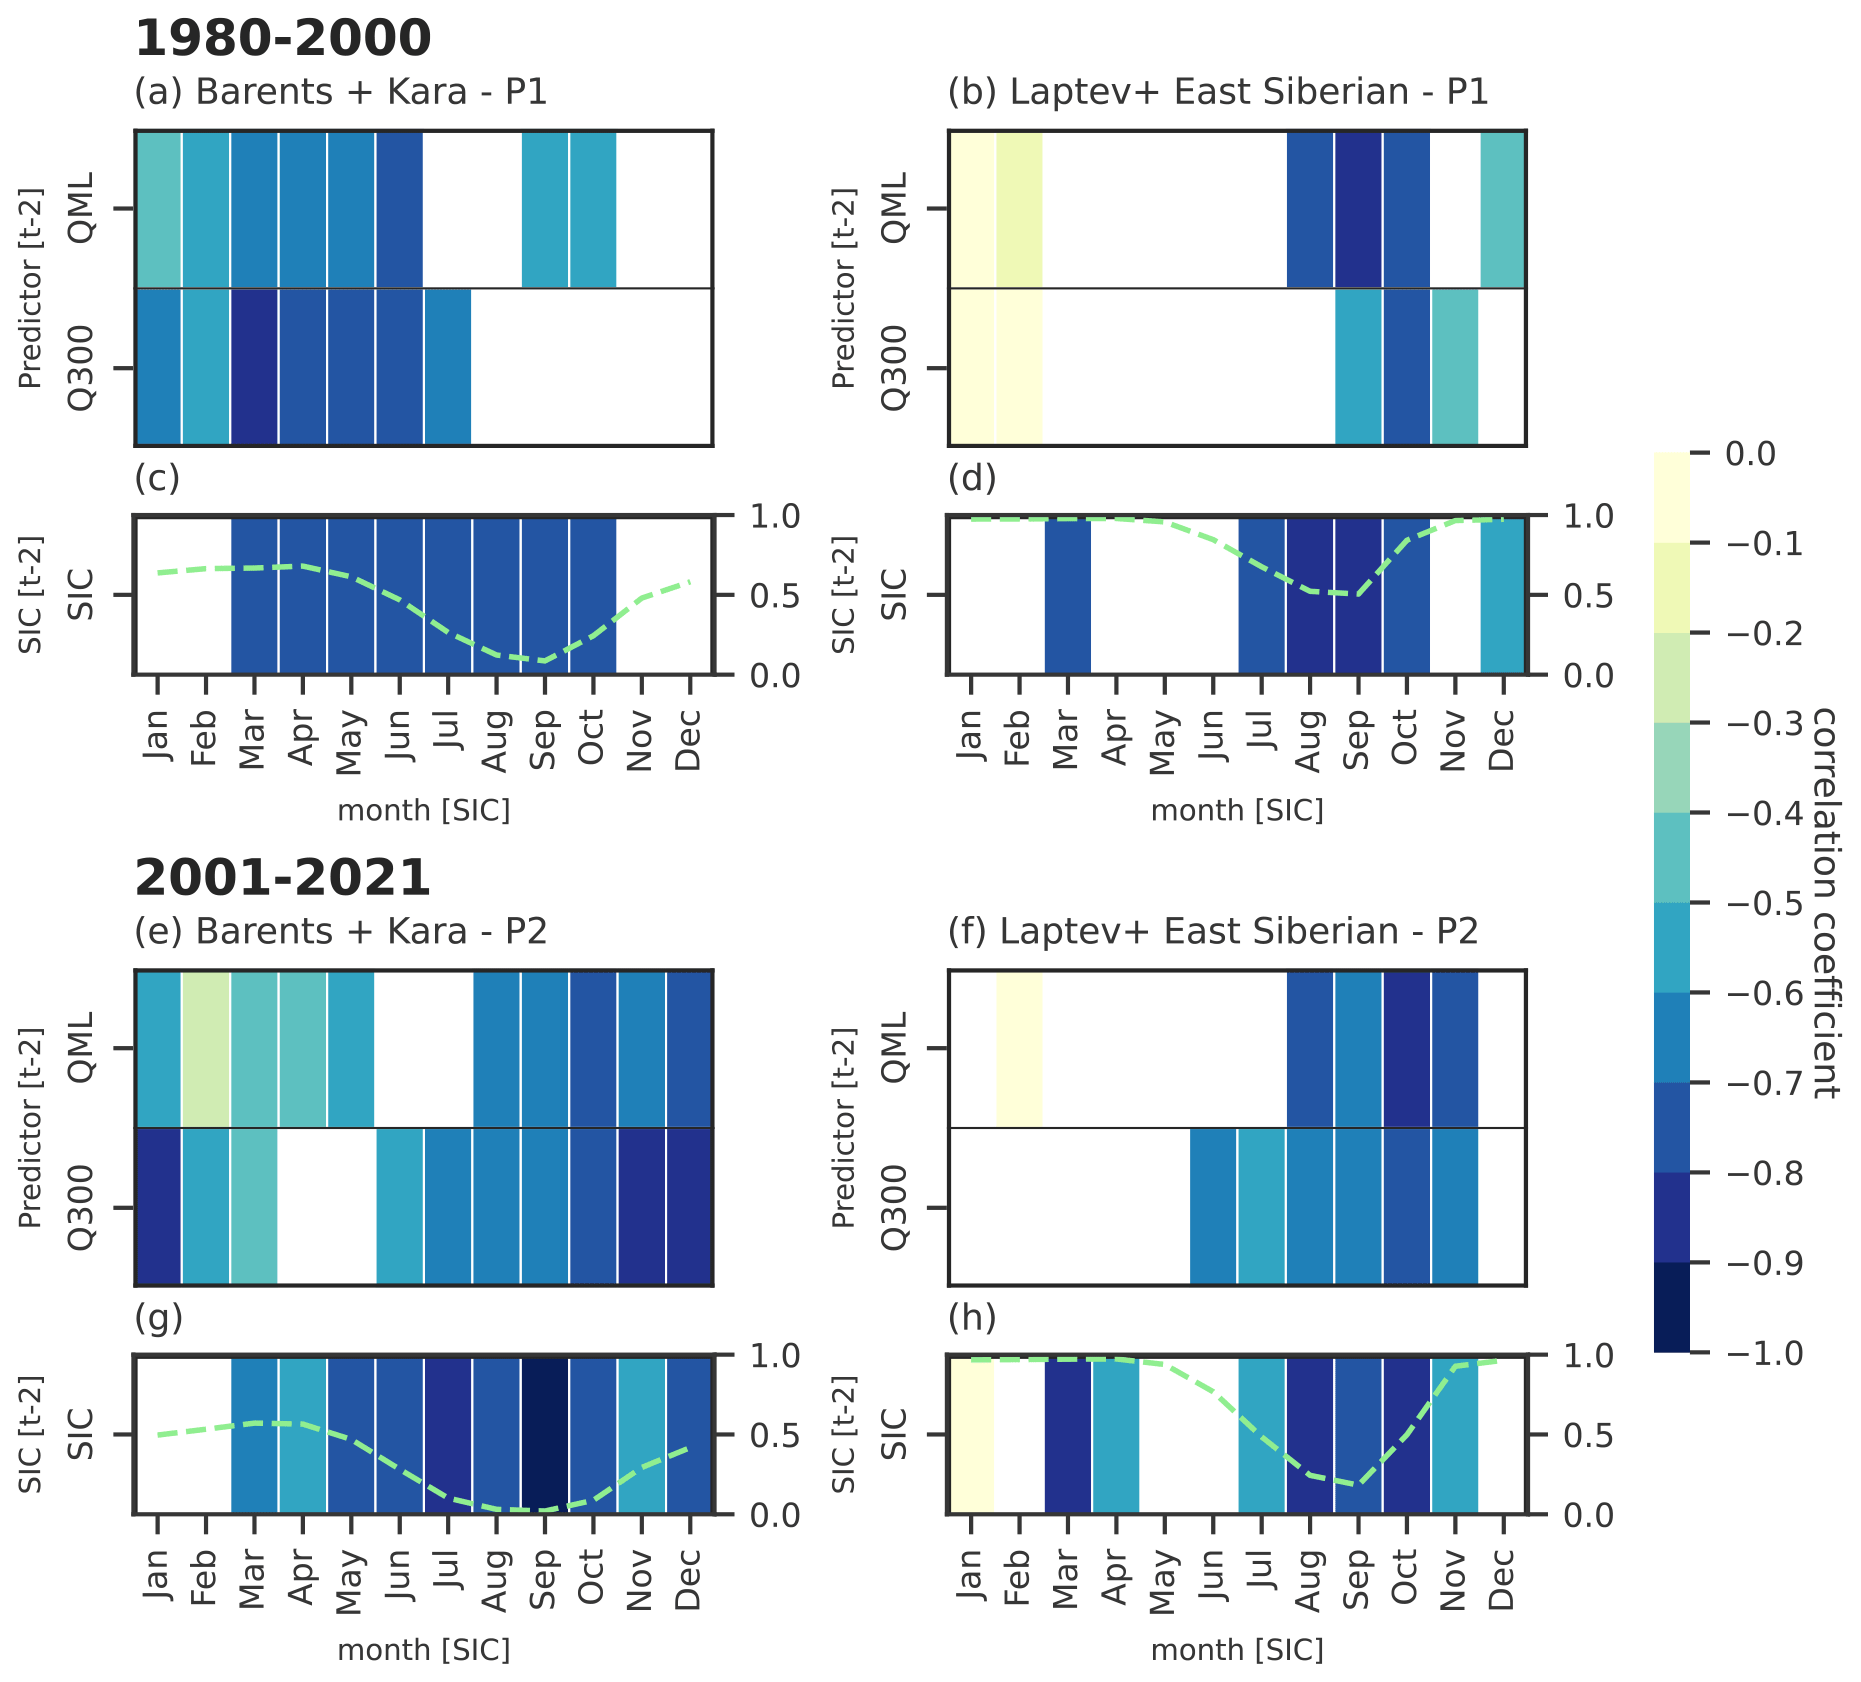
Figure A1One-month lagged correlations between SIC anomalies and ocean heat content anomalies in the 0–300 m layer and in the mixed layer, in the Barents-Kara and Laptev-East Siberian regions for the 1980–2000 (a–b) and 2001–2021 (e–f) periods, with the ocean leading sea ice for the ORAS5 reanalysis. The 1-month lag SIC anomaly auto-correlation is shown in the bottom panels for comparison (c–d, g–h). Dashed green lines indicate the SIC seasonal cycle in each region and period. Note that the sign of SIC auto-correlation is inverted. All correlations shown in color are significant at the 95 % level.
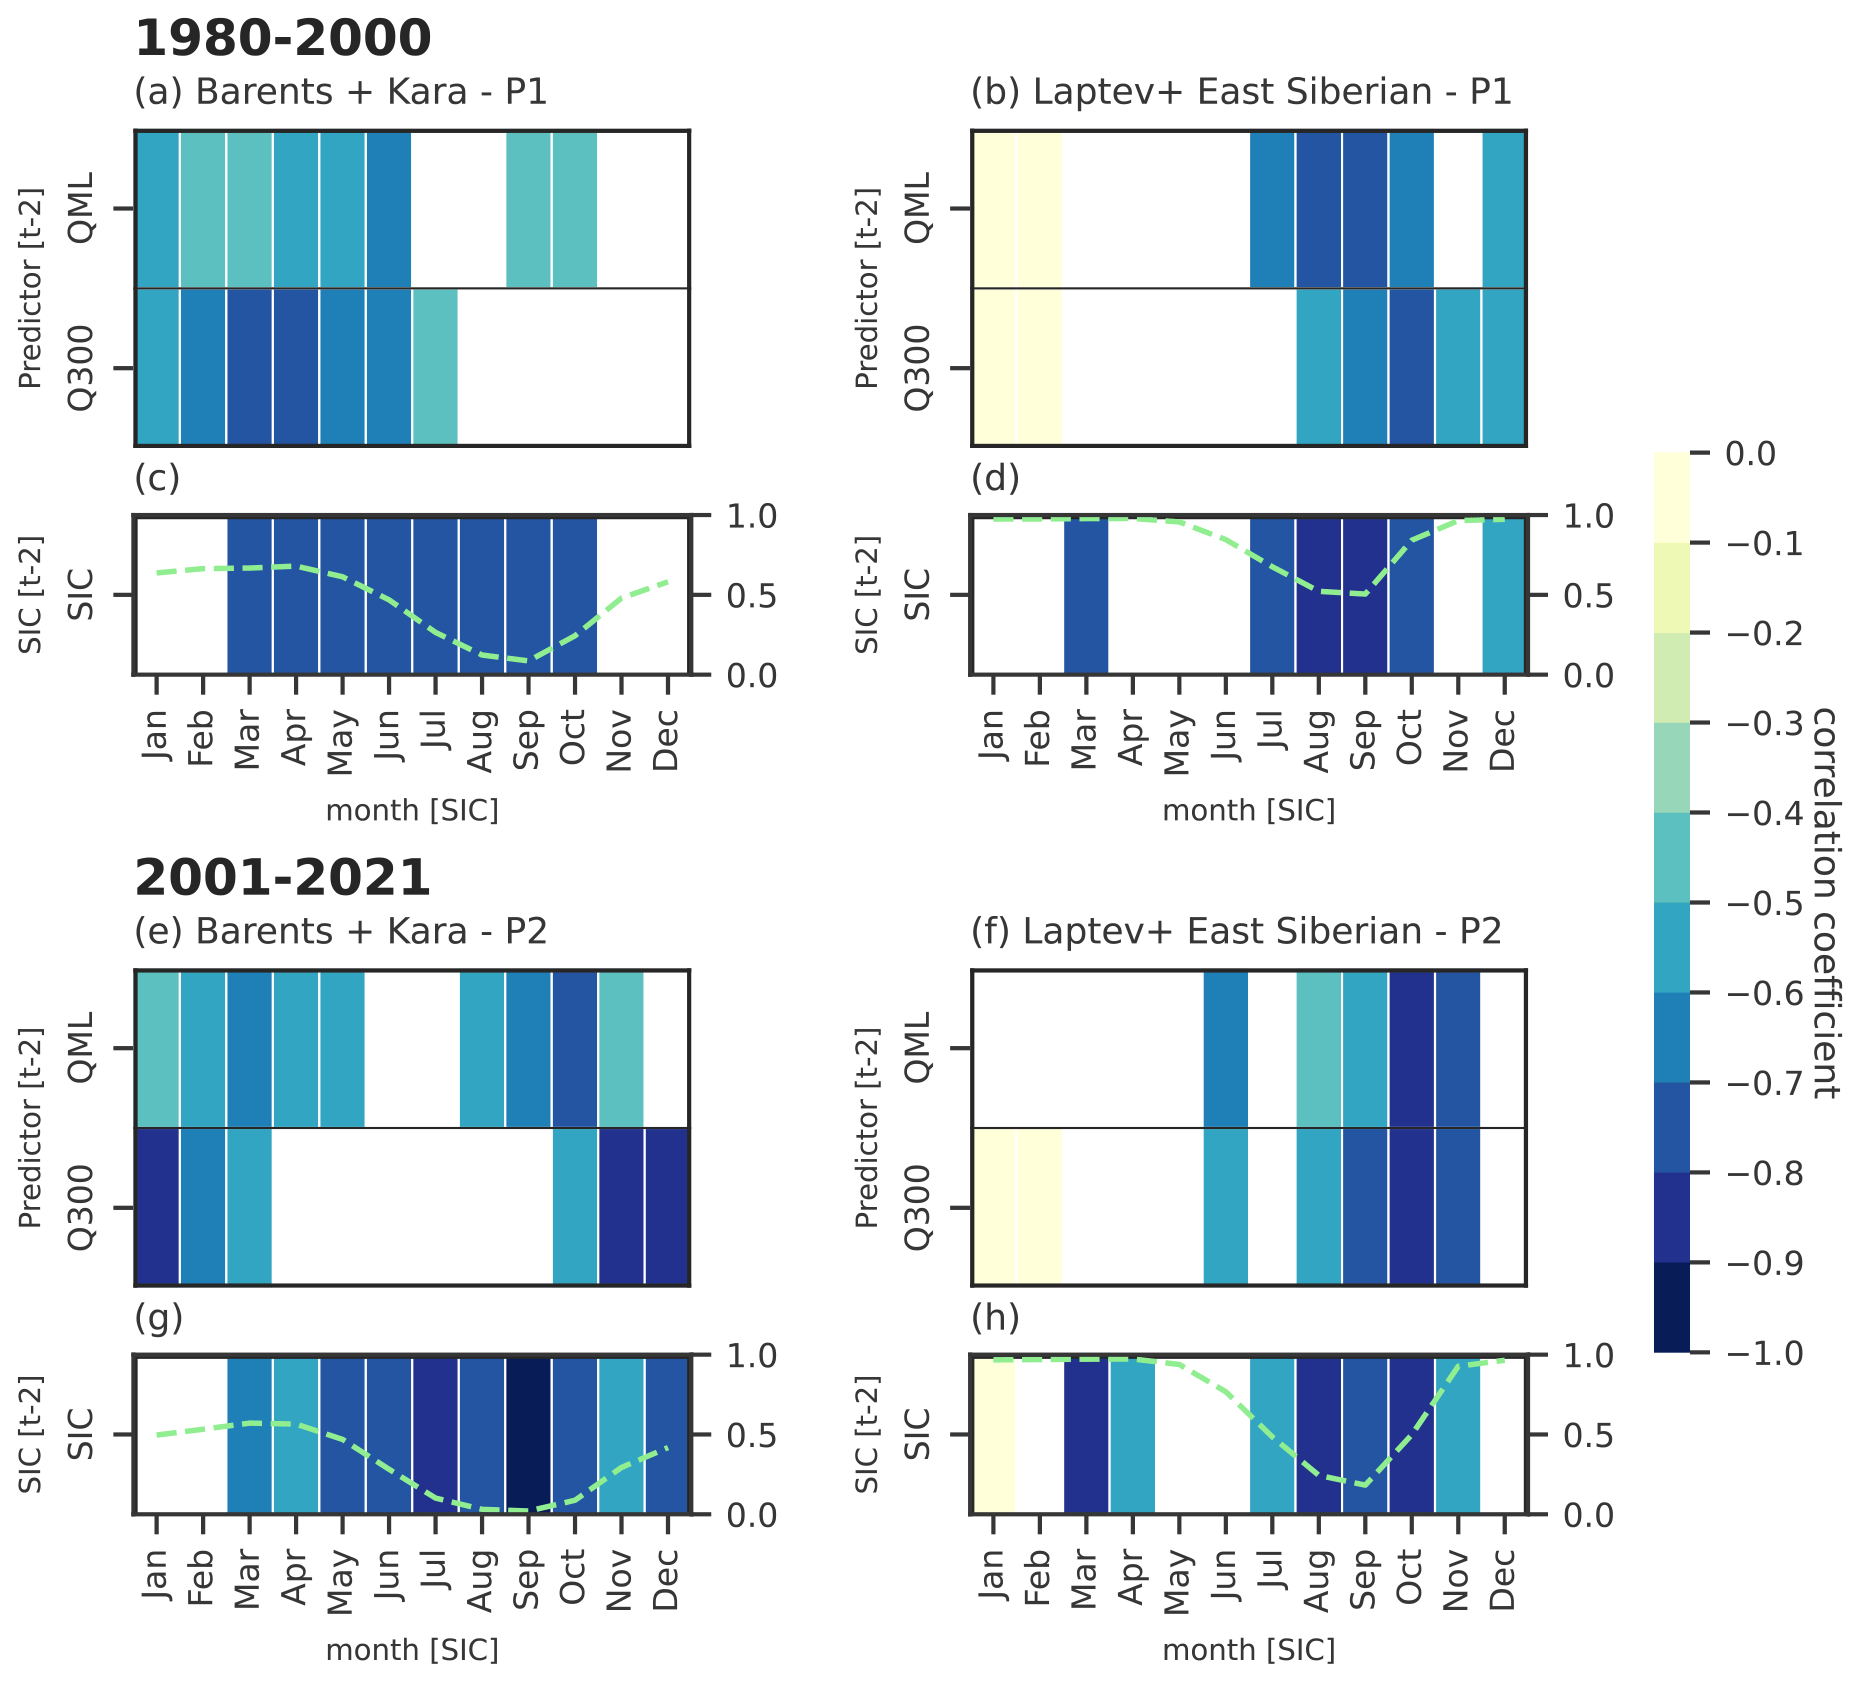
Figure A2Two-month lagged correlations between SIC anomalies and ocean heat content anomalies in the 0–300 m layer and in the mixed layer, in the Barents-Kara and Laptev-East Siberian regions for the 1980–2000 (a–b) and 2001–2021 (e–f) periods, with the ocean leading sea ice for the C-GLORSv5 reanalysis. The 2-month lag SIC anomaly auto-correlation is shown in the bottom panels for comparison (c–d, g–h). Dashed green lines indicate the SIC seasonal cycle in each region and period. Note that the sign of SIC auto-correlation is inverted. All correlations shown in color are significant at the 95 % level.
All data analyzed in this study are freely available online. ECMWF ERA5 can be downloaded from the Copernicus Climate Change Service (C3S) Data Store (https://doi.org/10.24381/cds.f17050d7, Hersbach et al., 2023). The CMCC C-GLORSv5 Reanalysis can be downloaded from the PANGAEA repository (https://doi.org/10.1594/PANGAEA.857995, Storto and Masina, 2016b). The ECMWF ORAS5 Reanalysis is available from C3S (https://doi.org/10.24381/cds.67e8eeb7, Copernicus Climate Change Service, Climate Data Store, 2021). Both C-GLORSv5 and ORAS5 reanalyses can also be found on the Copernicus Marine Environment Monitoring Service (CMEMS) website as part of the Global Ocean Ensemble Physics Reanalysis (product identifier: GLOBAL REANALYSIS PHY 001 031; https://doi.org/10.48670/moi-00024, Copernicus Marine Service, 2023).
EB processed and analyzed the data, made the figures, and wrote the manuscript. DI conceived the study and contributed to the interpretation of findings. SiM, StM, and PR equally contributed to interpreting, discussing, and improving the results of the study. All authors reviewed the manuscript.
The contact author has declared that none of the authors has any competing interests.
Publisher’s note: Copernicus Publications remains neutral with regard to jurisdictional claims made in the text, published maps, institutional affiliations, or any other geographical representation in this paper. While Copernicus Publications makes every effort to include appropriate place names, the final responsibility lies with the authors.
Elena Bianco acknowledges the Ph.D. program in Science and Management of Climate Change at Ca’ Foscari University. We gratefully acknowledge Petteri Uotila and two anonymous reviewers for their suggestions on how to improve the manuscript. We thank Morven Muilwijk for insightful discussion and Ronan McAdam and Deep S. Banerjee for technical support.
This research was supported by the Foundation Euro-Mediterranean Center on Climate Change (CMCC, Italy) and received funding from the European Union's Horizon 2020 research and innovation programme (grant agreement no. 101003826) via the project CRiceS (Climate Relevant interactions and feedbacks: the key role of sea ice and Snow in the polar and global climate system).
This paper was edited by Bin Cheng and reviewed by Petteri Uotila and two anonymous referees.
Aagaard, K.: A synthesis of the Arctic Ocean circulation, Rapp. P. V. Reun. Cons. Int. Explor. Mer, 1188, 11–22, 1989. a
Årthun, M., Eldevik, T., Smedsrud, L. H., Skagseth, and Ingvaldsen, R. B.: Quantifying the influence of atlantic heat on barents sea ice variability and retreat, J. Climate, 25, 4736–4743, https://doi.org/10.1175/JCLI-D-11-00466.1, 2012. a, b, c
Årthun, M., Eldevik, T., and Smedsrud, L. H.: The role of Atlantic heat transport in future Arctic winter sea ice loss, J. Climate, 32, 3327–3341, https://doi.org/10.1175/JCLI-D-18-0750.1, 2019. a
Asbjørnsen, H., Årthun, M., Skagseth, Ø., and Eldevik, T.: Mechanisms underlying recent arctic atlantification, Geophys. Res. Lett., 47, e2020GL088036, https://doi.org/10.1029/2020GL088036, 2020. a, b, c
Aylmer, J., Ferreira, D., and Feltham, D.: Different mechanisms of Arctic and Antarctic sea ice response to ocean heat transport, Clim. Dynam., https://doi.org/10.1007/s00382-021-06131-x, 2022. a
Balmaseda, M. A., Hernandez, F., Storto, A., Palmer, M. D., Alves, O., Shi, L., Smith, G. C., Toyoda, T., Valdivieso, M., Barnier, B., Behringer, D., Boyer, T., Chang, Y. S., Chepurin, G. A., Ferry, N., Forget, G., Fujii, Y., Good, S., Guinehut, S., Haines, K., Ishikawa, Y., Keeley, S., Köhl, A., Lee, T., Martin, M. J., Masina, S., Masuda, S., Meyssignac, B., Mogensen, K., Parent, L., Peterson, K. A., Tang, Y. M., Yin, Y., Vernieres, G., Wang, X., Waters, J., Wedd, R., Wang, O., Xue, Y., Chevallier, M., Lemieux, J. F., Dupont, F., Kuragano, T., Kamachi, M., Awaji, T., Caltabiano, A., Wilmer-Becker, K., and Gaillard, F.: The ocean reanalyses intercomparison project (ORA-IP), J. Oper. Oceanogr., 8, s80–s97, https://doi.org/10.1080/1755876X.2015.1022329, 2015. a
Beszczynska-Möller, A., Fahrbach, E., Schauer, U., and Hansen, E.: Variability in Atlantic water temperature and transport at the entrance to the Arctic Ocean, 1997–2010, ICES J. Mar. Sci., 69, 852–863, 2012. a
Bliss, A. C., Steele, M., Peng, G., Meier, W. N., and Dickinson, S.: Regional variability of Arctic sea ice seasonal change climate indicators from a passive microwave climate data record, Environ. Res. Lett., 14, 045003, https://doi.org/10.1088/1748-9326/aafb84, 2019. a, b
Carmack, E., Polyakov, I., Padman, L., Fer, I., Hunke, E., Hutchings, J., Jackson, J., Kelley, D., Kwok, R., Layton, C., Melling, H., Perovich, D., Persson, O., Ruddick, B., Timmermans, M. L., Toole, J., Ross, T., Vavrus, S., and Winsor, P.: Toward quantifying the increasing role of oceanic heat in sea ice loss in the new arctic, B. Am. Meteorol. Soc., 96, 2079–2105, https://doi.org/10.1175/BAMS-D-13-00177.1, 2015. a
Carton, J. A., Penny, S. G., and Kalnay, E.: Temperature and salinity variability in the SODA3, ECCO4r3, and ORAS5 ocean reanalyses, 1993–2015, J. Climate, 32, 2277–2293, 2019. a
Comiso, J. C., Meier, W. N., and Gersten, R.: Variability and trends in the Arctic Sea ice cover: Results from different techniques, J. Geophys. Res.-Oceans, 122, 6883–6900, https://doi.org/10.1002/2017JC012768, 2017. a
Copernicus Climate Change Service, Climate Data Store: ORAS5 global ocean reanalysis monthly data from 1958 to present, Copernicus Climate Change Service (C3S) Climate Data Store (CDS) [data set], https://doi.org/10.24381/cds.67e8eeb7, 2021. a
Copernicus Marine Service: Global Ocean Ensemble Physics Reanalysis, Copernicus Marine Service [data set], https://doi.org/10.48670/moi-00024, 2023. a
D'Angelo, G., Hunke, E. C., Pitts, T. R., Price, S. F., and Roberts, A. F.: Sea ice evolution along the Northern Sea Route and implications for trans-Arctic shipping from 2021 through 2060, Tech. Rep., Los Alamos National Lab. (LANL), Los Alamos, NM, United States, https://doi.org/10.2172/1832347, 2021. a
Davis, P. E., Lique, C., Johnson, H. L., and Guthrie, J. D.: Competing effects of elevated vertical mixing and increased freshwater input on the stratification and sea ice cover in a changing Arctic Ocean, J. Phys. Oceanogr., 46, 1531–1553, 2016. a
Dee, D. P., Uppala, S. M., Simmons, A. J., Berrisford, P., Poli, P., Kobayashi, S., Andrae, U., Balmaseda, M. A., Balsamo, G., Bauer, P., Bechtold, P., Beljaars, A. C., van de Berg, L., Bidlot, J., Bormann, N., Delsol, C., Dragani, R., Fuentes, M., Geer, A. J., Haimberger, L., Healy, S. B., Hersbach, H., Hólm, E. V., Isaksen, L., Kållberg, P., Köhler, M., Matricardi, M., Mcnally, A. P., Monge-Sanz, B. M., Morcrette, J. J., Park, B. K., Peubey, C., de Rosnay, P., Tavolato, C., Thépaut, J. N., and Vitart, F.: The ERA-Interim reanalysis: Configuration and performance of the data assimilation system, Q. J. Roy. Meteor. Soc., 137, 553–597, https://doi.org/10.1002/qj.828, 2011. a
Ding, Q., Schweiger, A., L'Heureux, M., Steig, E. J., Battisti, D. S., Johnson, N. C., Blanchard-Wrigglesworth, E., Po-Chedley, S., Zhang, Q., Harnos, K., Bushuk, M., Markle, B., and Baxter, I.: Fingerprints of internal drivers of Arctic sea ice loss in observations and model simulations, Nat. Geosci., 12, 28–33, https://doi.org/10.1038/s41561-018-0256-8, 2019. a
Dörr, J., Årthun, M., Eldevik, T., and Madonna, E.: Mechanisms of regional winter sea-ice variability in a warming arctic, J. Climate, 34, 8635–8653, https://doi.org/10.1175/JCLI-D-21-0149.1, 2021. a
Duarte, P., Sundfjord, A., Meyer, A., Hudson, S. R., Spreen, G., and Smedsrud, L. H.: Warm Atlantic Water Explains Observed Sea Ice Melt Rates North of Svalbard, J. Geophys. Res.-Oceans, 125, e2019JC015662, https://doi.org/10.1029/2019JC015662, 2020. a
England, M., Jahn, A., and Polvani, L.: Nonuniform contribution of internal variability to recent Arctic sea ice loss, J. Climate, 32, 4039–4053, 2019. a
Fichefet, T. and Maqueda, M. A.: Sensitivity of a global sea ice model to the treatment of ice thermodynamics and dynamics, J. Geophys. Res.-Oceans, 102, 12609–12646, https://doi.org/10.1029/97JC00480, 1997. a
Gimbert, F., Jourdain, N. C., Marsan, D., Weiss, J., and Barnier, B.: Recent mechanical weakening of the Arctic sea ice cover as revealed from larger inertial oscillations, J. Geophys. Res.-Oceans, 117, C00J12, https://doi.org/10.1029/2011JC007633, 2012. a
Graham, R. M., Itkin, P., Meyer, A., Sundfjord, A., Spreen, G., Smedsrud, L. H., Liston, G. E., Cheng, B., Cohen, L., Divine, D., Fer, I., Fransson, A., Gerland, S., Haapala, J., Hudson, S. R., Johansson, A. M., King, J., Merkouriadi, I., Peterson, A. K., Provost, C., Randelhoff, A., Rinke, A., Rösel, A., Sennéchael, N., Walden, V. P., Duarte, P., Assmy, P., Steen, H., and Granskog, M. A.: Winter storms accelerate the demise of sea ice in the Atlantic sector of the Arctic Ocean, Scientific Reports, 9, 9222, https://doi.org/10.1038/s41598-019-45574-5, 2019. a
Hersbach, H., Bell, B., Berrisford, P., Hirahara, S., Horányi, A., Muñoz-Sabater, J., Nicolas, J., Peubey, C., Radu, R., Schepers, D., Simmons, A., Soci, C., Abdalla, S., Abellan, X., Balsamo, G., Bechtold, P., Biavati, G., Bidlot, J., Bonavita, M., De Chiara, G., Dahlgren, P., Dee, D., Diamantakis, M., Dragani, R., Flemming, J., Forbes, R., Fuentes, M., Geer, A., Haimberger, L., Healy, S., Hogan, R. J., Hólm, E., Janisková, M., Keeley, S., Laloyaux, P., Lopez, P., Lupu, C., Radnoti, G., de Rosnay, P., Rozum, I., Vamborg, F., Villaume, S., and Thépaut, J. N.: The ERA5 global reanalysis, Q. J. Roy. Meteor. Soc., 146, 1999–2049, https://doi.org/10.1002/qj.3803, 2020. a
Hersbach, H., Bell, B., Berrisford, P., Biavati, G., Horányi, A., Muñoz Sabater, J., Nicolas, J., Peubey, C., Radu, R., Rozum, I., Schepers, D., Simmons, A., Soci, C., Dee, D., and Thépaut, J.-N.: ERA5 monthly averaged data on single levels from 1940 to present, Copernicus Climate Change Service (C3S) Climate Data Store (CDS) [data set], https://doi.org/10.24381/cds.f17050d7, 2023. a
Heuzé, C., Zanowski, H., Karam, S., and Muilwijk, M.: The deep Arctic Ocean and Fram Strait in CMIP6 models, J. Climate, 36, 2551–2584, 2023. a
Holland, M. M., Bitz, C. M., and Tremblay, B.: Future abrupt reductions in the summer Arctic sea ice, Geophys. Res. Lett., 33, 23, https://doi.org/10.1029/2006GL028024, 2006. a
Ilıcak, M., Drange, H., Wang, Q., Gerdes, R., Aksenov, Y., Bailey, D., Bentsen, M., Biastoch, A., Bozec, A., Böning, C., Cassou, C., Chassignet E., Coward, A. C., Curry, B., Danabasoglu, G., Danilov, S., Fernandez, E., Fogli, P. G., Fujii, Y., Griffies, S. M., Iovino, D., Jahn, A., Jung, T., Large, W. G., Lee, C., Lique, C., Lu, J., Masina, S., Nurser, A. J. G., Roth, C., Salas y Mèlia, D., Samuels, B. L., Spence, P., Tsujino, H., Voldoire, A., Wang, X., and Yeager, S. G.: An assessment of the Arctic Ocean in a suite of interannual CORE-II simulations. Part III: Hydrography and fluxes, Ocean Model., 100, 141–161, 2016. a, b, c
Iovino, D., Selivanova, J., Masina, S., and Cipollone, A.: The Antarctic Marginal Ice Zone and Pack Ice Area in CMEMS GREP Ensemble Reanalysis Product, Front. Earth Sci., 10, 95, https://doi.org/10.3389/feart.2022.745274 2022. a
Ivanov, V., Alexeev, V., Koldunov, N. V., Repina, I., Sandø, A. B., Smedsrud, L. H., and Smirnov, A.: Arctic Ocean heat impact on regional ice decay: A suggested positive feedback, J. Phys. Oceanogr., 46, 1437–1456, 2016. a
Ivanov, V. V., Alexeev, V. A., Repina, I., Koldunov, N. V., and Smirnov, A.: Tracing atlantic water signature in the arctic sea ice cover east of svalbard, Adv. Meteorol., 2012, 201818, https://doi.org/10.1155/2012/201818, 2012. a
Johnson, S. J., Stockdale, T. N., Ferranti, L., Balmaseda, M. A., Molteni, F., Magnusson, L., Tietsche, S., Decremer, D., Weisheimer, A., Balsamo, G., Keeley, S. P. E., Mogensen, K., Zuo, H., and Monge-Sanz, B. M.: SEAS5: the new ECMWF seasonal forecast system, Geosci. Model Dev., 12, 1087–1117, https://doi.org/10.5194/gmd-12-1087-2019, 2019. a
Karami, M. P., Myers, P. G., de Vernal, A., Tremblay, L. B., and Hu, X.: The role of Arctic gateways on sea ice and circulation in the Arctic and North Atlantic Oceans: a sensitivity study with an ocean-sea-ice model, Clim. Dynam., 57, 2129–2151, 2021. a
Koenigk, T. and Brodeau, L.: Ocean heat transport into the Arctic in the twentieth and twenty-first century in EC-Earth, Clim. Dynam., 42, 3101–3120, 2014. a
Korhonen, M., Rudels, B., Marnela, M., Wisotzki, A., and Zhao, J.: Time and space variability of freshwater content, heat content and seasonal ice melt in the Arctic Ocean from 1991 to 2011, Ocean Sci., 9, 1015–1055, https://doi.org/10.5194/os-9-1015-2013, 2013. a
Lebrun, M., Vancoppenolle, M., Madec, G., and Massonnet, F.: Arctic sea-ice-free season projected to extend into autumn, The Cryosphere, 13, 79–96, https://doi.org/10.5194/tc-13-79-2019, 2019. a
Lenetsky, J. E., Tremblay, B., Brunette, C., and Meneghello, G.: Subseasonal predictability of Arctic Ocean sea ice conditions: Bering Strait and Ekman-driven ocean heat transport, J. Climate, 34, 4449–4462, 2021. a
Li, D., Zhang, R., and Knutson, T. R.: On the discrepancy between observed and CMIP5 multi-model simulated Barents Sea winter sea ice decline, Nat. Commun., 8, 14991, https://doi.org/10.1038/ncomms14991, 2017. a
Li, Z., Ding, Q., Steele, M., and Schweiger, A.: Recent upper Arctic Ocean warming expedited by summertime atmospheric processes, Nat. Commun., 13, 362, https://doi.org/10.1038/s41467-022-28047-8, 2022. a
Liang, X. and Losch, M.: On the effects of increased vertical mixing on the Arctic Ocean and sea ice, J. Geophys. Res.-Oceans, 123, 9266–9282, 2018. a
Lien, V. S., Hjøllo, S. S., Skogen, M. D., Svendsen, E., Wehde, H., Bertino, L., Counillon, F., Chevallier, M., and Garric, G.: An assessment of the added value from data assimilation on modelled Nordic Seas hydrography and ocean transports, Ocean Model., 99, 43–59, 2016. a
Lien, V. S., Schlichtholz, P., Skagseth, Ø., and Vikebø, F. B.: Wind-Driven Atlantic Water Flow as a Direct Mode for Reduced Barents Sea Ice Cover, J. Climate, 30, 803–812, https://doi.org/10.1175/jcli-d-16-0025.1, 2017. a
Lind, S., Ingvaldsen, R. B., and Furevik, T.: Arctic warming hotspot in the northern Barents Sea linked to declining sea-ice import, Nat. Clim. Change, 8, 634–639, https://doi.org/10.1038/s41558-018-0205-y, 2018. a
Lique, C. and Steele, M.: Seasonal to decadal variability of Arctic Ocean heat content: A model-based analysis and implications for autonomous observing systems, J. Geophys. Res.-Oceans, 118, 1673–1695, 2013. a, b, c
Long, Z. and Perrie, W.: Changes in ocean temperature in the Barents Sea in the twenty-first century, J. Climate, 30, 5901–5921, 2017. a
MacKinnon, J. A., Simmons, H. L., Hargrove, J., Thomson, J., Peacock, T., Alford, M. H., Barton, B. I., Boury, S., Brenner, S. D., Couto, N., Danielson, S. L., Fine, E. C., Graber, H. C., Guthrie, J., Hopkins, J. E., Jayne, S. R., Jeon, C., Klenz, T., Lee, C. M., Lenn, Y., Lucas, A. J., Lund, B., Mahaffey, C., Norman, L., Rainville, L., Smith, M. M., Thomas, L. N., Torres-Valdès, S., and Wood, K. R.: A warm jet in a cold ocean, Nat. Commun., 12, 2418, https://doi.org/10.1038/s41467-021-22505-5, 2021. a
Madec, G., Bourdallé-Badie, R., Bouttier, P.-A., Bricaud, C., Bruciaferri, D., Calvert, D., Chanut, J., Clementi, E., Coward, A., Delrosso, D., Christian, E., Flavoni, S., Graham, T., Harle, J., Iovino, D., Lea, D., Lèvy, C., Lovato, T., Martin, N., Masson, S., Mocavero, S., Paul, J., Rousset, C., Storkey, D., Storto, A., and Vancoppenolle, M.: NEMO oean engine, Note du Pole de modèlisation de l'Institut Pierre-Simon Laplace No. 27, ISSN 1288-1619, 2017. a
Maslowski, W., Marble, D., Walczowski, W., Schauer, U., Clement, J. L., and Semtner, A. J.: On climatological mass, heat, and salt transports through the Barents Sea and Fram Strait from a pan-Arctic coupled ice-ocean model simulation, J. Geophys. Res.-Oceans, 109, C3, https://doi.org/10.1029/2001JC001039, 2004. a
Mayer, M., Tietsche, S., Haimberger, L., Tsubouchi, T., Mayer, J., and Zuo, H.: An improved estimate of the coupled Arctic energy budget, J. Climate, 32, 7915–7934, 2019. a, b, c, d
McAdam, R., Masina, S., Balmaseda, M., Gualdi, S., Senan, R., and Mayer, M.: Seasonal forecast skill of upper-ocean heat content in coupled high-resolution systems, Clim. Dynam., 58, 3335–3350, 2022. a
Mikhailova, N., Bayankina, T., and Sizov, A.: Two modes of atmosphere–ocean interaction in the Atlantic sector of the Arctic Basin, Oceanology, 61, 443–449, 2021. a
Mohamed, B., Nilsen, F., and Skogseth, R.: Marine heatwaves characteristics in the barents sea based on high resolution satellite data (1982–2020), Frontiers in Marine Science, 9, 821646, https://doi.org/10.3389/fmars.2022.821646, 2022. a
Muilwijk, M., Smedsrud, L. H., Ilicak, M., and Drange, H.: Atlantic Water heat transport variability in the 20th century Arctic Ocean from a global ocean model and observations, J. Geophys. Res.-Oceans, 123, 8159–8179, 2018. a, b, c, d
Muilwijk, M., Smedsrud, L. H., Polyakov, I. V., Nummelin, A., Heuzé, C., and Zanowski, H.: Divergence in CMIP6 projections of future Arctic Ocean stratification, Tech. Rep., Copernicus Meetings, https://doi.org/10.1175/JCLI-D-22-0349.1, 2022. a, b
Nie, Y., Uotila, P., Cheng, B., Massonnet, F., Kimura, N., Cipollone, A., and Lv, X.: Southern Ocean sea ice concentration budgets of five ocean-sea ice reanalyses, Clim. Dynam., 59, 3265–3285, 2022. a
Nummelin, A., Li, C., and Hezel, P. J.: Connecting ocean heat transport changes from the midlatitudes to the Arctic Ocean, Geophys. Res. Lett., 44, 1899–1908, https://doi.org/10.1002/2016GL071333, 2017. a
Olonscheck, D., Mauritsen, T., and Notz, D.: Arctic sea-ice variability is primarily driven by atmospheric temperature fluctuations, Nat. Geosci., 12, 430–434, https://doi.org/10.1038/s41561-019-0363-1, 2019. a
Onarheim, I. H., Smedsrud, L. H., Ingvaldsen, R. B., and Nilsen, F.: Loss of sea ice during winter north of Svalbard, Tellus A, 66, 23933, https://doi.org/10.3402/tellusa.v66.23933, 2014. a, b
Onarheim, I. H., Eldevik, T., Årthun, M., Ingvaldsen, R. B., and Smedsrud, L. H.: Skillful prediction of Barents Sea ice cover, Geophys. Res. Lett., 42, 5364–5371, https://doi.org/10.1002/2015GL064359, 2015. a, b
Onarheim, I. H., Eldevik, T., Smedsrud, L. H., and Stroeve, J. C.: Seasonal and regional manifestation of Arctic sea ice loss, J. Climate, 31, 4917–4932, https://doi.org/10.1175/JCLI-D-17-0427.1, 2018. a, b, c
Pan, R., Shu, Q., Wang, Q., Wang, S., Song, Z., He, Y., and Qiao, F.: Future Arctic Climate Change in CMIP6 Strikingly Intensified by NEMO-Family Climate Models, Geophys. Res. Lett., 50, e2022GL102077, https://doi.org/10.1029/2022GL102077, 2023. a
Peng, G. and Meier, W. N.: Temporal and regional variability of Arctic sea-ice coverage from satellite data, Ann. Glaciol., 59, 191–200, 2018. a
Peralta-Ferriz, C. and Woodgate, R. A.: Seasonal and interannual variability of pan-Arctic surface mixed layer properties from 1979 to 2012 from hydrographic data, and the dominance of stratification for multiyear mixed layer depth shoaling, Prog. Oceanogr., 134, 19–53, 2015. a
Perovich, D. K.: The changing Arctic sea ice cover, Oceanography, 24, 162–173, 2011. a
Perovich, D. K. and Polashenski, C.: Albedo evolution of seasonal Arctic sea ice, Geophys. Res. Lett., 39, 8, https://doi.org/10.1029/2012GL051432, 2012. a, b
Perovich, D. K., Light, B., Eicken, H., Jones, K. F., Runciman, K., and Nghiem, S. V.: Increasing solar heating of the Arctic Ocean and adjacent seas, 1979–2005: Attribution and role in the ice-albedo feedback, Geophys. Res. Lett., 34, L19505, https://doi.org/10.1029/2007GL031480, 2007. a, b
Polyakov, I., Alekseev, G., Timokhov, L., Bhatt, U., Colony, R., Simmons, H., Walsh, D., Walsh, J., and Zakharov, V.: Variability of the intermediate Atlantic water of the Arctic Ocean over the last 100 years, J. Climate, 17, 4485–4497, 2004. a
Polyakov, I., Bhatt, U., Simmons, H., Walsh, D., Walsh, J., and Zhang, X.: Multidecadal variability of North Atlantic temperature and salinity during the twentieth century, J. Climate, 18, 4562–4581, 2005. a
Polyakov, I. V., Timokhov, L. A., Alexeev, V. A., Bacon, S., Dmitrenko, I. A., Fortier, L., Frolov, I. E., Gascard, J. C., Hansen, E., Ivanov, V. V., Laxon, S., Mauritzen, C., Perovich, D., Shimada, K., Simmons, H. L., Sokolov, V. T., Steele, M., and Toole, J.: Arctic ocean warming contributes to reduced polar ice cap, J. Phys. Oceanogr., 40, 2743–2756, https://doi.org/10.1175/2010JPO4339.1, 2010. a
Polyakov, I. V., Pnyushkov, A. V., Alkire, M. B., Ashik, I. M., Baumann, T. M., Carmack, E. C., Goszczko, I., Guthrie, J., Ivanov, V. V., Kanzow, T., Krishfield, R., Kwok, R., Sundfjord, A., Morison, J., Rember, R., and Yulin, A.: Greater role for Atlantic inflows on sea-ice loss in the Eurasian Basin of the Arctic Ocean, Science, 356, 285–291, 2017. a
Polyakov, I. V., Alkire, M. B., Bluhm, B. A., Brown, K. A., Carmack, E. C., Chierici, M., Danielson, S. L., Ellingsen, I., Ershova, E. A., Gårdfeldt, K., Ingvaldsen, R. B., Pnyushkov, A. V., Slagstad, D., and Wassmann, P.: Borealization of the Arctic Ocean in response to anomalous advection from sub-Arctic seas, Frontiers in Marine Science, 7, 491, https://doi.org/10.3389/fmars.2020.00491, 2020a. a
Polyakov, I. V., Rippeth, T. P., Fer, I., Alkire, M. B., Baumann, T. M., Carmack, E. C., Ingvaldsen, R., Ivanov, V. V., Janout, M., Lind, S., Padman, L., Pnyushkov, A. V., and Rember, R.: Weakening of cold halocline layer exposes sea ice to oceanic heat in the eastern arctic ocean, J. Climate, 33, 8107–8123, https://doi.org/10.1175/JCLI-D-19-0976.1, 2020b. a
Reynolds, R. W., Smith, T. M., Liu, C., Chelton, D. B., Casey, K. S., and Schlax, M. G.: Daily high-resolution-blended analyses for sea surface temperature, J. Climate, 20, 5473–5496, 2007. a
Ricker, R., Kauker, F., Schweiger, A., Hendricks, S., Zhang, J., and Paul, S.: Evidence for an increasing role of ocean heat in arctic winter sea ice growth, J. Climate, 34, 5215–5227, https://doi.org/10.1175/JCLI-D-20-0848.1, 2021. a
Rudels, B.: Arctic Ocean circulation, processes and water masses: A description of observations and ideas with focus on the period prior to the International Polar Year 2007–2009, Prog. Oceanogr., 132, 22–67, 2015. a
Sandø, A. B., Nilsen, J. Ø., Gao, Y., and Lohmann, K.: Importance of heat transport and local air-sea heat fluxes for Barents Sea climate variability, J. Geophys. Res.-Oceans, 115, C7, https://doi.org/10.1029/2009JC005884, 2010. a
Schauer, U. and Beszczynska-Möller, A.: Problems with estimation and interpretation of oceanic heat transport – conceptual remarks for the case of Fram Strait in the Arctic Ocean, Ocean Sci., 5, 487–494, https://doi.org/10.5194/os-5-487-2009, 2009. a, b
Serreze, M. C. and Meier, W. N.: The Arctic's sea ice cover: trends, variability, predictability, and comparisons to the Antarctic, Ann. NY Acad. Sci., 1436, 36–53, 2019. a
Serreze, M. C., Crawford, A. D., Stroeve, J. C., Barrett, A. P., and Woodgate, R. A.: Variability, trends, and predictability of seasonal sea ice retreat and advance in the Chukchi Sea, J. Geophys. Res.-Oceans, 121, 7308–7325, https://doi.org/10.1002/2016JC011977, 2016. a
Shu, Q., Wang, Q., Song, Z., and Qiao, F.: The poleward enhanced Arctic Ocean cooling machine in a warming climate, Nat. Commun., 12, 2966, https://doi.org/10.1038/s41467-021-23321-7, 2021. a, b, c, d
Shu, Q., Wang, Q., Årthun, M., Wang, S., Song, Z., Zhang, M., and Qiao, F.: Arctic Ocean Amplification in a warming climate in CMIP6 models, Science Advances, 8, eabn9755, https://doi.org/10.1126/sciadv.abn9755, 2022. a, b, c
Simmonds, I.: Comparing and contrasting the behaviour of Arctic and Antarctic sea ice over the 35 year period 1979–2013, Ann. Glaciol., 56, 18–28, https://doi.org/10.3189/2015AoG69A909, 2015. a
Skagseth, Ø., Eldevik, T., Årthun, M., Asbjørnsen, H., Lien, V. S., and Smedsrud, L. H.: Reduced efficiency of the Barents Sea cooling machine, Nat. Clim. Change, 10, 661–666, 2020. a, b, c
Smedsrud, L. H., Ingvaldsen, R., Nilsen, J. E. Ø., and Skagseth, Ø.: Heat in the Barents Sea: transport, storage, and surface fluxes, Ocean Sci., 6, 219–234, https://doi.org/10.5194/os-6-219-2010, 2010. a
Smedsrud, L. H., Esau, I., Ingvaldsen, R. B., Eldevik, T., Haugan, P. M., Li, C., Lien, V. S., Olsen, A., Omar, A. M., Risebrobakken, B., Sandø, A. B., Semenov, V. A., and Sorokina, S. A.: The role of the Barents Sea in the Arctic climate system, Rev. Geophys., 51, 415–449, https://doi.org/10.1002/rog.20017, 2013. a, b
Smedsrud, L. H., Muilwijk, M., Brakstad, A., Madonna, E., Lauvset, S. K., Spensberger, C., Born, A., Eldevik, T., Drange, H., Jeansson, E., Li, C., Olsen, A., Skagseth, Ø., Slater, D. A., Straneo, F., Våge, K., and Årthun, M.: Nordic Seas heat loss, Atlantic inflow, and Arctic sea ice cover over the last century, Rev. Geophys., 60, e2020RG000725, https://doi.org/10.1029/2020RG000725, 2022. a, b, c
Stammerjohn, S., Massom, R., Rind, D., and Martinson, D.: Regions of rapid sea ice change: An inter-hemispheric seasonal comparison, Geophys. Res. Lett., 39, L06501, https://doi.org/10.1029/2012GL050874, 2012. a
Steele, M., Ermold, W., and Zhang, J.: Arctic Ocean surface warming trends over the past 100 years, Geophys. Res. Lett., 35, L02614, https://doi.org/10.1029/2007GL031651, 2008. a
Storto, A. and Masina, S.: C-GLORSv5: an improved multipurpose global ocean eddy-permitting physical reanalysis, Earth Syst. Sci. Data, 8, 679–696, https://doi.org/10.5194/essd-8-679-2016, 2016a. a, b
Storto, A. and Masina, S.: The CMCC Eddy-permitting Global Ocean Physical Reanalysis (C-GLORS v5, 1980–2014), links to NetCDF files, Centro Euro-Mediterraneo sui Cambiamenti Climatici, Bologna, Italy, PANGAEA [data set], https://doi.org/10.1594/PANGAEA.857995, 2016b. a
Storto, A., Alvera-Azcárate, A., Balmaseda, M. A., Barth, A., Chevallier, M., Counillon, F., Domingues, C. M., Drevillon, M., Drillet, Y., Forget, G., Garric, G., Haines, K., Hernandez, F., Iovino, D., Jackson, L. C., Lellouche, J., Masina, S., Mayer, M., Oke, P. R., Penny, S. G., Peterson, K. A., Yang, C., and Zuo, H.: Ocean reanalyses: recent advances and unsolved challenges, Frontiers in Marine Science, 6, 418, https://doi.org/10.3389/fmars.2019.00418, 2019. a
Stroeve, J. and Notz, D.: Changing state of Arctic sea ice across all seasons, Environ. Res. Lett., 13, 103001, https://doi.org/10.1088/1748-9326/aade56, 2018. a
Stroeve, J. C., Crawford, A. D., and Stammerjohn, S.: Using timing of ice retreat to predict timing of fall freeze-up in the Arctic, Geophys. Res. Lett., 43, 6332–6340, https://doi.org/10.1002/2016GL069314, 2016. a
Sumata, H., de Steur, L., Divine, D. V., Granskog, M. A., and Gerland, S.: Regime shift in Arctic Ocean sea ice thickness, Nature, 615, 443–449, 2023. a, b
Takahashi, N., Richards, K. J., Schneider, N., Annamalai, H., Hsu, W. C., and Nonaka, M.: Formation Mechanism of Warm SST Anomalies in 2010s Around Hawaii, J. Geophys. Res.-Oceans, 126, e2021JC017763, https://doi.org/10.1029/2021JC017763, 2021. a
Thépaut, J.-N., Dee, D., Engelen, R., and Pinty, B.: The Copernicus programme and its climate change service, in: IGARSS 2018–2018 IEEE International Geoscience and Remote Sensing Symposium, 1591–1593, Valencia, Spain, 22–27 July 2018, IEEE, https://doi.org/10.1109/IGARSS.2018.8518067, 2018. a
Thomson, R. E. and Fine, I. V.: Estimating Mixed Layer Depth from Oceanic Profile Data, Tech. Rep., https://doi.org/10.1175/1520-0426(2003)020<0319:EMLDFO>2.0.CO;2, 2003. a
Timmermans, M. L., Cole, S., and Toole, J.: Horizontal density structure and restratification of the Arctic Ocean surface layer, J. Phys. Oceanogr., 42, 659–668, https://doi.org/10.1175/JPO-D-11-0125.1, 2012. a
Toole, J. M., Timmermans, M. L., Perovich, D. K., Krishfield, R. A., Proshutinsky, A., and Richter-Menge, J. A.: Influences of the ocean surface mixed layer and thermohaline stratification on Arctic Sea ice in the central Canada Basin, J. Geophys. Res.-Oceans, 115, C10018, https://doi.org/10.1029/2009JC005660, 2010. a, b
Tsubouchi, T., Bacon, S., Naveira Garabato, A., Aksenov, Y., Laxon, S. W., Fahrbach, E., Beszczynska-Möller, A., Hansen, E., Lee, C. M., and Ingvaldsen, R.: The Arctic Ocean in summer: A quasi-synoptic inverse estimate of boundary fluxes and water mass transformation, J. Geophys. Res.-Oceans, 117, C1, https://doi.org/10.1029/2011JC007174, 2012. a, b
Tsubouchi, T., Bacon, S., Aksenov, Y., Naveira Garabato, A. C., Beszczynska-Möller, A., Hansen, E., de Steur, L., Curry, B., and Lee, C. M.: The Arctic Ocean seasonal cycles of heat and freshwater fluxes: Observation-based inverse estimates, J. Phys. Oceanogr., 48, 2029–2055, 2018. a
Tsubouchi, T., von Appen, W., Schauer, U., Kanzow, T., Lee, C., Curry, B., de Steur, L., Ingvaldsen, R., and Woodgate, R.: The Arctic Ocean volume, heat and fresh water transports time series from October 2004 to May 2010, PANGAEA [data set], https://doi.org/10.1594/PANGAEA, 909966, 2019. a, b
Tsubouchi, T., Våge, K., Hansen, B., Larsen, K. M. H., Østerhus, S., Johnson, C., Jónsson, S., and Valdimarsson, H.: Increased ocean heat transport into the Nordic Seas and Arctic Ocean over the period 1993–2016, Nat. Clim. Change, 11, 21–26, https://doi.org/10.1038/s41558-020-00941-3, 2021. a
Uotila, P., Goosse, H., Haines, K., Chevallier, M., Barthélemy, A., Bricaud, C., Carton, J., Fučkar, N., Garric, G., Iovino, D., Krauer, F., Korhinen, M., Lien, V. S., Marnela, M., Massonnet, F., Mignac, D., Peterson, K. A., Sadikni, R., Shi, L., Tietsche, S., Toyoda, T., Xie, J., and Zhang, Z.: An assessment of ten ocean reanalyses in the polar regions, Clim. Dynam., 52, 1613–1650, 2019. a
Wang, Q., Wang, X., Wekerle, C., Danilov, S., Jung, T., Koldunov, N., Lind, S., Sein, D., Shu, Q., and Sidorenko, D.: Ocean heat transport into the Barents Sea: Distinct controls on the upward trend and interannual variability, Geophys. Res. Lett., 46, 13180–13190, 2019. a
Woodgate, R. A. and Peralta-Ferriz, C.: Warming and Freshening of the Pacific Inflow to the Arctic from 1990–2019 implying dramatic shoaling in Pacific Winter Water ventilation of the Arctic water column, Geophys. Res. Lett., 48, e2021GL092528, https://doi.org/10.1029/2021GL092528, 2021. a
Woodgate, R. A., Weingartner, T., and Lindsay, R.: The 2007 Bering Strait oceanic heat flux and anomalous Arctic sea-ice retreat, Geophys. Res. Lett., 37, L01602, https://doi.org/10.1029/2009GL041621, 2010. a, b
Woodgate, R. A., Weingartner, T. J., and Lindsay, R.: Observed increases in Bering Strait oceanic fluxes from the Pacific to the Arctic from 2001 to 2011 and their impacts on the Arctic Ocean water column, Geophys. Res. Lett., 39, 24, https://doi.org/10.1029/2012GL054092, 2012. a
Yang, J.: The seasonal variability of the Arctic Ocean Ekman transport and its role in the mixed layer heat and salt fluxes, J. Climate, 19, 5366–5387, 2006. a
Zhang, J. and Rothrock, D. A.: Modeling global sea ice with a thickness and enthalpy distribution model in generalized curvilinear coordinates, Mon. Weather Rev., 131, 845–861, https://doi.org/10.1175/1520-0493(2003)131<0845:MGSIWA>2.0.CO;2, 2003. a
Zuo, H., Balmaseda, M. A., Tietsche, S., Mogensen, K., and Mayer, M.: The ECMWF operational ensemble reanalysis–analysis system for ocean and sea ice: a description of the system and assessment, Ocean Sci., 15, 779–808, https://doi.org/10.5194/os-15-779-2019, 2019. a, b